Article

Data-Driven ECG Denoising Techniques for Characterising Bipolar Lead Sets along the Left Arm in Wearable Long-Term Heart Rhythm Monitoring

by
Omar J. Escalona
1,*,
William D. Lynn
2,
Gilberto Perpiñan
3,
Louise McFrederick
1 and
David J. McEneaney
4
1
School of Engineering, Ulster University, Newtownabbey BT37 0QB, UK
2
Electronics Department, Northern Regional College, Coleraine BT52 1QA, UK
3
Electronics and Circuits Department, Universidad Simon Bolivar, Caracas 89000, Venezuela
4
Craigavon Area Hospital—SHSCT, Craigavon BT63 5QQ, UK
*
Author to whom correspondence should be addressed.
Electronics 2017, 6(4), 84; https://doi.org/10.3390/electronics6040084
Submission received: 1 September 2017 / Revised: 1 October 2017 / Accepted: 11 October 2017 / Published: 15 October 2017

Abstract

:
Abnormal heart rhythms (arrhythmias) are a major cause of cardiovascular disease and death in Europe. Sudden cardiac death accounts for 50% of cardiac mortality in developed countries; ventricular tachycardia or ventricular fibrillation is the most common underlying arrhythmia. In the ambulatory population, atrial fibrillation is the most common arrhythmia and is associated with an increased risk of stroke and heart failure, particularly in an aging population. Early detection of arrhythmias allows appropriate intervention, reducing disability and death. However, in the early stages of disease arrhythmias may be transient, lasting only a few seconds, and are thus difficult to detect. This work addresses the problem of extracting the far-field heart electrogram signal from noise components, as recorded in bipolar leads along the left arm, using a data driven ECG (electrocardiogram) denoising algorithm based on ensemble empirical mode decomposition (EEMD) methods to enable continuous non-invasive monitoring of heart rhythm for long periods of time using a wrist or arm wearable device with advanced biopotential sensors. Performance assessment against a control denoising method of signal averaging (SA) was implemented in a pilot study with 34 clinical cases. EEMD was found to be a reliable, low latency, data-driven denoising technique with respect to the control SA method, achieving signal-to-noise ratio (SNR) enhancement to a standard closer to the SA control method, particularly on the upper arm-ECG bipolar leads. Furthermore, the SNR performance of the EEMD was improved when assisted with an FFT (fast Fourier transform ) thresholding algorithm (EEMD-fft).

1. Introduction

Cardiovascular disease remains globally the commonest cause of death both in developing and developed nations. Sudden death, usually caused by lethal arrhythmias, usually ventricular tachycardia or fibrillation, account for 50% of these deaths [1]. Without immediate defibrillation, mortality from sudden death increases by 10% per minute. Only 10% survive to be discharged from hospital. In those cases where defibrillation occurs within 5–7 min survival increases to around 30%. However most cardiac arrests are unwitnessed. A wrist-based monitor to detect ventricular arrhythmia with the activation of a layperson or first responder network to deliver prompt defibrillation would permit early defibrillation and improve survival from out-of-hospital cardiac arrest.
Furthermore, patients with palpitations or loss of consciousness (syncope) account for a large proportion of attendances at hospital outpatients and emergency rooms [2]. Many of these patients have transient abnormalities in heart rate or rhythm, which have prognostic significance in the early detection and diagnosis of heart disease. As there are many different cardiac dysrhythmias, accurate detection and recording is essential and thus, continuous monitoring of the patients’ heart rhythm is required for periods lasting from several days, up to a number of months. Portable heart rhythm monitors detect and record electrical signals generated by the heart from the body surface. In the usual method of recording, two or more self-adhesive electrodes are applied to the body surface (usually on the chest wall) and via signal amplification and filtering an electrical signal from the heart is reconstructed (the electrocardiogram, ECG). However, interference from other bioelectrical activity in the body, particularly artefacts from random muscle activity may render recording of the ECG difficult. In general, the strength of the ECG signal detectable at the body surface will depend on the distance between the electrodes and their positions relative to the heart. Electrodes are thus usually placed on several standarised locations on the the chest wall or on both arms to maximise the signal quality. Nevertheless, these electrode positions are unsuitable for very long term recording (>36 h), due to their interference with the patient’s usual day-to-day activities and the need of reliable, long-term adhesion which tends to cause irritation to the patient’s skin after only a few days. Placement of standard electrodes remote from the above positions, but which would be more convenient/comfortable to the patient, as in a wrist based monitor, will result in an apparently undetectable ECG signal due to the smaller cardiac electrical signal in those distant locations which is obscured by muscle artefact [3].
Lynn et al., concluded, by analysis of the data from a clinical study, that a significant reduction in ECG signal amplitude occurred on the right arm [4], an opinion supported by Hung-Chi Yang et al. [5]. This data-supported evidence has guided all attempts at a successful arm-worn device with all recordings made on the left limb. Yang’s group developed a flexible foil electrode that can be conveniently wrapped around a limb and will facilitate the recording of ECG information. They successfully extracted QRS complex information from the upper left arm (bicep region) and the forearm (elbow position). However, attempts to recover an ECG signal from the wrist were unsuccessful. Yang has declared that the ECG signal at the wrist is “very weak” and is easily disrupted by electromyographic (EMG) noise. It is also notable that the signal processing used during his study was simplistic, consisting of bandwidth narrowing to remove power line and EMG noise. Yang’s chosen noise mitigation technique will have suppressed desired signal information ratiometrically with the noise component, as the frequency content of the desired signal and the unwanted noise component are overlapped.
The electrical noise issue is particularly evident in dry electrode systems due to the creation of tribological noise at the interface of the electrode with the subject’s skin. The rubbing effect is reduced with the introduction of a conductive gel. Some work has been carried out by Li-Sheng Shu et al., (2015) on a method of anchoring dry electrodes using micro-tipped silicon arrays [6]. The arrays are manufactured using a chemical etching process that produces a microtip length of approximately 155 μm. This is not sufficiently long so as to stimulate nerve endings within the skin and is therefore painless to wear. The arrays were tested using a commercially available adhesive mount, typically used with standard ECG electrodes. The microtip structure would also lend itself to mechanical fixing using a pressure strap rather than an adhesive. Chen et al., concluded that motion artefact is markedly reduced using a microtip electrode in comparison with a wet gel system [7]. Shu’s team concluded that the array could be manufactured using a low-cost photolithographic and chemical etch process and demonstrated signal recovery performance comparable with a standard gel electrode. As yet there have been no very long-term studies as to the viability of the technology for use in extended period ECG monitoring. However, Kim et al., have alluded toward the suitability of micro-needle arrays (MNA) for long ECG monitoring and have completed a short 8 h comparative study [8]. The MNA was compared with a dry electrode and an industry standard electrode in a baseline drift observation. The conclusion shows a stability advantage for the MNA technology which may extend linearly.
In summary, noise problems in a recorded ECG signal fall into two main types—conducted and radiated. Conducted noise is that which is unavoidably present in the final signal. An example of this would be electromyographic disturbances or a mains signal fed in by a power supply. This type of noise can often be removed by signal averaging or bandwidth narrowing. Radiated noise is that which is propagated through the environment and electromagnetically coupled onto the bioamplifier high impedance input. Radio interference and mains (50 Hz/60 Hz) interference are examples of this. Radiated noise is often a function of the physical layout of the system. Careful positioning of wires, electrodes and power cables can, along with filtering, reduce the effect.
The aim of this work is to develop a smart ECG denoising technique which would be feasible to implement on wearable device technology, enabling the capture of a clinical quality ECG signal from bipolar leads on the left arm. The denoised signal could then be post-processed using contemporary rhythm and pattern recognition algorithms to diagnose and report arrhythmias. The problem of extracting the arm bipolar lead heart electrogram (EGM) signal from noise components will be addressed using a data-driven and low latency denoising algorithm developed during the course of this research. The technologies will be backward compatible with existing e-health information systems, as well as looking forward to emerging technologies such as the internet of things (IoT). The overarching impetus driving this work is the need for early intervention in an attempt to reduce healthcare costs, improve diagnostic efficiency and culminate in an increase in the quality of life [9].

2. Materials

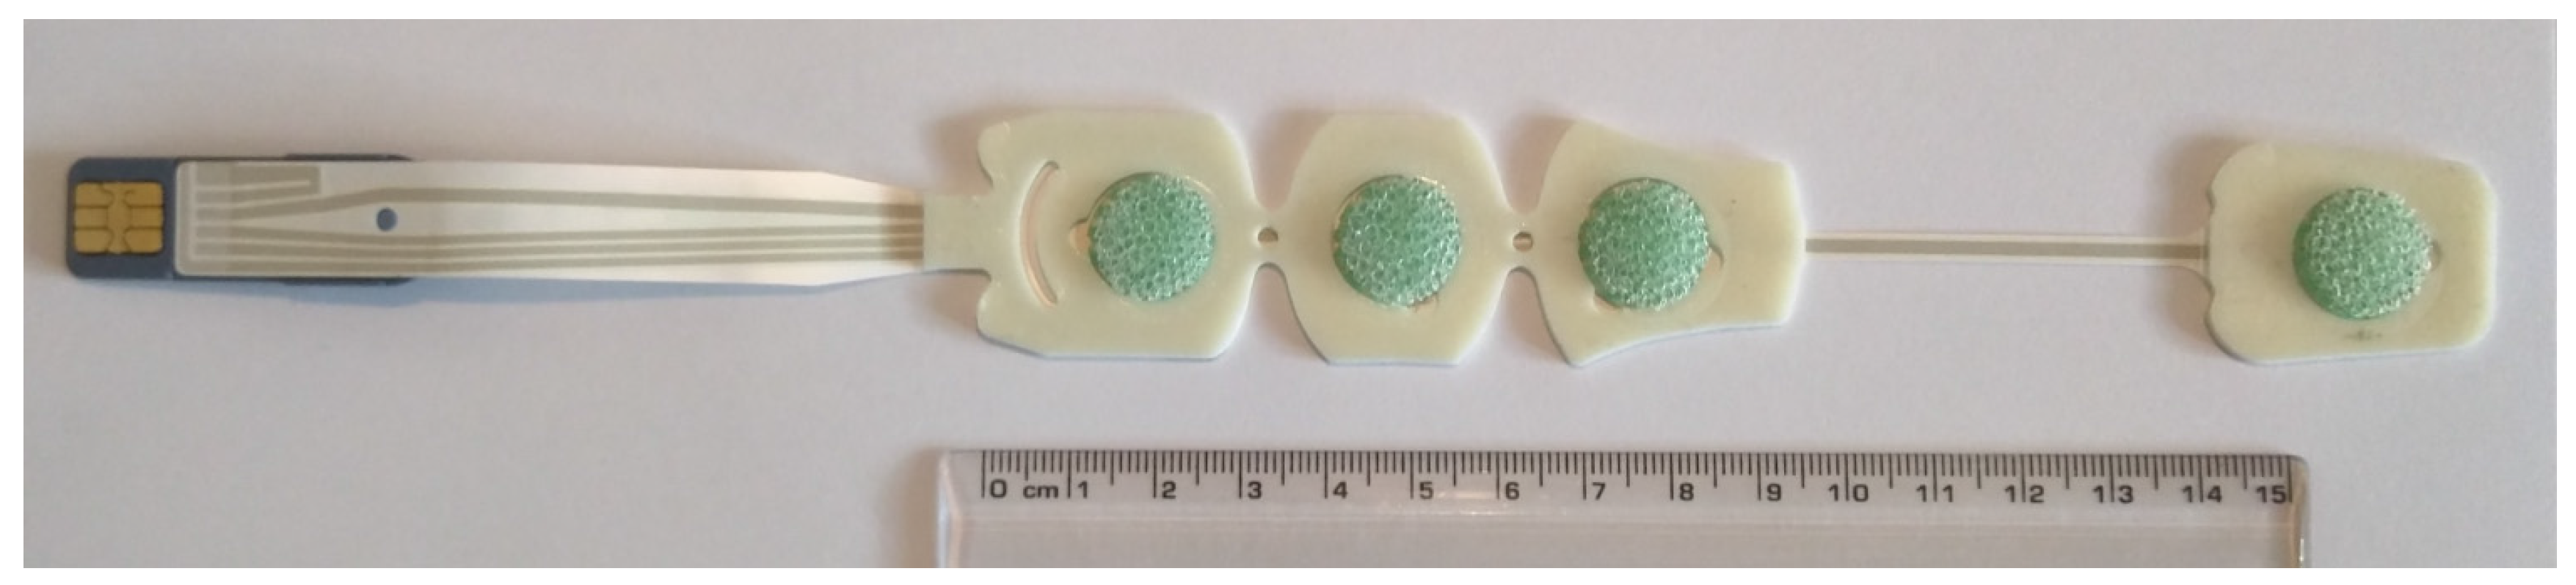
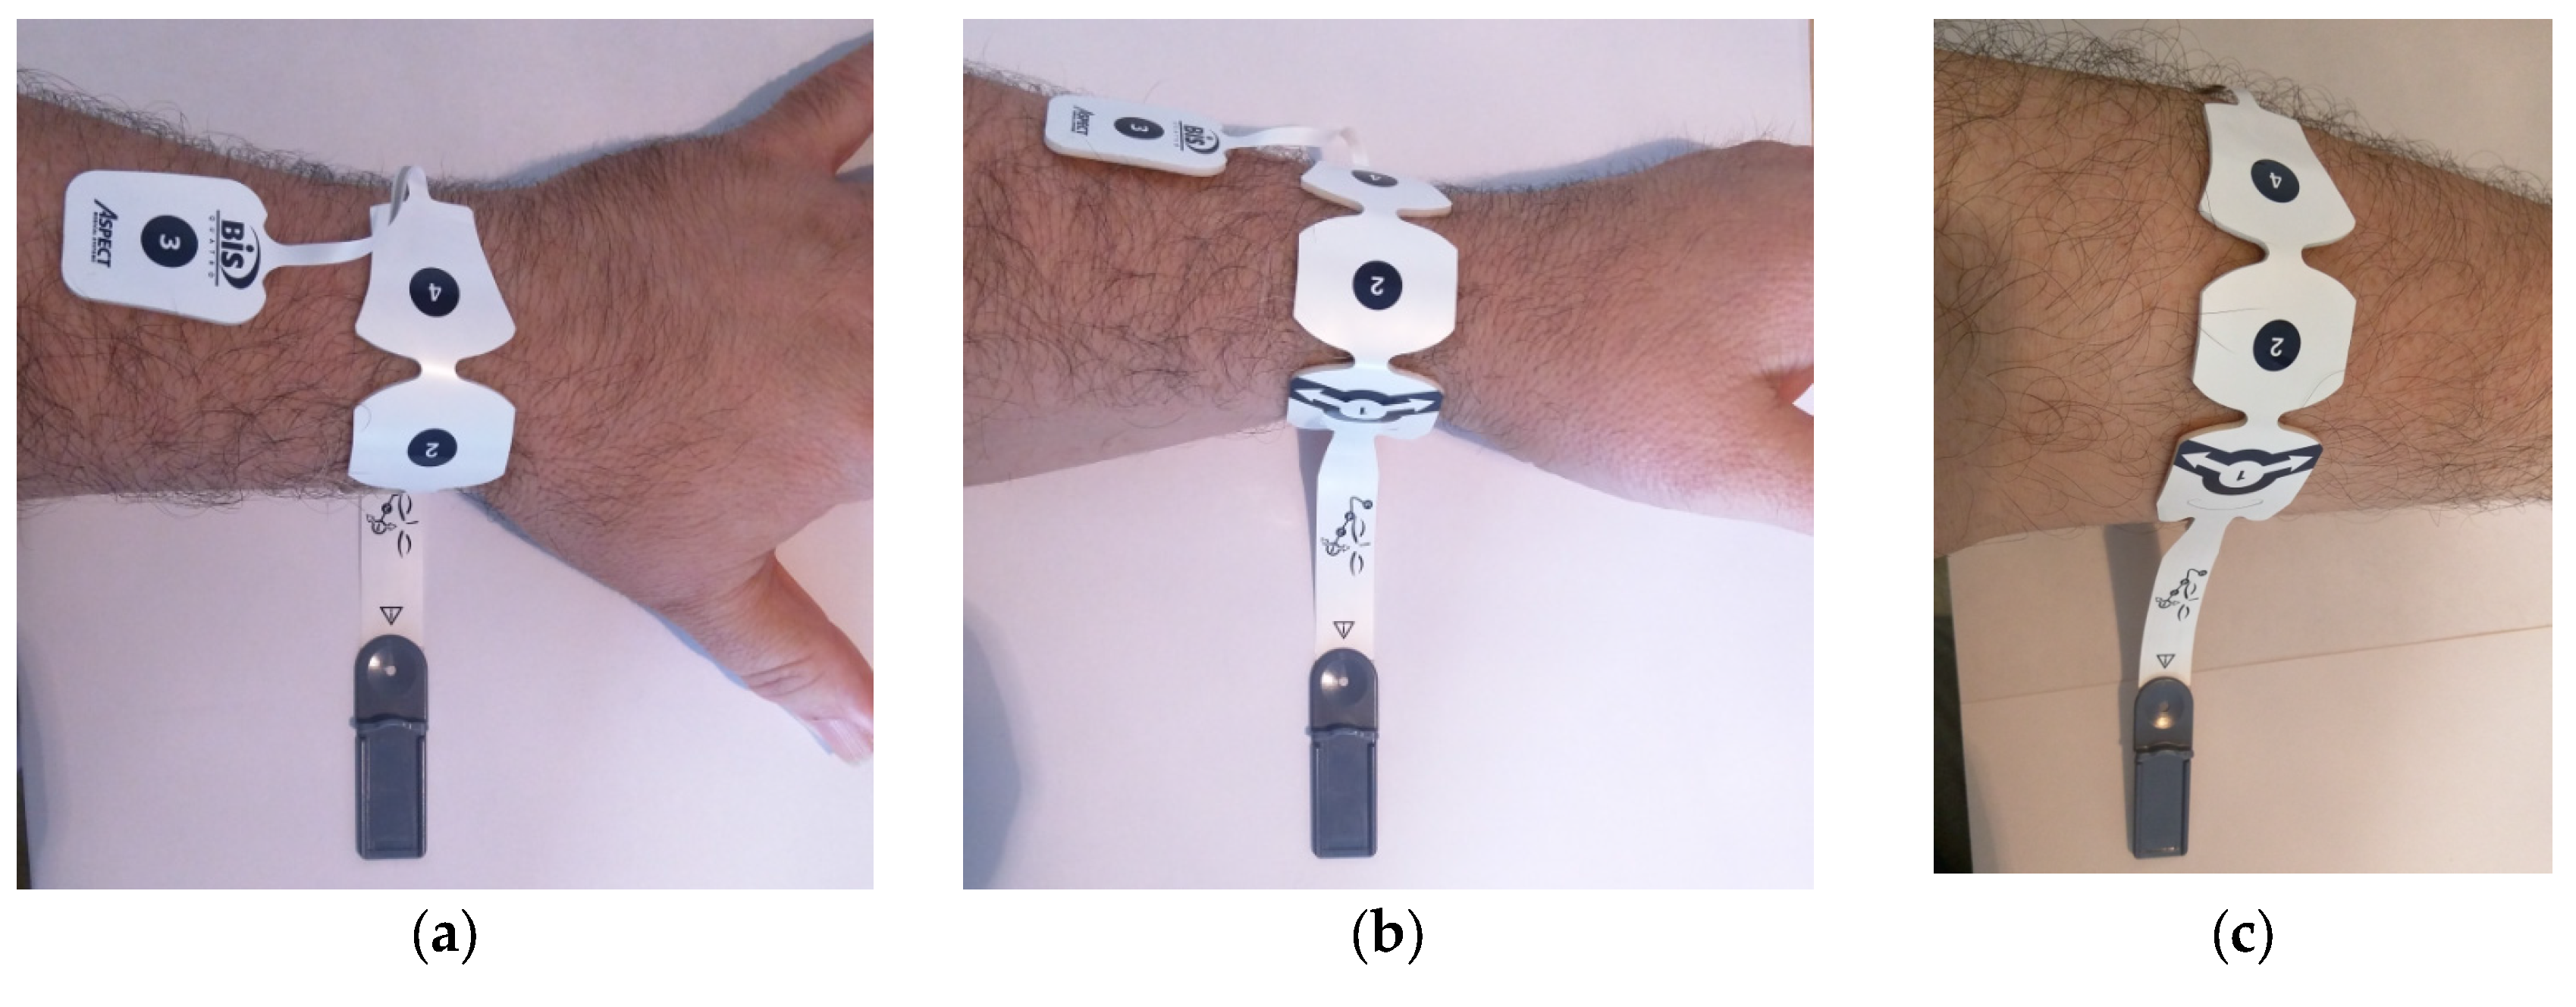
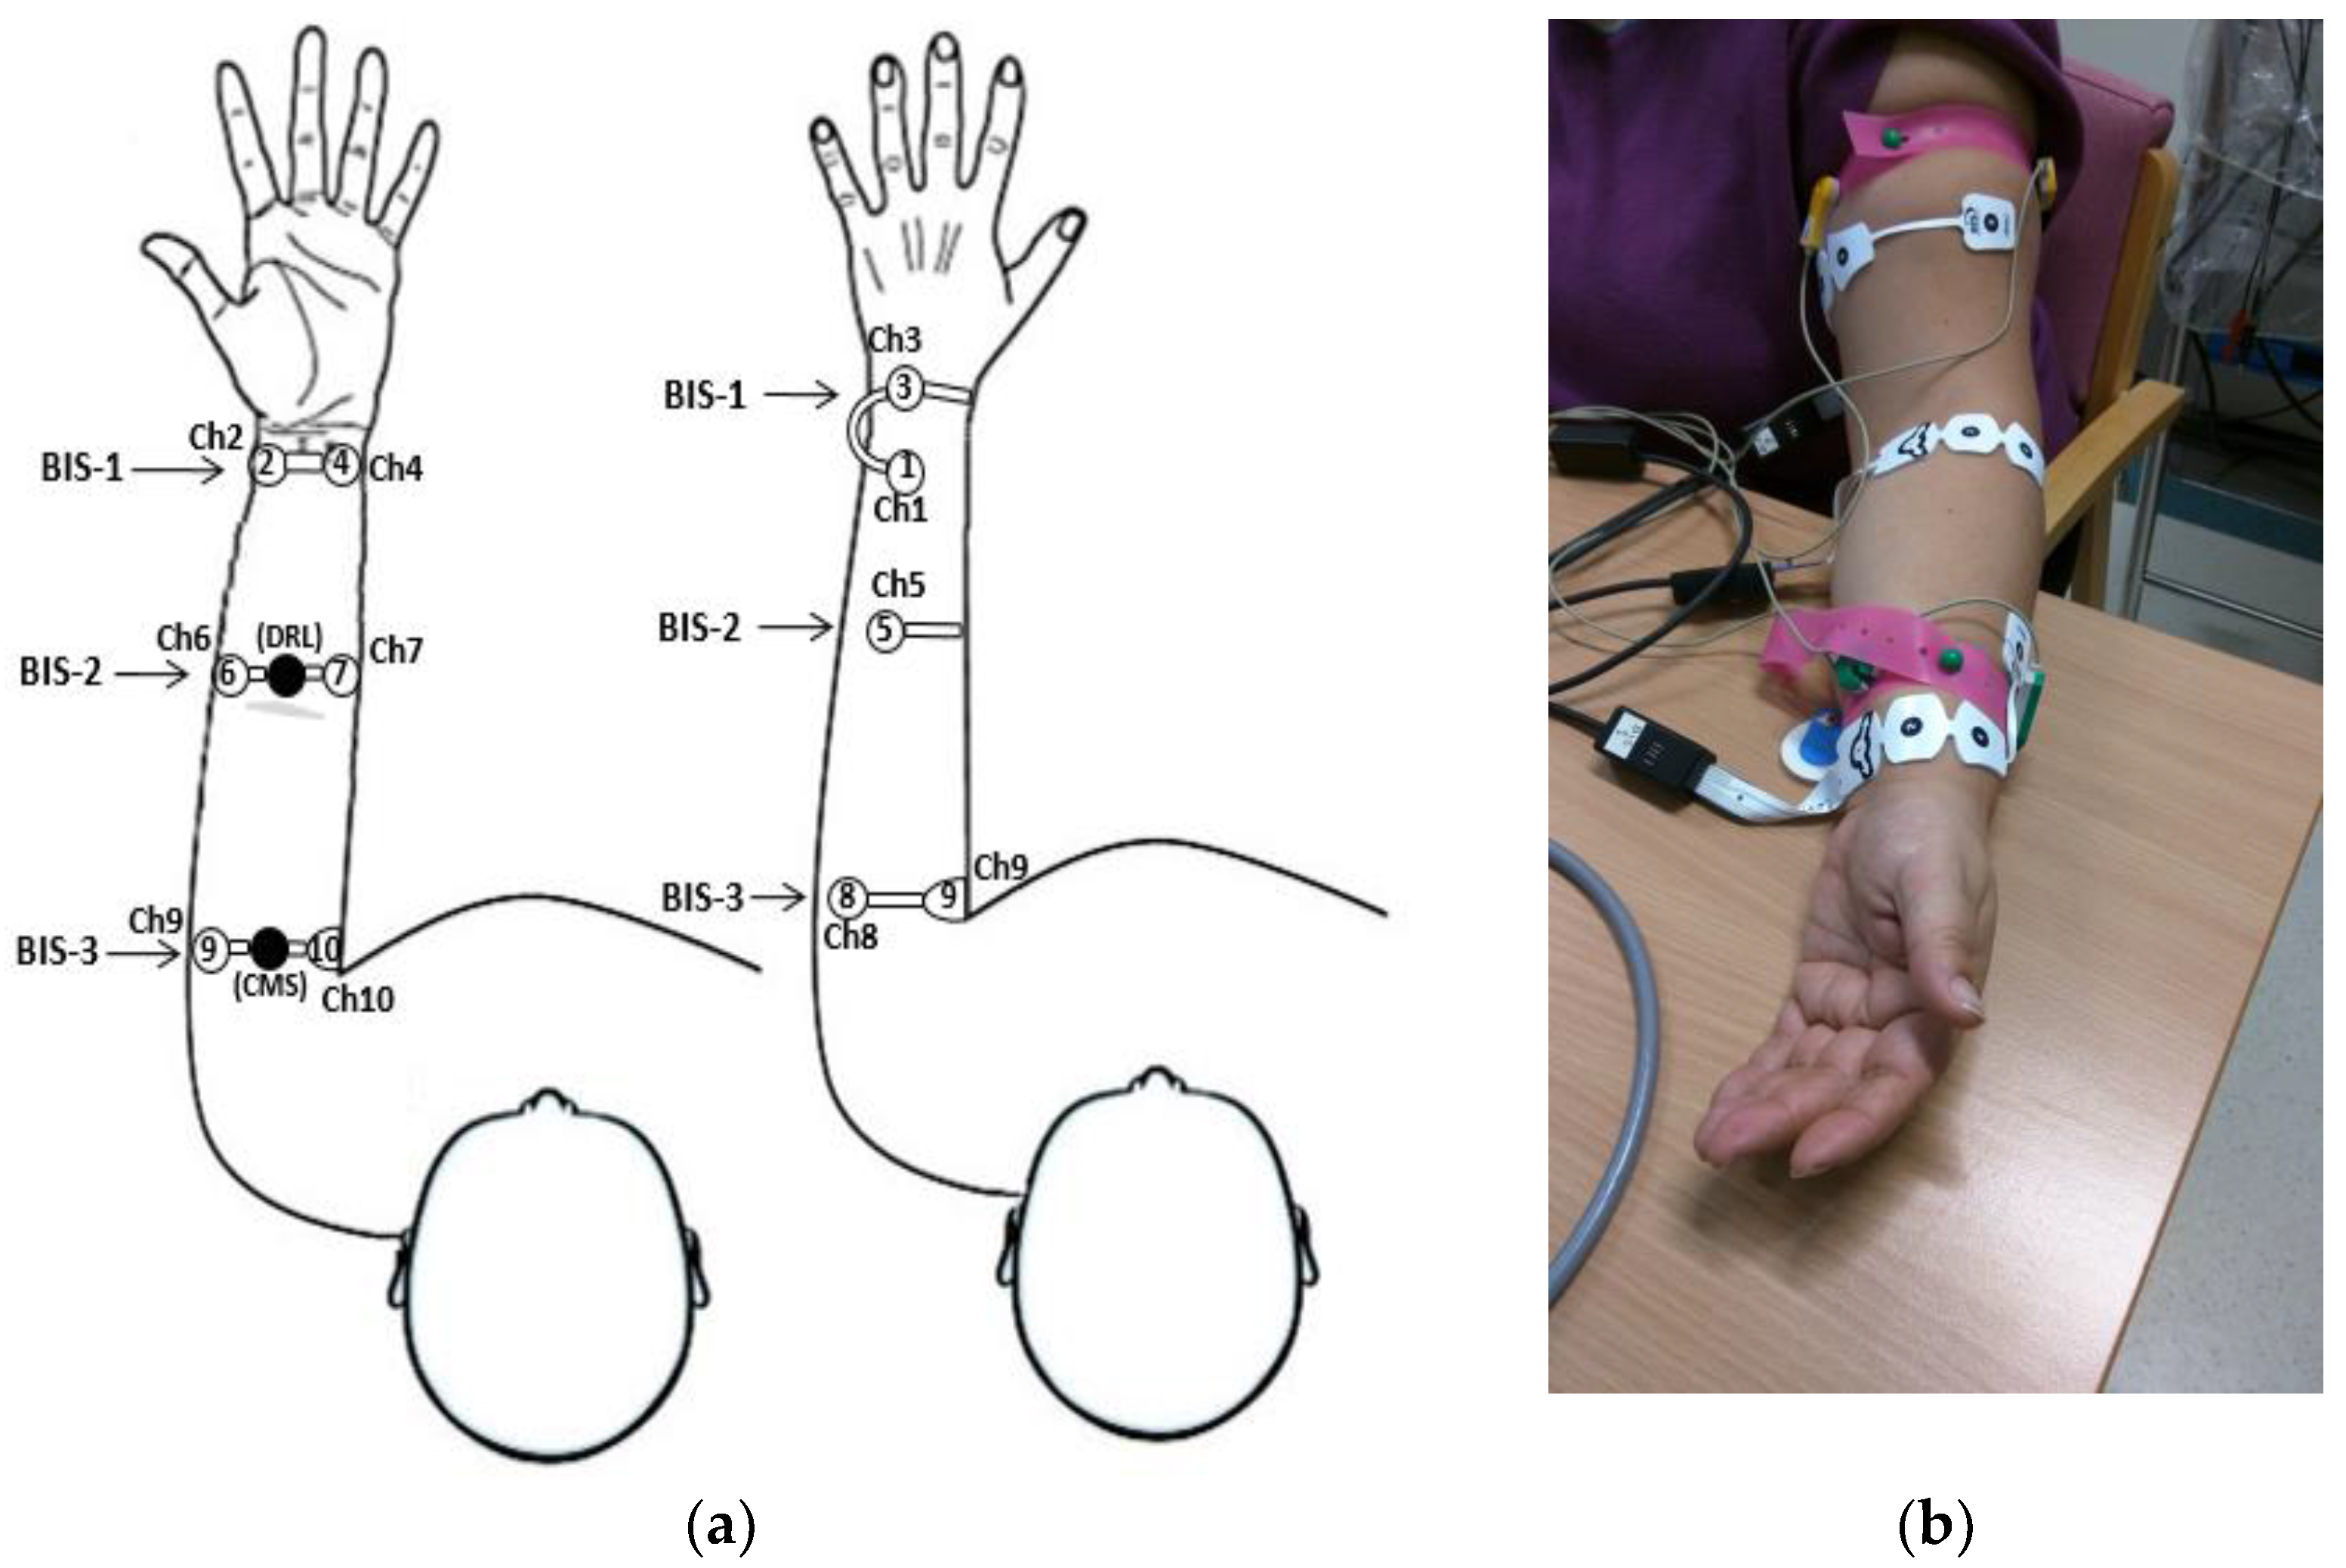
2.1. Electrode System and Disposition

The presence of a cardiac electrogram signal at a bipolar distal sensor along the left arm is not in question. However, the ability to recover a useable signal, that is, a heart generated electrogram signal with tolerable noise content, will depend on three major factors in the electrocardiographic (ECG) recording process. Firstly, stable body-surface electrode performance, with regard to the skin–electrode interface-related noise generation and impedance characteristics [10]. Secondly, a high quality, low noise front-end amplifier and data acquisition system, with sufficient sensitivity so as to resolve the small signals involved [11]. And finally, a robust post processing algorithm, capable of extracting the required signal without altering its morphology [12].
A medical grade high-performance dry sensor technology useful for long term arm wearable ECG monitoring bands is currently undergoing development by many research laboratories. To gather a clinical database of left-arm ECGs under ethical approval, a sensor system with known high performance on the skin–electrode interface impedance (better than available dry-electrodes) [10] and good potential stability (low noise generation), the BIS-QuatroTM (four-electrode) sensor (Covidien, Mansfield, MA, USA), as used for the BISTM brain monitoring system (Electroencephalogram signals), was selected for the purpose of this study on the proposed arm-ECG signal denoising algorithm. The selected BIS-QuatroTM sensor system provides four pre-gelled independent sensors along an adhesive band 18 cm long (see Figure 1). The sensor band can be easily strapped around the wrist, the forearm and on the upper arm (see Figure 2). Furthermore, the BIS-QuatroTM sensor system offered fast, reliable connectivity, good adhesion and an offset connection terminal to add strain relief.

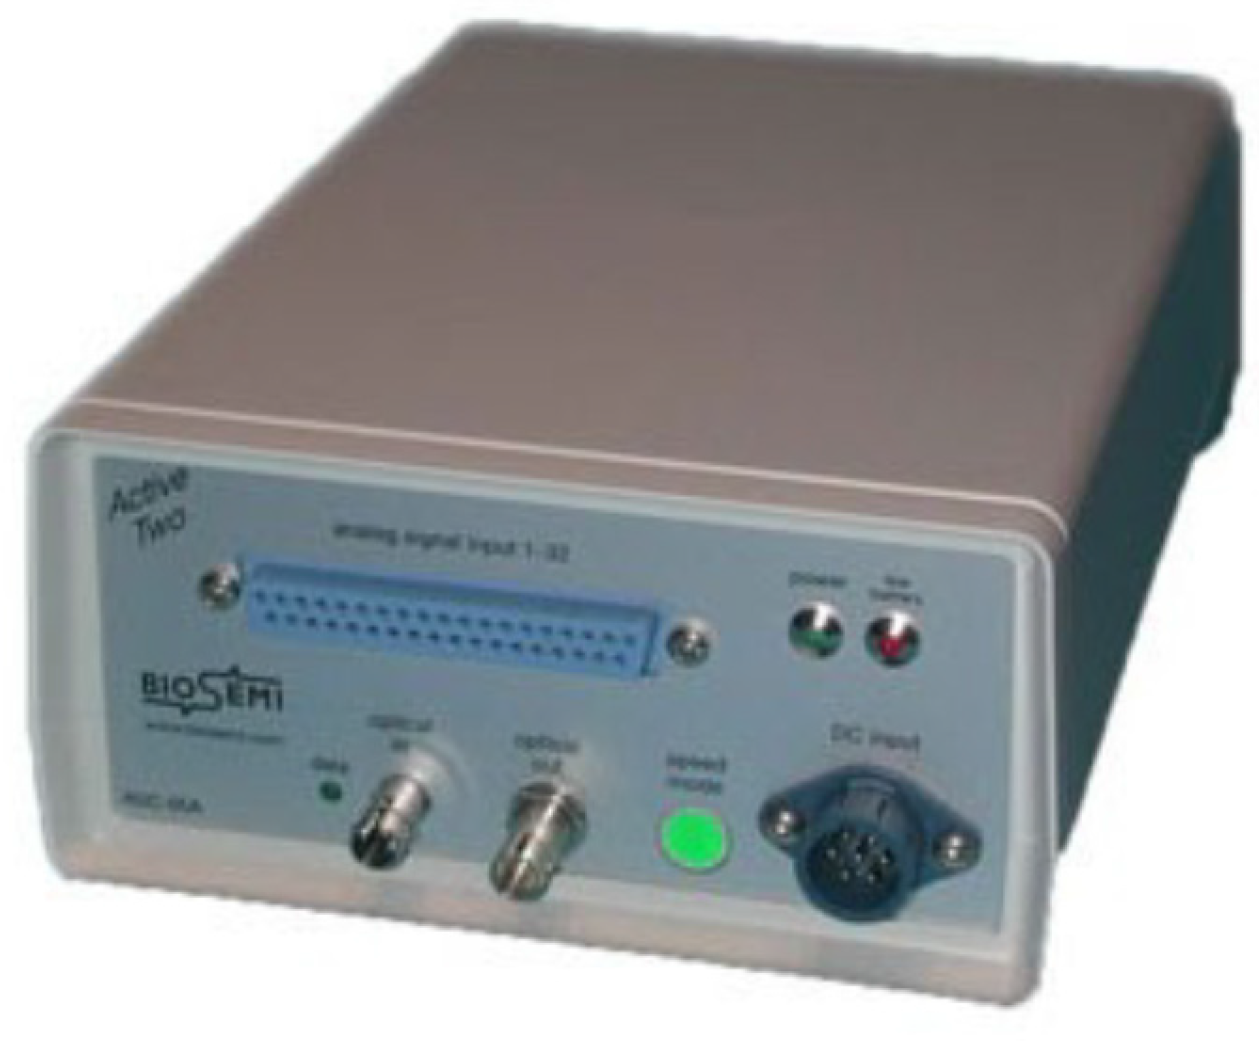
2.2. Bioamplifiers, Data Acquisition System and Protocol

For the bipolar arm-ECG clinical database gathering task, a BioSemi Active 2 (BioSemi B.V., Amsterdam, Netherlands) multichannel, biopotential research data acquisition system was factory configured for the ECG diagnostic bandwidth recording. The system had an analogue input capacity of 32 unipolar channels, with a dynamic analogue input range of +/−260 mV, and with a 24-bit resolution (least significant bit (LSB) = 30.99 nV).
LSB = (0.26V × 2)/(224) = 30.99 × 10⁻⁹ V
The sampling frequency was set at 2048 Hz, and each left-arm ECG recording duration was at least 500 s. The “minimum resolvable signal” concept must be considered when the LSB value is larger than the total peak-to-peak noise level (background EMG + electrode + amplifier noise). In this case, the analog-to-digital converter (ADC) is only able to capture signals larger than the LSB value. However, when one or more LSBs are smaller than the noise, these LSBs will constantly toggle—these bits are said to be ‘dithered’—in this case the capturing of small signals becomes a purely statistical effect, meaning there is not any principal lower limit for the smallest measurable signal. The system resolution is entirely determined by practical limits.
The Biosemi Actiview laptop/PC-based user interface, provides the user access to interface settings that allow fine tuning of the recorded data. It produces a bespoke binary file type; Biosemi Data Format (BDF) and 24-bit extended from the European Data Format (EDF) standard. BDF data files require some minor conversion prior to post-processing with software such as Matlab or Excel. The EDF Browser software (V.1.48, Free Software Foundation, Inc, Boston, MA, USA, 2017) was used to interim post-process Actiview BDF files. Final analysis of the data presented herein was extracted and imported directly into Matlab using a Matlab software (R2017a, Matlab, Natick, MA, USA, 2017) script. The BioSemi Active 2 data acquisition system uses ADC per channel, so each sample is temporally aligned. The BioSemi Active 2 system (Figure 3) has a 110 dB channel separation.
In order to provide the database for a pilot evidence-based performance assessment of the proposed bipolar arm-ECG denoising techniques, including the ECG signal-averaging (SA) control method, a small database of multichannel left arm-ECG surface potential maps was gathered from several healthy subjects and from cardiology outpatient clinics at the Craigavon Area Hospital in Portadown city (Portadown city, Northern Ireland); ethical approval HSC REC B (Health and Social Care, Research Ethical Committee, reference: 16/NI/0158), and IRAS (Integrated Research Application System, registered project ID: 203125, dated: 21/September/2016). There, the stated exclusion criteria was patients with atrial fibrillation (AF), or presenting frequent ectopy or other arrhythmia on baseline.
The main outcome measure was the reliable recording of cardiac electrical activity on the left-arm, from bipolar leads oriented either transversally to the arm axis (with the dipole axis perpendicular to the arm axis), or oriented axially along the arm (dipole axis parallel to the arm axis). The challenge lies in extracting an accurate electrocardiogram from selected bipolar arm-ECG leads from pairs of electrodes placed remotely from the heart (far-field ECG). To this end we have proposed to employ advanced signal processing and data-driven denoising techniques to extract the ventricular activity (QRS complex, ST segment and T wave), as well as the atrial activity (P wave and PQ segment), in selected arm-ECG bipolar leads.
For each recorded subject, signal-to-noise ratio (SNR) measurements from each of the selected arm bipolar leads, after the application of a data-driven signal denoising process, will be compared with SNR measurements obtained after applying the SA denoising control technique on corresponding arm bipolar leads. An accurate timing reference point for ventricular depolarization will be simultaneously recorded from the standard chest Lead I. Thus, the results of the data analysis will enable a hierarchical stratification from best to worst far-field left-arm bipolar lead location to be established against a particular data-driven denoising technique.
Subjects were recruited from medical staff and patients attending cardiology outpatient clinics at Craigavon Hospital. An information sheet was provided to each patient clearly explaining the purpose of the study and the recording process, and a consent form was facilitated. The main exclusion criterion was atrial fibrillation or frequent ventricular ectopy in surface ECG. The following data recordings were part of the clinical database gathering protocol: (i) 12-lead ECG baseline recording, prior to experimental left-arm surface potential mapping. Following the 12-lead ECG, the exclusion criteria was applied. (ii) Immediately after the ECG baseline recording procedure and the inclusion criteria being satisfied. (iii) The following signals were recorded simultaneously: standard unipolar chest ECG leads (RA (right arm), LA (left arm), LL (left leg) and V1) and 10 unipolar left-arm potential mapping signals; from which a set of seven arm bipolar leads were derived. Thus, in each subject, a total of 14 unipolar channels were recorded simultaneously during 12 min. For the left-arm unipolar potential mapping signals, the BioSemi Active 2 analogue input terminals channels one to 10 were hard wired and shielded together through a separate cable to three BISTM sensor bands on the arm (Figure 4). To reduce the effects of crosstalk, the strong chest wall unipolar leads (RA, LA, LL and V1), were cabled to four analogue inputs (namely, Ch.16 to Ch.19).

3. Methods

3.1. Selected Arm-ECG Bipolar Leads

The BioSemi Active 2 system’s CMS (common reference electrode) terminal was positioned in the upper arm, in the BIS-3 sensor, between the electrodes for Ch.9 and Ch.10, and the DRL (driven right leg) terminal positioned in the forearm, in the BIS-2 sensor, between the electrodes for Ch.6 and Ch.7; see Figure 4.
Seven representative anatomical arm areas and orientations (transversal or axial) were selected, and a corresponding bipolar arm lead was defined as described in Table 1.

3.2. Raw Data Pre-Processing

The raw digital signal acquired by the BioSemi Active 2 system preserves significant DC offset and signal baseline wander, as well as some 50 Hz mains interference pickup, arm muscular electromyographic (EMG) noise and arm movement sensor artifact noise. Therefore, before any denoising technique is applied, for every case, the raw ECG data files were first imported into the Matlab environment (MATLAB version 9.2, release R2017) and a pre-filtering stage was performed; which consisted of a high-pass, fourth order, Butterworth filter at 0.2 Hz cutoff frequency, followed by a low-pass, fourth order, Butterworth filter at 40 Hz cutoff frequency, and by a 50 Hz notch-filter (4th order, Butterworth and of 4 Hz bandwidth).

3.3. Denoising Control Method: Signal Averaged ECG (SA-ECG)

In order to extract a gold standard model of the possible ECG waveform of every bipolar lead along the left-arm in each subject case, a conventional clinically-adopted ECG denoising process by signal averaging was implemented as in previous works [13,14]. In this study, the particular SA-ECG denoising technique was not a data-driven type, unlike the current EMD (empirical mode decomposition)-based method. The implemented SA technique uses Lead I or any of the other simultaneously recorded standard limb leads: Lead II, Lead III and the precordial lead V1, for extracting the accurate, time-deterministic point associated with the heart ventricular depolarization event during normal sinus rhythm, by means of the single fiducial point (SFP) heart beat alignment technique on the ECG Lead I signal [15], as explained in the following section.

3.3.1. Reference Ventricular Activity Timing Series

The most widely accepted method for beat alignment in high resolution ECGs is the temporal cross-correlation method, where each incoming beat is matched to a template beat, hence, this beat alignment technique is also named maximum coherence matching (MCM). The technique works well for low noise situations, however, in high noise applications such as the proposed monitor, the technique does not produce a precise fiducial mark and alignment jitter is increased [16]. An alternative technique [17], effectively used in high resolution ECG studies, is in the form of single fiducial point (SFP) alignment. SFP alignment uses the zero-crossing point after R wave detection on a band-pass filtered (3 Hz–30 Hz, second order, Butterworth) ECG signal. The literature suggests that the SFP technique is comparable and, in some cases better than the more conventional MCM techniques. The benefit of the single point technique is its simplicity, accuracy and noise immunity, making it easy to implement on a microprocessor or in analogue hardware [14].

3.3.2. The ECG Signal-Averaging Process on Arm Bipolar Leads

SA denoising of an ECG is best applied where long latency is acceptable. The technique requires extracting a fiducial or datum point to be identified in the band-pass pre-filtered ECG signal (0.5–40 Hz, typically), with relatively large R-wave amplitude with respect to the unwanted background noise. For this requirement, the standard ECG limb leads and precordial lead V1 were also included in the clinical ECG database gathering, simultaneously recorded with the left-arm bipolar leads. In this study, chest Lead I was selected for deriving the accurate SFP time-series of ventricular depolarisation events in each clinical case. The SFP extracted time-series was then used to ensemble average a 700 ms signal window, centred around every time element of the SFP time-series (from 400 ms before the SFP and 300 ms after the SFP), for every arm-ECG bipolar lead signal. Thus, in all arm-ECG bipolar leads (set of seven bipolar leads), consecutively aligned ventricular depolarization events, around 400 heart beats or more were included in the SA denoising process in each subject case. Nevertheless, the basic SA rule applied—the noise signals must be non-coherent for successful SA denoising to take place. Power line interference (50 Hz) and electromyographic noise sources, through their repetitive nature, often confound this technique.

3.3.3. Denoising Performance Metrics

For each case, the following process was followed to measure the signal-to-noise ratio metric used to quantify the output of the filtering algorithms during the course of this research.
Two areas on the recovered ECG were identified, see Figure 5, for signal-to-noise comparison. The QRS complex is the area of most significant magnitude; it also contains the greatest spectral content of the ECG waveform, making it the most likely signal component to propagate and remain intact in the far field regions.
The comparison point chosen was the iso-voltaic region between the T wave and the P wave. This region is devoid of cardiac electrical activity and, as such, any quantity measured in this area was considered to be noise. Due to the disrupted nature of the signals to which the SNR measurement was applied, P or T wave detection was not always possible. Therefore, for the purposes of this study, a fixed time interval of 250 ms was used to locate the 40 ms noise window in relation to the R peak.
Temporal dispersion was used, where the standard deviation of the signal data within the defined window was divided by the standard deviation of the noise data in order to calculate the SNR.
S N R = σ s i g n a l σ n o i s e

3.4. Empirical Mode Decomposition (EMD)

3.4.1. Implementation Criteria

The use of EMD has contributed major advances in many applications from weather mapping and seismology, to filtering biologically-sourced signals. Generally, the overall result of the decomposition is to successively remove the highest frequencies from a signal x(t). The overall result is to create a bank of sub signals, described as intrinsic mode functions (IMF), whose sum produces the original signal. Signal filtering is achieved by manipulation of the IMFs either by post-processing with a technique such as FFT or wavelet, or partial reconstruction. However, the EMD’s ability to handle some signal-processing problems is still imperfect. Rilling and Flandrin [18,19] stated that the EMD decomposition capacity depends on the frequencies and amplitudes, and the differences in both frequencies and amplitudes of two signals. If the criteria for the differences between the two signals are not met, the sifting process derives an IMF with a single tone modulated in amplitude. This phenomenon is called the beat effect, or, more commonly, mode mixing [20].

3.4.2. EMD Implementation Process (Algorithm)

All processed IMFs were statistically independent and each represents a unique range of energy and frequency. The sum of all IMFs is equal to the original data x ( t ) .
x ( t ) =   j = 1 n h j +   r n
When using EMD for signal decomposition, the input signal must satisfy the following three conditions:
  • The signal has at least two extrema; one is the maximum and the other the minimum.
  • The time-period scale is defined by the time lapse between the two extrema.
  • If the data have no extrema, only the inflection point is recorded, and the extrema can then be estimated by differentiation.
The IMF is considered valid if it meets the following conditions: The number of IMF extrema (the sum of the maxima and minima) and the number of zero-crossings must either be equal or differ at most by one; and, at any point of an IMF the mean value of the envelope, defined by the local maxima, and the envelope, defined by the local minima, must be zero.
Finally, the results can be calculated by integration of these components. The algorithm is summarised as follows:
(1)
Identify all extrema of x(t).
(2)
Using a cubic spline, interpolate between minima and maxima with envelopes e m i n (t) and e m a x (t).
(3)
Compute the mean envelope, m k ( t ) =   ( e m a x ( t ) +   e m i n ( t ) ) 2 , where k is the iteration number.
(4)
Extract the detail h j ( t ) = x ( t )   m k ( t ) .
(5)
Repeat (1)–(4) until h j (t) meets the definition of an IMF, and the IMF converges.
(6)
Repeat (1)–(5) to generate a residual r n (t), r n (t) = x(t) − h n (t).
The procedure has been further developed by adding a sifting process which repeats steps (1)–(4) on the signal r(t) until it can be considered as having zero-mean, as per the stopping criteria. Once this is achieved, the result is considered to be the IMF. Once achieved, step (6) is applied to generate the residual r n (t).
To ensure that the EMD process generates IMFs correctly, Huang et al. [21] proposed a stopping criterion in the sifting process. The criterion can be implemented by limiting the size of the standard deviation (SD) by sifting the results as defined below:
S D =   t = 0 T [ | h ( j 1 ) ( t )   h j ( t ) | 2 h ( j 1 ) 2 ( t ) ]
A value of 0.2 for SD was used as the stopping criteria for the IMF sifting process. This SD value is the minimum value within the recommended range proposed by Huang [21], between 0.2 and 0.3. The lower end value 0.2 was used for the SD, in order to ensure the best quality of the algorithm output. Thus, when the calculated SD is below 0.2, the process is stopped.

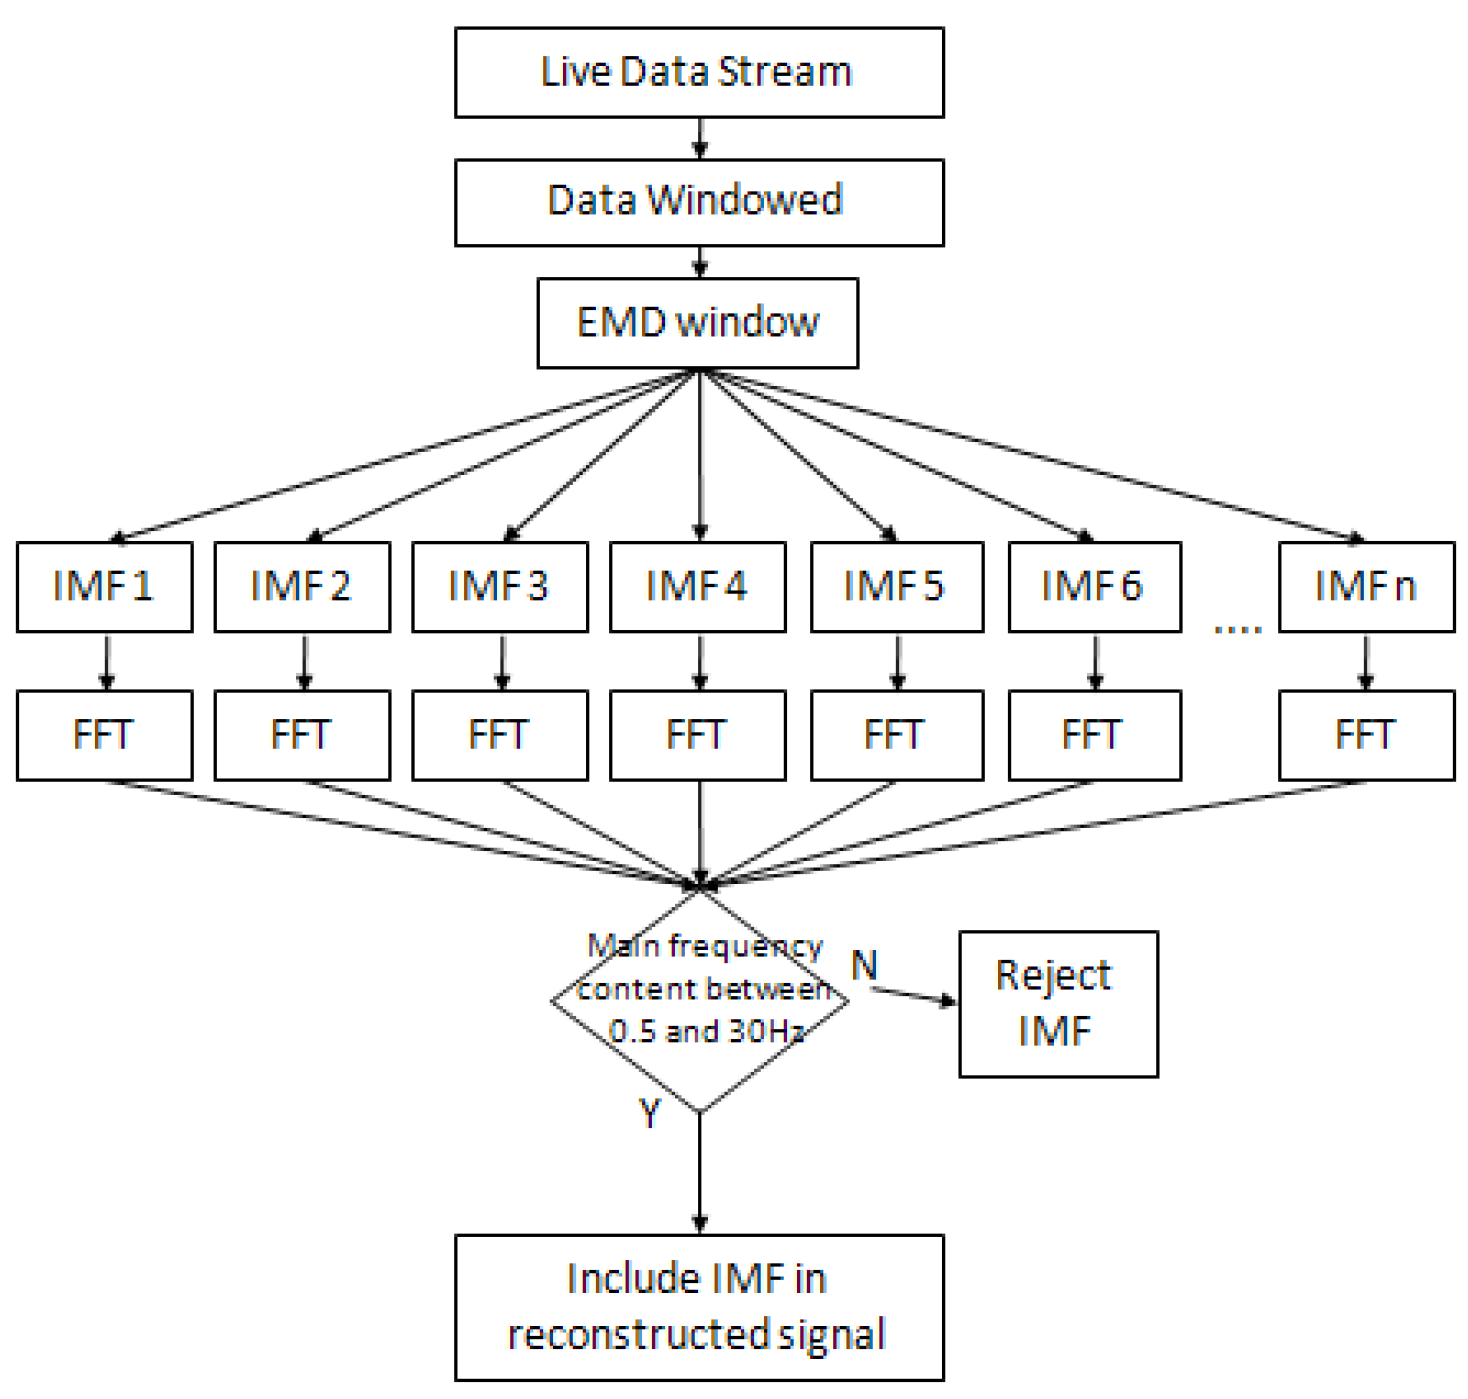
3.5. Ensembled EMD (EEMD)

3.5.1. Implementation Criteria

To overcome the problem of mode mixing observed when using the EMD process, Wu and Huang [22] proposed a further advancement, the ensemble empirical mode decomposition (EEMD). A uniform distribution of white noise, w i ( t ) , is added to x ( t ) before decomposition to reduce the effect of the mode mixing in the EMD process [23]. As a result, the EEMD method is capable of resolving the issues of mode mixing [20].

3.5.2. FFT Thresholding Technique

In application, signal filtering using the EMD or EEMD processes poses a dynamic problem. The changing nature of the biological signals means that the information contained in each IMF will change with time. The number of IMFs generated by the sifting process will also change dependent on the complexity of x ( t ) , hence a simple fixed approach to the partial reconstruction process is not optimal in all cases. The inclusion of the FFT, or a similar frequency based technique, allows for dynamic tracking of the frequency content of each IMF in real-time, the net result being an adaptive EEMD, partial reconstruction filter (see process structure in Figure 6).
Data produced when each IMF is generated are processed using FFT. The IMF spectral content should be monotonic, exhibiting minimal spread. IMFs are inspected for frequency content between 0.5 Hz and 40 Hz, indicative of a frequency content typical of the ECG signal. The magnitude threshold of this parameter is selectable and is dependent on the measurement system.

3.5.3. EEMD Implementation Process (Algorithm)

For EEMD, the ratio of added white noise and the number of signals in the ensemble must be predetermined. Depending on the number of iterations in the ensemble, different white noise w i (t) with the same amplitude is added N times to an original signal x(t) to generate N modified signals x i (t).
x i ( t ) = x ( t ) + w i ( t )     i = 1 , 2 , , N
The EMD decomposition is then carried out on each modified signal x i (t), decomposing it into n units of IMF and one residue. This is replicated for N × n IMF signals and n residue components r i n (t). Then, x i ( t ) can be rewritten as:
x i ( t ) =   j = 1 n h i j ( t ) + r i n ( t )      i = 1 , 2 , , N
Each set of IMFs H j ( t ) cause the noise component w i n ( t ) to trend toward zero. The error in the decomposition is given by Wu et al. [22] as:
ε n = ε N
where N is the number of ensemble iterations, noise(t) is a normalized noise signal, ε the amplitude of w i ( t )   a n d   ε n is the final SD.
w i ( t ) = ε × n o i s e ( t )
The fact that the EEMD process is required to average N iteration of each IMF in order to complete, means an extended processing time and additional memory usage. This should be considered prior to the adoption of the technique.

4. Results

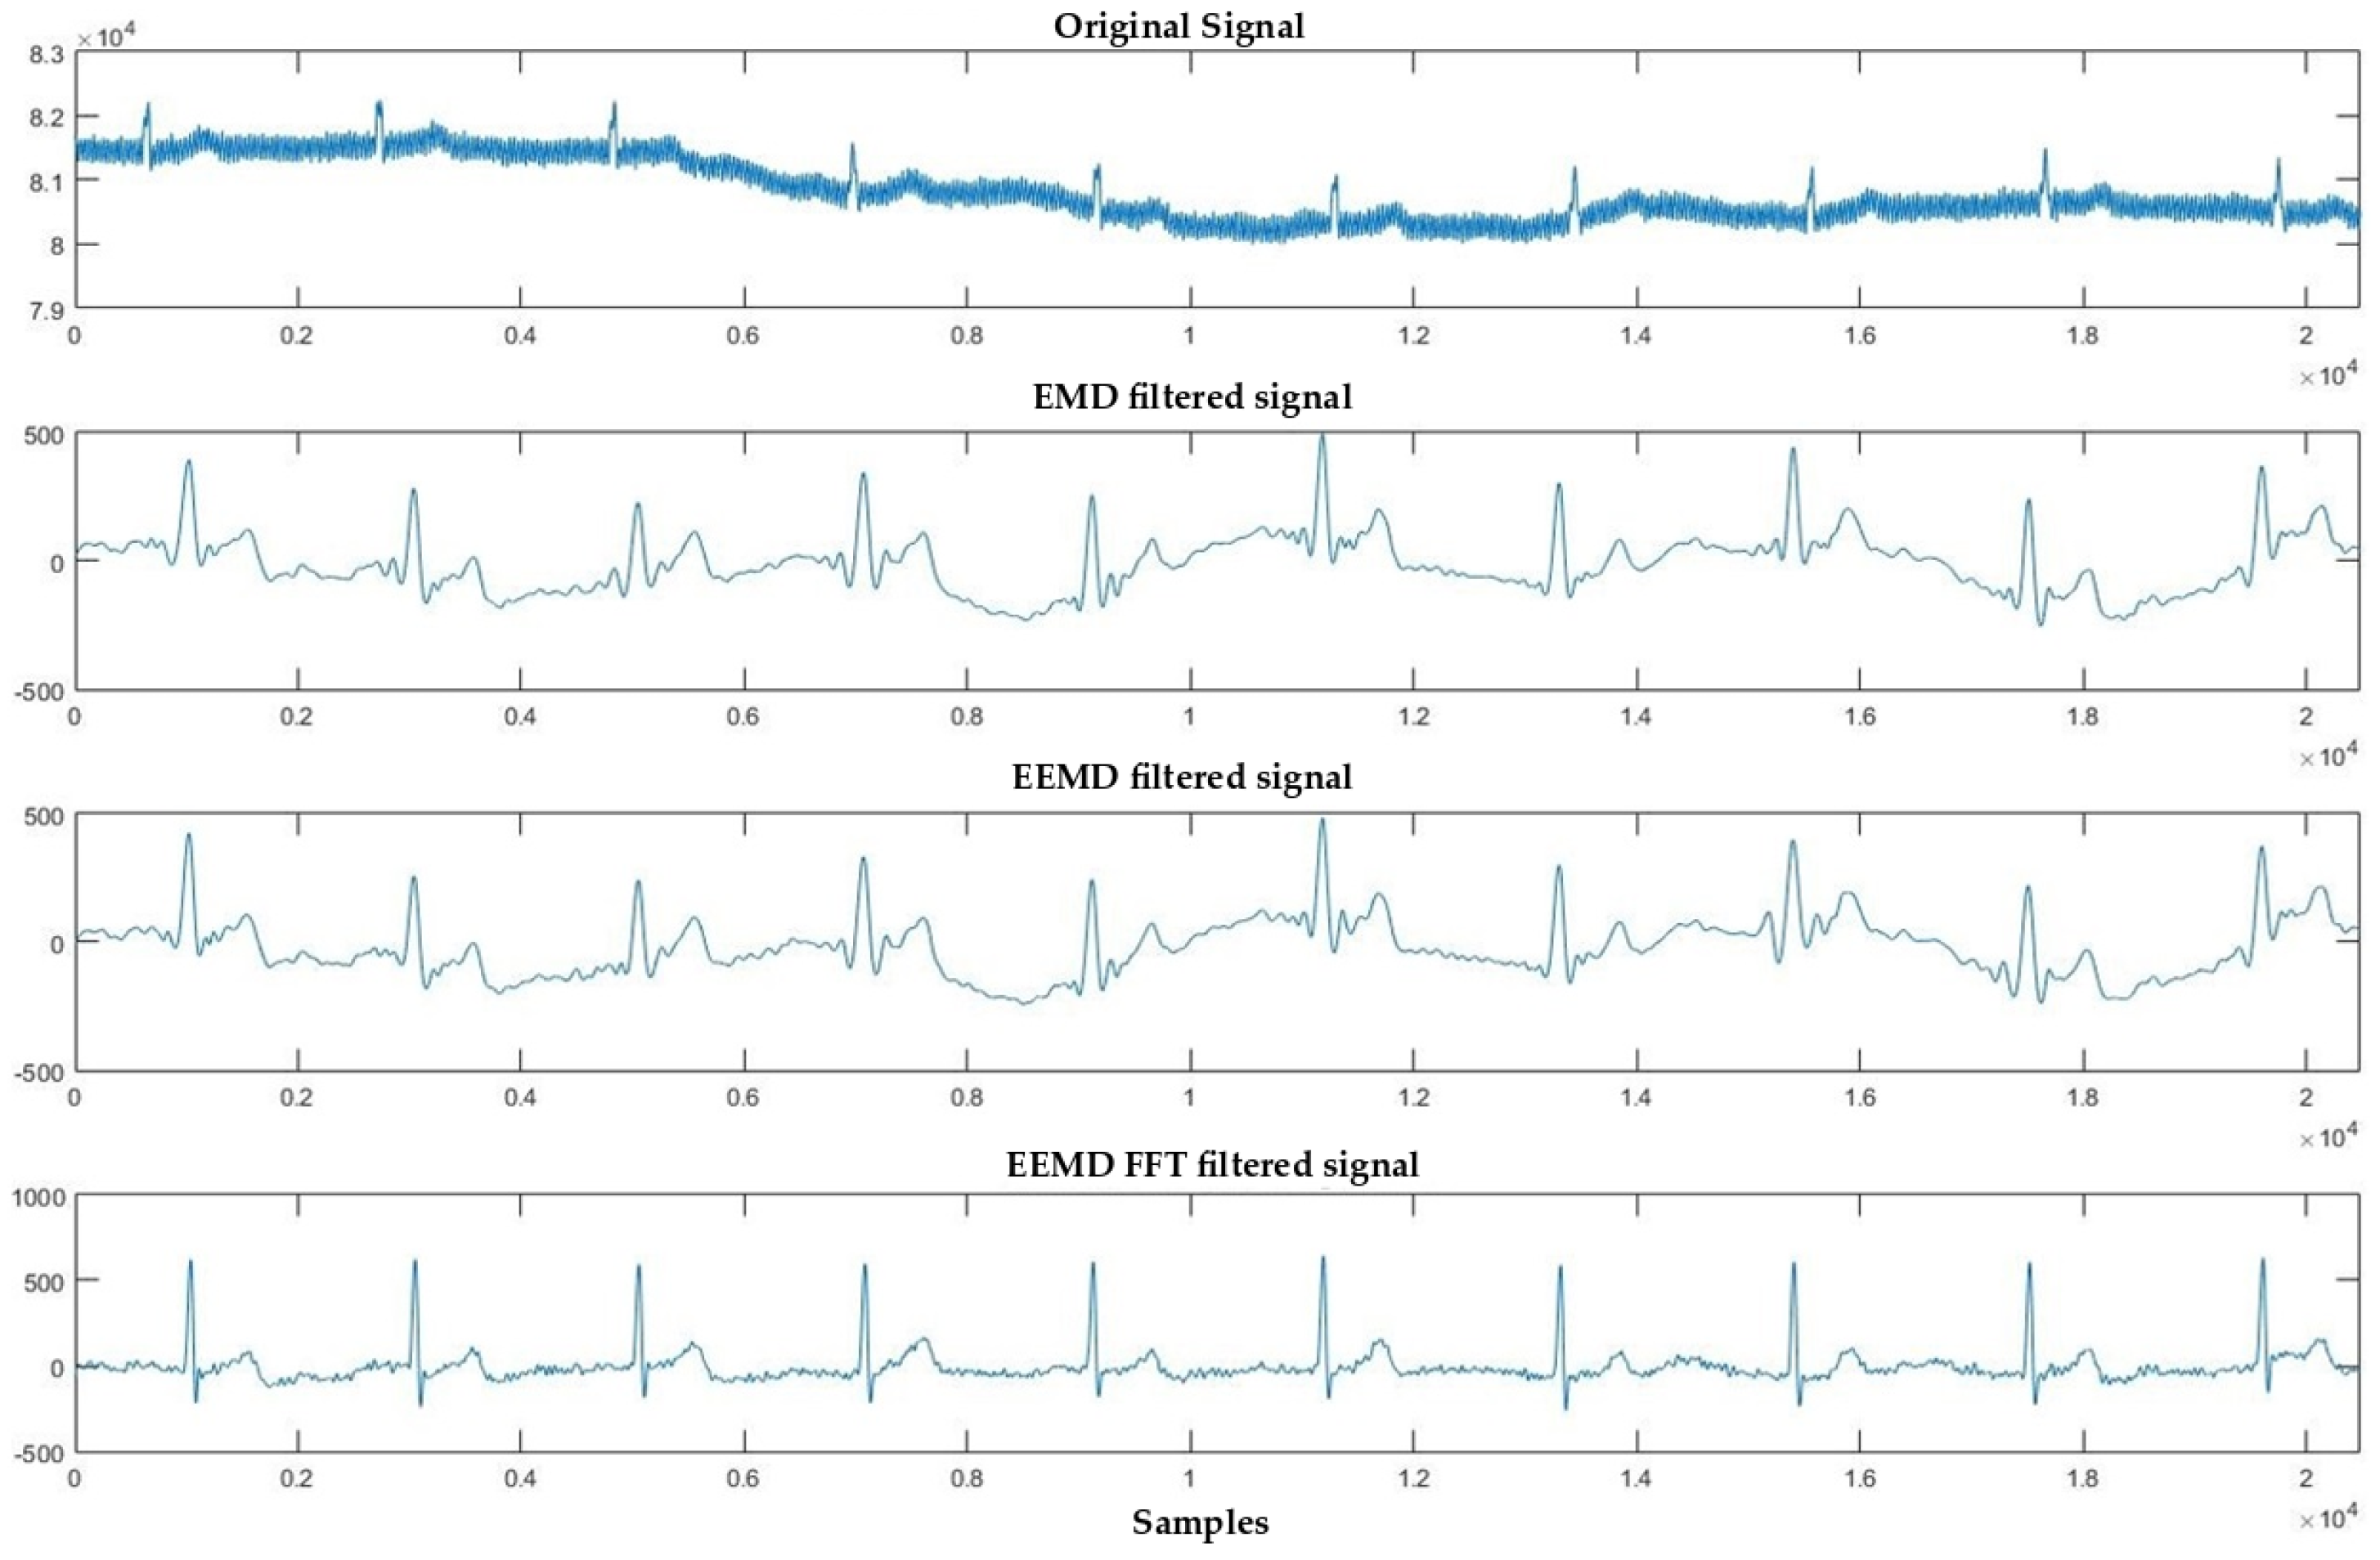
4.1. Denoising Process

After pre-filtering (50 Hz notch and 0.2–40 Hz band-pass) the set of seven left-arm bipolar leads and the recorded standard chest Lead I (used as control and time fiducial point for the SA denoising process) as a control ECG for the performance assessment, for each of the 34 clinical cases (N = 34), denoising by methods of SA (SFP beat alignment using chest Lead I, about 400 beats were averaged in all cases), EMD, EEMD and EEMD-fft, were applied on the set of seven arm leads (from Lead-1 to Lead-7), using a 20 s sample section of stable ECG for the three data-driven methods of EMD, EEMD and EEMD-fft.
Figure 7 shows the original signal of the upper arm Lead-1 of clinical case Patient #1 and its filtered version using the three data-driven denoising methods under study. Several cases (about five) were rejected, because they presented poor quality signals after the pre-filtering stage.

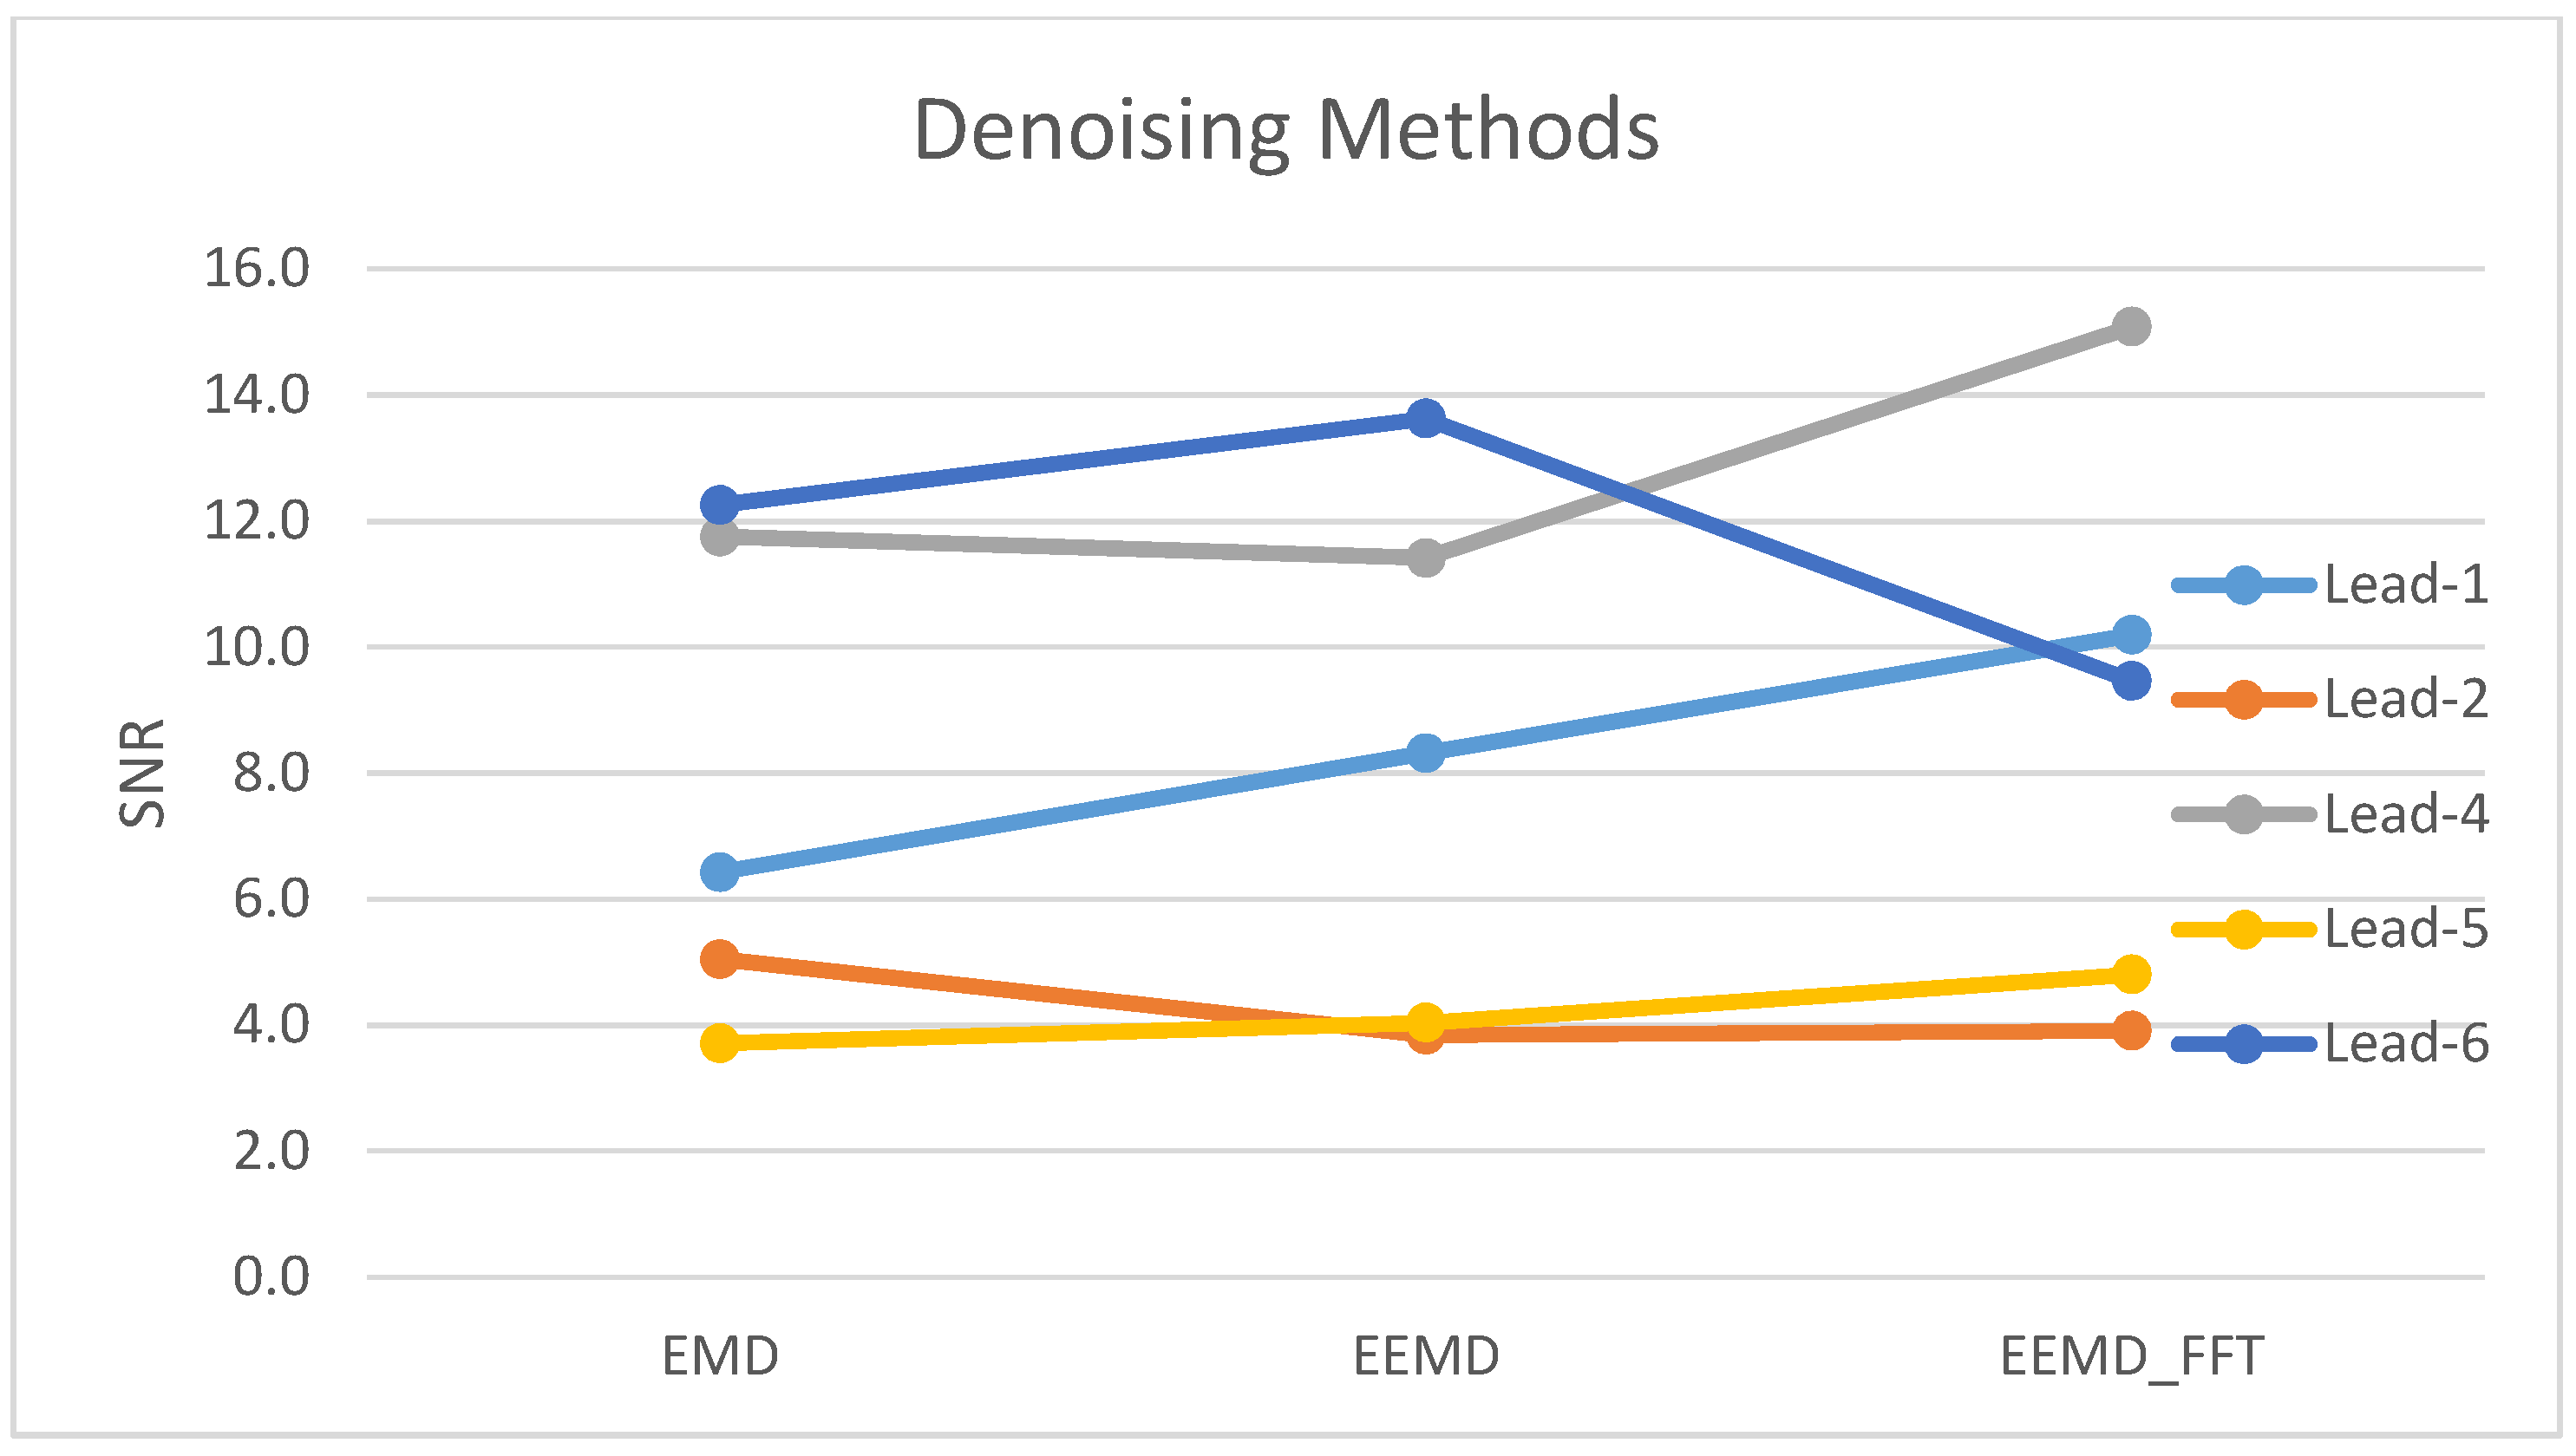
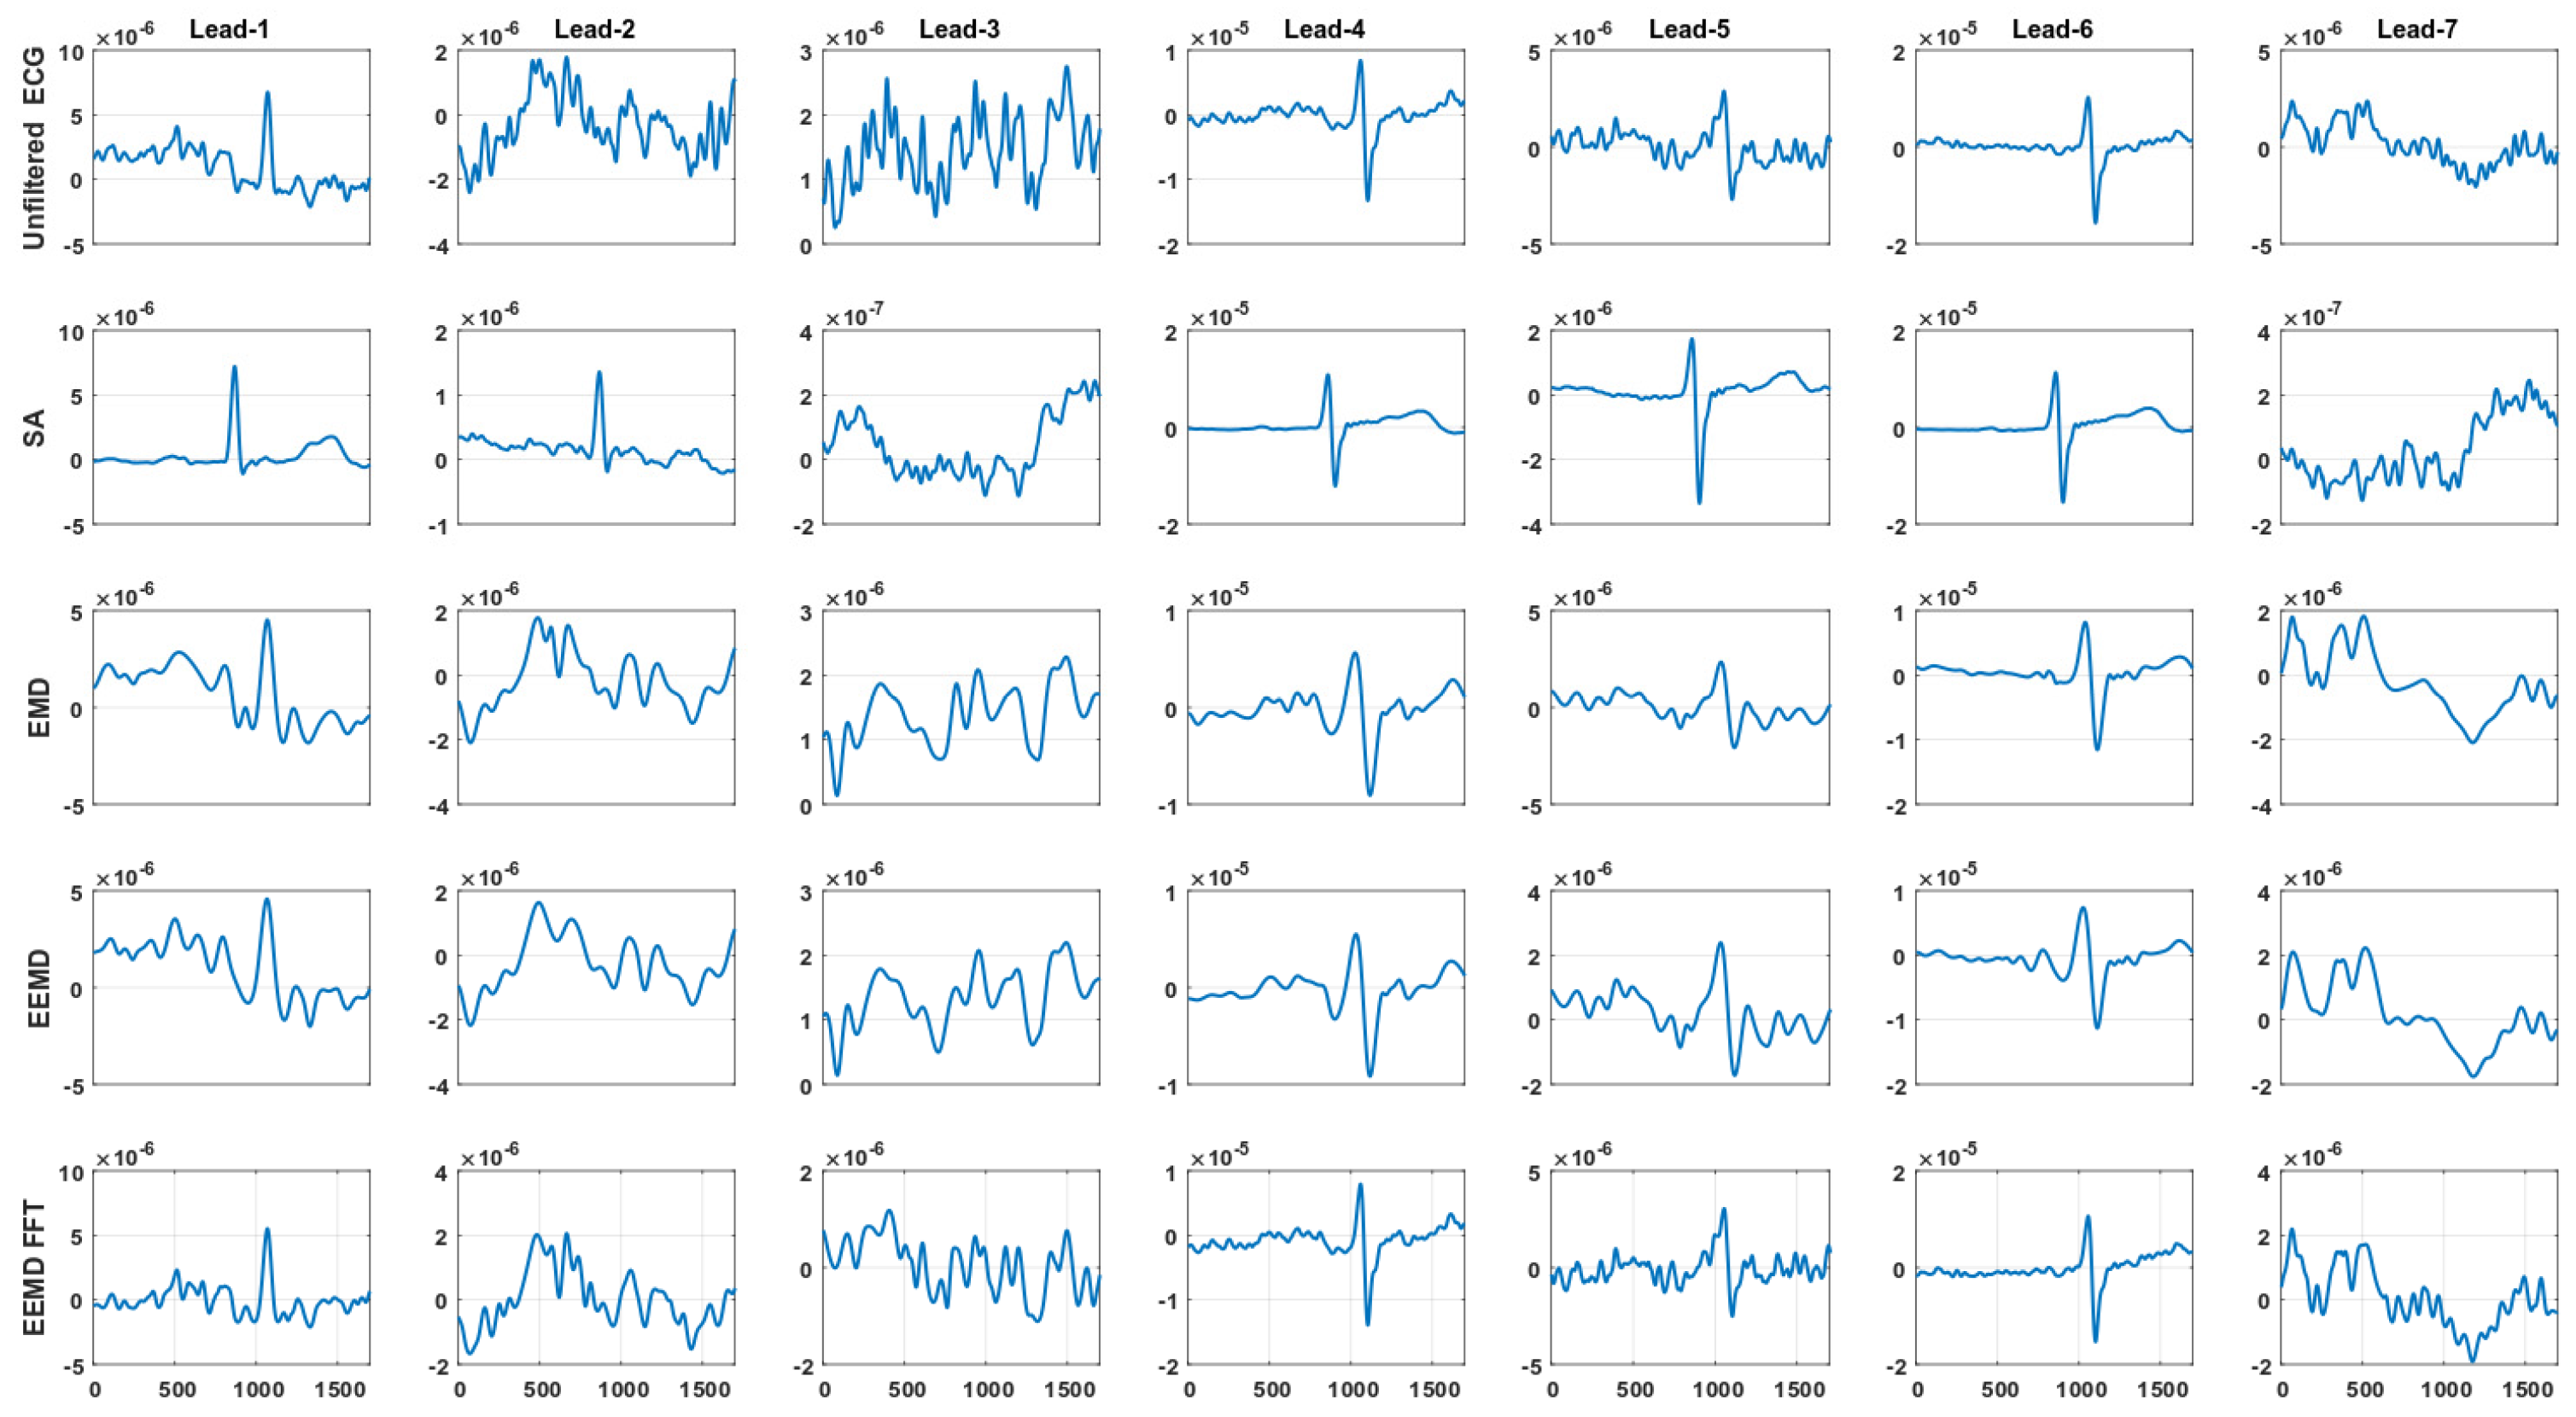
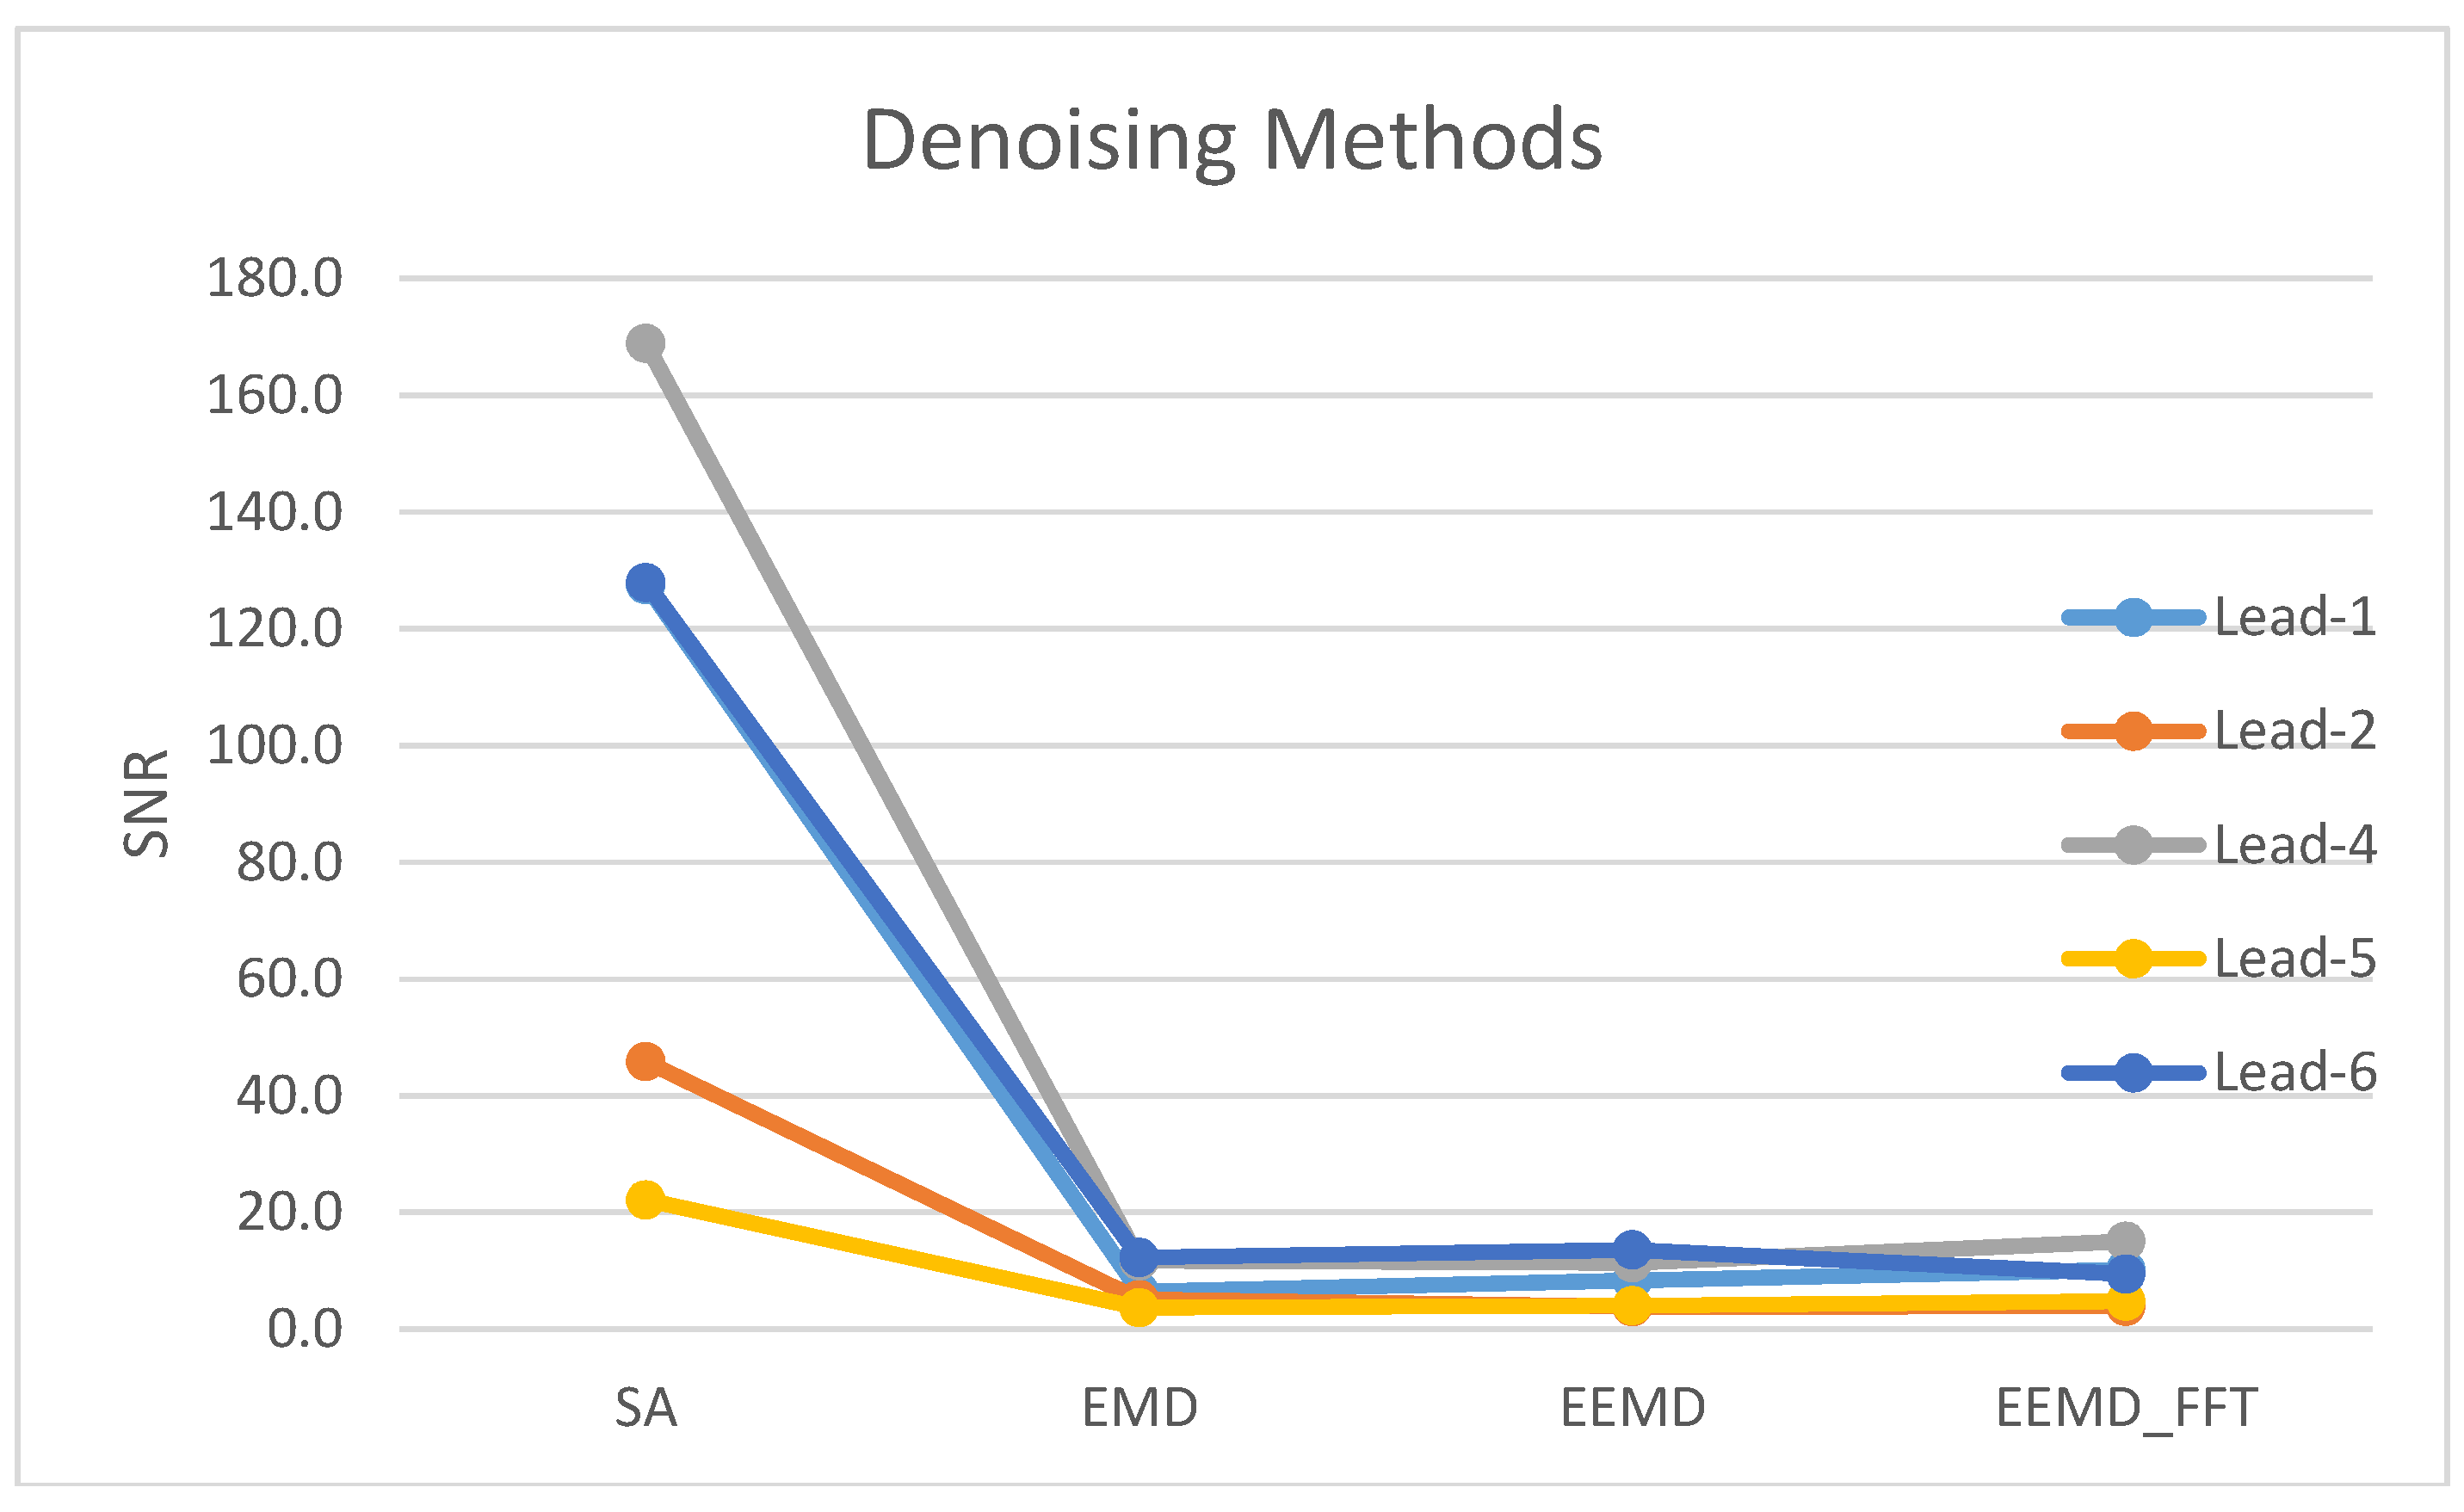
4.2. Signal Averaging and EMD, EEMD and EEMD-fft Comparative Study

Figure 8 illustrates the clinical case Patient #10, which was one of the best quality ECG recording cases. After the pre-filtering stage process 34 (N = 34) cases were denoised by means of the EMD, EEMD and EEMD-fft methods, followed by SNR performance assessment. The resulting SNR mean values (N = 34) are summarized in Table 2, for each data-driven denoising method under study, and for the control SA method, on the set of arm-ECG bipolar leads. From these overall results (all cases; N = 34), it is clearly revealed that the wrist-located bipolar leads—Lead-3 (transversally oriented) and Lead-7 (axially oriented)—which had the smallest inter-electrode distances and were the most distally located from the heart, had negligible cardiac EGM signal strength to be useful in clinical practice.
Table 3 shows 18 ‘golden cases’, which means patient cases with best quality recordings, for SNR values using control method SA and the data-driven denoising methods EMD, EEMD and EEMD-fft. Wrist leads three and seven again presented very poor mean SNR values, even with the SA method. Even though EMD and EEMD showed higher SNR mean values in leads two and six, compared with the EEMD-fft technique, a well-recognized ECG waveform was usually better with the EEMD-fft method. Although the data-driven methods did not present sufficiently good denoising performance on the transversal forearm Lead-2 and on the axial forearm-wrist Lead-5, the SA control method evidenced some cardiac EGM signal presence, still to be unfolded by some further improvement of the data-driven methods, and assures the target for the next research challenge.
Table 4 summarizes a qualitative analysis with count scores and cases with poor ECG waveforms that were not counted, as their also poor SNR value had no meaning. It can be observed that the EEMD-fft denoising method performed better and more ECG waveforms along certain leads were observed. It was assigned zero if a recognizable ECG waveform was not shown. As was mentioned before, Lead 3 and Lead 7, related to the wrist, did not present any ECG waveform (zero count). From the results in Table 3 and Table 4, it is clear that the data-driven methods can perform well on the transversal upper arm Lead-1, and on the axial leads four and six; the arm bipolar Lead-1 and Lead-4 are of anatomical practical importance, and the EEMD-fft method performed better on these two bipolar leads, in comparison to the EMD and the EEMD methods.
In Figure 9, a plot of SNR performance comparison among denoising methods is presented. The SA control method was superior than the data-driven methods, in all leads. However, Figure 10 displays the SNR figure comparison for the bipolar leads set, including only best cases (N = 18) in each lead. These are the selected cases in which all the methods showed a recognizable, clear ECG waveform.

5. Discussion and Conclusions

Data-driven techniques are a comparatively new and an innovative approach to data manipulation and processing. They allow signals to be recovered from within band noise while maintaining the signal morphology. This in itself is an exciting prospect when dealing with ECGs, whose morphology is of clinical importance and critical. EMD was not ideal, due to mode mixing, while the improved EEMD technique reduced the mode mixing effect to near zero, allowing for a better-defined IMF and a more precise filter outcome. The arm-worn monitoring application requires that any signal processing is eventually implemented on an embedded platform. Therefore, the automation fusion algorithm for EEMD with FFT thresholding using time domain inspection of the IMFs proved to be successful. The only concern would be that the heavy processor load of EEMD combined with that of the FFT may prove to be unachievable in a battery-powered portable device. It should be noted that the monotonic nature of the EEMD output would lead to a simple thresholding technique for frequency measurement instead of FFT, reducing processing operations.
It is difficult to provide a direct comparison to pre-existing work on this subject as the literature content in this area is sparse and the large majority of heart rate monitoring is achieved using photoplethysmographic signals. In this area, some attempts have been made towards distal site R-wave recovery. Smart watches for cardiovascular monitoring represent a milestone for the development of these systems, maximizing comfort and usability for the end-user. However, besides the important benefits that these technologies bring, such arm-worn systems are seriously affected by movement artefacts. In general, many wearable, long-term cardiac monitoring systems have not gained entry into the cardiovascular monitoring devices market due to clinical approval and certification issues and associated high costs [24]. Nevertheless, focus is being directed to the home environment and to the healthcare for the elderly, where patients generally benefit from increased comfort at home; a factor that may accelerate their recovery. Thus, eventually, costs for the public healthcare system will be reduced by shortening the stay in hospital; this has been the main drive for the development of long-term cardiovascular monitoring solutions for the home environment [25].
In this work, some steps have been taken toward arm-ECG bipolar lead assessment and heart rhythm signal (P-QRS-T waves) recovery techniques. The outcome of this research shows potential in that it suggests that a P-QRS-T waves based rhythm monitor may be achievable using currently available technology. The confirmation of EEMD as the primary processing technique is also of significant importance. This technique had never been used on far-field arm ECG bipolar lead sets prior to this research activity, so the isolation of a successful processing technique is of prime significance to the progress of the WASTCArD Project research team (EU-H2020-MSCA-RISE Programme).
It is worth noting that the signal averaging output was generated after 8 min of data collection. It is possible to reduce this by using a sliding window average or cumulative average, but acceptable performance for this method is still traded off against latency. The empirical decomposition data processing was the result of 20 s of data and the actual minimum latency was found to be one beat. In order to produce meaningful output, a sliding window, one ‘beat’ wide, may be applied to the incoming data. Thus, the data should be stored in RAM (random acces memory), delay-processed (constant time-lag) and, once analysed, discarded to make way for contemporary data. This practical implementation technique would remove the need for large volume data storage. It will also improve power management as data storage is a power-demanding activity.
It is interesting to note that the data-driven techniques studied herein, do not directly take advantage of LSB dithering and leave the minimum resolvable signal as 30 nV per bit, where signal averaging techniques will produce resolutions in excess of 30 μV. It is possible to implement an oversampling approach in hardware [26,27], prior to the data entering into the decomposition algorithm, which would remedy this issue. It was not possible to trial this approach using the equipment available at the time of the study.
The removal of noise from the ECG using conventional real-time pre-filtering digital FIR (finite impulse response) and IIR (infinite impulse response) filters may be a simple denoising alternative for an upper arm monitoring sensor band. Kumar et al. [28], have studied this approach with variations of FIR and IIR digital filter designs, and have reported that by using FIR filters of 56 coefficients with the a Kaiser window, presented the best performance in comparison to orders FIR, as well as IIR filter designs. We have explored this possible approach, and determined that by increasing the order number (coefficients), e.g., 100, there was no significant denoising performance improvement.
A data fusion approach, using EEMD and FFT, that allows automation of the empirical mode partial reconstruction filter method was tested. The results on SNR performance presented in Table 3 and Figure 10, provide the evidence of this fact. The success of the EEMD approach highlights its suitability for use in this unique application. The complicating factor of mode mixing is removed leaving only the issue of IMF content unpredictability, which is dealt with using industry standard frequency analysis—FFT in this case. Robust extraction of the heart ECG signals from the wrist bipolar Lead-3 and Lead-7 are unlikely at this stage, based on the levels of noise apparent at that extreme distal site, and the relatively short inter-electrode distance. However, from the results obtained, it is evident that the upper arm Lead-1 and Lead-4 may prove to be more successful over a large population.
Following testing on a small clinical database created solely for the purpose of developing an arm-worn sensor, it can be concluded that the EEMD-fft fusion technique studied herein will provide a low latency, data-driven denoising approach that has the best chance of the recovery of clinical quality ECG data from a real-time data stream from an arm ECG bipolar lead set, named here as Lead-1, Lead-4 and Lead-6. However, although considerable progress has been made, the state of the art is still in a situation where the potentials of the transversal forearm Lead-2 and the axial forearm-wrist Lead-5 are still to be unfolded by some further improvement of the data-driven methods, as the SA control method evidenced some cardiac EGM signal presence, and may be recoverable as a future research challenge.

Acknowledgments

This ongoing research is supported by funding from the European Union (EU): H2020-MSCA-RISE Programme (WASTCArD Project, Grant #645759). Professor Omar Escalona‘s dedication to this study was supported by philanthropic funds; equally from the Ulster Garden Villages Ltd. and the McGrath Trust (UK).

Author Contributions

O. Escalona, and W. Lynn conceived and designed the experiments; G. Perpiñan implemented the data processing tools; L. McFrederick performed the clinical arm-ECG digital recordings; D. McEneaney designed and coordinated the clinical protocol and was the registered PI in the ethical procedures; all authors contributed equally to data analysis, interpretation of results and manuscript preparation.

Conflicts of Interest

The authors declare no conflict of interest.

References

  1. Katritsis, D.G.; Gersh, B.J.; Camm, A.J. A clinical perspective on sudden cardiac death. Arrhythm. Electrophysiol. Rev. 2016, 5, 177–182. [Google Scholar] [CrossRef]
  2. Zimetbaum, P.; Josephson, M.E. Evaluation of patients with palpitations. N. Engl. J. Med. 1998, 338, 1369. [Google Scholar] [CrossRef] [PubMed]
  3. Massot, B.; Noury, N.; Gehin, C.; McAdams, E.T. On designing a ubiquitous sensor network for health monitoring. In Proceedings of the 2013 IEEE 15th International Conference on e-Health Networking, Applications and Services (Healthcom), Lisbon, Portugal, 9–12 October 2013; pp. 310–314. [Google Scholar]
  4. Shackel, B.; Chidsy, K.D.; Shipley, P. The assessment of chair comfort. Ergonomics 1969, 12, 269–306. [Google Scholar] [CrossRef] [PubMed]
  5. Yang, H.; Chien, T.; Liu, S.; Chiang, H. Study of Single-Arm Electrode for ECG Measurement Using Flexible Print Circuit. 2011. Available online: http://eshare.stust.edu.tw/EshareFile/2011_6/2011_6_7f351cdf.pdf (accessed on 23 July 2014).
  6. Shu, L.; Tung, S.; Kuo, C.; Ma, C. Bared Microtip Arrays for ECG Measurement. Int. J. Autom. Smart Technol. 2016, 6, 177–180. [Google Scholar]
  7. Chen, K.; Ren, L.; Chen, Z.; Pan, C.; Zhou, W.; Jiang, L. Fabrication of Micro-Needle Electrodes for Bio-Signal Recording by a Magnetization-Induced Self-Assembly Method. Sensors 2016, 16, 1533. [Google Scholar] [CrossRef] [PubMed]
  8. Kim, M.; Kim, T.; Kim, D.; Chung, W.K. Curved Microneedle Array-Based sEMG Electrode for Robust Long-Term Measurements and High Selectivity. Sensors 2015, 15, 16265–16280. [Google Scholar] [CrossRef] [PubMed]
  9. Han, G.; Lin, B.; Xu, Z. Electrocardiogram signal denoising based on empirical mode decomposition technique: An overview. J. Instrum. 2017, 12. [Google Scholar] [CrossRef]
  10. Bosnjak, A.; Kennedy, A.; Linares, P.; Borges, M.; McLaughlin, J.; Escalona, O.J. Performance assessment of dry electrodes for wearable long term cardiac rhythm monitoring: Skin-electrode impedance spectroscopy. In Proceedings of the IEEE Engineering in Medicine and Biology Society, Jeju Island, South Korea, 11–15 July 2017; Volume 39. [Google Scholar]
  11. Lynn, W.D.; Escalona, O.J.; McEneaney, D.J. A Low Latency Electrocardiographic QRS Activity Recovery Technique for Use on the Upper Left Arm. Electronics 2014, 3, 409–418. [Google Scholar] [CrossRef]
  12. Lynn, W.D.; Escalona, O.J.; McEneaney, D. Approaching long term cardiac rhythm monitoring using advanced arm worn sensors and ECG recovery techniques. Cardiol. Angiol. 2015, 3, 137–148. [Google Scholar] [CrossRef]
  13. Lynn, W.D.; Escalona, O.J.; McEneaney, D.J. Arm and wrist surface potential mapping for wearable ECG rhythm recording devices: A pilot clinical study. J. Phys. 2013, 450, 012026. [Google Scholar] [CrossRef]
  14. Escalona, O.J.; Mendoza, M. Electrocardiographic Waveforms Fitness Check Device Technique for Sudden Cardiac Death Risk Screening. In Proceedings of the Annual International Conference of the IEEE Engineering in Medicine and Biology Society, EMBS, Orlando, FL, USA, 16–20 August 2016; pp. 3453–3456. [Google Scholar]
  15. Escalona, O.J.; Mitchell, R.H.; Balderson, D.E. A fast and reliable QRS alignment technique for high-frequency analysis of the signal-averaged ECG. Med. Biol. Eng. Comput. 1993, 31, 137–146. [Google Scholar] [CrossRef]
  16. Escalona, O.J.; Mendoza, M.; Villegas, G.; Navarro, C. Real-time System for High-resolution ECG Diagnosis Based on 3D Late Potential Fractal Dimension Estimation. Comput. Cardiol. 2011, 38, 789–792. [Google Scholar]
  17. Escalona, O.J. Analog implementation of the single fiducial point alignment technique for real-time high resolution ECG analysis in the P-R interval. In Proceedings of the Computers in Cardiology 1998, Cleveland, OH, USA, 13–16 September 1998; pp. 229–232. [Google Scholar]
  18. Flandrin, P.; Rilling, G.; Goncalvés, P. Empirical mode decomposition as a filter bank. IEEE Signal Process. Lett. 2004, 11, 112–114. [Google Scholar] [CrossRef]
  19. Rilling, G.; Flandrin, P.; Goncalves, P. On Empirical Mode Decomposition and its Algorithm. In Proceedings of the 6th IEEE/EURASIP Workshop on Nonlinear Signal and Image Processing (NSIP’03), Grado, Italy, 8–11 June 2003; pp. 8–11. [Google Scholar]
  20. Wu, Z.; Huang, N.E.; Chen, X. The multi-dimensional ensemble empirical mode decomposition method. Adv. Adapt. Data Anal. 2009, 1, 339–372. [Google Scholar] [CrossRef]
  21. Huang, N.E.; Shen, Z.; Long, S.R.; Wu, M.C.; Shih, H.H.; Zheng, Q.; Yen, N.C.; Tung, C.C.; Liu, H.H. The empirical mode decomposition and the Hilbert spectrum for nonlinear and non-stationary time series analysis. Proc. R. Soc. A 1998, 454, 903–999. [Google Scholar] [CrossRef]
  22. Wu, Z.; Huang, N.E. Ensemble empirical mode decomposition: A noise-assisted data analysis method. Adv. Adapt. Data Anal. 2009. [Google Scholar] [CrossRef]
  23. Wu, Z.; Huang, N.E. A study of the characteristics of white noise using the empirical mode decomposition method. Proc. R. Soc. A 2004, 460, 1597–1611. [Google Scholar] [CrossRef]
  24. Scilingo, E.P.; Valenza, G. Recent advances on wearable electronics and embedded computing systems for biomedical applications. Electronics 2017, 6, 12. [Google Scholar] [CrossRef]
  25. Boehm, A.; Yu, X.; Neu, W.; Leonhardt, S.; Teichmann, D. A novel 12-lead ECG T-shirt with active electrodes. Electronics 2016, 5, 75. [Google Scholar] [CrossRef]
  26. Zhou, Y. An oversampling system for ECG acquisition. J. Biomed. Sci. Eng. 2009, 2, 521–525. [Google Scholar] [CrossRef]
  27. Olson, D.; Van Ess, D. Method and Apparatus for Increasing the Low Frequency Dynamic Range of a Digital ECG Measuring System—US 6249696 B1. 1999. Available online: http://www.google.ch/patents/US6249696 (accessed on 08 August 2017).
  28. Kumar, K.S.; Yazdanpanah, B.; Kumar, P.R. Removal of Noise from Electrocardiogram Using Digital FIR and IIR Filters with Various Methods. In Proceedings of the Communications and Signal Processing (ICCSP) Conference, Melmaruvathur, India, 2–4 April 2015; pp. 157–162. [Google Scholar]
Figure 1. BIS-QuatroTM pre-gelled sensor system showing dimensions.
Electronics 06 00084 g001
Figure 2. Positioning of the BIS-QuatroTM sensor system band around the wrist (a) and (b), and around the forearm (c) on the left-arm.
Electronics 06 00084 g002
Figure 3. The BioSemi Active 2 A/D simultaneous conversion unit; 32-channel analogue input.
Electronics 06 00084 g003
Figure 4. Anatomical position of the 10 unipolar left-arm potential mapping channels, using the three BIS-QuatroTM sensor strips (a), and wired up arm photo (b). BIS: BIS-QuatroTM sensor system; DRL: driven right leg; CMS: common signal reference electrode.
Electronics 06 00084 g004
Figure 5. The regions identified above show the area of noise (red) and signal (green) superimposed on an example ECG (electrocardiogram) signal.
Electronics 06 00084 g005
Figure 6. Dynamic EMD (empirical mode decomposition) filter structure showing the use of FFT (fast Fourier transform) to post process each IMF (intrinsic mode functions) prior to reconstruction. IMFs that fall outside of the frequency band (0.5 Hz–30 Hz) are excluded.
Electronics 06 00084 g006
Figure 7. Example of the denoising of an ECG section of upper arm Lead-1in a clinical case (Patient #1); showing best denoising qualitative performance, ECG waveform, including well-defined P-QRS-T waves.
Electronics 06 00084 g007
Figure 8. Example clinical case: Patient #10, illustrating output of processing each bipolar arm lead using the various denoising methods. X-axis are in samples (2048 samples/sec), y-axis are in automatic scaled units.
Electronics 06 00084 g008
Figure 9. Denoising methods’ mean value SNR (signal-to-noise ratio) performance relative comparison (N = 18).
Electronics 06 00084 g009
Figure 10. Denoising methods comparison plot among data-driven denoising methods—EMD, EEMD (ensemble empirical mode decomposition) and EEMD-fft—applied to the arm-ECG bipolar lead set study (Golden cases, N = 18).
Electronics 06 00084 g010
Table 1. Definition and anatomical location of studied left-arm bipolar leads. BIS: BIS-QuatroTM sensors system.
Transversal left-arm BIS sensor bipolar leads
  Lead-1 = Ch10–Ch8  → (Upper arm)
  Lead-2 = Ch7–Ch5    → (Forearm)
  Lead-3 = Ch4–Ch3    → (Wrist)
Axial left-arm BIS sensor bipolar leads
  Lead-4 = Ch10–Ch6  → (Upper arm-Forearm)
  Lead-5 = Ch7–Ch2    → (Forearm-Wrist)
  Lead-6 = Ch10–Ch2  → (Upper arm-Wrist)
  Lead-7 = Ch1–Ch3    → (Low wrist-Upper wrist)
Table 2. SNR (signal-to-noise ratio) mean value figures (N = 34) for denoising performance comparison among the denoising methods under study.
MethodLead-1Lead-2Lead-3Lead-4Lead-5Lead-6Lead-7
SA102.833.12.2114.721.695.72.7
EMD8.03.93.49.03.29.32.3
EEMD9.13.53.19.04.09.82.1
EEMD-fft8.53.51.711.53.77.31.9
SA: signal averaging; EMD: empirical mode decomposition; EEMD: ensemble empirical mode decomposition.
Table 3. Results of the SNR values in selected best cases (‘Golden Cases’, N = 18) of arm-ECG bipolar lead set recordings, for the different data-driven denoising methods (EMD, EEMD and EEMD-fft) and for the control SA method as an indication of signal quality.
Lead-1Lead-2Lead-3Lead-4Lead-5Lead-6Lead-7
SAEMDEEMDEEMD fftSAEEMD fftEEMDEEMDSAEMDEEMD fftEEMDSAEMDEEMDEEMD fftSAEMDEEMDEEMD fftSAEMDEEMDEEMD fftSAEMDEEMDEEMD fft
Case 1.203.115.523.116.816.54.75.41.60.91.11.11.6164.229.026.414.45.11.21.64.768.46.55.87.20.81.01.11.6
Case 10.206.69.35.73.424.32.43.92.21.21.31.42.7142.234.822.825.254.226.615.114.7617.048.056.248.21.71.21.02.2
Case 13.20.78.99.011.09.74.69.04.72.33.73.81.712.69.49.514.22.33.73.71.52.43.83.71.61.92.12.50.7
Case 15.182.91.51.33.7177.632.28.59.10.92.52.70.5419.32.21.96.837.46.816.320.9145.43.03.55.51.51.82.31.4
Case 24.31.51.71.71.09.41.92.71.40.61.71.92.1106.17.112.27.39.70.91.01.058.48.18.75.61.30.40.91.8
Case 26.212.97.98.85.226.71.71.70.70.61.11.91.2135.913.112.27.28.81.31.20.945.411.211.15.40.71.51.61.3
Case 39.1.72.72.78.036.04.16.515.82.83.22.12.5115.417.125.258.414.43.77.14.8124.830.942.029.11.40.40.71.2
Case 44.60.40.20.211.229.02.12.02.92.213.715.01.1327.40.20.219.049.70.20.28.0226.10.10.111.12.51.20.91.4
Case 47.117.814.311.110.836.32.93.34.90.93.83.02.2272.09.19.110.146.36.54.23.6277.216.021.410.31.81.71.82.1
Case 5.130.411.344.131.824.91.71.70.80.80.30.50.5160.320.215.28.68.91.60.41.063.812.815.67.31.41.00.80.4
Case 54.2.60.50.522.3151.90.80.94.21.71.91.50.7322.40.30.320.838.70.91.21.3152.01.21.34.14.44.54.61.3
Case 6.2.86.98.011.48.11.82.13.10.69.65.51.592.816.817.06.65.92.26.60.994.117.219.75.31.41.21.60.6
Case 62.84.73.47.58.532.02.92.02.96.01.61.41.895.78.811.45.411.30.40.40.350.55.36.42.427.21.31.44.7
Case 63.385.47.15.95.727.51.41.20.60.41.11.34.690.318.215.06.00.10.60.63.81.03.74.24.13.03.33.62.8
Case 64.51.27.67.211.521.21.92.53.41.75.54.42.2118.14.04.39.49.52.62.71.821.54.64.02.70.66.49.010.8
Case 65.53.53.13.58.860.22.84.04.10.52.52.80.8113.47.28.218.119.41.21.50.7132.311.46.14.20.79.34.61.7
Case 7.214.28.13.84.581.12.02.01.16.40.40.30.5214.26.86.512.89.20.81.40.687.47.94.83.60.20.90.70.5
Case 9.333.35.75.77.752.419.09.77.00.71.22.30.9138.37.38.021.367.35.67.415.8134.829.030.812.51.71.61.20.7
Avg. (N = 18)127.56.48.310.245.85.03.83.91.73.12.91.6168.911.711.415.122.13.74.04.8127.912.313.69.53.02.32.22.1
Table 4. Total clinical cases subject count which had a recognizable ECG waveform resulting after applying denoising methods (N = 34).
MethodLead-1Lead-2Lead-3Lead-4Lead-5Lead-6Lead-7
SA292713420310
EMD22110297250
EEMD23110297230
EEMD-fft27130339300

