Article

Military Object Real-Time Detection Technology Combined with Visual Salience and Psychology

1
College of Field Engineering, PLA Army Engineering University, Nanjing 210007, China
2
Second Institute of Engineering Research and Design, Southern Theatre Command, Kunming 650222, China
*
Author to whom correspondence should be addressed.
Electronics 2018, 7(10), 216; https://doi.org/10.3390/electronics7100216
Submission received: 6 August 2018 / Revised: 10 September 2018 / Accepted: 19 September 2018 / Published: 25 September 2018

Abstract

:
This paper presents a method of military object detection through the combination of human visual salience and visual psychology, so as to achieve rapid and accurate detection of military objects on the vast and complex battlefield. Inspired by the process of human visual information processing, this paper establishes a salient region detection model based on double channel and feature fusion. In this model the pre-attention channel is to process information on the position and contrast of images, and the sub-attention channel is to integrate information on primary visual features first and then merges results of the two channels to determine the salient region. The main theory of Gestalt visual psychology is then used as the constraint condition to integrate the candidate salient regions and to obtain the object figure with overall perception. After that, the efficient sub-window search method is used to detect and filter the object in order to determine the location and range of objects. The experimental results show that, when compared with the existing algorithms, the algorithm proposed in this paper has prominent advantages in precision, effectiveness, and simplicity, which not only significantly reduces the effectiveness of battlefield camouflage and deception but also achieves the rapid and accurate detection of military objects, thus promoting its application prospect.

1. Introduction

In recent decades, wars depend more and more on advanced technology, and as a result, the patterns of warfare have changed from mechanized warfare to information warfare, which has become the main form of modern warfare. Rapid, efficient, and accurate detection of military objects for the purpose of accurate attacks is not only an indispensable demand for modern warfare, but also a crucial element for the improvement of early strategic warning systems and missiles [1].
Object detection is the basis of object tracking and recognition. The quality of detection results plays a decisive role in subsequent operations. At present, the commonly-used object detection methods mainly include several traditional ones, such as feature matching method, background modeling method, threshold segmentation method, methods based on depth learning, as well as methods based on visual salience. The feature matching method in the traditional detection algorithms (such as [2,3,4]) has high detection precision and accuracy, but it has low autonomy and low calculation efficiency, and its objects need to be initialized manually. Background modeling methods (such as [5,6,7]) can achieve automatic segmentation of objects and backgrounds, but the establishment and update of models is time-consuming and dynamic backgrounds will interfere with the results. Threshold segmentation methods (such as [8,9]) are convenient and efficient for situations with simple backgrounds and prominent objects, but the detection effect under complex circumstances is not satisfactory. To sum up, traditional detection algorithms have limitations, which make it difficult to meet the needs of complex and diverse scenarios in real life. Moreover, these methods are subject to manual interference and their adaptive abilities are far from being enough.
The in-depth learning-based detection algorithms (such as [10,11,12]) can be applied to a variety of detection scenarios, since they are flexible and convenient for modeling on the one hand, and are highly diversified for the detection and identification of various types of objects on the other hand. This is the reason why they have been applied to lots of tasks, such as the monitoring and identification of vehicles and pedestrians. However, the detection effects of such algorithms depend too much on the construction of data sets, particularly the large data sets and manually labeled data sets, which means that it needs lots of computational resources.
The human eye’s visual attention mechanism enables the visual system to extract the most interesting region from the huge image data, thus greatly improving the efficiency of data processing. Along with the development of neuropsychology and neuroanatomy, the visual attention mechanism has gradually become a hot topic in computer vision researches, and thereby attracted the attention of many scholars. So far, the existing visual attention models can be divided into visual attention prediction models and saliency region detection models according to their functions. The former ones are largely utilized to predict the amount of attention that is paid by human eyes to each pixel in the image, while the latter ones, as the major focus of this paper, are largely utilized to detect those salient objects in the image. Visual saliency is an object detection algorithm model that simulates human eyes, which can quickly focus on a particular region. It is mainly divided into a top-down saliency detection model and a bottom-up saliency detection model. The former one regards salient object detection as a learning problem, and actively searches for the required object salient map just as the tasks require. The latter is a salient map acquisition model designed to imitate the instinctive response of human beings to the scene. For a long time, many researchers have put forward various methods to obtain significant object, such as GBVS [13], FT [14], RC [15], CHM [16], DSR [17], etc. Apart from the above-mentioned methods and their improved versions, many new saliency detection methods while using depth learning have emerged during the past two years, such as ds SOD [18], RFCN [19], and DRFI [3], whose principles are to generate saliency maps by the construction and training of neural networks.
Gestalt psychology advocates the study of direct experience and behavior, emphasizes the integrity of experience and behavior, believes that the whole is not equal to and greater than the sum of parts, and advocates the study of psychological phenomena with the view of the dynamic structure of the whole. Reference [20] introduces an experimental paradigm to selectively probe the multiple levels of visual processing that influence the formation of object contours, perceptual boundaries, and illusory contours. Reference [21] presents psychophysical data derived from three-dimensional (3D) percepts of figure and ground that were generated by presenting two-dimensional (2D) images that are composed of spatially disjoint shapes that pointed inward or outward relative to the continuous boundaries that they induced along their collinear edges. The experiments of reference [22] reported herein probe the visual cortical mechanisms that control near-far percepts in response to two-dimensional stimuli. Figural contrast is found to be a principal factor for the emergence of percepts of near versus far in pictorial stimuli, especially when the stimulus duration is brief.
Due to military regulations on classified information, few systematic researches in this field have been carried out at home and abroad, and as for those researches that have been done recently, they lack a framework dedicated to military object detection tasks. When compared with conventional object detection tasks, weapons and personnel on battlefields will be disguised to a certain extent in order to improve the survivability probability of weapons and equipment and to enhance the survivability of personnel. During non-war time, military objects will also be disguised for the sake of classified information regulations on military facilities and equipment. Thus, camouflage, together with complex and changeable battlefields, actually makes it more difficult to detect military objects.
Taking into account the characteristics and requirements of military object detection tasks, this paper, highlighting the imitation of human visual perception mechanism, proposes a military object detection framework that combines human visual salience with visual psychology, and focuses its analyses and researches on the following five aspects:
(1)
establishing a data set dedicated to military object detection to ensure that the data is sufficient and representative so as to compare and verify the validity of the model;
(2)
imitating the human eye vision adaptive adjustment system, thus proposing a new method for image adaptive enhancement is proposed in order to highlight the object, weaken the background, and suppress interference;
(3)
establishing a saliency region detection model based on double channel and feature fusion, after being inspired by how human visual information is processed; and,
(4)
applying Gestalt’s main theory on visual psychology as a constraint condition to integrate the obtained candidate salient regions and thus to generate a salient map with overall perception;
(5)
proposing a new efficient sub-window search method to detect and screen objects and to determine the region where the objects are located on the other hand.
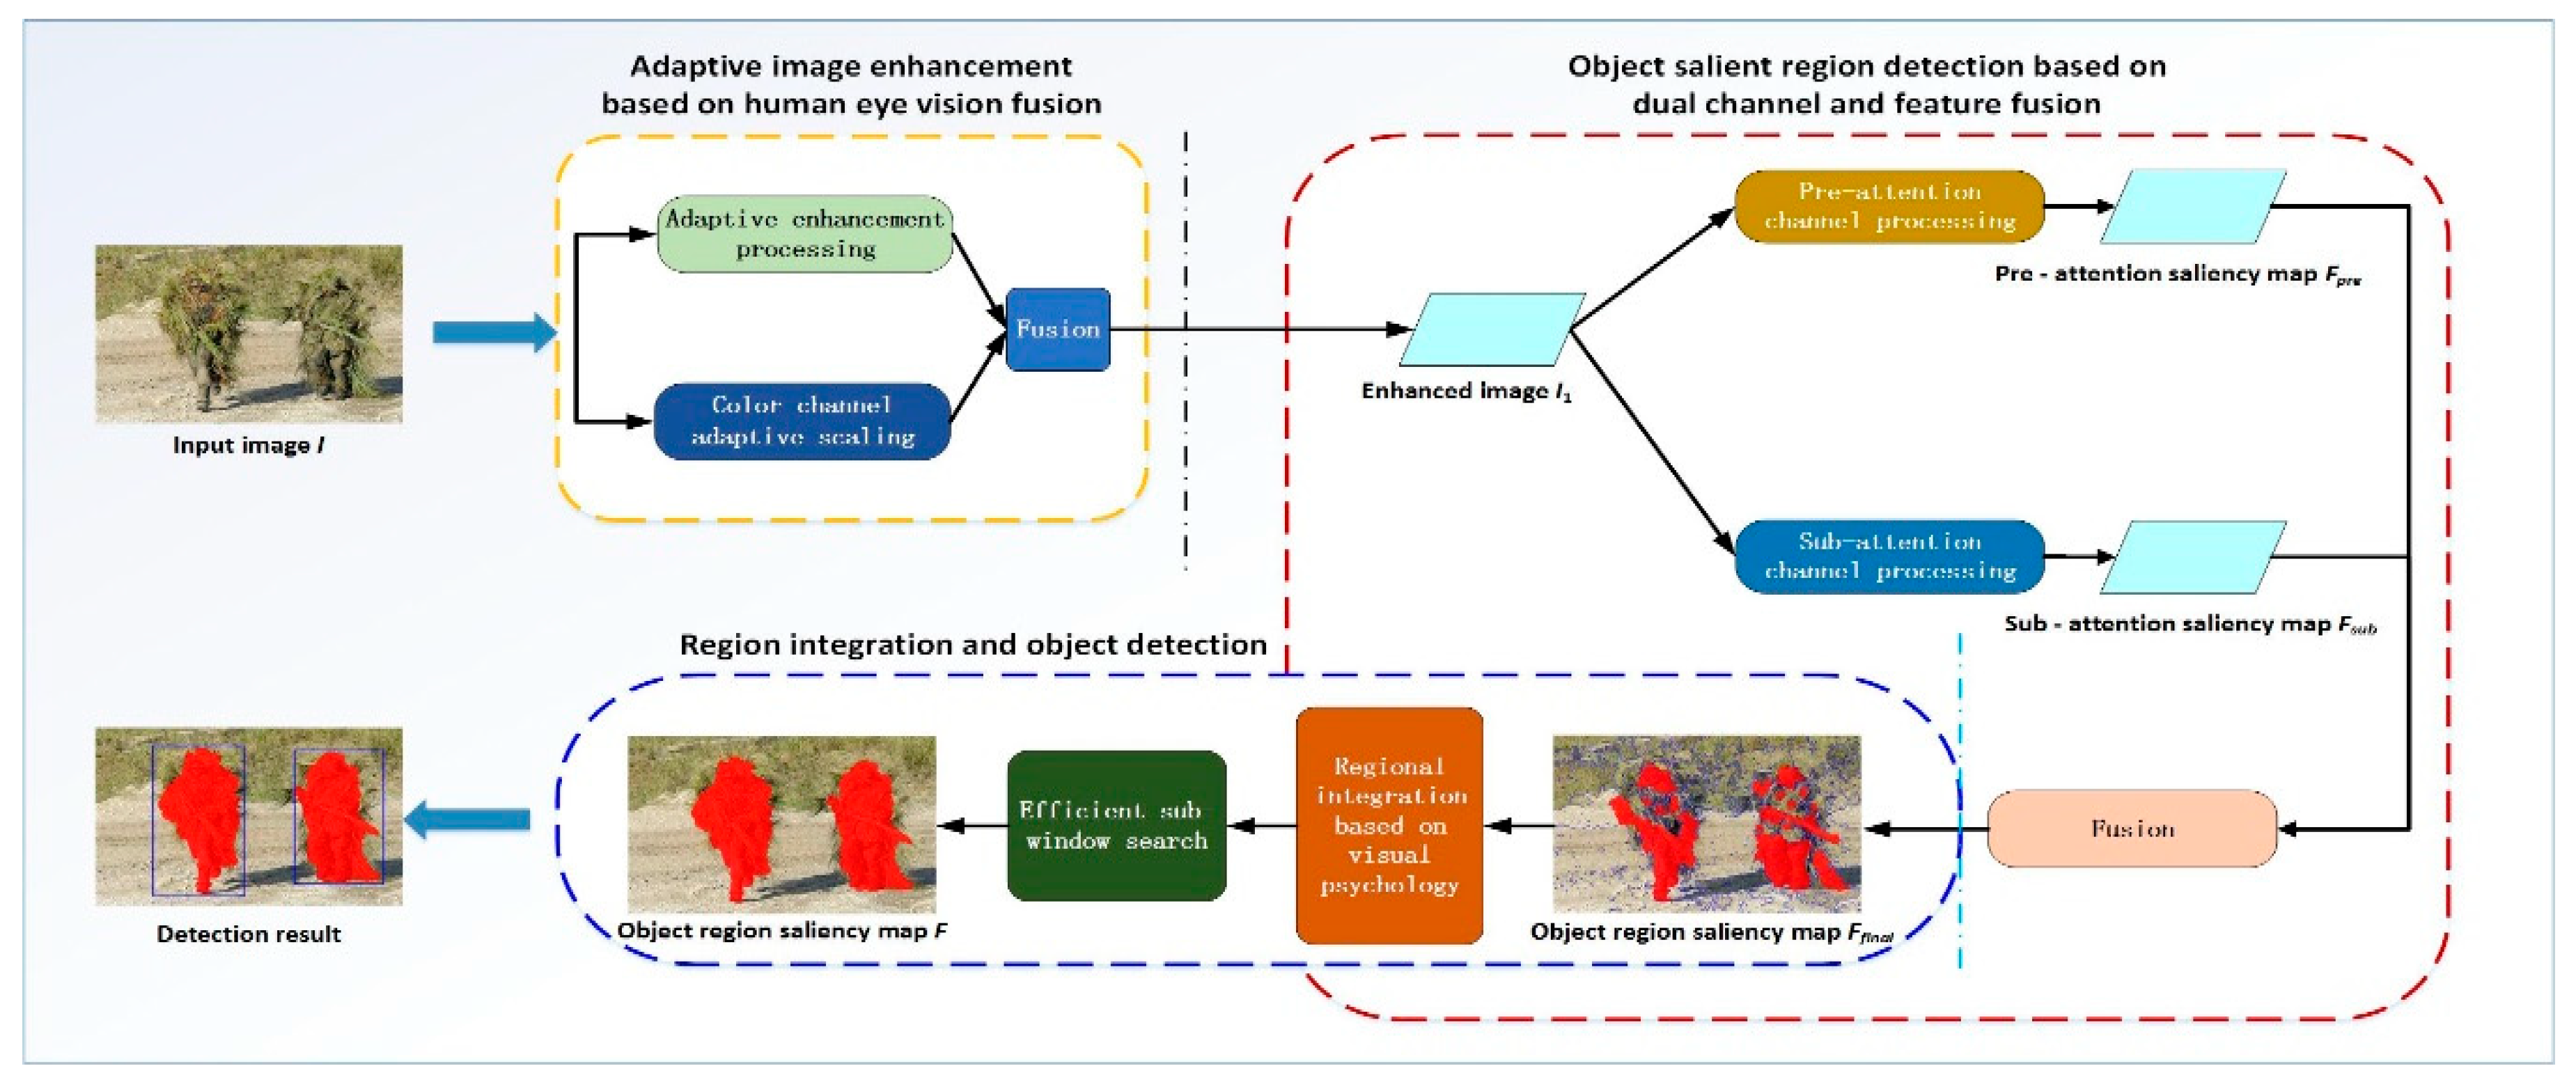
2. Our Model

The part of the cerebral cortex that is mainly responsible for processing visual information is the visual cortex, which includes a primary visual cortex (V1, also called “star irate cortex”) and an extra cortex (such as V2, V3, etc.). As the first area to perform visual processing, V1 mainly receives electrical signals that are related to appearance perception, and the response results are further transmitted to higher-level visual cortex areas, such as V2 for processing [23]. The (a) [24] in Figure 1 shows the hierarchical structure of the cerebral visual cortex. Inspired by the visual cortex structure and Gestalt visual psychology, this paper established a three-layered spatial object detection model: the local salient regions of the object can be quickly detected, and then the detection results are simplified and fused layer by layer, thus making it a whole object that is perceptually easy to detect and process. The (b) in Figure 1 shows the hierarchical structure of our model.
The overall structure of our model proposed in this paper is shown in the Figure 2. The given input image that I can be dealt with, as follows:
(1)
the image is effectively enhanced by a method based on human eye vision fusion [25] (yellow border section);
(2)
a saliency region detection model based on dual channel and feature fusion (red border section) is established, wherein the pre-attention channel processing obtains the pre-attention saliency map Fpre, the sub-processing channel processing obtains the sub-attention saliency map Fsub; then, the two channel detection results are fused to obtain the final saliency map Ffinal; and,
(3)
using Gestalt’s main theory of visual psychology as a constraint condition (blue border section), the candidate salient regions that are obtained are integrated to achieve an object segmentation result map F with overall perception. Then, the object (blue border section) is detected and screened by using an efficient sub-window search method to determine the region where the object is located.

3. Salient Region Detection Based on Double Channel and Feature Fusion

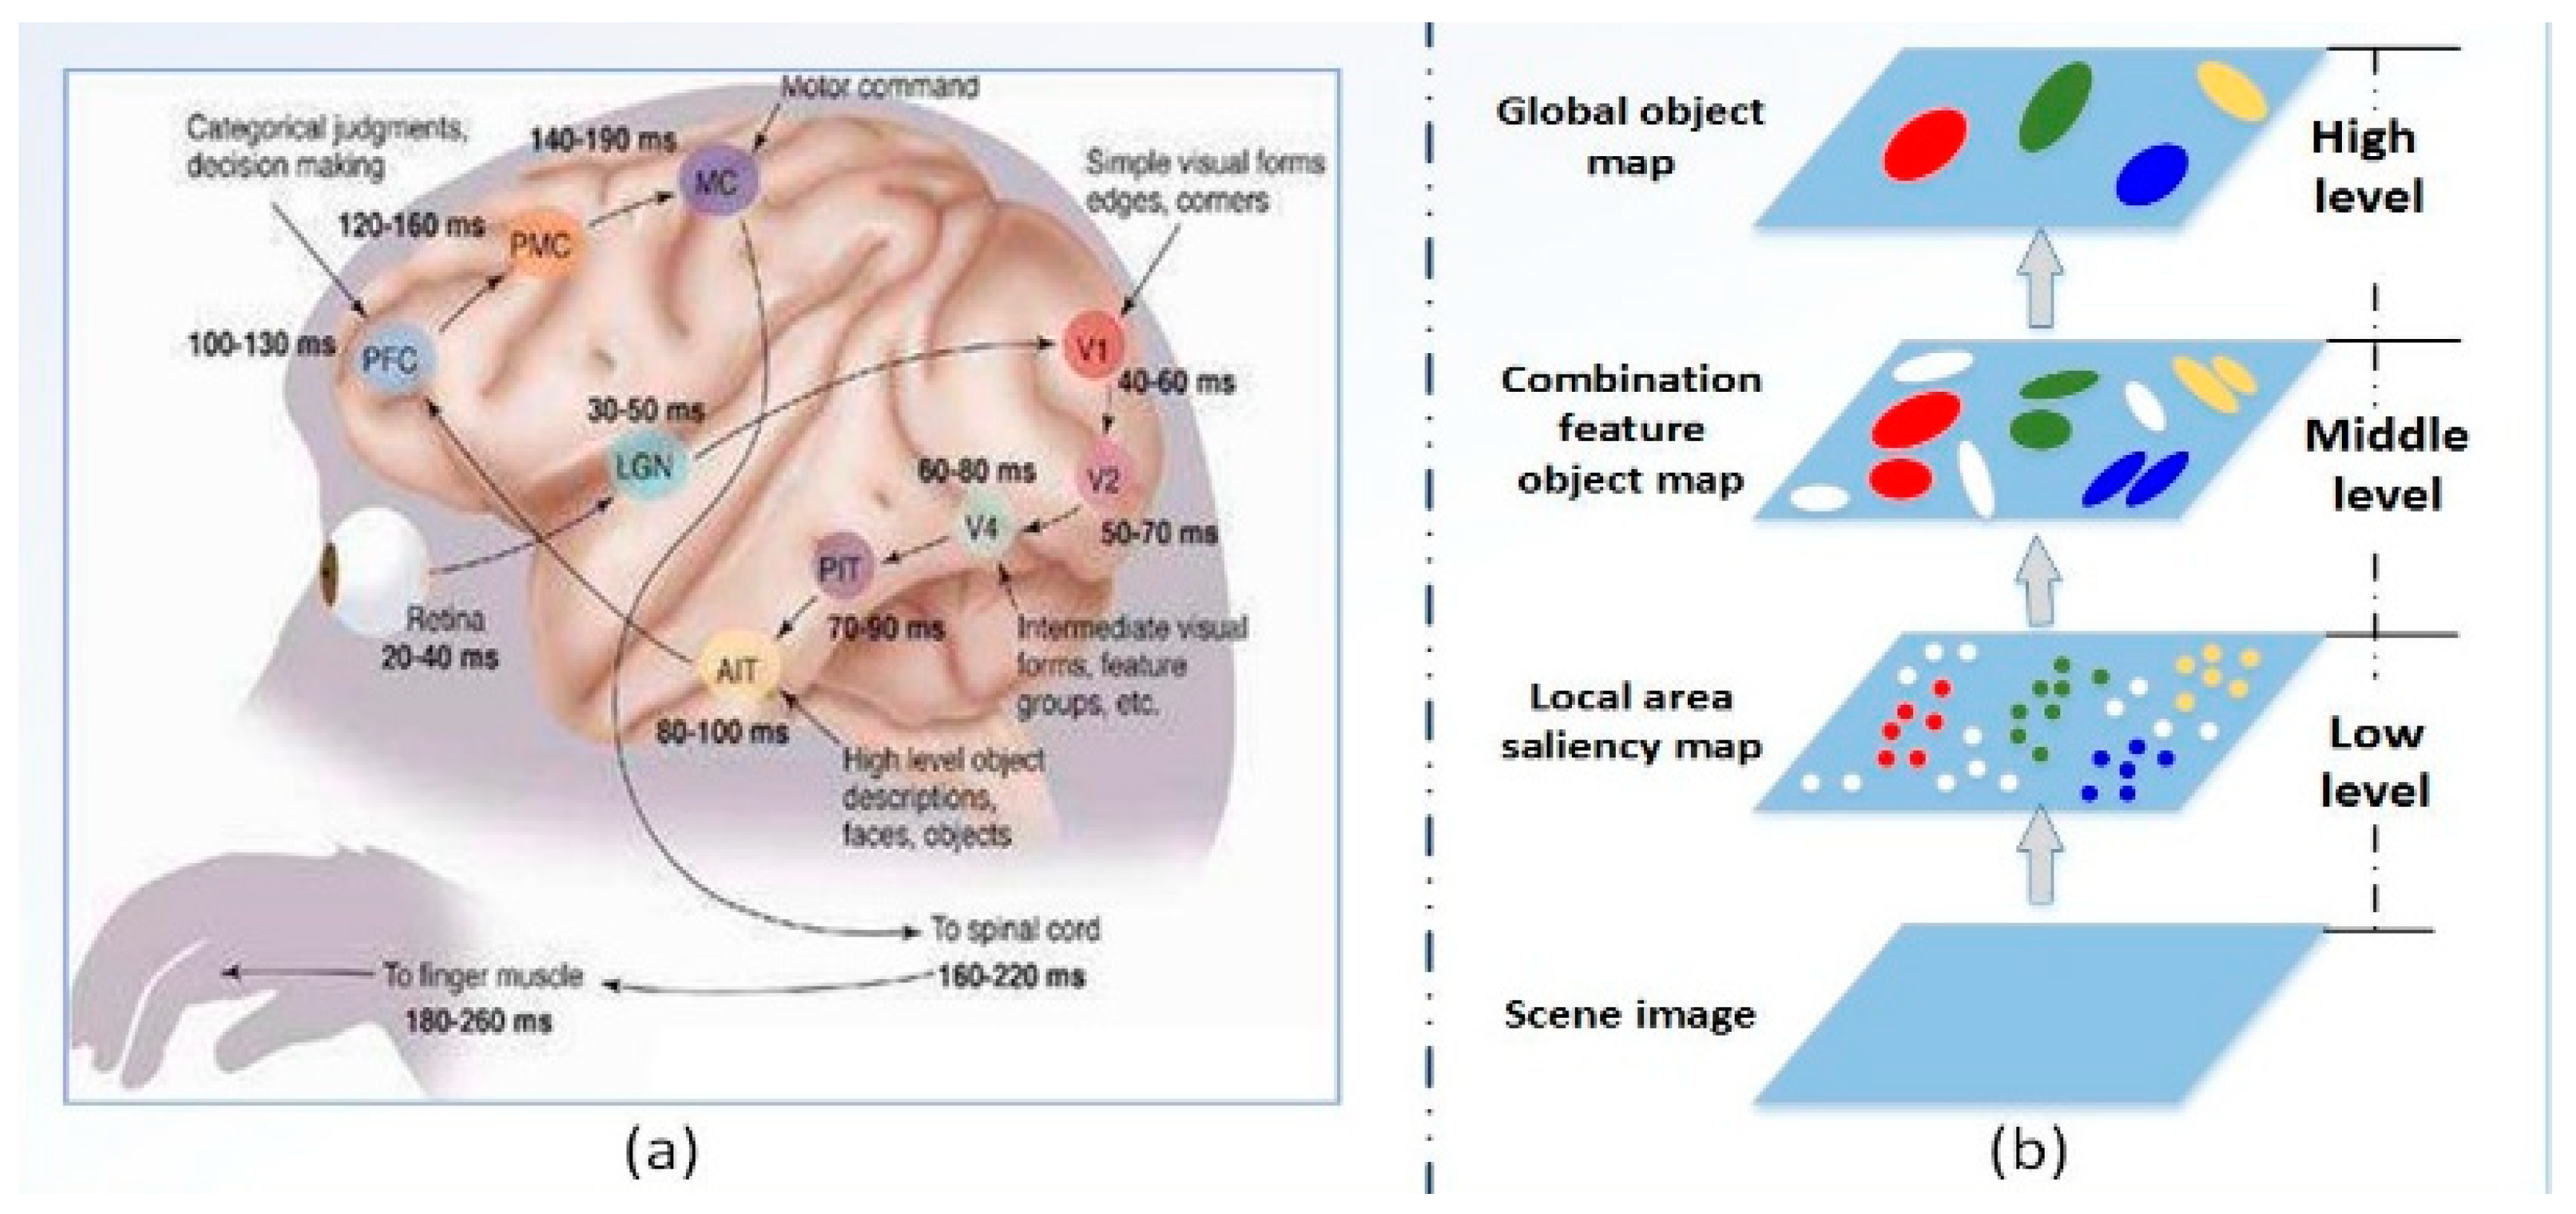
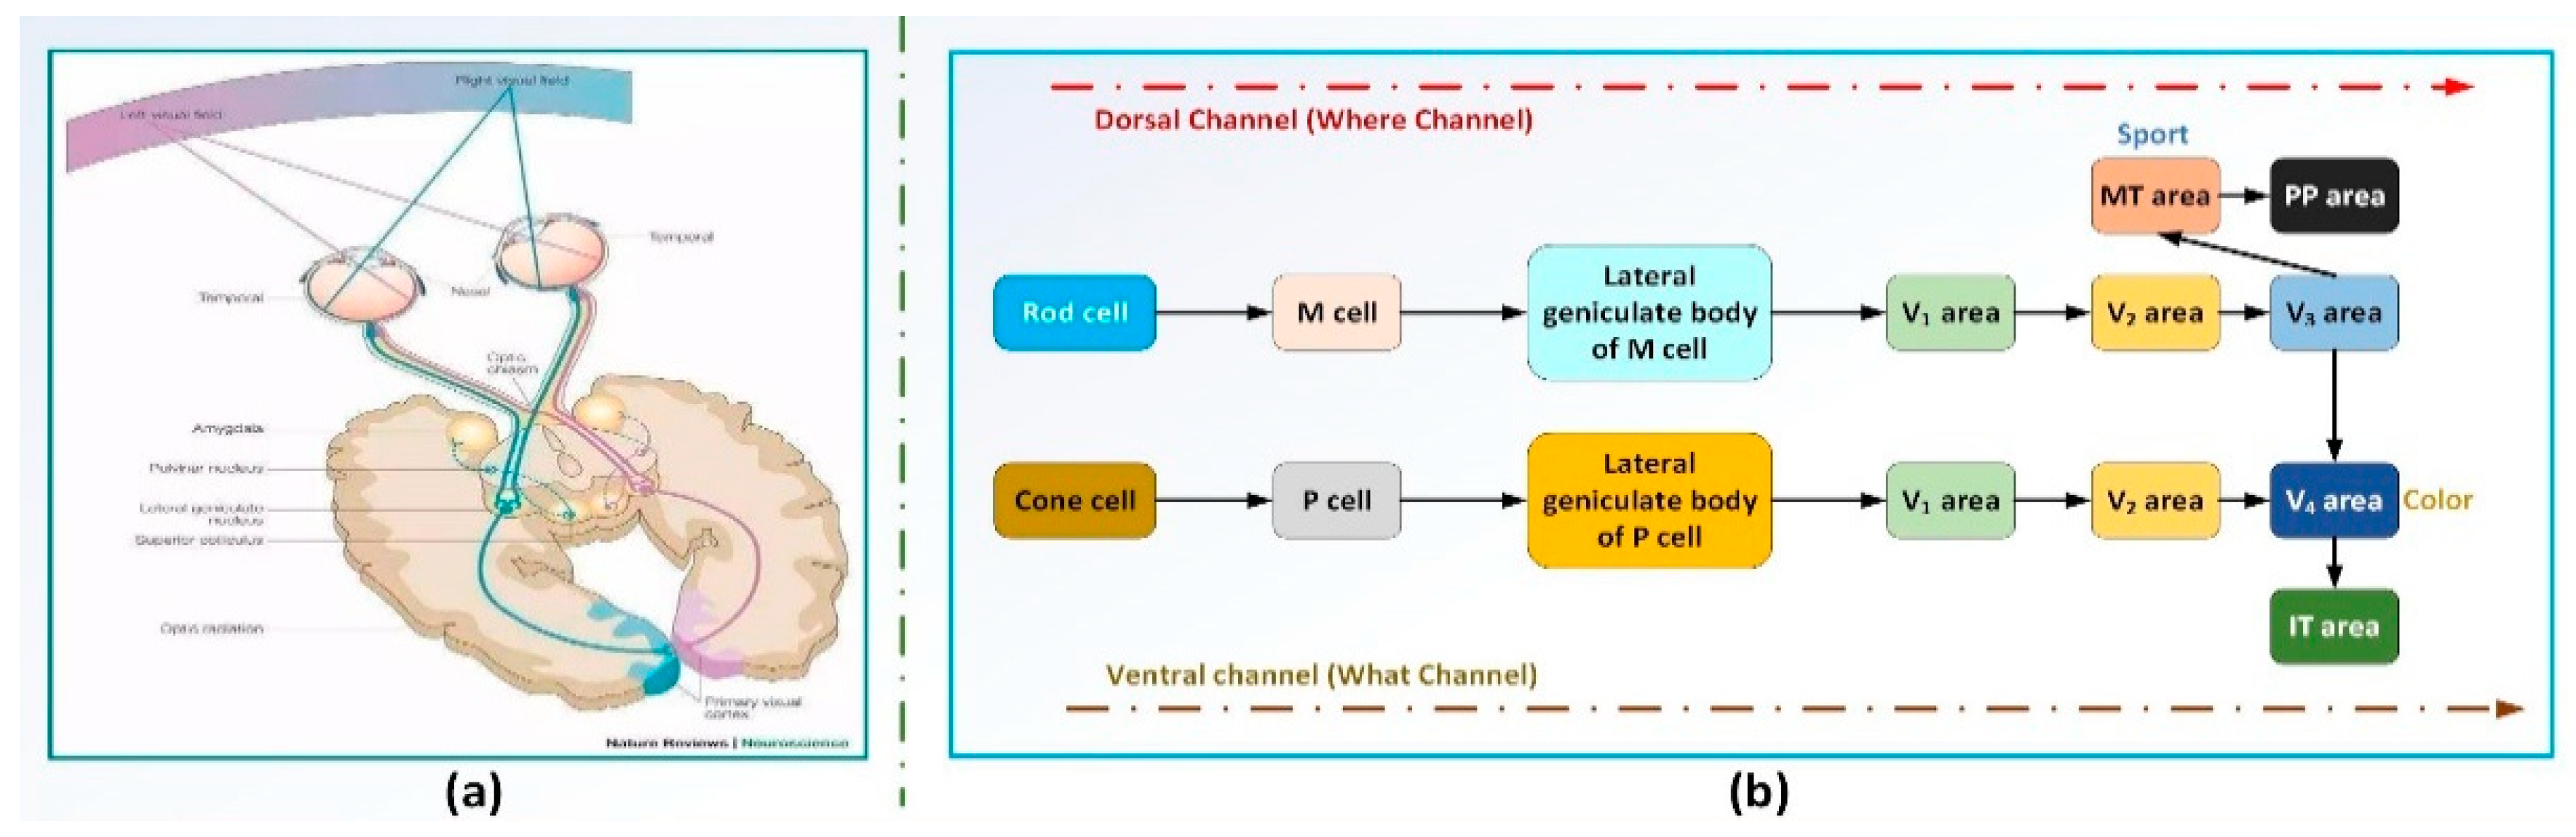
3.1. Human Visual Perception and Processing System

After long-term evolution and development, human eyes have formed an exquisite visual perception and processing system, which can quickly filter, process, and analyze the surrounding visual information. Neurobiology research shows that, in the process of perception of visual information, the visual information that is received is mainly analyzed and processed in two kinds of neural pathways: ventral channel and dorsal channel. Ventral channel, also called “What Channel”, is mainly responsible for the cognition of object information and it can identify features, such as shape and color. The dorsal channel, also called, “Where Channel”, is responsible for the movement and spatial information like the movement and position of objects [26], as can be shown in Figure 3.

3.2. Salient Region Detection Model Based on Dual Channel and Feature Fusion

In the process of forming visual attention, there are mainly two kinds of attention selection mechanisms. One is bottom-up attention and is mainly driven by the underlying data. Under unconscious control, this mechanism belongs to a lower level of visual cognition and it has a faster processing speed. The other one, also called task-driven visual attention, is top-down attention and is greatly influenced by prior knowledge, tasks, and expectations. It emphasizes the dominant role of consciousness and it belongs to the high-level information processing and perception. In the process of visual information processing and analyzing, the bottom-up and top-down visual attention processes coordinate with each other to realize effective perception of external environmental information [28].
Inspired by human visual perception and processing, this paper proposes a new saliency region detection model that is based on dual channel and feature fusion, as shown in Figure 4. This model establishes a pre-attention channel to simulate the “Where Channel” of the visual system to process information on the position and contrast information of images. Then, it uses a sub-attention channel to simulate the channel, integrate the primary visual feature information in the image, and carry out significant calculation. Finally, the pre-attention channel and the post-attention channel are significantly integrated, and the gaze region is determined according to the final saliency measurement result.
This model mainly includes the following three aspects:
(1)
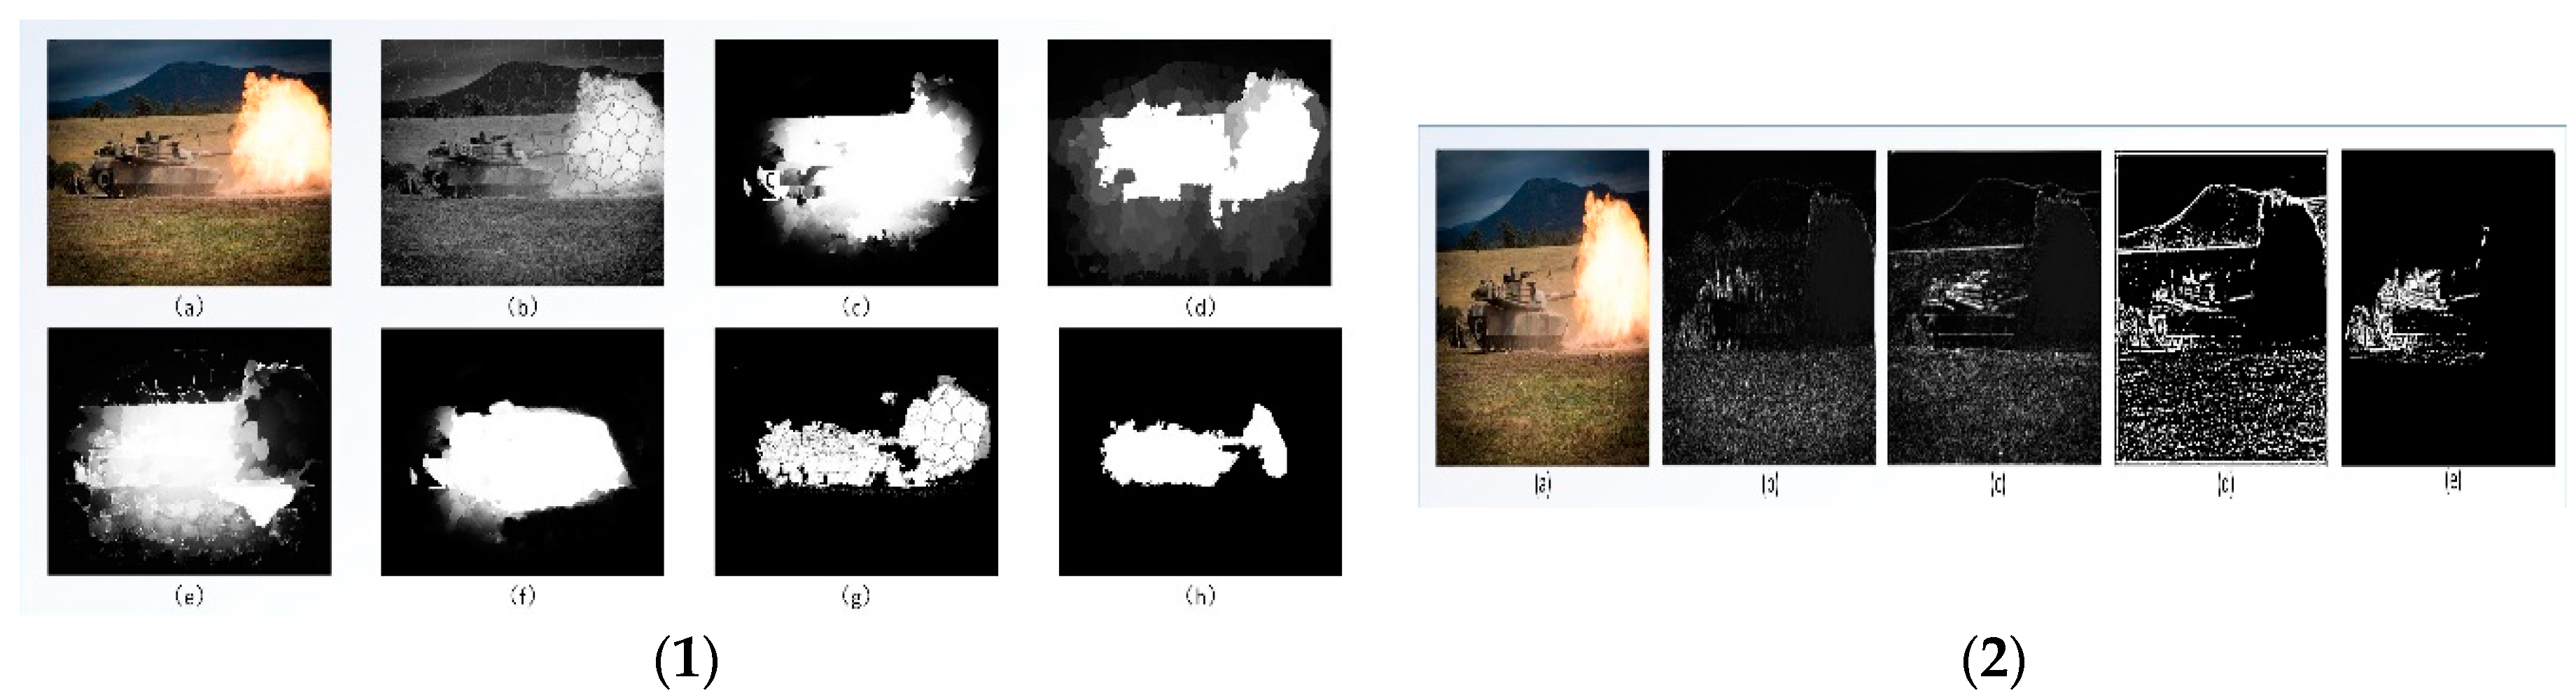
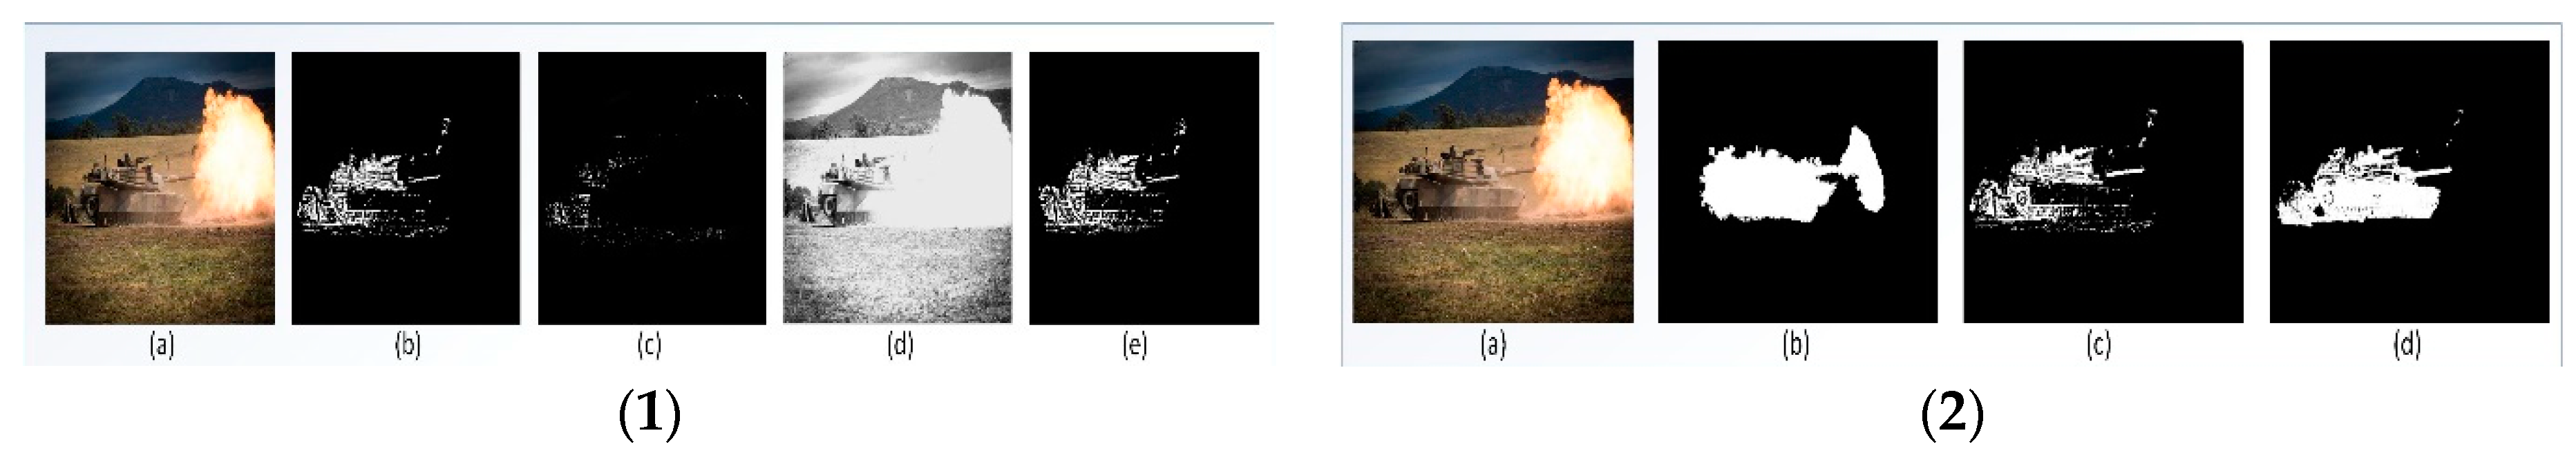
Pre-attention channel processing. First, the SLIC super pixel segmentation [29] is performed on the color image, and then sigma features of each region are extracted [30]. While considering the influence of neighborhood contrast, background contrast, spatial distance and region size, a local saliency map is generated, and then the over-all density estimation of each region is extracted to construct a global saliency map. Finally, the local and global saliency maps are fused by exponential weighting to construct a saliency map Fpre.
(2)
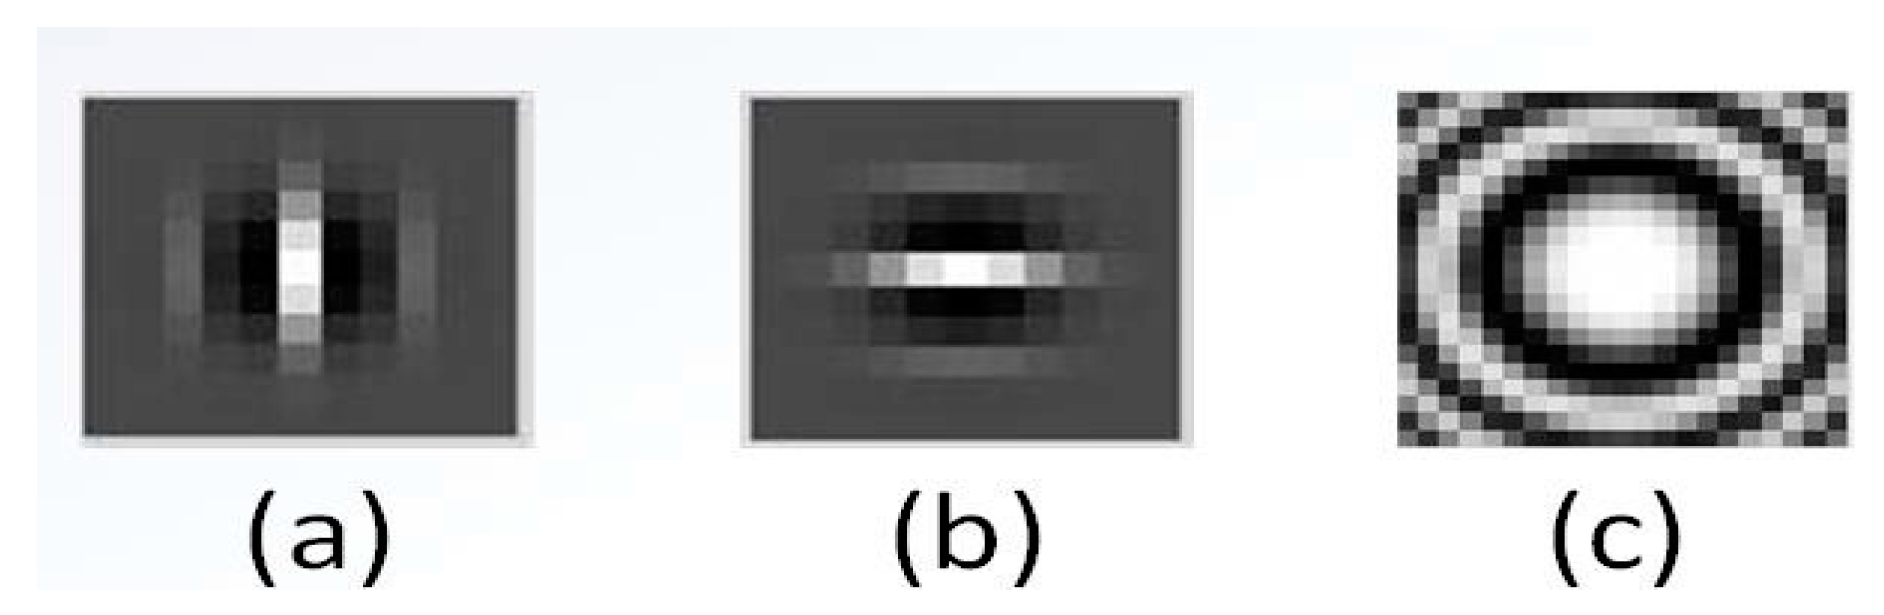
Sub-attention channel processing. Firstly, multi-resolution processing is carried out on the input image by using a variable-scale Gaussian function to establish a Gaussian pyramid [31]. Then, the color space of the image is transformed according to the color antagonism mechanism. After that, information on such features as color, brightness, and texture orientation of potential objects’ image region is fed back by the pre-paid attention path to be extracted on multiple scales, which leads to the generation of the corresponding feature map by using the central peripheral difference [32] operation. Finally, the saliency of each primary visual feature is measured through inter-layer Gaussian difference processing [33], and the saliency of each feature is integrated between layers, and the saliency map Fsub is calculated by combining the weighted summation method.
(3)
Normalizing the pre-attention saliency map and the post-attention saliency map, merging the pre-attention channel and the sub-attention channel, and identifying a salient object region according to the total saliency map Ffinal.
Because the processing time of the pre-attention channel is much lower than that of the sub-attention channel, the results of the pre-attention channel can effectively guide the detection of the sub-attention channel, rendering the two channels to operate side by side.

3.2.1. Pre-Attention Channel Based on Fused Saliency Map

SLIC (simple linear iterative clustering), which is a simple linear iterative clustering, is a simple and easy-to-implement algorithm proposed in 2010. It converts color images into CIELAB color space and five-dimensional feature vectors in the X and Y coordinates. Then, it constructs distance metrics for five-dimensional feature vectors and performs local clustering [30]. The SLIC algorithm can generate compact, nearly uniform super pixels, and it has a high comprehensive evaluation in terms of computation speed, object contour retention, and super pixel shape, which is in line with the desired segmentation effect.
Since the regional covariance can naturally fuse multiple related features, the covariance calculation itself has filtering ability and high efficiency. Therefore, this paper uses the regional covariance [34] feature to perform image local saliency detection. The following five features are extracted for each image pixel: the image grayscale, the first and second degree norms of the x and y directions, so each pixel is mapped to a fi e-dimensional feature vector:
F ( x , y ) = [ I ( x , y ) , | I ( x , y ) x | , | I ( x , y ) y | , | 2 I ( x , y ) x 2 | , | 2 I ( x , y ) y 2 | ] T  
Here, I is the gray level of the image and the image gradient is calculated according to the referencing material [35]. The covariance matrix of the region R is calculated as Equation (2).
{ C o v R = 1 N ( R ) i = 1 n ( F i μ ) T ( F i μ ) μ = 1 N ( R ) i = 1 n F i  
In the equation, μ is the mean of the region feature vectors and N (R) represents the number of pixels in the region R. In order to enable the regional covariance to better reflect the image region characteristics and to facilitate the calculation of similarity, C is the covariance matrix of d × d dimension, and the Sigma feature is introduced [36]:
s i = { α d L i , i f 1 i d α d L i , i f 1 + d i 2 d  
In the equation, Li is the i-th column of the matrix L, Area = LLT, α is a coefficient, the mean of the d-dimensional vector is introduced, and the Sigma eigenvector of Area enhancement is Equation (4):
ψ A r e a = ( s 1 + μ , s 2 + μ , , s 2 d + μ ) T  
The local saliency of the region Ri is defined as the spatial distance weighted average of the enhanced Sigma features of the region Ri and its neighboring regions, as shown in Equation (5):
S c ( R i ) = 1 m K R j N b exp ( R i R j 2 σ 1 2 ) · D ( ψ R i , ψ R j )  
In the equation, Rj belongs to the neighborhood of the region Ri; m is the number of neighborhood regions; K is the normalization factor; the sum of the spatial distance weighting coefficients is guaranteed to be 1; R i R j is the Euclidean distance between the centers of the two regions. What is more, σ1 controls the effect of inter-region distance on local saliency, and the larger the σ1, the greater the influence of the distant block on the saliency of the current block. ψRi represents the enhanced Sigma characteristic of the region Ri, and D ( ψ R i , ψ R j ) is the Euclidean distance of ψRi and ψRj. In general, when human eyes observe the surrounding information, more attention will be paid to the central area in the field of view. When the two adjacent areas are compared, the large area should have a greater influence on the current area. At the same time, a significant object area has not only a high local contrast, but also a background area. The domain differences are salient [30]. When the effects of neighborhood contrast, background contrast, spatial distance, and region size are taken into consideration, the local saliency of the improved region Ri is Equation (6):
S l ( R i ) = 1 m K R j N b & b g exp ( R i R j 2 σ 1 2 ) · N ( R j ) N ( I ) D ( ψ R i , ψ R j )  
In the equation, N(Rj) represents the number of pixels in the region Rj, N(I) represents the number of pixels of the image, and Rj belongs to the neighborhood of the current region and the boundary region of the image. The probability that the gray value of each region appears might indicate the global saliency of the region, and the object region with a low probability of occurrence means more salient, and conversely, it may be the background region. Therefore, it is possible to use the kernel density estimation of the entire image region feature to calculate the overall saliency, specifically:
{ S g ( R i ) = i = 1 M j = 1 M κ ( I R i I R j ) j = 1 M κ ( I R i I R j ) κ ( I R i I R j ) = exp ( I R i I R j 2 σ 2 2 )  
Here, κ(x) is a Gaussian kernel density function, IRi represents the average gray level of the region, and m is the number of image regions. Given that the local saliency is usually better than the overall saliency and that the exponential function can increase the importance of local saliency, the equation of the pre-attention channel saliency map that was obtained by combining local and global saliency maps is designed, as Equation (8):
F p r e = S g ( R i ) × exp ( σ 3 × S l ( R i ) )  
Among them, σ3 controls the importance of a local saliency map. The fusion saliency map can ensure that the object area is both locally salient and globally salient, which is beneficial to reduce the influence of background clutter in subsequent object detection and segmentation. There are altogether seven parameters of the channel saliency map: ns (num super pixels), CP (comparison), σ1, σ2, σ3, C, and ra (ratio). Among them, ns and CP are parameters of SLIC method, ns is the number of super pixels, and the smaller the value is, the larger the super pixel block there will be. CP indicates the shape of the super-pixel, and the smaller the value is, the higher consistency there is between the super pixel block and the region block boundary. ns and CP need to be adjusted according to different images. σ1 = 3, σ2 = 10, σ3 = 6, C = 2000, ra > 0.5.

3.2.2. Sub-Attention Channel Based on Gaussian Pyramid and Feature Fusion

The retina of the human eye samples the image information unevenly. The resolution of the central region is higher, while the resolution of the peripheral region is lower. The visual perception and processing system uses the interaction between the receptive field and the integrated field to represent image information in multi-resolution. In many cases, features that are not easy to see or acquire in one scale can be easily found or extracted in another scale [37]. According to this mechanism, before each primary visual feature is processed, multi-scale representation of the image is required, and then the central peripheral difference is calculated through the interlayer subtraction operation to generate the corresponding feature map. We use the Gaussian function with variable parameters to process the input image to obtain the Gaussian pyramid of the image. The images of each layer are obtained by Gaussian filtering with different scales instead of changing the resolution of the input image itself. The initial value of standard deviation σ of the Gaussian filter used in this paper is 3 and the image is processed with 2 as multiple to generate images of different scales. Defining the pixels of the input image as I (i, j) and the number of layers of the Gaussian pyramid as k (k = 0, 1, 8), the image of the k-th layer can be derived from the Equation (9):
I k ( i , j ) = w ( m , n ) k I ( i , j )  
Here, w(m, n)k is the Gaussian function used in the k-layer image and ⨂ represents convolution operation. After multi-scale representation of the image, the color, brightness and direction characteristics of each layer of the image need to be extracted, and then the feature map of the image at each scale can be obtained. The human eye is able to detect significant objects with various characteristics, as shown in the Figure 5.
The brightness characteristics of the images of each layer of the Gaussian pyramid can be obtained by Equation (10):
I ( k ) = ( r ( k ) + g ( k ) + b ( k ) ) 3  
In the equation, r(k), g(k), and b(k) represent red, green, and blue color channels, respectively. In some scenes, brightness features are used to enhance saliency, which means that areas with high brightness have strong saliency. However, experiments show that, in battlefield environments, the brightness of objects is generally lower than that of the environment, and therefore brightness features are used to play an inhibitory role in the saliency measurement in this paper. For color features, it is feasible to simulate the color perception process of the human eye according to the color antagonism theory, while using the red-green (RG) and blue-yellow (BY) color models [33] for calculation. In the k-th layer image, the RG color feature MRG(k) and the BY color feature MBY(k) are calculated by Equation (11).
{ M R G ( k ) = r ( k ) g ( k ) max ( r ( k ) , g ( k ) , b ( k ) ) M B Y ( k ) = b ( k ) min ( g ( k ) , r ( k ) ) max ( r ( k ) , g ( k ) , b ( k ) ) M c o l o r ( k ) = max ( M R G ( k ) , M B Y ( k ) ) M R G ( k ) = M B Y ( k ) = 0 , i f max ( r ( k ) , g ( k ) , b ( k ) ) < 0.1  
Since the Gabor function can achieve better results in acquiring the directional features, a two-dimensional Gabor filter is used to extract the texture and directional features of the image. The mathematical expression of the two-dimensional Gabor function [33] is shown in the Equation (12).
g ( x , y , λ , θ , ψ , σ , γ ) = exp ( x 2 + γ 2 y 2 2 σ 2 ) exp ( i ( 2 π x λ + ψ ) )  
In the equation, x, y represent pixel coordinates, x′ = xcosθ + ysinθ, y′ = −xsinθ + ycosθ, λ represents the sine function wavelength; θ represents the direction of the kernel function; ψ represents the phase offset; σ represents the Gaussian function Standard deviation; and, γ represents the ratio of width to height of space. Analysis of the shape characteristics of the military object itself leads to the finding that the main texture of the military object is a vertical and horizontal straight line, as well as a circular or circular curve. To this end, we designed three Gabor convolution kernels (as shown in Figure 6), including vertical-direction kernel, a horizontal-direction kernel, and a symmetric circular kernel, to extract the texture and directional features of the image through convolution operation.
The central peripheral difference refers to the difference between images of different layers of the Gaussian pyramid, which is realized by subtraction of images without neglecting scale. For the peripheral layer with a smaller number of pixels, interpolation processing is needed so that the number of pixels is equal to the corresponding central layer, and subtraction operation is performed for each pixel point [33]. Then, the luminance characteristic map is derived from the Equation (13).
M I ( c , c + s ) = | I ( c ) I ( c + s ) |  
Here, c and c + s represent the number of layers of the image, c ∊ {3,4,5}, s ∊ {3,4}, which represents the subtraction operation between images of different layers. The color feature map Mcolor can be generated, as Equation (14):
{ M R G ( c , c + s ) = | ( R ( c ) G ( c ) ) ( G ( c + s ) R ( c + s ) ) | M B Y ( c , c + s ) = | ( B ( c ) Y ( c ) ) ( Y ( c + s ) B ( c + s ) ) | M c o l o r ( c , c + s ) = max ( M R G ( c , c + s ) , M B Y ( c , c + s ) )  
In the equation, MRG (c, c + s) and MBY (c, c + s), respectively, represent the color feature maps of the red-green channel and the blue-green channel. The direction feature map is calculated according to the Equation (15).
M o r i ( c , c + s , θ ) = | ο ( c , θ ) ο ( c + s , θ ) |  
θ is the positive direction of Gabor filter output, ο ( c , θ ) represents the directional feature map in θ direction when the scale space is c. After obtaining the feature maps, the saliency of each feature map can be measured by the following Equations (16) and (17).
D O G ( x , y ) = c e x 2 2 π e x 2 exp [ x 2 + y 2 2 e x 2 ] c i n h 2 2 π i n h 2 exp [ x 2 + y 2 2 i n h 2 ]  
N ( M ( c , c + s ) ) = ( M ( c , c + s ) + M ( c , c + s ) D O G C )  
Here, DOG(x,y) represents a Gaussian difference function; N(M(c,c+s)) is a saliency measure function; e x and i n h represents the bandwidths of stimulation and suppression parameters, which are set to be 0.02 and 0.25; and, the three constants of cex, cinh, and C were set to be 0.5, 1.5, and 0.02. Using the above-set parameters for 10 iterations, a feature saliency map can be produced. The feature saliency maps of the different features of each layer image also need to be integrated to obtain saliency maps of interlayer features in terms of brightness, color, and texture direction respectively. represents the operation of expanding the matrix and summing it up one by one.
{ F I = N ( C = 2 4 S = 2 4 N ( M i ( c , c + s ) ) ) F c = N ( C = 2 4 S = 2 4 N ( M c o l o r ( c , c + s ) ) ) F o = N ( θ C = 2 4 S = 2 4 N ( M o ( c , c + s , θ ) ) )  
The traditional algorithm linearly superimposes the multi-feature saliency map, while Gestalt does not take the whole as the sum of each part. Therefore, we use the non-linear combination of multi-feature images and using the minimum F–norm [37] to constrain and obtain the most competitive local saliency region. The F-norm of the matrix A is expressed by Equation (19), and the nonlinear combination mode of the characteristic image expressed by Equation (20) is determined by the parameter θ1 = (a, b, c1, e, g, h). Where a, b, c1 are simplified parameters, a, b, c1 ∊ {1, 2, 3}, e, g, h are combined parameters, e, g, h ∊ {−1, 1}. The combination parameter value of −1 indicates that the feature region under this attribute has a negative effect on the extraction of the best salient region, while the value of 1 indicates that the feature region under this attribute has a positive effect on the extraction of the best salient region. As shown in the Equation (21), the nonlinear combination parameter of the salient region corresponding to the feature is obtained by using the minimum F-norm. This generates the gross salient map of the post-processing path, which has the strongest salient and ensures that the salient region corresponding to the nonlinear combination feature is sufficiently sparse.
A F = i j a i j 2  
F s u b = e F I a + g F c b + h F o c 1  
θ 1 = arg min θ 1 F s u b ( θ 1 ) F  

3.2.3. Gross Saliency Map

The salient map of the pre-attention channel and the sub-attention channel is integrated by Equation (22).
F f i n a l = η 1 F p r e F p r e max η 2 F s u b F s u b max  
In the equation, F p r e max and F s u b max are the maximum values of F p r e and F s u b , η1 and η2 are weight parameters. “°” represents an arithmetic symbol. Based on experimental tests, we use “+” as the arithmetic symbol to perform non-maximum suppression operations. Through experimental statistics, the conclusion can be drawn: the best fusion effect can be obtained when weights η1 = 0.326, η2 = 0.674.

4. Regional Integration of Visual Overall Perception Based on Gestalt

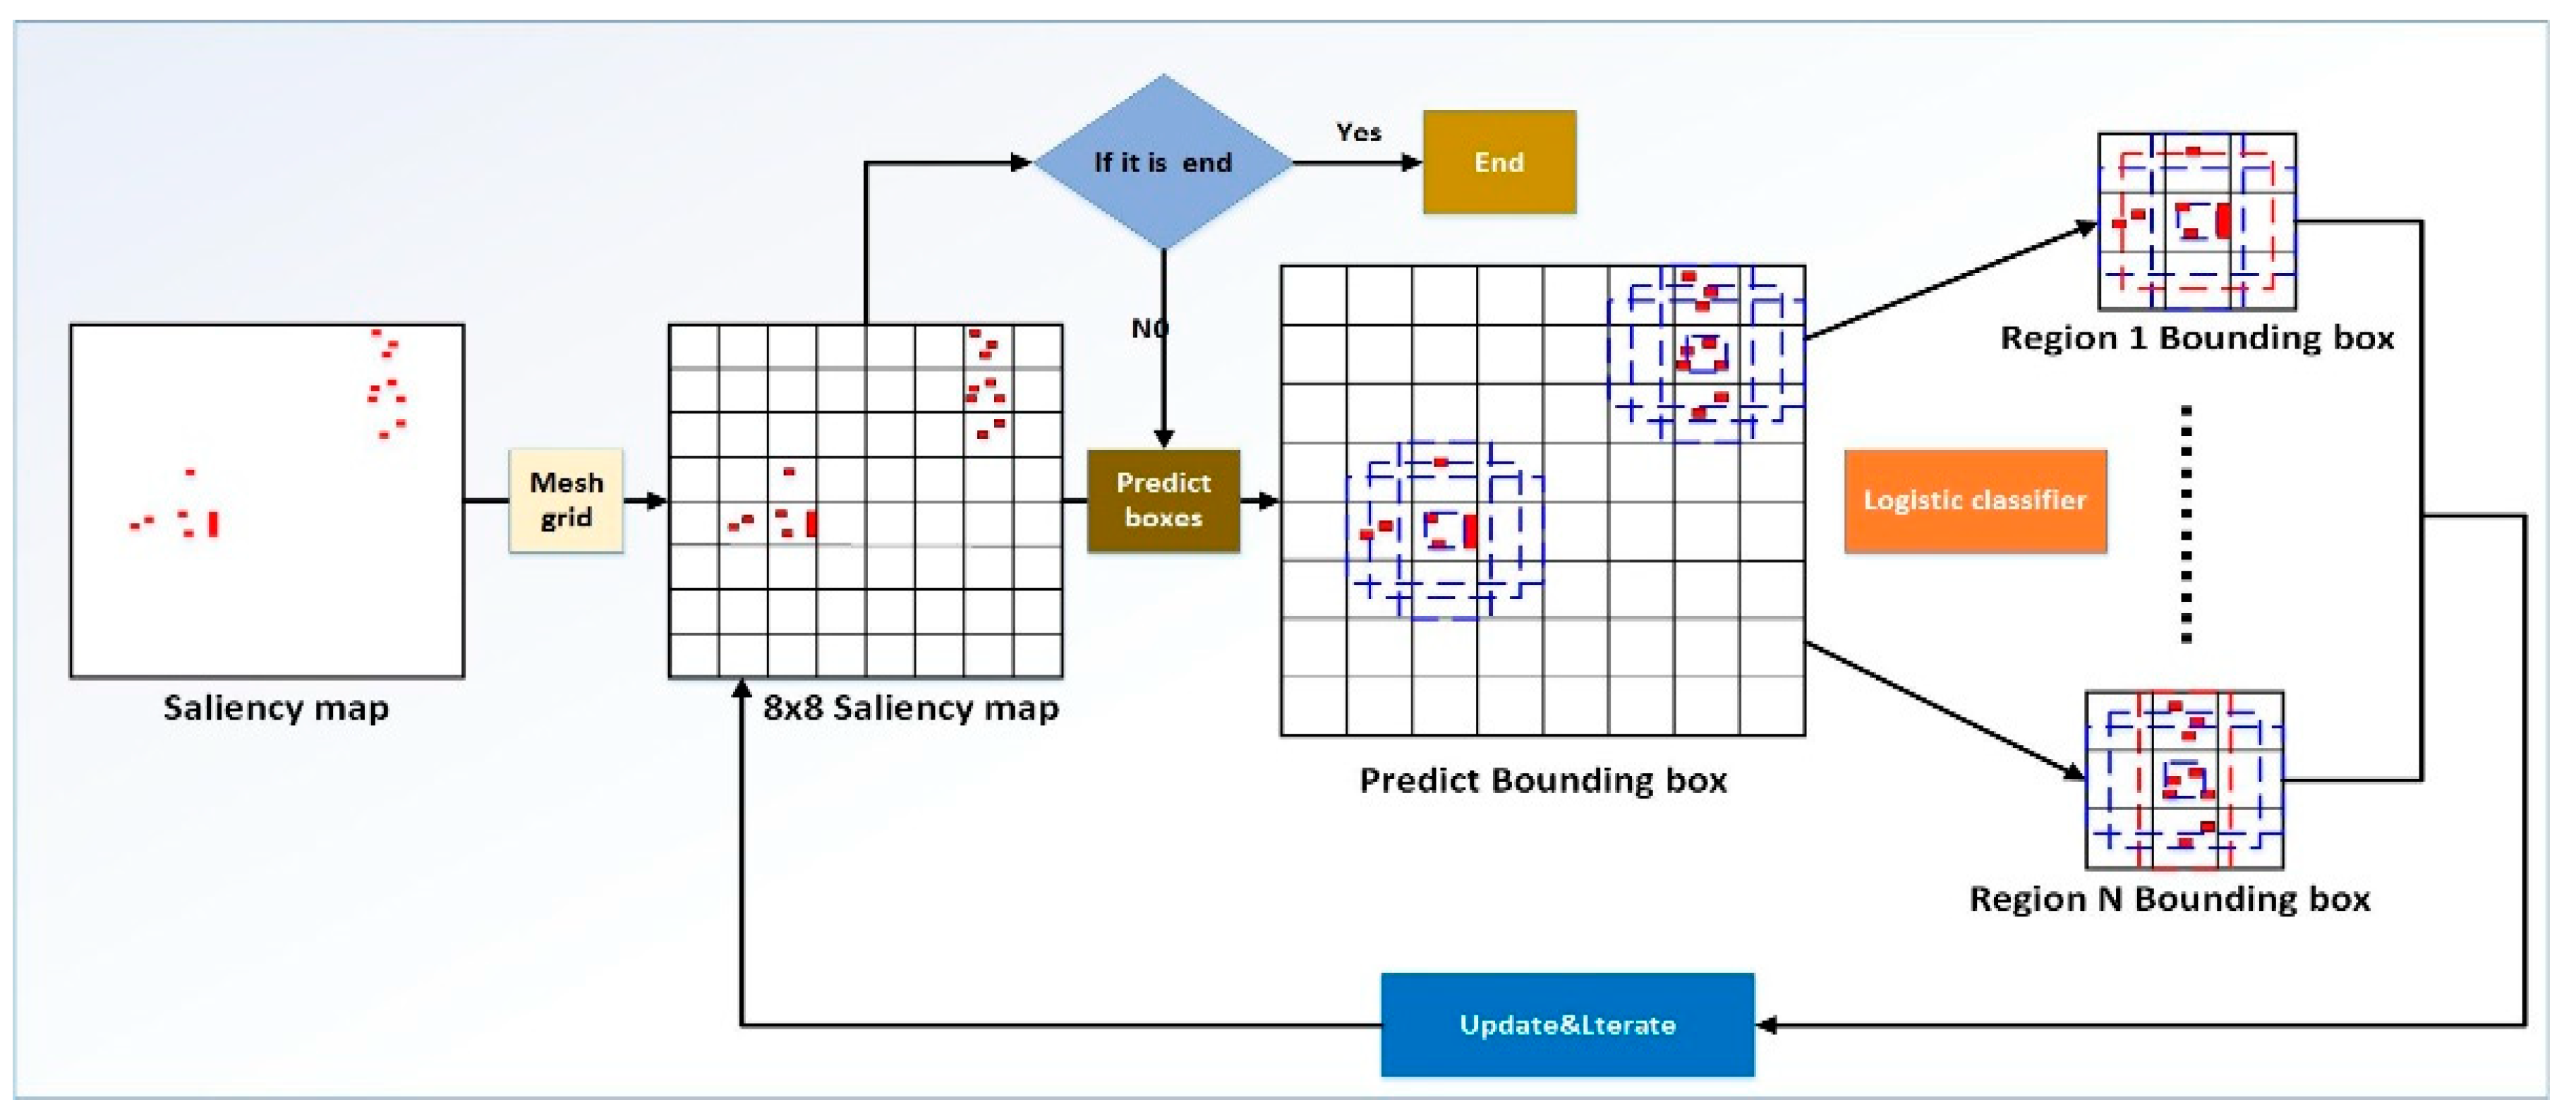
4.1. Efficient Sub-Window Search

Based on the above-explained methods, a saliency map of the image comes into being in which the value of pixels is the assessment of the saliency of the input pixel. The higher the pixel value is, the stronger the saliency can be. Accordingly, this paper proposed an efficient sub-window search algorithm, and the result of high efficient sub-window search is the encircling box that holds the object with the specific algorithm procedure demonstrated in Figure 7.
The saliency map is divided into an equal rectangle area according to the 8 × 8 grid, and the sum of pixel values in each rectangle is counted and the threshold is set. The center block of each region is constituted by 3 × 3 rectangles that form the object screening area. In the same object screening region, if multiple rectangular regions meet the requirements set by the pixel value, then the largest one is taken as the center of the region. If the center of the region is selected to be the large square edge, then the object screening area of the 3 × 3 can be formed by adding the small square of the same size blank. In the object screening area, the center of object screening area serves as the center, and four prediction bounding boxes with different width-height-length ratios are constructed according to different aspect ratios. Afterwards, the best object area bounding box is selected through the comparison of the construction index (pixel value, proportion and area) in each prediction bounding box. Thus, comes the total pixel value sumpxi of rtgi in the rectangular area of the saliency map after grid division.
s u m p x i = j r t g i p x j  
The pxj represents the pixel value of the j pixel in the rtgi area. The larger the sumpxi value is, the greater the saliency of rtgi in the rectangular area can be. Recognizing the saliency object area as the center accords with how human eyes’ cognize the block domain. We choose the threshold of pixel value adaptively through the two order difference method to complete the initial screening of the regional center blocks. The two order difference can represent the changing trend of the discrete array and can be used to determine the threshold in a set of pixel values. A saliency map is detected by default to get 64 candidate regions, and at last, each candidate region gets one overall pixel value sumpxi to represent the of the significant strength and weakness. Arrays of 64 × 1 can be obtained. The elements that are less than 0.1 are rounding off without any object and get an array of n × 1, the C. Then we set the function f(Ck) for estimating sumpxi decreasing trend, as Equation (24).
f ( C k ) = ( C k + 1 C k ) ( C k C k 1 ) C k , k = 2 , 3 , , n 1  
The Ck of the maximum value of f(Ck) is taken as the sumpxi threshold of this saliency map. In order to reduce the computation of the region, to improve the efficiency and real-time performance of the algorithm, and to ensure that the selected area has a better tolerance, we form an object screening area with 3 × 3 rectangles centered in each area center block. If more than a rectangular area meets the requirements set by pixel threshold conditions in the same object screening area, then the one that takes the largest pixel value is chosen as the center of the region. We take the center point of the object screening area as the center, and predict six bounding boxes with fixed size according to the different width-length-height ratio. The area of the object screening area is SZ, and the area of each prediction bounding box is shown by Equation (25).
s k = s m i n + s m a x s m i n m 1 ( k 1 ) , k = 1 , 2 , , 5  
In the equation, smin = 0.1 × SZ, smax = 0.7 × SZ, m = 5, and different bounding lengths are given for different prediction bounding boxes.
a r = W H , a r   { 1 , 2 , 3 , 1 2 , 1 3 }  
W and H represent the width and length of the box, respectively. The width and length corresponding to the bounding box are predicted to be H k = s k a r , W k = a r · s k . When ar = 1, there is also a prediction bounding box [38] with a size s k = s k · s k + 1 that has a total of 6 predicted bounding boxes. For any box bl, we calculate the total pixel value sumpxi in the box, the region area is S, and salient pixel proportion in the region Pp is:
p p ( b l ) = p n 1 p n 2  
Pn1 represents the total number of salient pixels (i.e., pixels with a pixel value greater than 0.1) in the bl region, and Pn1 represents the total number of pixels in the bl region. That is, for every prediction bounding box, bl has feature vector (x, y, sumpx, W, H, Pp), x and y, respectively, represent the Upper left corner coordinates of bl. A simple logistic classifier is trained to evaluate the effectiveness of each prediction bounding box by using the artificially calibrated training samples. We divide the evaluation results into two categories: object bounding box and non-object bounding box. For input bounding boxes, bl = (x, y, sumpx, W, H, Pp), logistic classifier [39] introduces weight parameter θ = (θ1, θ2, …, θ6), weighting the attributes in bl, obtaining θTbl, and introducing the logistic function to get the function hθ(bl).
h θ ( b l ) = 1 1 + e θ T b l  
The probability estimation function  can be further obtained as Equation (29):
P ( Y |   b l ;   θ ) = {   h θ ( b l ) ; Y = 1   1 h θ ( b l ) ; Y = 0  
It means that the probability of a tag being Y is given when the test sample bl and parameter θ are given. From the test sample set and the training sample set, we can obtain their joint probability density, that is, likelihood function:
i = 1 n P ( y ( i ) |   b l ( i ) ;   θ ) = i = 1 n ( h θ ( b l ) ) y ( i ) ( 1 h θ ( b l ) ) 1 y ( i )  
Maximize the likelihood function and find the appropriate parameter θ, and thereby comes the Equation (30):
( θ ) = i = 1 m y ( i ) log h θ ( b l ) + ( 1 y ( i ) ) log ( 1 h θ ( b l ) )  
According to the Equation (31), the parameter θ is obtained by the gradient descent method. The parameter θ is first derived:
θ j ( θ ) = ( y h θ ( b l ) ) b l j  
Update rule:
θ j = θ j + α ( ( y ( i ) h θ ( b l ( i ) ) ) b l j ( i ) )  
Having evaluated the box selection effect of each bounding box by the logistic classifier, we can obtain a corresponding frame selection evaluation score for each prediction bounding box. After that, a non-maximum suppression is carried out to get the final prediction as the final object bounding box. After completing the selection of the object bounding box, we set the pixel values in the enlarged filter area to be 0, while avoiding the inefficiency that is caused by repeated selection. Then, we update the corresponding region of the Saliency map and judge whether all the significant object regions in the saliency map have been detected (pixels value in saliency map is 0 or not). If it is true then the test is completed, if not, then we need to go through the detection process again.

4.2. Regional Integration Based on Visual Overall Perception

Gestalt theory clearly points out that under the influence of eyes and brain, images are constantly organized, simplified and unified. Gestalt’s organizational process is to selectively unify some elements together, and we can perceive that it is a complete unit [25]. This paper mainly applies the following Gestalt’s main theory [40] as a constraint to make salient regional integration:
(1)
simplification: excluding the unimportant part of the background from the image, only preserving the necessary components, such as the object, so as to achieve the simplification of the vision;
(2)
the relationship between the subject and the background: the feature of the scene will affect the parsing of the subject and the background in the scene, when a small object (or color block) overlaps with the larger object, we incline to the view that small objects are the main body and the big object is the background;
(3)
the global and the local: the whole of the experience organized by the perceptual activity, in nature, is not equal to the simple linear superposition of the part;
(4)
closeness: referring to the situation in which individual visual unit is infinitely close so that they form a large and unified whole;
(5)
closed-up: closed figures are often regarded as a whole; and,
(6)
incomplete or irregular graphics: they are often regarded as a similar regular pattern.
The constraint condition 1 and 3 have been embodied in pre attention channel processing and post attention channel processing. The significant image in the prepaid channel is simplified by simplifying the parameters; in the post attention channel processing, the saliency region is constructed by nonlinear combination of the characteristic significant images. At the high level, according to the Gestalt constraint condition 4 and the constraint condition 5, we judge whether there is any intersection between the significant regional encircling boxes Ti obtained after the high validity sub-window search in total salience diagram Ffinal. Then, we merge them according to the nearest principle. The combination condition is that there is an overlapping part [40] in the two object encircling box regions, and the proportion of the overlapping region Tk in any region is above a certain threshold φ (satisfying fourth, fifth), such as Equation (34).
{ T i T j T k T i φ     o r     T k T i φ  
For two significant regional bounding boxes Ti(xi,yi,ai,bi) and Tj(xj,yj,aj,bj), x,y,a,b are the upper left corner coordinates and the width and height of the regional encircling boxes. After merging, a new bounding box is generated for Tk(xk,yk,ak,bk). Combination rules is indicated by Equations (35) and (36):
{ x k = min ( x i , x j ) y k = min ( y i , y j )  
{ a k = | x i x j | + a , a = { a i , x j < x i a j , x i < x j b k = | y i y j | + b , b = { b i , b j < b i b j , b i < b j  
In order to prevent the mutual interference between the fused bounding boxes that reduces the accuracy and precision of the multi object detection results, the bounding boxes are processed in the left-to-right and top-to-bottom order. For the significant object area in the encircling boxes, the closed operation in the morphological operation is used to form the overall significant object area. The merging will stop on the condition that the area of the saliency region satisfies the needs that the salient region is larger than the background area or than the contact image boundary (satisfying the constraint condition 2).

5. Experience & Analysis

5.1. Experience Condition and Dataset

The experimental hardware conditions in this paper are DELL Precision R7910 (AWR7910) graphics workstation, with the processor Intel Xeon E5-2603 v2 (1.8 GHz/10 M) and software Matlab2015a. Because there is no military object dataset that can be directly used at home and abroad, this paper collects the original image through the network search engine for the military object detection task, and it processes the image by enriching, stretching, rotating, etc. to enrich the dataset. A military object detection dataset (MOD) is constructed according to the VOC dataset format standard. Each image in the dataset corresponds to a label that identifies the image name, the category of the military object, and the height and width of the circumscribed rectangle. The dataset consists of more than 20,000 images whose size is unified into 480 × 480 pixels.
In order to verify the advantages and superiority of the proposed algorithm, we selected the following five datasets to evaluate the detection results, namely MSRA-B [41], HKU-IS [42], KITTI [43], PASCALS [44], and ECSSD [45]. These datasets are available on the Internet, and each contains a large number of images and well-divided annotations, which is why they have been widely used in recent years. MSRA-B contains 5000 images from hundreds of different categories, and due to its diversity and large number, it has become one of the most preferable datasets. Most of the images in this dataset have only one significant object, so it gradually becomes the standard data set for evaluating the ability of the algorithm to handle simple scenes. ECSSD contains 1000 semantically meaningful but complex natural images. HKU-IS is another large dataset containing more than 4000 challenging images, most of which have low contrast with more than one salient object. PASCALS contains 850 challenging images (each contains multiple objects), all of which are selected from the validation set of the PASCAL VOC 2010 split dataset. The KITTI dataset is the current computer vision algorithm evaluation dataset under the largest autopilot scenario in the world. We use the first image set in the KITTI dataset “Download left color images of object data set” and the annotation file “Download training labels of object data set”, most of which have multiple salient objects.

5.2. Experimental Design

First, the function of each module in the method of generating significant graphs is illustrated by algorithm performance analysis. Then, subjective and objective evaluations are conducted to highlight the superiority of the new method in comparison with the current popular saliency map generation method. Finally, we perform military object detection by using this new method, combined with efficient sub-window search method, and then compare the different detection accuracy and real-time performance among various detection methods.

5.3. Analysis of the Algorithm Performance of Object Saliency Map

The (1) in Figure 8 is the result of the saliency map generation in each stage of pre-attention channel. In the figure, (a) is the original image, (b) is the super pixel result obtained by SLIC method segmentation, and we only use the neighborhood contrast with the enhanced Sigma feature to test the saliency of (b), which generates the result (c). Result of the saliency test on the contrast of the image background is shown in (d); the spatial distance weighted saliency map results are shown in (e); the results of the local saliency map when region size is further weighted are shown in (f); the results of the global saliency map are (g), and (h) is the fusion result of the local saliency map and the global saliency map. The saliency of the tank object is prominent and the background clutter is well suppressed. Based on the above analyses, the effectiveness of the pre-attention channel for the saliency detection of military objects is verified.
For the sub-attention channel, we verify the validity of the texture, color, and brightness features for the salient object detection, and we then verify the enhancement of the feature fusion to the significant object detection. The (2) in Figure 8, (b–d) are the results of the full-texture saliency detection of the three convolution kernels of vertical, horizontal, and circular, respectively. It can be seen that the convolution kernel that we designed is valid. The saliency of the corresponding texture is detected, but the clutter interference that is generated by the surrounding environment is also very strong. In the figure, (e) is the result of the detection of the detection area by using the detection result of the pre-attention channel, and the pre-attention channel guidance is verified. The effectiveness of the strategy pair, and (e) is the fusion result of the three convolution kernel texture saliency detection. The texture of the tank object is prominent, and the significant interference of the noise such as flame is effectively suppressed, but some in the environment still make themselves felt strongly.
The (1) in Figure 9 is an effect diagram of saliency detection while using only color features: (b) is a red and green channel color feature saliency map, (c) is a yellow-blue channel color feature saliency map, and (d) is a fused color feature saliency map. In the first line, the red and green channel color features are not conducive to the object’s saliency detection, but the yellow-blue channel color features have a better saliency detection effect. Conversely, in the second row, the yellow-blue channel color features are unfavorable for the object detection, while the red-green channel color features have a good saliency detection effect, and so the fusion features of the two have good detection results, verifying the effectiveness of color feature saliency detection and integration strategy. In addition, from the detection results of the third line of images, we found that, for camouflage objects with small differences in color characteristics and environment, tests relying only on color features cannot achieve satisfactory detection results.
The (2) in Figure 9 is a graph showing the effect of detecting the brightness characteristic saliency, which has a better detection effect on the military object with much difference in ambient brightness (second column), and has a better distinguishing effect on a high-brightness dominant interference object, such as a flame (the first column and the third column), but the saliency detection effect on the camouflage object is still not ideal (fourth column) and the ambient brightness clutter interference is strong.
The (1) in Figure 10 is a sub-attention channel multi-feature fusion saliency detection effect diagram, where (b) is a texture feature saliency map, (c) is a color feature saliency map, (d) is a luminance feature saliency map, and (e) is a multi-feature fusion The salient map, which verifies the validity of multi-feature fusion, can suppress interference and highlight significant objects. The (2) in Figure 10 is a pre-attention channel saliency diagram and a post-attention channel saliency diagram fusion effect diagram, where (b) is a pre-attention channel saliency diagram, (c) is a post-attention channel saliency diagram, and (d) is a two-channel fused saliency diagram, As can be seen from the figure, the object in (d) has a better detection effect.
Figure 11 is a rendering of the significant region fusion of Gestalt visual psychology, (b), and (c) an object saliency map that is generated after the regional fusion strategy is processed, and a good detection is obtained. The effect is in line with the human visual cognition mechanism.

5.4. Comparative Analysis of Significant Graph Generation Algorithms

In order to evaluate the superiority of the saliency map detection method on a broader context, the algorithm and 11 saliency map generation methods (RC [15], CHM [16], DSR [17], DRFI [3], MC [46], ELD [47], MDF [42], RFCN, DHS [48], DCL [49], and DSSOD [18]) are employed to compare and analyze their different significant image detection effects on various kinds of military object images. The above-mentioned algorithms are all derived from the official website open source code, while using default parameter settings.

5.4.1. Evaluation Index

We use three widely-recognized evaluation indicators to quantitatively evaluate the detection performance of the algorithm, namely the accuracy regression curve, F-measure, and mean absolute error (MAE) [18]. For a given saliency map S, we convert it to a binary map B by adaptive thresholding. The accuracy and regression rate are calculated according to the equation (37), where T represents the true detection result, P represents the precision, and R represents the regression value (Recall).
{ p = | B T | | B | R = | B T | | T |  
In the equation, | · | represents the statistics of all non-zero inputs. The PR curve of the current data set can be obtained for the given data set and the mean of the regression rate. In order to fully assess the quality of the saliency map, the F-measure is defined as Equation (38).
F β = ( 1 + β 2 ) · P × R β 2 · P + R  
Here, β2 is the weight and β2 = 0.3 is used to emphasize the importance of the precision value. By normalizing S and T to [0, 1], we get S ^ and T ^ , and the mean absolute error (MAE) can be defined to be Equation (39).
M A E = 1 H × W i = 1 H j = 1 W | S ^ ( i , j ) T ^ ( i , j ) |  
Here, H and W are the height and width of the image.

5.4.2. Comparison of Visual Effects
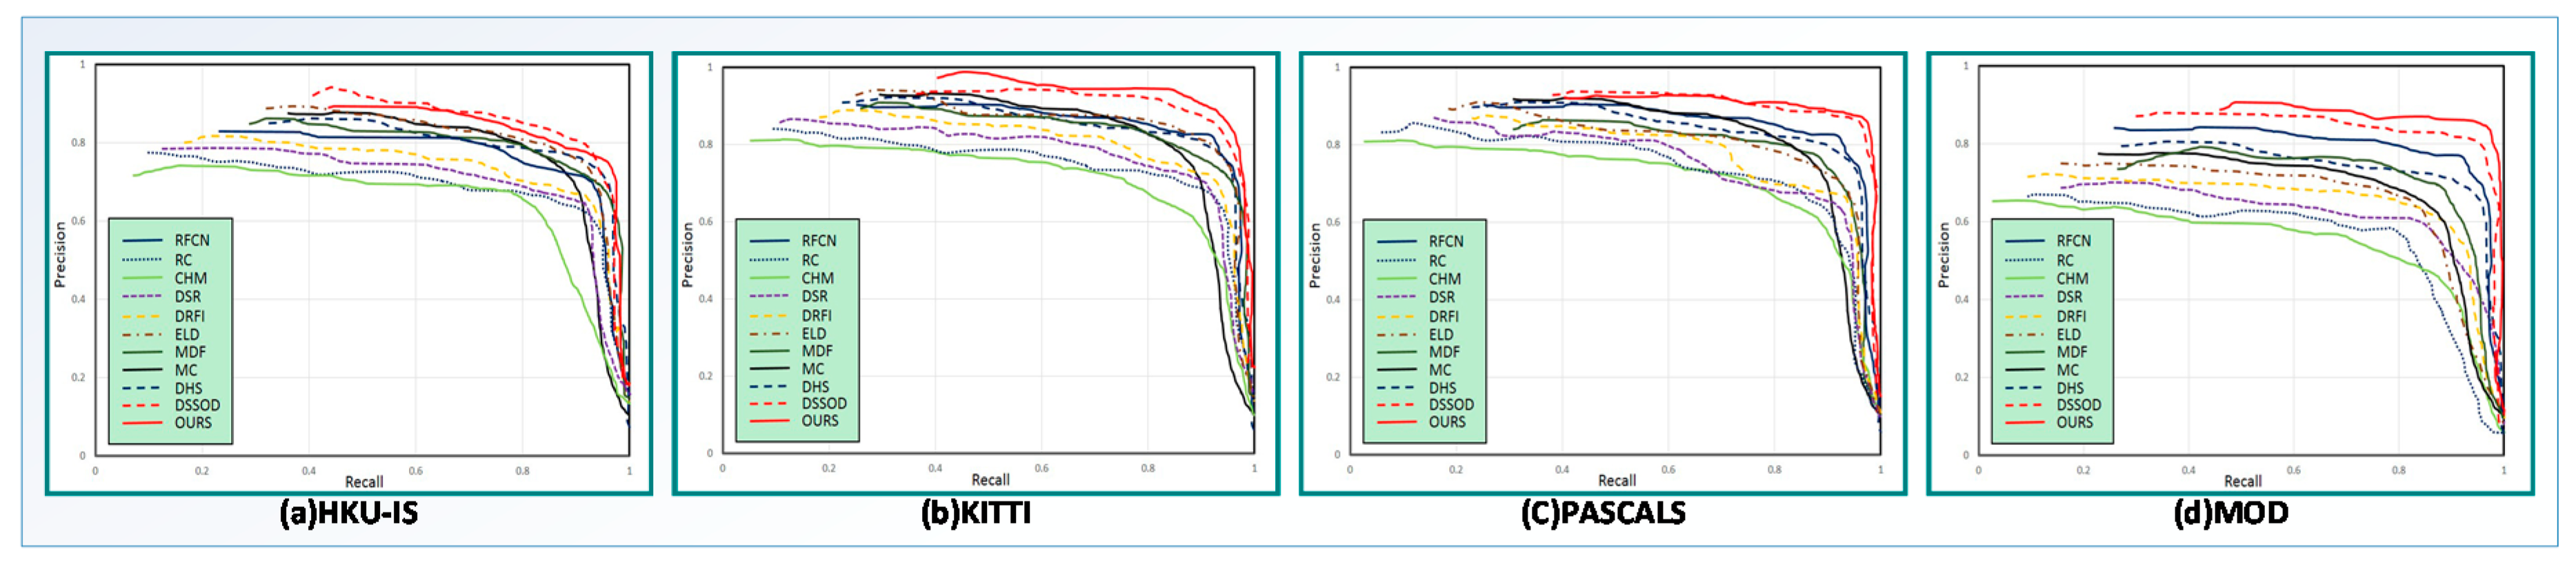
In order to highlight the superiority and advantage of the algorithm, multiple representative images from the constructed MOD data set are selected for the comparison of saliency detection results. These images involve various kinds of environments that are difficult to detect, and they include multiple significant objects in complex and simple scenarios, significant objects of central deviation, significant objects of different sizes, and camouflage objects with low-contrasted backgrounds. We divide the selected images into several groups, which are separated by solid lines. We also provide each group with multiple labels describing its attributes. With all possible scenes taken into consideration and through a comparison of the visual effects of each algorithm, we verify that the proposed algorithm can not only highlight the correct object area, but also produce a coherent boundary in the object area, which is more in line with the visual and cognitive mechanism of the human eye. It is also worth mentioning that, due to the adaptive image enhancement based on human visual fusion and due to the saliency region detection based on dual channel and feature fusion, the significant object area saliency is enhanced, thus highlighting object and environmental background, as well as producing higher contrast. More importantly, it creates connected areas that greatly enhance the detection and expression capabilities of our model. These advantages make our results very close to the basic facts and have better detection results than other methods in almost all scenarios. The visual effect is shown in the Figure 12.

5.4.3. PR Curve

Here, we compare the method that was proposed with the existing ones through the PR curve. In Figure 13, we depict the PR curves that were separately generated by the methods proposed in this paper and the most advanced methods on several popular datasets, namely, the HKU-IS, KITTI, PASCALS, and the self-contained MOD dataset. Obviously, the FCN-based method is much better than others, but the results of combining multiple data sets show that the algorithm proposed by this paper can achieve the best results. We can also find that when the recall score is close to 1, our method is much more accurate, which reflects that our false positives are much lower than other methods. This also demonstrates the effectiveness of our adaptive image enhancement, which is based on human visual fusion, as well as the effectiveness of the saliency region detection strategy based on two-channel and feature fusion, and such effectiveness renders the resulting saliency map to be closer to the basic facts.

5.4.4. F-Measure & MAE

We compared the method that was proposed by this paper with the existing methods in terms of F-measure and MAE scores, and the quantitative results are shown in the Table 1. For the F-measure score, the best maximum F-measure value is increased by 2% to 5% compared to other methods, which is a large margin because these values are already very close to the ideal value of 1, and the best results were obtained on MOD and KITTI datasets, both of which failed to achieve better detection results. It also verified the effectiveness and application prospects of the proposed algorithm. For the MAE score, our method achieved a reduction of more than 10% on the MOD dataset, and on other datasets there were still more than 2% reduction, which means that our number of mis-predicted cases is significantly lower than other methods. In addition, we observed that the proposed method has achieved good results on all data sets, and we verified that the proposed algorithm has better adaptive ability.

5.5. Comparative Analysis of Algorithm Detection Results
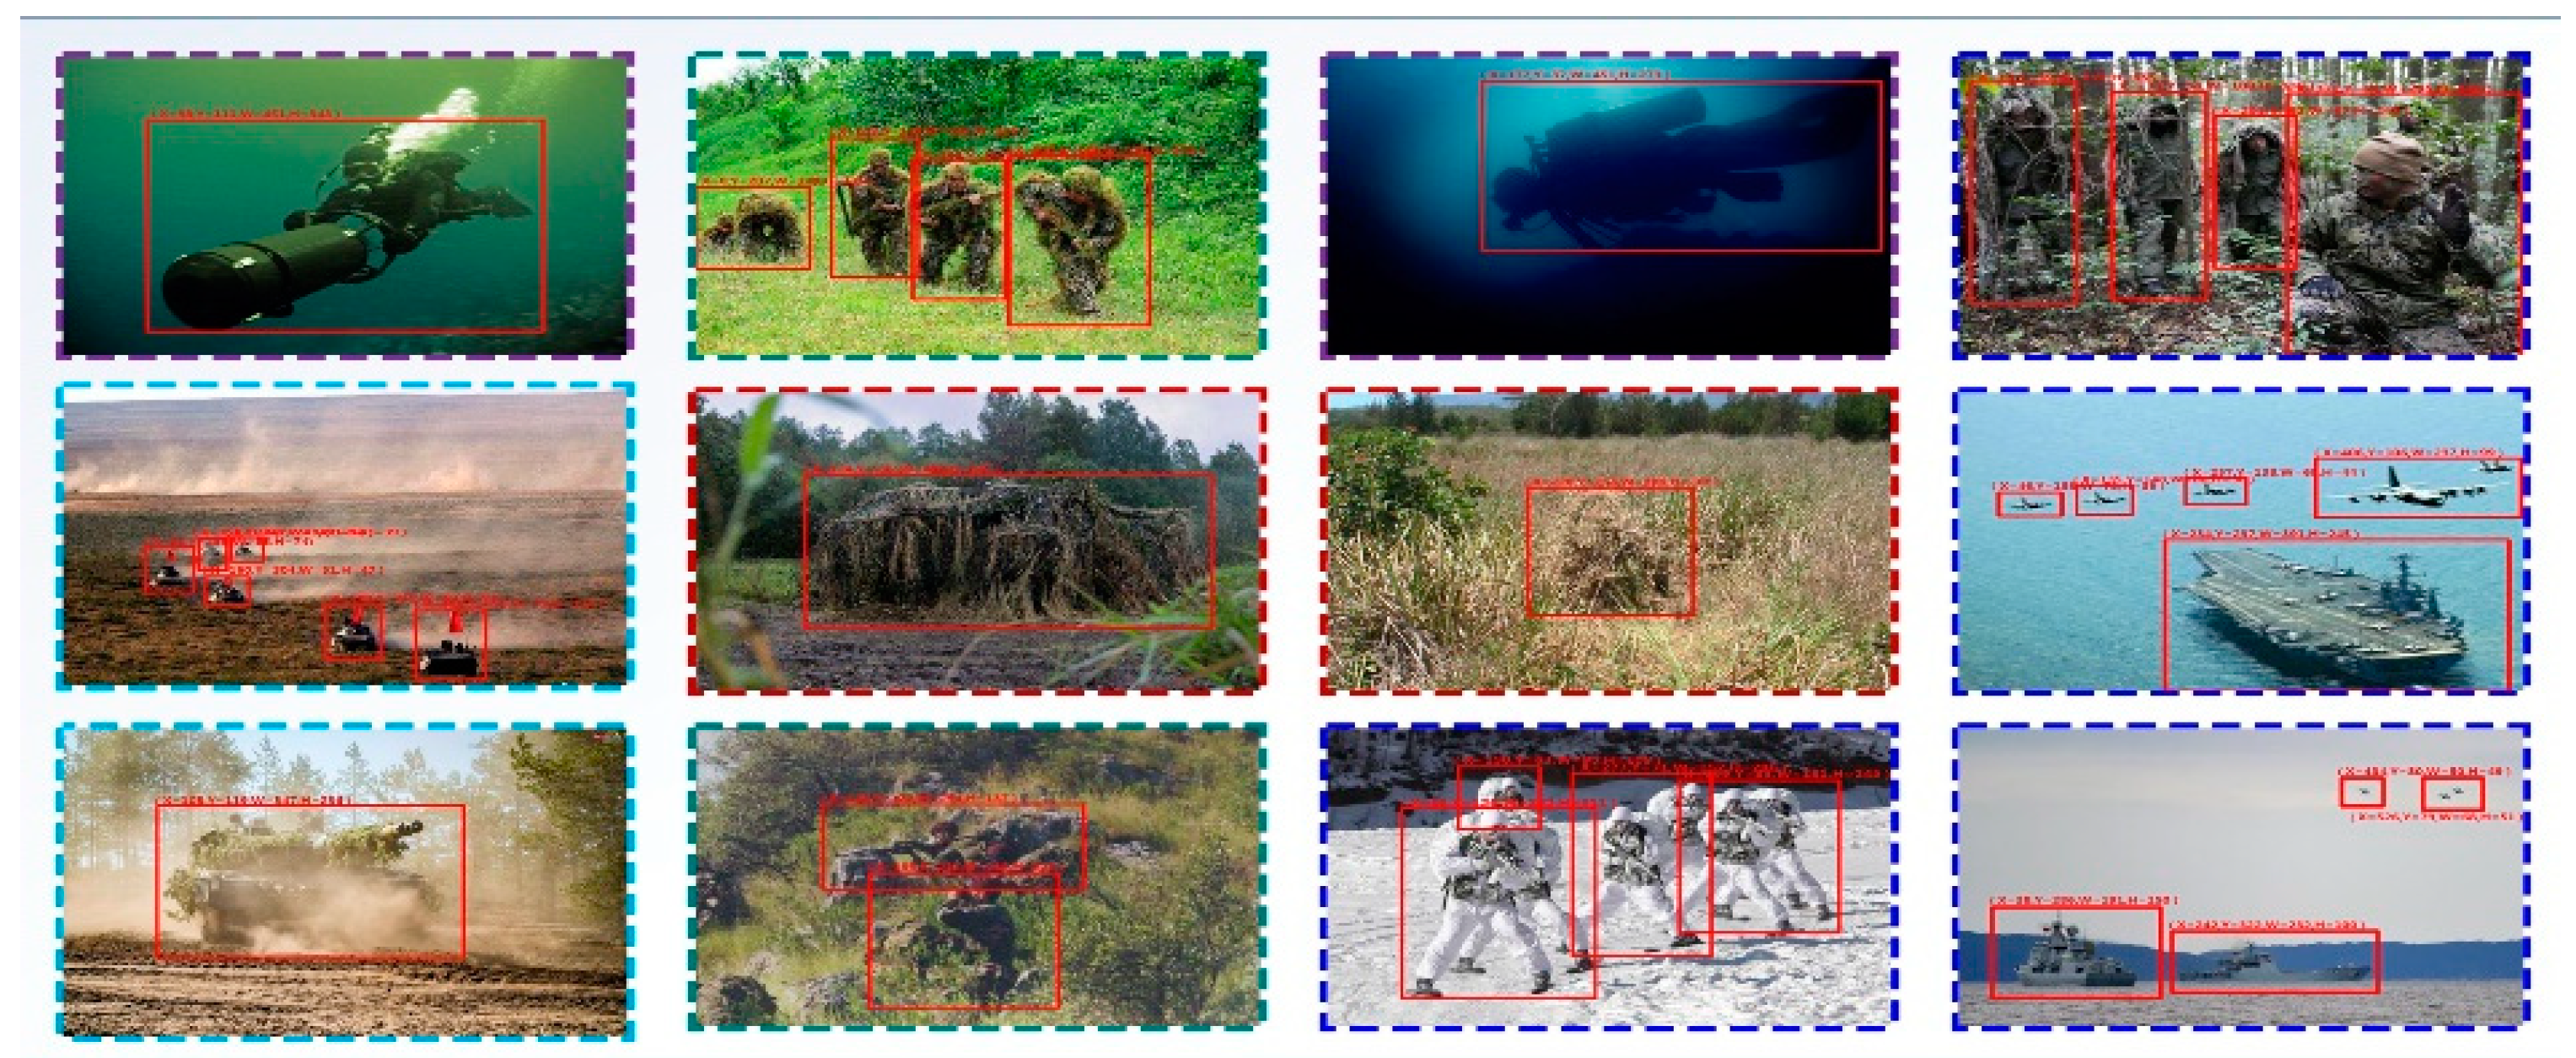
There are objects Z { z 1 , z 2 , , z n } in the image, where z i = [ x z i , y z i , a z i , b z i , c z i , d z i ] . It is assumed that the algorithm outputs the image is W { w 1 , w 2 , , w m } , and w j = [ x w j , y w j , a w j , b w j , c w j , d w j ] , x, y, a, b of the object are separately the coordinates of the upper left corner point, the width and height of the object’s bounding box. c is the object’s confidence, and d is the category to which the object belongs. If so, the evaluation process includes the following steps:
(1)
Establish an optimal one-to-one correspondence between goals and hypothetical results. The Euclidean distance is used to calculate the spatial position correspondence between the real object and the hypothetical object. The threshold T of the Euclidean distance is set to the distance between the centers of the hypothesis and the least overlap of the objects. The number of objects for completing the correspondence is NT, and the number of missed objects is LP = nNT.
(2)
After the mutual correspondence between the objects is completed, we divide the test results into two categories according to d, which is in accordance with the real object and the hypothetical object. The two categories are: accurate detection, which occurs when there are same categories; and, misdetection, which occurs when there are different categories. The number of objects accurately detected by statistics is TR, and the number of objects for statistical misdetection is TW. When we compare the number of real objects n with the number of objects detected m, and if n < m, there is a case of false alarms, and the number of false objects is FP = mNT.
(3)
From the statistical results of step 2, we can measure the detection effect of the algorithm by calculating the false alarm rate, missed alarm rate, detection rate, and false detection rate of the algorithm.
False alarm rate, P f = F P n ; Missed alarm rate, P m = L P n ;
Detection rate, P d = T R n ; false detection rate, P e = T W n .
Deep learning is a learning method based on deep artificial neural network. In various types of artificial neural network structures, deep convolutional networks have powerful feature extraction capabilities. In visual tasks, such as image recognition, image segmentation, object detection, and scene classification, very good results have been achieved, so this paper selects Faster R-CNN [50], DSOD300 [51] detection framework, both of which are based on deep neural network, as well as YOLOv2 544 [52] and model DSSD [53].
Faster R-CNN (where R corresponds to “Region”) is the best method based on deep learning R-CNN series object detection. Training includes four steps: (1) Initialize the RPN network parameters using a pre-trained model on ImageNet to fine tune the RPN network; (2) Using the RPN network in (1) to extract the region proposal to train the Fast R-CNN network, and also initialize the network parameters with the pre-trained model on ImageNet; (now it seems that the two networks are relatively independent); (3) Re-initialize the RPN using the Fast R-CNN network of (2), fine-tune the fixed convolutional layer, and fine-tune the RPN network; and, (4) Fix the convolution layer of Fast R-CNN in (2), and fine-tune the Fast R-CNN network by using the region proposal extracted by RPN in (3).
The DSOD network structure can be divided into two parts: the backbone sub-network for feature extraction and the front-end sub-network for prediction over multi-scale response maps. The DSOD model not only has fewer parameters and better performance, but it also does not need to be pre-trained on large data sets (such as ImageNet), which makes the design of the DSOD network structure flexible and make it possible to design its own network structure according to its own application scenario. The training parameters are roughly, as follows: learning rate = 0.1, decreasing to 0.1 every 20,000 ITER, snapshot every 2000 ITER, maximum ITER 100,000, and test every 2000 ITER.
Yolov2 treats the object detection task as a regression problem, and it uses a neural network to directly predict the coordinates of the bounding box, the confidence of the object contained in the box, and the probabilities of the object from a whole image. Because Yolo’s object detection process is completed in a neural network, it is possible to optimize the object detection performance.
DSSD has poor robustness against small targets, and it changes SSD’s reference network from VGG to ResNet-101, thus enhancing feature extraction capability. The use of a de-convolution layer provides a great deal of context information. Most of the training techniques are similar to the original SSD. First, SSD’s Default Boxes are still used, and those with an overlap rate higher than 0.5 are considered positive samples. Then we set some more negative samples so that the ratio of positive samples to negative samples is 3:1. The joint loss function of smooth L1 + soft max is minimized during training. Data expansion is still needed before training (including the hard example mining technique). In addition, the default Boxes dimension of the original SSD was manually specified and it may not be efficient enough. Therefore, seven default boxes dimensions were obtained again by K-means clustering method, and the obtained boxes dimensions are more representative.
All of the detection frameworks use the default parameter settings in the official code published by the author. The detection categories were adjusted, trained, and tested by using the KITTI and MOD data sets.
As a comparison algorithm of object detection performance, the object detection effect is verified on the MOD and KITTI data sets. The detection effect is shown in Table 2, where Time represents the average time taken by the algorithm to process an input image with a single frame size of 480 × 480 in the dataset.
Here, we compare the results of our algorithm and other deep learning comparison algorithms in the above table: in the KITTI data set, the object detection rate increases by 24~32%, reaching 90.47%, and total time cost of the single frame image algorithm processing is about 0.106 s; in the WD data set, the object detection rate increases by 27~33%, reaching 82.05%, and the overall time cost of the single frame image algorithm is about 0.185 s. With two data sets combined, it is clear that the saliency region detection process that is based on dual channel and feature fusion takes about 0.1 s, and the proportion of time consumed for adaptive image enhancement process based on human visual fusion against the complexity of the image is about 0.03~0.08 s. In general, the proposed algorithm achieves a good balance between detection accuracy and real-time performance in comparison with other object detection algorithms.

5.6. Discussion

Figure 14 is a diagram showing the effect of the algorithm on the detection of military objects in various scenarios. The purple border is the underwater object detection effect map; the light blue border is the detection effect map of the large object, multiple objects, and small objects, all of which are interfered by the environment. the red border is the detection effect map of the camouflage object; the green border and the dark blue border verify the effectiveness of the adaptive overlap threshold strategy in detecting the border fusion process. However, as for the objects with close airspace distance, some object detection frames will blend with each other, which subsequently needs further research.

6. Conclusions

This paper proposes a military object detection method that combines human visual saliency and visual psychology. Firstly, the adaptive adjustment mechanism of the human eye is modeled, and a new image adaptive enhancement method based on human visual fusion is proposed, which can effectively highlight the object and suppress the interference. Then, inspired by how the human visual information is processed, we establish the distinctive region detection model that is based on dual channel and feature fusion. After that, the pre-attention channel and the post-processing channel, respectively, perform significant region detection on the image, and after the two channel results get fused, the measurement result determines the candidate salient region. Later on, under the guidance of Gestalt visual psychology, we integrate the obtained candidate salient regions to obtain an object saliency map with overall perception, and then apply the efficient sub-window search method to detect and screen the object so as to identify the object location and region range. Experiments show that our algorithm can realize the rapid and accurate detection of military objects in various complex scenes, reduce effectively the camouflage and deception effect of the battlefield, create favorable conditions for implementing precision strikes, and have great prospects for future application.

Author Contributions

Conceptualization, X.H. (Xia Hua) and X.W.; Methodology, X.H. (Xia Hua) and X.W.; Software, X.H. (Xia Hua); Validation, X.H. (Xia Hua), X.W., D.W.; Formal Analysis, J.H.; Investigation, X.H. (Xia Hua), J.H. and X.H. (Xiaodong Hu); Resources, X.W., D.W.; Data Curation, X.H. (Xia Hua); Writing-Original Draft Preparation, X.H. (Xia Hua), X.W., J.H. and X. H. (Xiaodong Hu); Writing-Review & Editing, X.W.; Visualization, X.H. (Xia Hua); Supervision, X.H. (Xia Hua); Project Administration, X.W.; Funding Acquisition, X.W.

Funding

This work was supported in part by the China National Key Research and Development Program (No. 2016YFC0802904), National Natural Science Foundation of China (61671470), Natural Science Foundation of Jiangsu Province (BK20161470), 62nd batch of funded projects of China Postdoctoral Science Foundation (No. 2017M623423).

Conflicts of Interest

The authors declare no conflict of interest.

References

  1. Sun, Y.; Chang, T.; Wang, Q.; Kong, D.; Dai, W. A method for image detection of tank armor objects based on hierarchical multi-scale convolution feature extraction. J. Ordnance Eng. 2017, 38, 1681–1691. [Google Scholar]
  2. Dollar, P.; Appel, R.; Belongie, S.; Perona, P. Fast feature pyramids for object detection. IEEE Trans. Pattern Anal. Mach. Intell. 2014, 36, 32–45. [Google Scholar] [CrossRef] [PubMed]
  3. Jiang, H.; Wang, J.; Yuan, Z.; Wu, Y.; Zheng, N.; Li, S. Salient object detection: a discriminative regional feature integration approach. In Proceedings of the 2013 IEEE Conference on Computer Vision and Pattern Recognition, Portland, OR, USA, 23–28 June 2013; pp. 2083–2090. [Google Scholar]
  4. Schneiderman, H. Feature-centric evaluation for efficient cascaded object detection. In Proceedings of the 2004 IEEE Computer Society Conference on Computer Vision and Pattern Recognition (CVPR 2004), Washington, DC, USA, 27 June–2 July 2004; Volume 2, pp. II-29–II-36. [Google Scholar]
  5. Li, L.; Huang, W.; Gu, I.Y.-H.; Tian, Q. Statistical modeling of complex backgrounds for foreground object detection. IEEE Trans. Image Process. 2004, 13, 1459–1472. [Google Scholar] [CrossRef] [PubMed]
  6. Prasad, D.K.; Rajan, D.; Rachmawati, L.; Rajabally, E.; Quek, C. Video Processing from electro-optical sensors for object detection and tracking in a maritime environment: A Survey. IEEE Trans. Intell. Trans. Syst. 2017, 18, 1993–2016. [Google Scholar] [CrossRef]
  7. Savaş, M.F.; Demirel, H.; Erkal, B. Moving object detection using an adaptive background subtraction method based on block-based structure in dynamic scene. Optik 2018, 168, 605–618. [Google Scholar] [CrossRef]
  8. Sultani, W.; Mokhtari, S.; Yun, H.B. Automatic pavement object detection using superpixel segmentation combined with conditional random field. IEEE Trans. Intell. Trans. Syst. 2018, 19, 2076–2085. [Google Scholar] [CrossRef]
  9. Zhang, C.; Xie, Y.; Liu, D.; Wang, L. Fast threshold image segmentation based on 2D fuzzy fisher and random local optimized QPSO. IEEE Trans. Image Process. 2017, 26, 1355–1362. [Google Scholar] [CrossRef] [PubMed]
  10. Druzhkov, P.N.; Kustikova, V.D. A survey of deep learning methods and software tools for image classification and object detection. Pattern Recognit. Image Anal. 2016, 26, 9–15. [Google Scholar] [CrossRef]
  11. Ghesu, F.C.; Krubasik, E.; Georgescu, B.; Singh, V.; Zheng, Y.; Hornegger, J.; Comaniciu, D. Marginal space deep learning: efficient architecture for volumetric image parsing. IEEE Trans. Med. Imaging 2016, 35, 1217–1228. [Google Scholar] [CrossRef] [PubMed]
  12. Xu, X.; Li, Y.; Wu, G.; Luo, J. Multi-modal deep feature learning for RGB-D object detection. Pattern Recognit. 2017, 72, 300–313. [Google Scholar] [CrossRef]
  13. Schölkopf, B.; Platt, J.; Hofmann, T. Graph-based visual saliency. In Proceedings of the 19th International Conference on Neural Information Processing Systems, Vancouver, BC, Canada, 4–7 December 2006; MIT Press: Cambridge, MA, USA, 2006; pp. 545–552. [Google Scholar]
  14. Achanta, R.; Hemami, S.; Estrada, F.; Susstrunk, S. Frequency-tuned salient region detection. In Proceedings of the 2009 IEEE Conference on Computer Vision and Pattern Recognition, Miami, FL, USA, 20–26 June 2009; pp. 1597–1604. [Google Scholar]
  15. Cheng, M.M.; Mitra, N.J.; Huang, X.; Torr, P.H.S.; Hu, S.M. Global contrast based salient region detection. IEEE Trans. Pattern Anal. Mach. Intell. 2015, 37, 569–582. [Google Scholar] [CrossRef] [PubMed]
  16. Li, X.; Li, Y.; Shen, C.; Dick, A.; Hengel, A.V.D. Contextual hypergraph modeling for salient object detection. In Proceedings of the 2013 IEEE International Conference on Computer Vision, Sydney, NSW, Australia, 1–8 December 2013; pp. 3328–3335. [Google Scholar]
  17. Li, X.; Lu, H.; Zhang, L.; Ruan, X.; Yang, M.H. Saliency detection via dense and sparse reconstruction. In Proceedings of the 2013 IEEE International Conference on Computer Vision, Sydney, NSW, Australia, 1–8 December 2013; pp. 2976–2983. [Google Scholar]
  18. Hou, Q.; Cheng, M.M.; Hu, X.; Borji, A.; Tu, Z.; Torr, P.H.S. Deeply supervised salient object detection with short connections. IEEE Trans. Pattern Anal. Mach. Intell. 2018. [Google Scholar] [CrossRef] [PubMed]
  19. Wang, L.; Wang, L.; Lu, H.; Zhang, P.; Ruan, X. Saliency detection with recurrent fully convolutional networks. In Proceedings of the Computer Vision—ECCV 2016, Amsterdam, The Netherlands, 11–14 October 2016; Springer: Cham, Switzerland, 2016; Volume 9908. [Google Scholar]
  20. Dresp, B.; Grossberg, S. Contour integration across polarities and spatial gaps: From local contrast filtering to global grouping. Vis. Res. 1997, 37, 913–924. [Google Scholar] [CrossRef]
  21. Dresp, B.; Durand, S.; Grossberg, S. Depth perception from pairs of stimuli with overlapping cues in 2-D displays. Spat. Vis. 2002, 15, 255–276. [Google Scholar] [CrossRef] [PubMed]
  22. Dresp-Langley, B.; Grossberg, S. Neural computation of surface border ownership and relative surface depth from ambiguous contrast inputs. Front. Psychol. 2016, 7, 1102. [Google Scholar] [CrossRef] [PubMed]
  23. Grillspector, K.; Malach, R. The human visual cortex. Ann. Rev. Neurosci. 2004, 27, 649–677. [Google Scholar] [CrossRef] [PubMed]
  24. Blog. Available online: https://blog.csdn.net/shuzfan/article/details/78586307 (accessed on 6 August 2018).
  25. Wagemans, J.; Feldman, J.; Gepshtein, S.; Kimchi, R.; Pomerantz, J.R.; van der Helm, P.A.; van Leeuwen, C. A century of gestalt psychology in visual perception II. conceptual and theoretical foundations. Psychol. Bull. 2012, 138, 1218–1252. [Google Scholar] [CrossRef] [PubMed]
  26. Lee, T.S. Image representation using 2D Gabor wavelets. IEEE Trans. Pattern Anal. Mach. Intell. 1996, 18, 959–971. [Google Scholar] [Green Version]
  27. Zhihu. Available online: https://zhuanlan.zhihu.com/p/21905116 (accessed on 6 August 2018).
  28. Stocker, A.A.; Simoncelli, E.P. Noise characteristics and prior expectations in human visual speed perception. Nat. Neurosci. 2006, 9, 578–585. [Google Scholar] [CrossRef] [PubMed] [Green Version]
  29. Kastner, S.; Pinsk, M.A. Visual attention as a multilevel selection process. Cognit. Affect. Behav. Neurosci. 2004, 4, 483–500. [Google Scholar] [CrossRef] [Green Version]
  30. Achanta, R.; Shaji, A.; Smith, K.; Lucchi, A.; Fua, P.; Süsstrunk, S. SLIC Superpixels Compared to state-of-the-art superpixel methods. IEEE Trans. Pattern Anal. Mach. Intell. 2012, 34, 2274–2282. [Google Scholar] [CrossRef] [PubMed]
  31. Liu, S.T.; Liu, Z.X.; Jiang, N. Object segmentation of infrared image based on fused saliency map and efficient subwindow search. Acta Autom. Sin. 2018, 11, 274–282. [Google Scholar]
  32. Lan, Z.; Lin, M.; Li, X.; Hauptmann, A.G.; Raj, B. Beyond gaussian pyramid: Multi-skip feature stacking for action recognition. In Proceedings of the 2015 IEEE Conference on Computer Vision and Pattern Recognition (CVPR), Boston, MA, USA, 7–12 June 2015; pp. 204–212. [Google Scholar]
  33. Cacioppo, J.T.; Petty, R.E.; Kao, C.F.; Rodriguez, R. Central and peripheral routes to persuasion: An individual difference perspective. J. Person. Soc. Psychol. 1986, 51, 1032–1043. [Google Scholar] [CrossRef]
  34. Tuzel, O.; Porikli, F.; Meer, P. Region Covariance: A fast descriptor for detection and classification. In Computer Vision—ECCV 2006; Springer: Berlin/Heidelberg, Germany, 2006; pp. 589–600. [Google Scholar]
  35. Cela-Conde, C.J.; Marty, G.; Maestú, F.; Ortiz, T.; Munar, E.; Fernández, A.; Roca, M.; Rosselló, J.; Quesney, F. Activation of the prefrontal cortex in the human visual aesthetic perception. Proc. Natl. Acad. Sci. USA 2004, 101, 6321–6325. [Google Scholar] [CrossRef] [PubMed] [Green Version]
  36. Liang, D. Research on Human Eye Optical System and Visual Attention Mechanism. Ph.D. Thesis, Zhejiang University, Hangzhou, China, 2017. [Google Scholar]
  37. Hong, X.; Chang, H.; Shan, S.; Chen, X.; Gao, W. Sigma Set: A small second order statistical region descriptor. In Proceedings of the 2009 IEEE Conference on Computer Vision and Pattern Recognition, Miami, FL, USA, 20–26 June 2009; pp. 1802–1809. [Google Scholar]
  38. Lauinger, N. The two axes of the human eye and inversion of the retinal layers: The basis for the interpretation of the retina as a phase grating optical, cellular 3D chip. J. Biol. Phys. 1993, 19, 243–257. [Google Scholar] [CrossRef]
  39. Dong, L.; Wesseloo, J.; Potvin, Y.; Li, X. Discrimination of mine seismic events and blasts using the fisher classifier, naive bayesian classifier and logistic regression. Rock Mech. Rock Eng. 2016, 49, 183–211. [Google Scholar] [CrossRef]
  40. Fang, Z.; Cui, R.; Jin, W. Video saliency detection algorithm based on bio-visual features and visual psychology. Acta Phys. Sin. 2017, 66, 319–332. [Google Scholar]
  41. Liu, T.; Sun, J.; Zheng, N.-N.; Tang, X.; Shum, H.-Y. Learning to detect a salient object. IEEE Trans. Pattern Anal. Mach. Intell. 2011, 33, 353–367. [Google Scholar] [PubMed]
  42. Li, G.; Yu, Y. Visual saliency based on multiscale deep features. In Proceedings of the 2015 IEEE Conference on Computer Vision and Pattern Recognition (CVPR), Boston, MA, USA, 7–12 June 2015; pp. 5455–5463. [Google Scholar]
  43. Geiger, A.; Lenz, P.; Stiller, C.; Urtasun, R. Vision meets robotics: The KITTI dataset. Int. J. Robot. Res. 2013, 32, 1231–1237. [Google Scholar] [CrossRef] [Green Version]
  44. Li, Y.; Hou, X.; Koch, C.; Rehg, J.M.; Yuille, A.L. The secrets of salient object segmentation. In Proceedings of the 2014 IEEE Conference on Computer Vision and Pattern Recognition, Columbus, OH, USA, 23–28 June 2014; pp. 280–287. [Google Scholar]
  45. Che, Z.; Zhai, G.; Min, X. A hierarchical saliency detection approach for bokeh images. In Proceedings of the 2015 IEEE 17th International Workshop on Multimedia Signal Processing (MMSP), Xiamen, China, 19–21 October 2015; pp. 1–6. [Google Scholar]
  46. Zhao, R.; Ouyang, W.; Li, H.; Wang, X. Saliency detection by multi-context deep learning. In Proceedings of the 2015 IEEE Conference on Computer Vision and Pattern Recognition (CVPR), Boston, MA, USA, 7–12 June 2015; pp. 1265–1274. [Google Scholar]
  47. Lee, G.; Tai, Y.W.; Kim, J. Deep saliency with encoded low level distance map and high level features. In Proceedings of the 2016 IEEE Conference on Computer Vision and Pattern Recognition (CVPR), Las Vegas, NV, USA, 26 June–1 July 2016; pp. 660–668. [Google Scholar]
  48. Liu, N.; Han, J. DHSNet: Deep hierarchical saliency network for salient object detection. In Proceedings of the 2016 IEEE Conference on Computer Vision and Pattern Recognition (CVPR), Las Vegas, NV, USA, 26 June–1 July 2016; pp. 678–686. [Google Scholar]
  49. Li, G.; Yu, Y. Deep contrast learning for salient object detection. In Proceedings of the 2016 IEEE Conference on Computer Vision and Pattern Recognition (CVPR), Las Vegas, NV, USA, 26 June–1 July 2016; pp. 478–487. [Google Scholar]
  50. Ren, S.; He, K.; Girshick, R.; Sun, J. Faster R-CNN: Towards real-time object detection with region proposal networks. IEEE Trans. Pattern Anal. Mach. Intell. 2017, 39, 1137–1149. [Google Scholar] [CrossRef] [PubMed]
  51. Shen, Z.; Liu, Z.; Li, J.; Jiang, Y.G.; Chen, Y.; Xue, X. DSOD: Learning deeply supervised object detectors from Scratch. In Proceedings of the 2017 IEEE International Conference on Computer Vision (ICCV), Venice, Italy, 22–29 October 2017; pp. 1937–1945. [Google Scholar]
  52. Zhang, J.; Huang, M.; Jin, X.; Li, X. A real-time chinese traffic sign detection algorithm based on modified YOLOv2. Algorithms 2017, 10, 127. [Google Scholar] [CrossRef]
  53. Fu, C.Y.; Liu, W.; Ranga, A.; Tyagi, A.; Berg, A.C. SSD: Deconvolutional single shot detector. arXiv, 2017; arXiv:1701.06659. [Google Scholar]
Figure 1. The hierarchical structure of the cerebral visual cortex and the hierarchical structure of our model. (a) The hierarchical structure of the cerebral visual cortex, [24]; (b) The hierarchical structure of our model.
Electronics 07 00216 g001
Figure 2. Illustration of our proposed network architecture.
Electronics 07 00216 g002
Figure 3. Human visual perception and processing system. (a) A diagram of information transmission of the visual channel [27]; (b) A schematic diagram of information transmission of the visual channel.
Electronics 07 00216 g003
Figure 4. The saliency region detection model based on dual channel and feature fusion. Our model mainly includes two parts, the sub-attention channel (indicated by the red dotted line) and the pre-attention channel (indicated by the green dotted line).
Electronics 07 00216 g004
Figure 5. The Schematic diagram of saliency of various features. In the figure, (a) is salient for the direction feature; (b) is salient for the texture feature; (c) is salient for the color feature; and, (d) is salient for the luminance feature.
Electronics 07 00216 g005
Figure 6. Three forms of Gabor convolution kernel. (a) is a vertical convolution kernel; (b) is a horizontal convolution kernel; and, (c) is a circular convolution kernel.
Electronics 07 00216 g006
Figure 7. The efficient sub window search algorithm.
Electronics 07 00216 g007
Figure 8. The (1) is the result of the saliency map generation in each stage of pre-attention channel; The (2) is the effect of saliency detection using only texture features.
Electronics 07 00216 g008
Figure 9. The (1) is the effect of saliency detection using only color features; The (2) is the effect of saliency detection using only brightness features.
Electronics 07 00216 g009
Figure 10. The (1) is the sub-attention channel multi-feature fusion saliency detection effect diagram; The (2) is the double channel fusion saliency detection effect diagram.
Electronics 07 00216 g010
Figure 11. The rendering of the significant region fusion of Gestalt visual psychology. (a) Original image; (b) a salient region map generated by the two-channel fusion; (c) an object saliency map that is generated after the regional fusion strategy is processed.
Electronics 07 00216 g011
Figure 12. Selected results from various datasets. We split the selected images into multiple groups, which are separated by solid lines. To better show the capability of processing different scenes for each approach, we highlight the features of images in each group.
Electronics 07 00216 g012
Figure 13. Precision (vertical axis) & Recall (horizontal axis) curves on three popular datasets and military object detection dataset (MOD) dataset.
Electronics 07 00216 g013
Figure 14. The diagram shows the effect of the algorithm on the detection of military objects in various scenarios.
Electronics 07 00216 g014
Table 1. Quantitative comparisons with 11 methods on five datasets.
MethodsPASCALSHKU-ISKITTIMSRA-BMOD
FβMAEFβMAEFβMAEFβMAEFβMAE
RFCN0.8620.1270.8790.0810.8160.2350.9380.0790.8250.229
RC0.6310.2450.7160.1850.6980.2760.8030.1590.6120.375
CHM0.6110.2750.6960.2050.6780.2890.7930.1680.6010.383
DSR0.6270.2550.7030.2350.6920.2790.8010.160.6080.379
DRFI0.8120.1490.8190.1310.8010.2550.9380.0790.7250.279
ELD0.7680.1210.8430.0730.8160.1680.9130.0410.7950.208
MDF0.7650.1470.8590.1310.7980.1690.8840.1150.7630.265
MC0.7230.1490.7920.1030.7320.1850.8720.0630.6910.325
DHS0.8190.1010.8920.0520.7850.2010.9060.0580.7390.298
DSSOD0.830.080.9130.0390.8960.0450.9270.0280.8030.196
OURS0.8520.0610.8960.0410.9120.0310.9150.0680.8750.082
Table 2. The comparisons with five methods on five datasets.
MethodsDatasetPf (%)Pm (%)Pd (%)Pe (%)Time (s)
Faster R-CNNKITTI11.2113.3460.3215.130.076
MOD16.2515.3850.8317.540.086
DSOD300KITTI14.4815.9163.386.230.017
MOD18.9519.2851.4210.350.021
YOLO V2 544KITTI13.3112.2959.8414.560.022
MOD15.1715.4949.4519.890.026
DSSDKITTI9.5310.6966.2513.530.018
MOD16.2413.1955.1615.410.028
OURSKITTI4.193.1390.472.210.106
MOD6.165.3782.056.420.185

