Real-Time Detection of Important Sounds with a Wearable Vibration Based Device for Hearing-Impaired People


1
Department of Computer Engineering, Faculty of Engineering, Ataturk University, Erzurum 25240, Turkey
2
Department of Computer Engineering, Faculty of Engineering, Karadeniz Technical University, Trabzon 61080, Turkey
*
Author to whom correspondence should be addressed.
Electronics 2018, 7(4), 50; https://doi.org/10.3390/electronics7040050
Submission received: 3 March 2018
/
Revised: 3 April 2018
/
Accepted: 5 April 2018
/
Published: 6 April 2018
(This article belongs to the Special Issue Data Processing and Wearable Systems for Effective Human Monitoring)
Abstract
:Hearing-impaired people do not hear indoor and outdoor environment sounds, which are important for them both at home and outside. By means of a wearable device that we have developed, a hearing-impaired person will be informed of important sounds through vibrations, thereby understanding what kind of sound it is. Our system, which operates in real time, can achieve a success rate of 98% when estimating a door bell ringing sound, 99% success identifying an alarm sound, 99% success identifying a phone ringing, 91% success identifying honking, 93% success identifying brake sounds, 96% success identifying dog sounds, 97% success identifying human voice, and 96% success identifying other sounds using the audio fingerprint method. Audio fingerprint is a brief summary of an audio file, perceptively summarizing a piece of audio content. In this study, our wearable device is tested 100 times a day for 100 days on five deaf persons and 50 persons with normal hearing whose ears were covered by earphones that provided wind sounds. This study aims to improve the quality of life of deaf persons, and provide them a more prosperous life. In the questionnaire performed, deaf people rate the clarity of the system at 90%, usefulness at 97%, and the likelihood of using this device again at 100%.
1. Introduction
Sound is a biometric feature used to distinguish people or species from one another. By processing an existing audio signal, it is possible to detect whether this sound comes from a human or another object. Since voices differ from one person to another, they can be used for voice recognition purposes. It is also possible to control or direct various devices through words obtained from sound signals. Therefore, the processing and use of an audio signal is very important [1]. Hearing is a very important sensory function for people. Developing a device that can perceive and classify various voices at home, and thereby improve the quality of life for hearing impaired people, is regarded as a basic requirement. A fire alarm or a phone alert that warns against danger are some of the sounds that should be perceived to encourage an urgent action.
In recent years, there have been many developments in the field of wearable technology, both academically and industrially [2]. Due to factors including the high cost of modern health care, development of microcontroller technology, reduction in sensor dimensions with respect to the development of technology, and significant developments in wearable processing, applications of wearable technology products in the healthcare field are becoming more frequent. Recently, health practices have been widely used in civilian life in both patient follow-up and treatment. Glove-operated surgical robots that facilitate doctors’ operations are a current example of wearable technology in the field of health care [1,3].
Using wearable objects and specialized signal processing methods presents new opportunities and visualizations for applications. Development of technology has made it possible to produce low cost, portable, remote-access patient monitoring systems. Real-time data analysis can be made by these systems, and they can be worn directly on the human body [4]. In recent years, research, especially on speech data, has gradually increased to meet the demands of developing world. This is because speech data such as audio and voice data are those that are closest to human life, and that they can best express daily life. Recently, research on audio-based systems and deep-learning technologies has increased rapidly [5]. The first studies in this area predominantly addressed the content-based general sound classification problem [6,7,8].
Various methods have started to be used in communication between people and machines in parallel with developments in technology. One of the methods developed for communicating between human and machine is voice recognition. A general structure of sound recognition systems is given in Figure 1. First, speech/voice is exposed to the step of preprocessing. Generally, sound is made more understandable in this step. In the step of feature extraction, distinctive features of sound data are determined. Which sound data are new sounds is determined.
2. Related Works
Ma et al. [9] presented an adaptable system for classification of environmental sounds, as well as experimental results of this system. They used the Mel Scale Cepstrum Coefficients (MFCC) method in feature extraction from audio files of environmental sounds, and used the Hidden Markov Model (HMM) algorithm as a classifier in model training. Additionally, they performed a separate test, where people listened to audio files. The overall success rate was reported at 92%. When these tests were applied to people, the correct detection rate of the classes remained at 35%.
Eronen et al. [10] conducted a study on the identification of environmental sounds. In the proposed system, HMM and K Nearest Neighbors (KNN) algorithms were used as classifiers for model training. While the performance of the system of environmental sound recognition was 69%, the success rate declined to 58% when the test was performed on real people.
Su et al. [11] designed a system for ambient sound detection. They used the Local Discriminant Bases technique in their study. With this technique, the distinction of time–frequency subspaces for ambient sounds is defined. Evaluation of their study indicated that they obtained 74.3% and 81% accuracy rates. However, when audio with background noise in the dataset was used, the overall accuracy percentage declined to 28.6%.
Wang et al. [12] proposed a system classifying 12 ambient sound voices. They applied Support Vector Machine (SVM) and KNN methods as classifiers in model training.
Reed and Delhome [13] researched whether environmental sounds can be recognized with the help of a tactile wearable.
Chu et al. [14] studied identification of ambient sounds. By separating the sound signals into different levels, this study showed different representations of the same signal. They reported that sounds can be better defined in this manner.
Alias et al. [15] presented an up-to-date review of the techniques for revealing features of developed speaking, music and environmental sounds to analyze the most common sound signals in their studies.
Shin et al. [16] studied coughing for the detection of a patient’s unusual health conditions. This application, designed in real-time, can follow a medical condition and detect abnormalities using acoustic information. A mixed model consisting of artificial neural networks (ANN) and HMM was used during classification to distinguish the cough sound from other voices in the environment. This proposed mixed model yielded better results than conventional systems designed using the HMM classifier and the MFCC feature.
Schröder et al. [17] proposed a system for the detection of ambient sounds. Their study consisted of a two-layer GMM classifier.
Niessen et al. [18] proposed methods for classifying ambient sounds. They used different methods, such as MFCC and Zero Crossing Rate (ZC), for feature extraction from audio files. They reached an accuracy of 34.51% resulting from evaluations based on a sound clip.
Kugler et al. [19] focused on grounded applications, and proposed a voice recognition method designed for ambient voices.
Jeyalakshmi et al. [20] offered a speech recognition system for normal hearing and hearing-impaired children. This system was developed using MFCC feature extraction and HMM. Its accuracy was determined to be 92.4% for hearing impaired speech, and 98.4% for normal speech. This system can be used by others to recognize speech from those who are hearing-impaired.
Sakajiri et al. [21] developed a voice step control system with the aim of helping their songs via a touch screen for deaf in their studies.
Kingsbury et al. [22] studied a robust speech recognition system, free of noise, using a modulation spectrogram. They classified the cleaned sound samples with a modulation spectrogram using ANN and HMM.
Reynolds et al. [23] developed a speaker-recognition system that makes authentication. The Gaussian method was used for recognition in the system.
Lozano et al. [24] developed an application to resolve daily issues that could lead to serious problems for hearing-impaired people.
Oberle and Kaelin [25] submitted a signal-recognition system for touch-sensitive hearing instruments using HMM.
Beskow et al. [26] developed a Home Hearing (HAH) project in their study. This HAH is an innovative media center solution that provides real-time speech and reading support with a variety of integrated features including audio raise, audio reduction, audio classification and event perception. These features support speech and audio perception for hearing support. The average accuracy of this classifier was found to be 82%.
Seoane et al. [27] developed a project to conduct speech processing with wearable biomedical measurement systems.
Shull and Damian [28] in their review determined that a wearable devices with a function for hearing loss has been developed.
Deep Neural Network (DNN), which has manyf hidden layers and is trained using new methods, has sometimes shown better performance than Gaussian mixture models (GMMs) with a big difference in various speech recognition criteria [29]. Salomon and Bella [30] proposed a DNN architecture for the classification of ambient sounds. Dahl et al. recommended a new content-dependent model for speech recognition with broad identification. This model takes advantage of the latest developments in the use of DNN for phone recognition [31]. Deng et al. presented experimental proof that DNN with MFCC is outstanding in terms of speech spectrogram features [32].
3. System Description
As shown in Figure 2, our device consists of four parts. Raspberry Pi (Rpi), which is the size of a credit card, was developed by the Rpi Company (Bath, UK) to teach basic computer sciences at schools. The developed Rpi is expressed as a mini computer [33]. The grove is a shield card that allows us to use grove sensors, as it possesses over 15 sensor connections. A microphone is used to receive and process ambient sounds. Microphone obtain sound data, which are processed in Raspberry Pi environment. Thanks to USB Sound Card, it is connected to Raspberry Pi environment. After sound is obtained, the nature of the sound is determined using various methods. A vibration motor sends a warning to the user, which is perceived through the sense of touch. For each sound, a different vibration stimulus is given to the hearing-impaired person so that they can identify each sound in this manner.
Our wearable, real-time operational device detects the sound first with a microphone, identifies the sound, and conveys this information to the user through vibrations. The coding of our real-time operating system was done using the Python (version 2.7) programming language. The wearable device we developed is mounted on the person in the outdoor and external environment. When our system senses a dog’s sound, it transmits it to the deaf person. In this way, it is thought that deaf person would have a safer life. In addition, this device can successfully identify the sound of a bell ringing in the home environment, as well as easily distinguish important voices. Our system produces a different level of vibration and intensity for each sound. First, the user is trained for 10 min, during which a vibration is given for each sound as explained in the training phase. After this training, the user can easily distinguish between different sounds.
4. Methods
For voice recognition to be performed using a computer, many pre-process applications are required from the perception of sound to sound recognition. Correct identification of the appropriate pre-processes depends on the performance of the voice recognition operating successfully.
4.1. Zero Crossing Rate
The crossing number of an audio signal through zero is known as Zero Crossing Rate (ZC). This number increases due to the presence of high-frequency noise in aural expression recordings in the areas where the audio signal is not found. The ZC is low in sections where aural expressions are included. This feature is used to determine the start and end points of aural expressions. With a ZC value, it is possible to measure the frequency of a signal. Since there are two zero crossings in each period of a sinusoidal signal, the signal frequency can be calculated by taking half the number of zero crossings. The number of zero crossings allows for period estimations of some sections of the signals that can change over time and obtain the frequency value for a periodic signal [34].
4.2. Mel Scale Cepstrum Coefficients
Mel Scale Cepstrum Coefficients (MFCC) are one of the most-used feature extraction methods, as it delivers high performance in sound recognition applications. MFCC models the way the human ear perceives sound. Sampling and windowing operations are applied to extract an MFCC vector from an audio signal. The continuous signal provided during sampling is discretized and multiplied by a function in the time domain during the windowing phase. Thus, the signal section intended for processing is taken. There are many windowing functions used in the MFCC feature extraction method, such as rectangle, Barlett, Kaiser, and Hamming [35,36].
4.3. Spectral Subband Centroids
Paliwal [37] proposed Spectral Subband Centroids (SSC), with the consideration that higher amplitude portions of a spectrum are relatively less affected by noise. SSC is used as a characteristic in addition to cepstral coefficients in speech and speech recognition. SSCs are calculated as central frequencies of lower bands and catch overriding frequencies in a short-term spectrum. SSCs are calculated as frequency centroids for every lower band coming from the power spectrum of a speech signal. Since SSCs catch almost constant spectral peaks in noisy environments, they can also be obtained safely under noisy conditions [37].
4.4. Line Spectral Frequencies
Line Spectral Frequency (LSF) parameters are another audio feature vector widely used in audio analysis speech recognition applications. LSF parameters occupy a unit circle, and concentrate on the places where the signal spectrum has high values. In other words, the LSF parameters indicate the shape of the spectrum. LSF parameters also indicate the property of distortion independence [38,39], meaning that any change in an LSF parameter does not have a global effect, and only affect the frequency spectrum close to it. Since the human ear is not very sensitive to higher frequencies, LSF parameters at higher frequencies can be represented with fewer bits using this feature.
4.5. Linear Prediction Cepstral Coefficients
Linear Prediction Coefficients (LPC) are used to indicate the envelope and short-term power spectrum of speech in different speech processing applications. Linear foresight expresses up-to-date values for a discrete signal as a linear function of the past values of that signal. Linear Prediction Cepstral Coefficients (LPCC) method is mainly based on the principle of transforming LPC coefficients into cepstral coefficients by Fourier transformation. First, LPC coefficients are obtained, followed by the other processes required in this method. The steps of the LPCC method are as follows: pre-emphasis, framing, windowing, autocorrelation analysis, LPC analysis, LPC-LPCC parameter transformation, parameter weighting, and derivative calculation. Consequently, parametric expressions are named as feature vectors. The aim of pre-emphasis is to equal spectral energy by empowering high-frequency components in a speech signal. LPCC is a spectral feature used in the implementation of practical sound recognition systems [40,41].
4.6. Linear Prediction Coefficients
Several algorithms can be used to recognize speech in the digital signal processing domain. The most important of these is the LPC. The basic principle in this technique is that sound samples are estimated using past examples. The sound sample is thought to be a linear combination of old samples, and the characteristic coefficients of the audio signal are calculated by approximation. The idea of LPC is based on a speech production model that uses an all-pole filter—a characteristic of the voice path. As such, LPC is the coefficients of this multipolar filter, and is equivalent to the softened envelope of the log spectrum of speech. Therefore, LPC can be calculated from the windowed speech section using direct autocorrelation or covariance methods [42].
4.7. Log Area Ratio
Log area ratios (LAR) can be used to represent the reflection coefficients for transmission over a channel. Although LAR is not as effective as line spectral pairs (LSP), it is easier to calculate log area ratios. LAR coefficients are obtained using LPC [43]. LAR is an objective measure of speech indicating it has more correlations with the quality of speech when it is subjectively evaluated by people.
4.8. K Nearest Neighbors
In this study, K Nearest Neighbors (KNN) was used for classification after the use of the attribute methods mentioned above. KNN is a trained learning algorithm aimed at classification of existing learning data when a new sample arrives. When a new sample arrives, the algorithm decides the class of the sample by looking at its nearest neighbor. The K value should primarily be determined in the KNN algorithm. When the K value has been determined, the distance to all learning samples must be calculated. Next, sorting is completed according to minimum distance. After the sorting process, the class value that the sample belongs to is identified [36,44].
In the KNN algorithm, which class it belongs to is determined when a sample comes from outside the training set. Choice of the value K is important here. The value K determines how many values sample are taken. To choose the most appropriate value of the value K, 10-Fold Cross Validation was used. Primarily, our training set was divided into 10 equal parts. Then, validation results were compared with respect to the values of K. As a result, the best classification achievement was obtained at K = 5.
4.9. Audio Fingerprint
An Audio Fingerprint (AF) is a brief summary of an audio file, perceptively summarizing a piece of audio content, and storing it in a database. When presented with unlabeled sound, its fingerprint was calculated and matched to sounds stored in the database. Firstly, spectrograms were obtained from the sound data. Next, the peaks were found and an extract fingerprint is created. Our system then identified this sound. According to the Nyquist theorem, effective sampling was performed with a sampling frequency at least twice as large as the sound frequency. In this study, 44,100 samples were taken per second.
Samples were taken from a song as signal with FTT repeatedly used in small time windows during sampling to create a spectrogram of a song. Spectrograms are 2D arrays at wave amplitude as time and frequency functions. The FFT showed the signal strength, or amplitude, at a specific frequency giving a column. After carrying out this action enough times in the sliding window, we put them together, and obtained a 2D array spectrogram and used the created spectrogram to define the uniqueness of a voice. As sound fingerprint, combinations composed by taking advantage of time and frequency differences of peak points in spectrogram were used. Its magnitude was lower than other pairs and it provided that noise decreases. Even if some new peak points occurred because of noise, it would not affect other peaks greatly, because peaks were locally independent from each other. First, we found amplitude peaks from a spectrogram of the audio signal. A time–frequency point in a spectrogram is the peak when it has a higher energy level than all neighboring peaks in that region. Peak points are defined as the time–frequency pair corresponding to the largest neighboring amplitude value. Other pairs around this value are low in terms of amplitude, and, therefore, likely receive less noise. After removing noise-resistant peaks, points of interest of a sound that describes it were found. Despite some new peaks due to noise, they did not affect other peaks, since the peaks were locally independent of each other. Similarly, if some peaks were deleted, most were maintained. This representation is called a constellation map in the literature. Fingerprint combinations were obtained by matching the peaks of the constellation map in binary combinations. Anchor points were selected, and each anchor point had a target region, where each anchor point paired up with a peak point within the target region. It is important to determine the number of anchor points and the size of the target region. The number of anchor points selected and the size of the target region determine the number of combinations to be created, the resulting storage space requirement and the cost of the calculation [45].
As seen in Figure 3, our system was composed of four phases. Primarily, sound was sensed. Then, that sound was determined using AF method. Finally, by giving different vibrations for every sound, user could sense sound was ensured. In the phase of AF method, sampling of the sound was done first. Sampling is the process of transforming analog signal into sample series. Energy between two sampled points was not considered; if rate of sampling was chosen at a certain value, sampled signal contained the same data with original signal according to Nyquist’s theorem. This rate should be at least two times more the highest value of frequency. The samples are signals; FFT was used repeatedly from samples of the sound on little time windows to create spectrogram of the sound. Using it with a shifting time window repeatedly ensured that the time–frequency graph or spectrogram showing the change of frequency constituents over time could be obtained. We found the peak points of maximum from spectrogram of the sound signal. Time that corresponds to maximum, the highest one amongst neighborhoods around the peak point, is a frequency twin. Finally, fingerprint hashing is done. By combining peak points with fingerprints, we find the appropriate trace for that sound. Hash function has been used for this reason.
5. Experimental Results
5.1. Test Environment
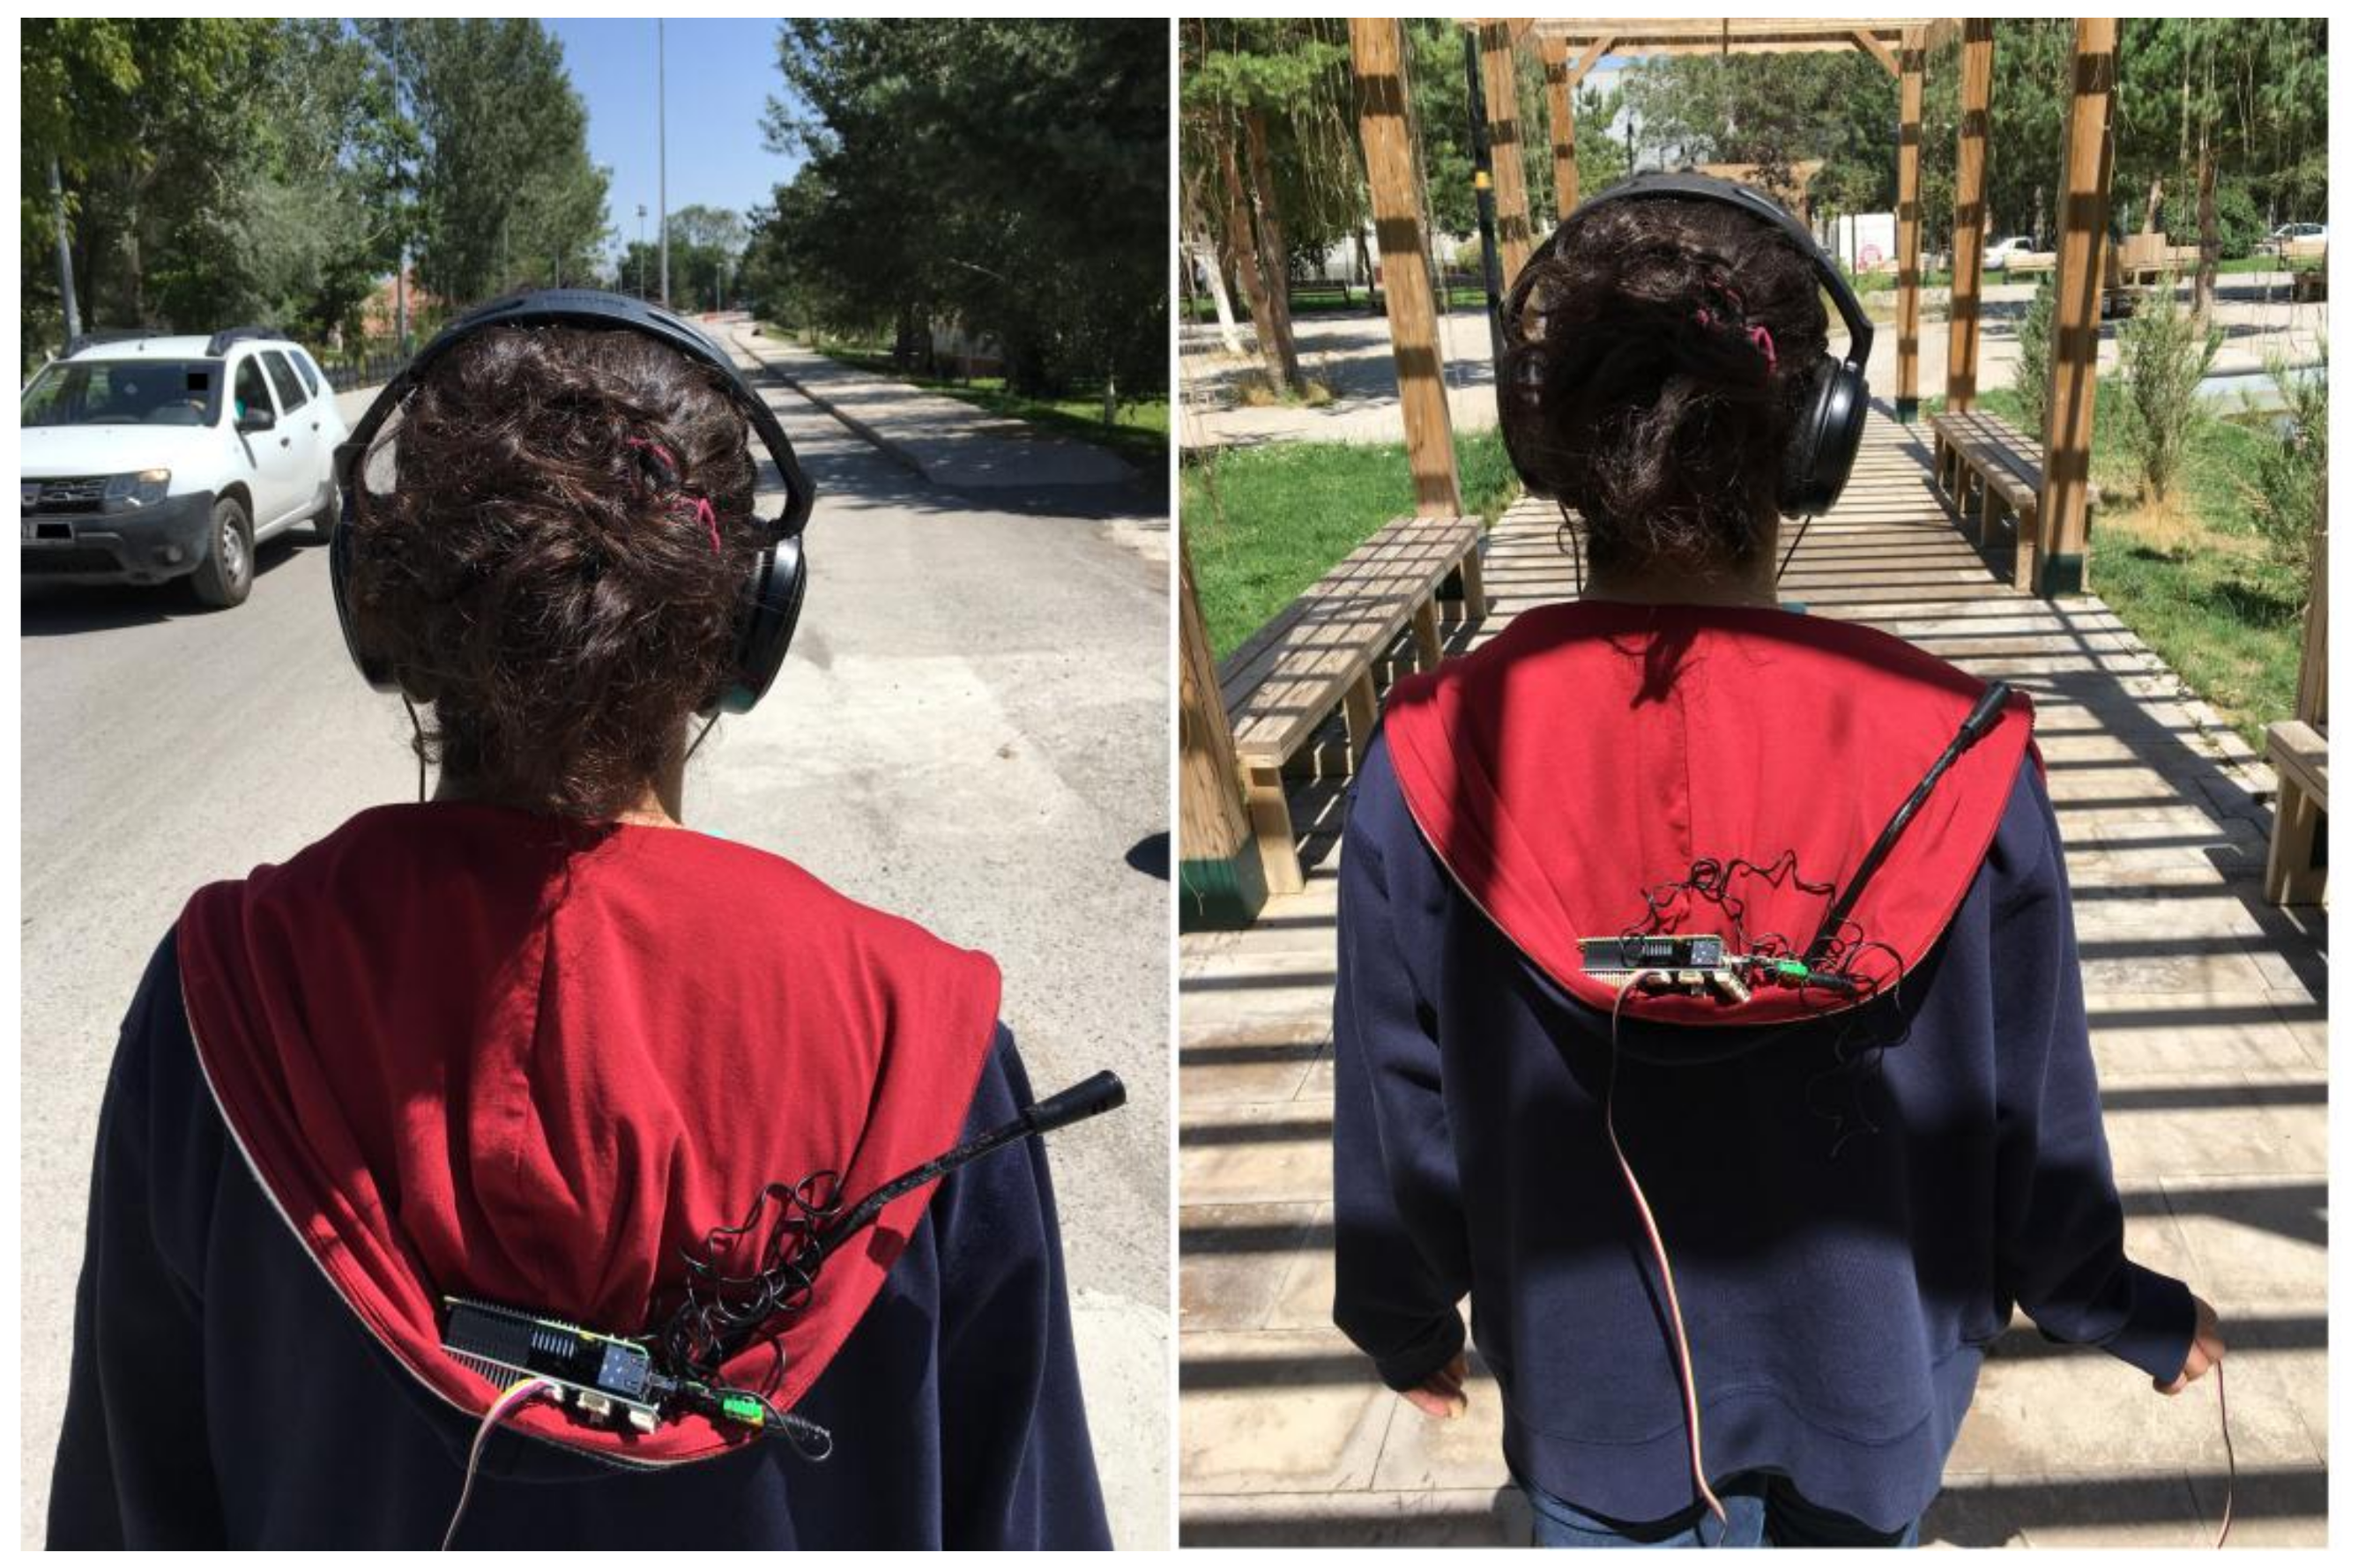
The prediction of sounds that arrive in real-time was made by means of wearable device we have developed. As shown in Figure 5, the wearable device placed on the user’s back region instantly responds to the user. In this way, the hearing-impaired user can easily understand the voices around them, thereby experiencing an increased standard of living. The wearable device we have developed has been tested by three men whose average age is 41 and two women whose average age is 33. Normal hearing individuals in this study consisted of 45 men and five women, whose ears were covered by wind-voiced earphones. The best results in the computer environment were obtained by AF method. For this reason, in real-time tests, AF method was used.
A different level and magnitude of vibration has been given for every sound. Thus, eight different sounds have been distinguished thanks to recognition of different vibrations. With regard to education, these states have been described to a deaf person step-by-step, and quickly understood which level of vibration is for which sound. For example, a vibration has been given for indoor sounds, such as telephone, alarm and doorbell, for vibrating once, twice and three times, respectively. The differences have been made based on magnitude and period between vibrations. With these vibrations, a deaf individual can distinguish between outdoor sounds such as a honk, a dog barking, and a brake sound.
5.2. Performance Criteria
The information obtained as a result of the tests can be expressed in a confusion matrix. The structure of the confusion matrix is given in Table 1. According to the matrix, the rows represent the actual classes of the samples in the test set, and the columns represent the estimated values. The most popular and simple method used to measure model performance is the model’s accuracy rate, which is the ratio of the number of correctly classified samples (True Positives (TP) + True Negatives (TN)) to the total sample number (True Positives (TP) + True Negatives (TN) + False Positives (FP) + False Negatives (FN)). In this study, accuracy, sensitivity and specificity were used as evaluation criterion. Their calculation is expressed by Formulas (1)–(3). In this study ROC curves were used as another evaluation criterion.
The construction of the confusion matrix occurred at the end of our study, as presented in Table 2.
After the part including first 800 ms of data of the sound coming from our system was taken, vibration has been given by determining which sound it is by AF method within 1100 ms. Thus, operating time lasts for 1900 ms. In our real-time system, the best results were obtained by the AF method, as shown in Figure 6 and Figure 7. A high success rate was obtained for both indoor and outdoor sounds using the AF method. As shown in Figure 7, people can sense, with general city noise and other effects, 55 dB(A) on average such outdoor sounds as honk, brake and dog barking.
A fingerprint is created for every sound. New sound data are transmitted to user by going through the same phases after pairing with any sound. Dogs may have different sounds. In this study, 14 different dog sounds have been recognized and all of them have been classified as dog sound. At the same time, seven different honk sounds, four different brake sounds, five different doorbell sounds and three different alarm sounds have been recognized in the step of training. The best results have been achieved by MFCC after AF method. The ROC curves of the results of telephone, alarm, and ringtone obtained from real-time indoor sounds are shown in Figure 8. The ROC curves of the results of honk, brake, dog and human voices obtained from real-time outdoor sounds are shown in Figure 9. The results from real-time tests are shown in Table 3.
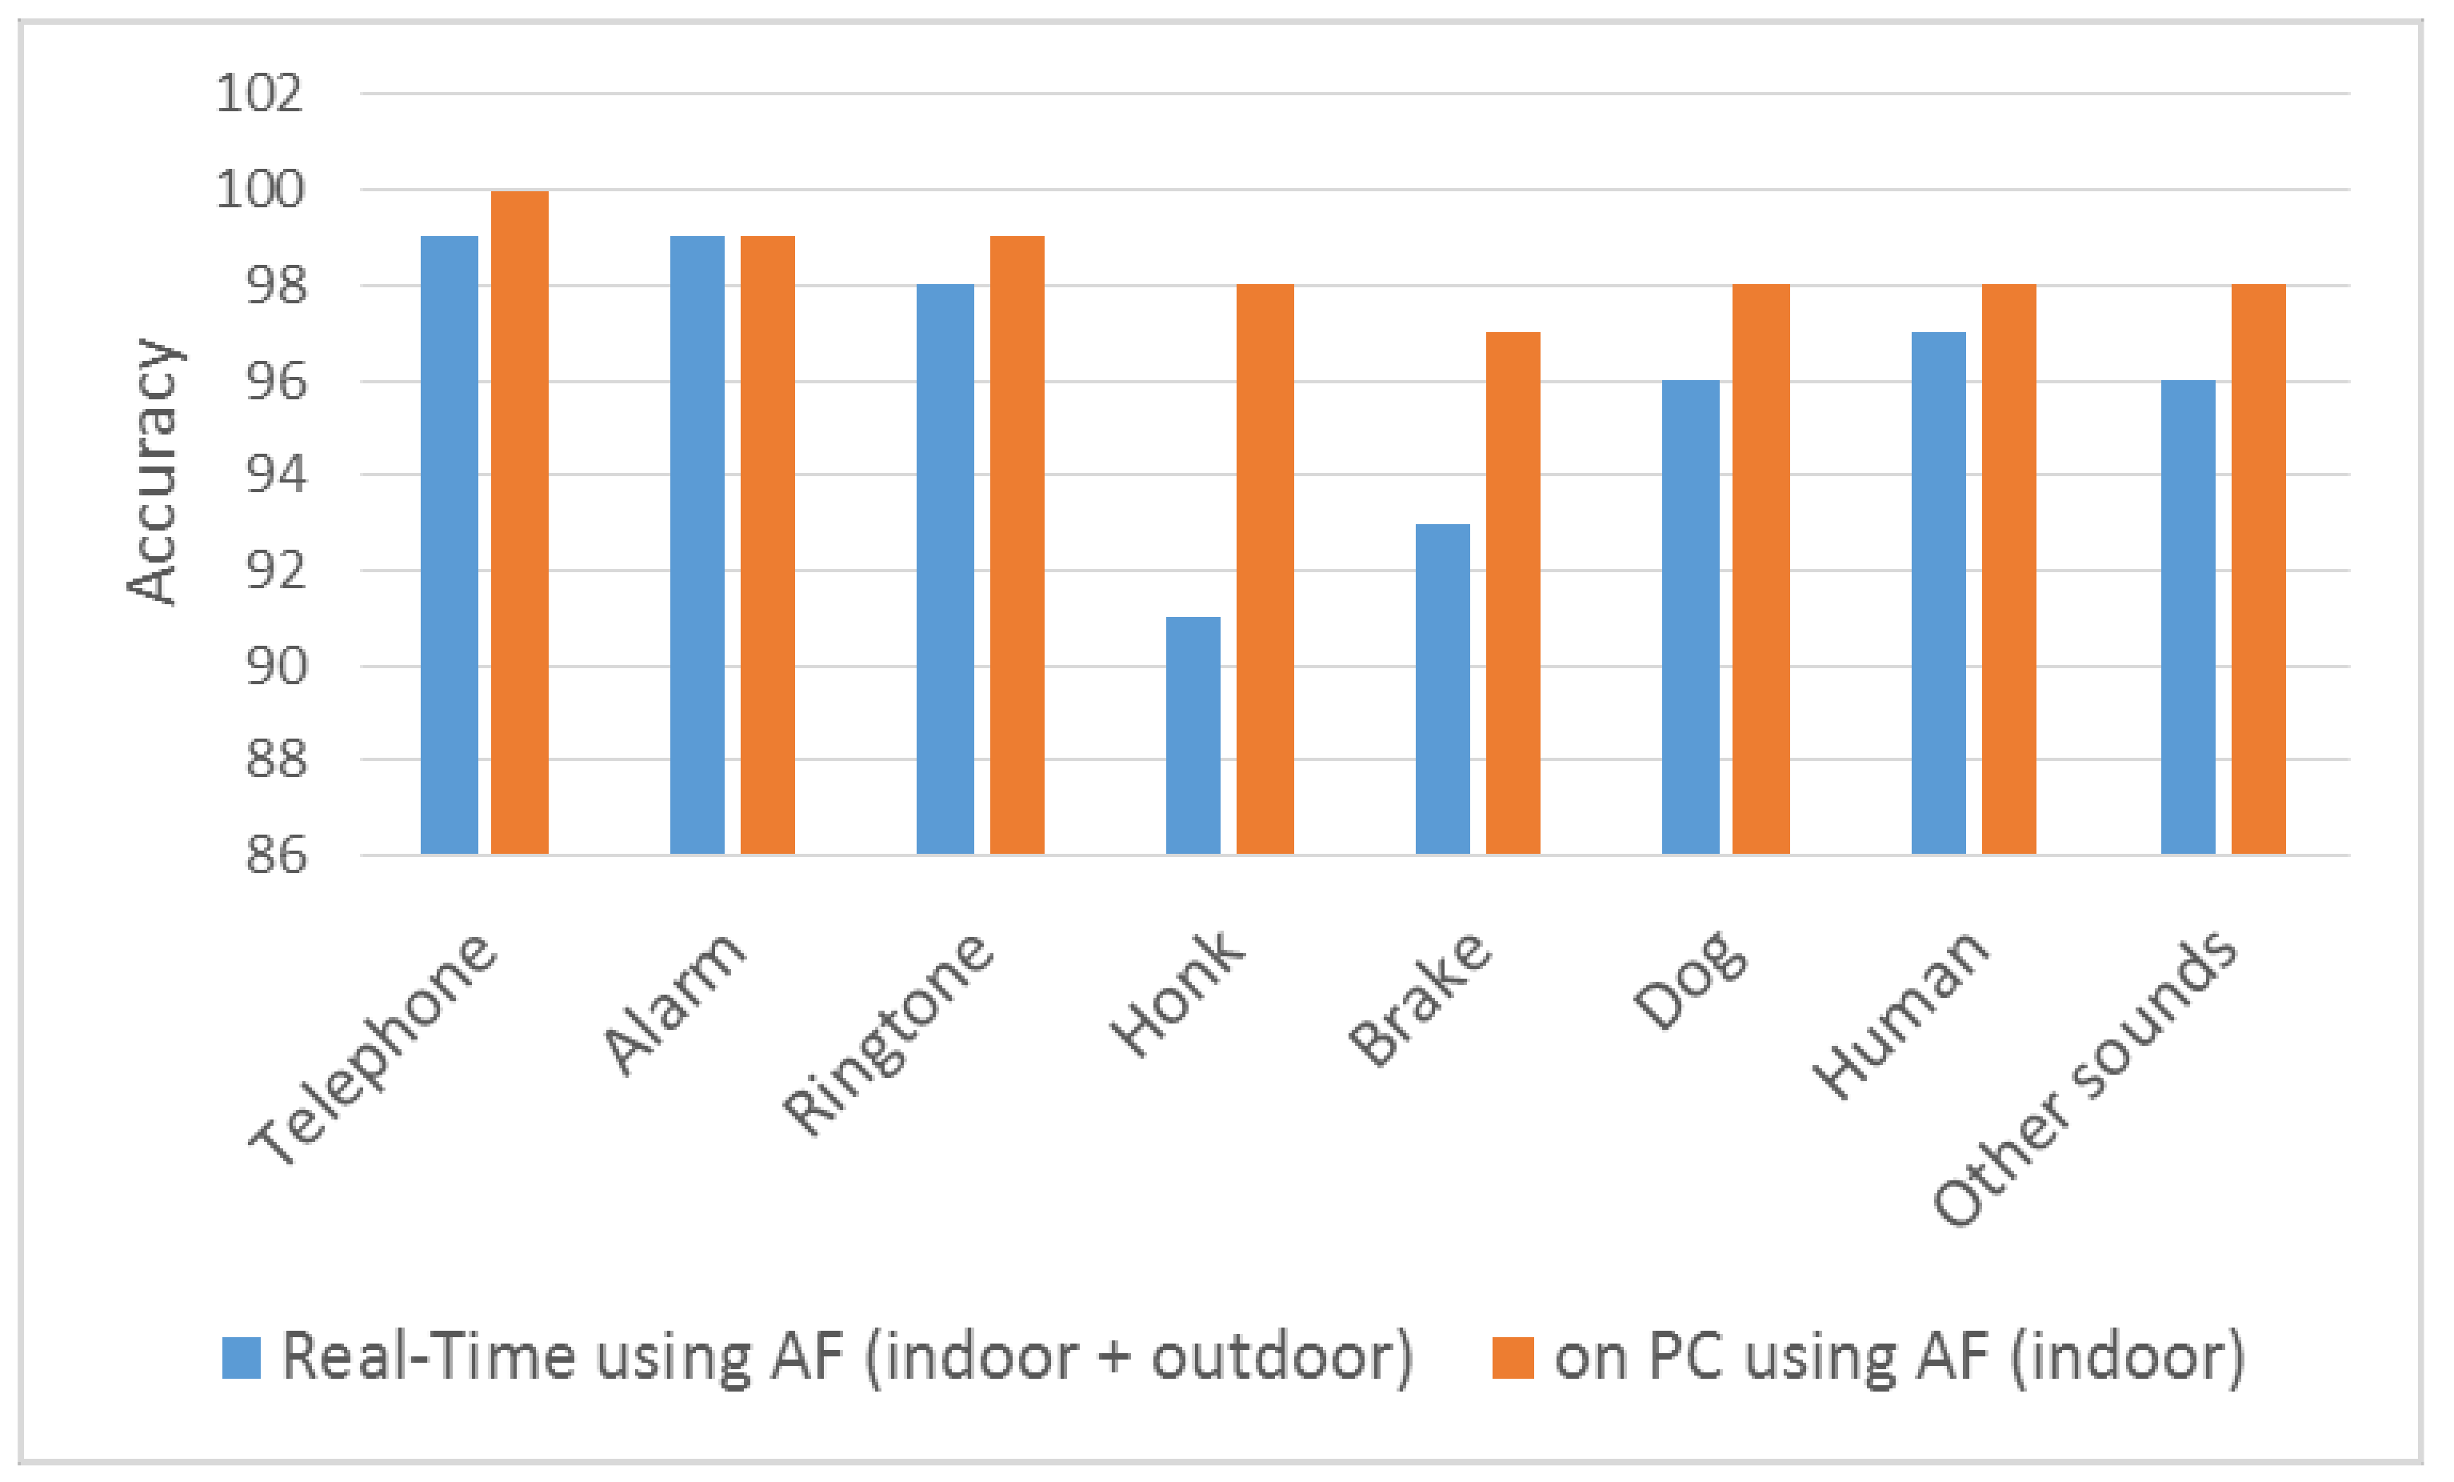
As shown in Table 4, our method achieved better success than other methods. As shown in Figure 10, the AF method has been tested in both real-time and indoor PC environments. In the computer studies, sound was given by a speaker and has been guessed. In Figure 6 and Figure 7, tests were conducted in both indoor and outdoor environments and conclusions are shown. Our study has been tested by giving sounds on speaker on PC environment at the same time. Using these tests without noise, the method we developed has obtained a high achievement in all sounds. As shown in Figure 10, the level of success in the outdoor environment seriously declines. PC environment means the results of tests performed on computer. Thus, honk data are recorded on PC and which sound it is was determined. For instance, honk sound is blown and it is determined on PC whether it is honk sound. High achievement rate has been obtained because there is no noise on PC.
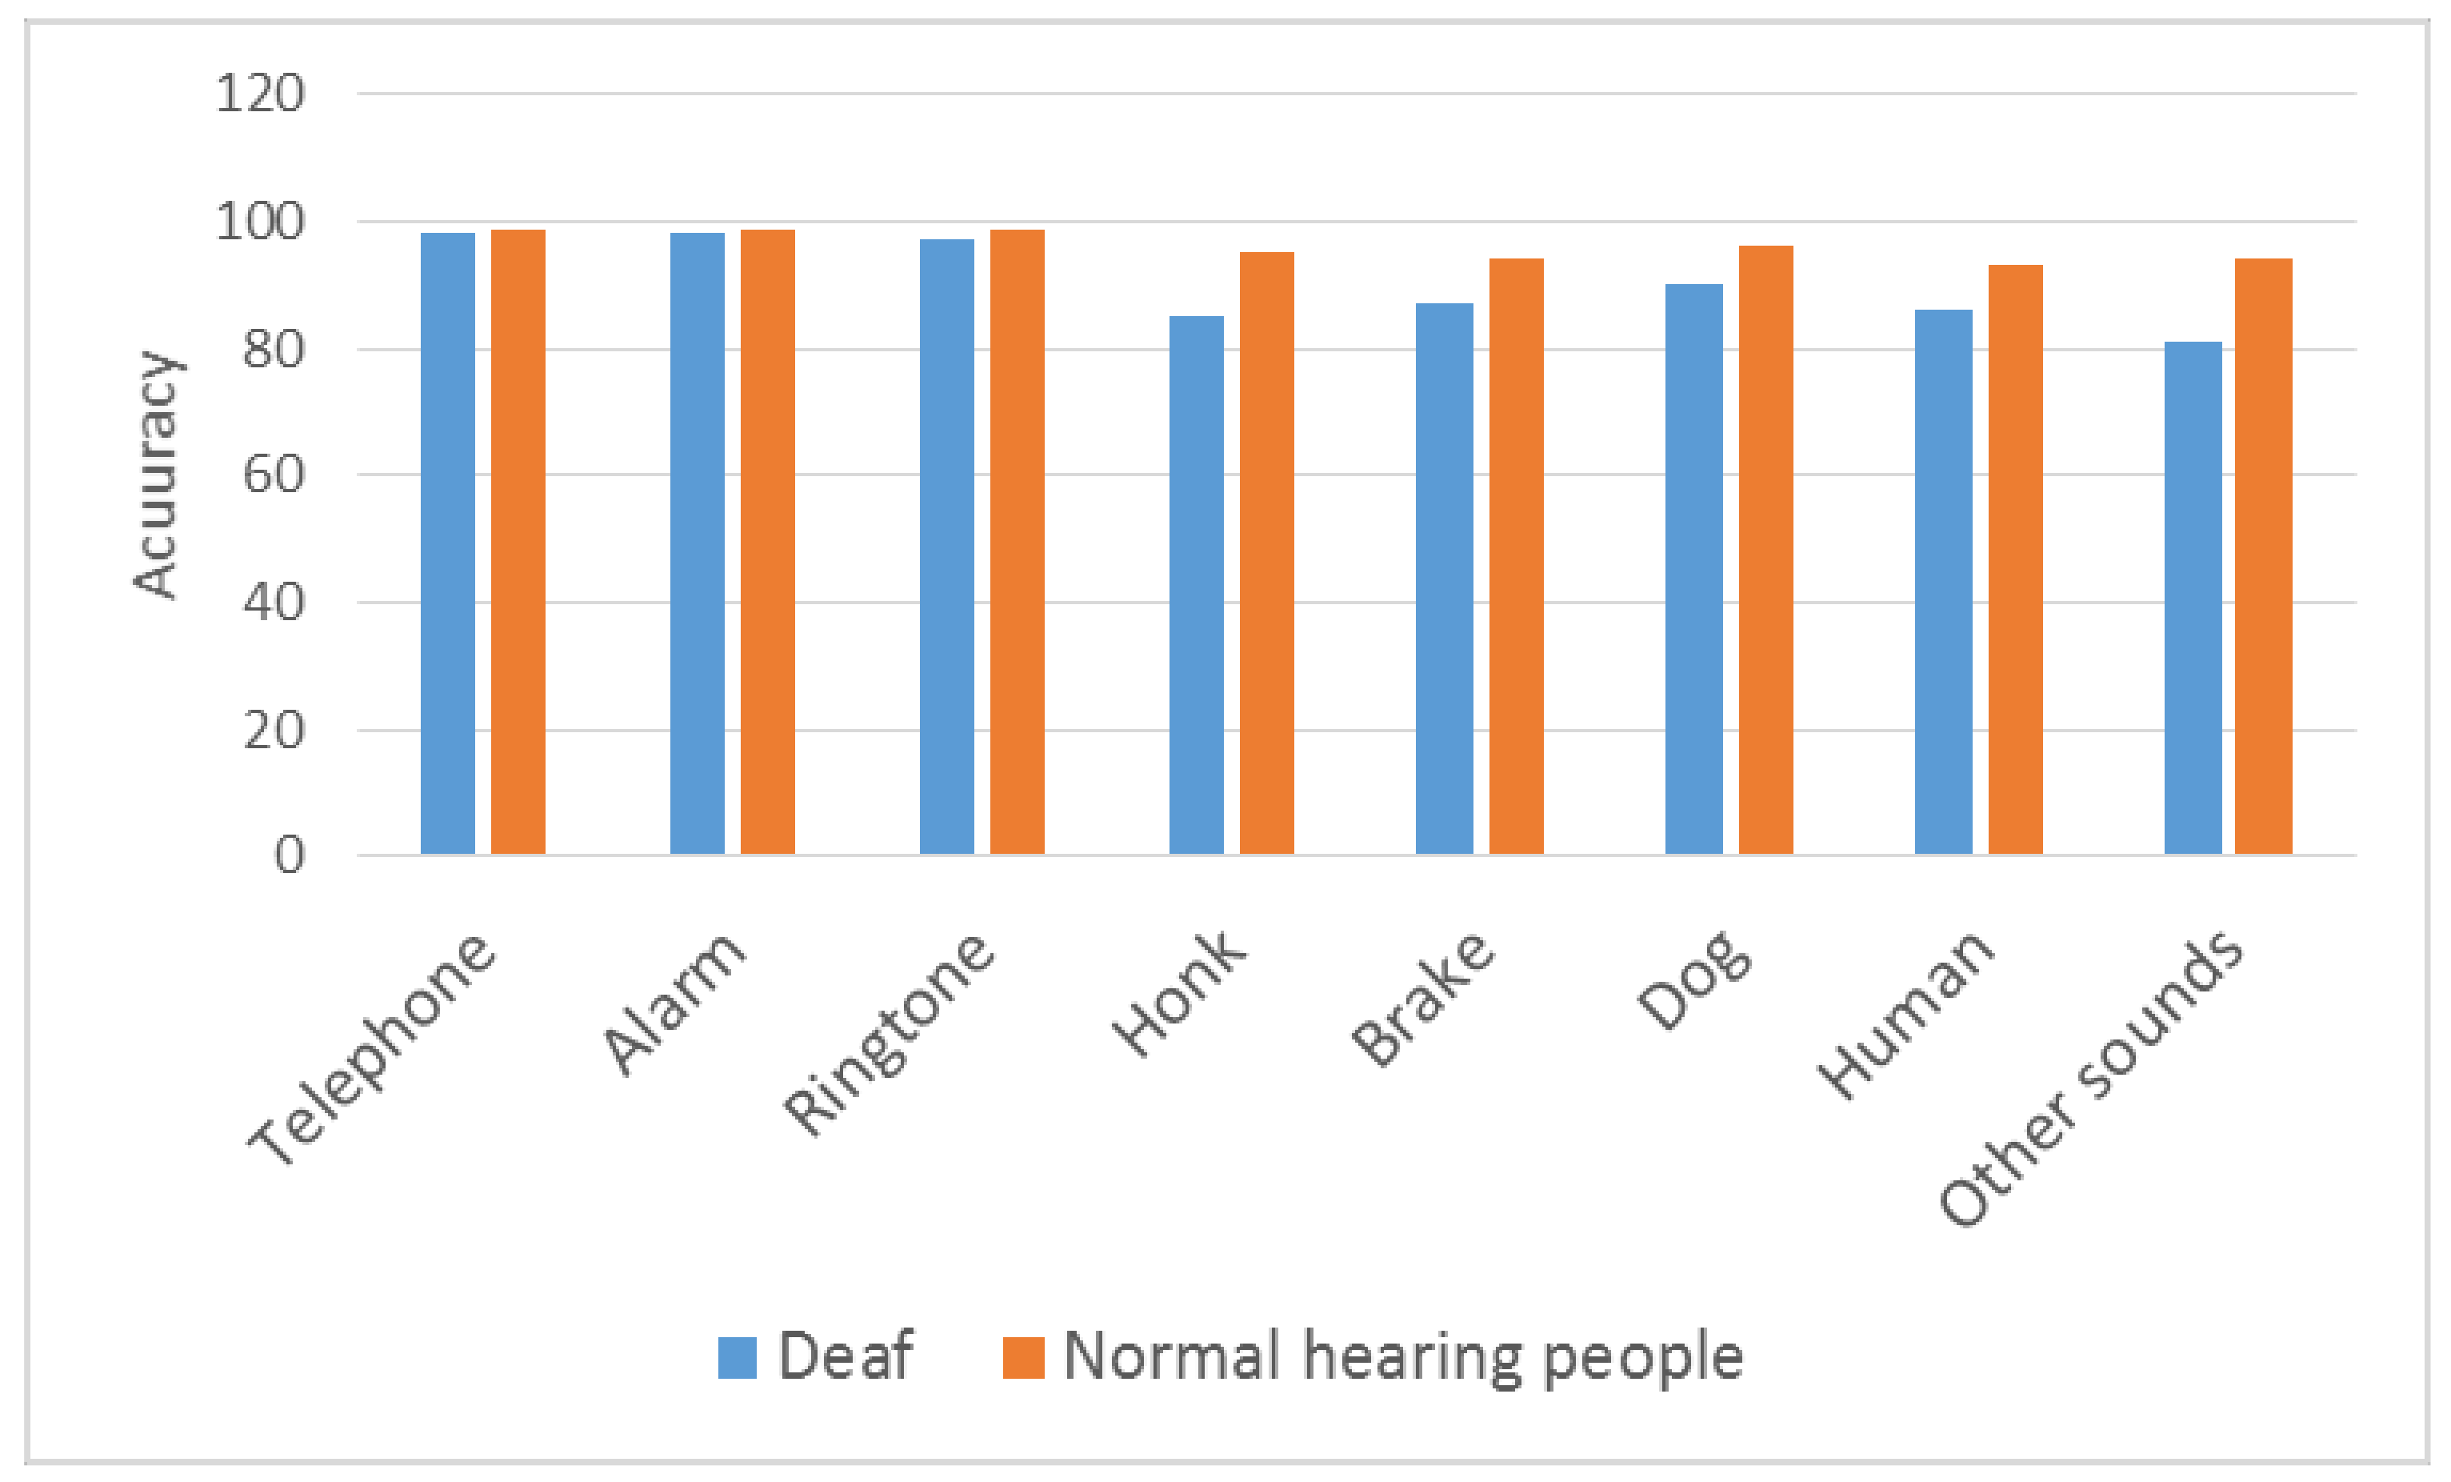
Comparison between those who are deaf and those with normal hearing after using the device is shown in Figure 11. Deaf people, who have significant problems sensing important sounds, sensed sounds in our real-time study at a high level. For example, sounds such as immediate vehicular braking, or an aggressive dog approaching a person can be considered an important outdoor sound that can cause fear in a person who is deaf, as well as decreased quality of life. As Figure 10 shows, a very high achievement has been provided in indoor sounds in the study with deaf people. While a deaf individual is sleeping, a doorbell or telephone may ring. Using the wearable device we developed, this person can sense a telephone ringing sound at 98%, an alarm sound at 98%, and a doorbell sound at 97%. This device allows a deaf individual to have an improved quality of life, comfortably sensing sounds in a home environment similar to those with normal hearing. With respect to outdoor sounds, there is an achievement in a honk sound at 85%, a brake sound at 87% and a dog sound at 90%.
6. Discussion
In this study, we first analyze the detection of sounds in an indoor and outdoor environment. The results show that the method we have developed has advantages over conventional methods, as it produces real-time results and achieves a high success rate. Our wearable device, consisting of Rpi, a microphone sensor and a vibration motor, is placed on the back of the hearing-impaired person. This device benefits from a low cost of production and high success rate (general accuracy is 94%), allowing it to be easily used in daily life.
The greatest feature of our study is that the device we have developed operates in real-time, and can be worn over a long period of time. Our device responds within average 1.9 s after receiving the voice. This systematic delay is a level that can be overlooked. The disadvantage of our system is that a sound comes and another sound may come at the same time. For instance, when there is a honk sound, a human sound may come. In that case, the first coming sound is sensed. In future studies, it is thought to transmit more important sound to user by recording coming sounds to prevent this case. Especially, honk, brake and dog sounds are of huge significance for disabled people outside. From this respect, it is thought that these sounds should be determined quickly with high achievement.
In our experimental studies, our rates of success declined in noisy environments. For instance, while the sound of vehicular horns can be determined correctly at 97% with the AF method on a computer, this rate decreases to 91% in a real-time environment. The main reason for this decline is that the sound is far away and there is noise.
Ma et al. [9], Eronen et al. [10], Su et al. [11] Wang et al. [12] and Wang et al. [46] studied environmental sound recognition, and have suggested the rates of success at 69%, 92%, 81%, 85% and 89.78%, respectively. When these rates of success are tested in real-time, there are dramatic declines. For instance, the rate of success reported by Su et al. [11] decreased to 28.6% in cases with noise, and the rate of success of Eronen et al. [10] decreased to 58% in cases where their process was tested on real people. In the study by Ma et al. [9], the human listening tests gave an overall accuracy of 35%. Wang et al. [46] used three S/N ratio (SNR) levels: 15 dB, 10 dB, and 5 dB. The rate of success of Wang et al. [46] decreased to 84.25% in cases with 15 dB noise. The rate of success of Wang et al. [46] decreased to 77.44% in cases with 5 dB noise. In our study, the rate of success decreased to 94% on average in the real-time tests applied on real people in an indoor and outdoor environment. In our study, SNR has been calculated as 20 dB on average. It has been calculated by averaging real-time studies in indoor and outdoor environments. In the trials in SNR at 15 dB, success has been gained at a rate of 90%.
In this study, a different vibration has been assigned for every sound. Different vibrations are sometimes complicated for deaf people. In this respect, vibration events in this system will be improved in future studies, and turned into a more user-friendly system. Since the sense of touch is active in deaf people, vibrations have been chosen as the means of communication. There is only a vibration motor the size of a coin wrapped over the finger of deaf person. Our wearable device is on the user’s back, positioned at a level that will not disturb them, and can be used for a long time.
Our system first carries out process with respect to voice it senses. For example, there are dog’s and human’s sounds, if dog’s sound comes first, it can sense that. When a mixture of sounds comes together, it is decided whether it is an important mixture of sounds by considering spectrogram of the sound. For example, when human voice and dog barking come at the same time, spectrogram can be determined by their (higher or lower) frequency magnitude levels. In that case, it has been ensured that deaf person can sense those sounds by giving vibrations that can help him to sense them. Our system senses the sound within 1.9 s if there is no coincidence. It decides with respect to loudness of voice if two sounds come at the same time. Our system misses it if a new sound comes within the period of sensing. However, it will be fixed in the next studies. In the future studies, it is thought that visualization will be added after sound is sensed. A new system will be developed for deaf people to understand sound better in the next studies.
Our system also works for the sounds coming from a distance. In our trials for dog’s sound, time of response decreased to 1.3 s. First 200 ms is enough for dog’s sound. By AF method, our wearable device predicts that it is dog’s sound in 1.3 s. A special mode has been thought about for dog bark. For it, a second Rpi system that is mounted and works only for dog bark has been considered.
While deaf people are walking, running or doing physical work, our system works. Tests are performed while people are walking in outer environment. In home environment, tests are performed while they are doing what they do in daily life. For instance, while a deaf person is cooking in the kitchen, doorbell is rung and it is expected that the deaf person senses it. Our wearable device is a device which is appropriate for long-term use and is user-friendly.
The wearable device we have developed is an easy-to-use and wearable device giving rapid output. Our device designed for deaf people is understandable and has a rapid decision-making mechanism for important sounds for deaf people. For instance, a deaf person does not hear door bell and telephone sound while sleeping and at home alone. Thanks to the device we have developed, a deaf person would sense these sounds very comfortably and have a life standard similar to normal people. As seen in the answers to the survey of deaf people using the device, everyone wants to use our device and thinks that it is beneficial. The questionnaire issued in this study indicates that deaf people perceived the clarity of the system to be 90%, the usefulness of the system to be 97%, and the likelihood of using this device again as 100%. Furthermore, one deaf patient wrote in the comments section of the questionnaire that his self-confidence increased following this study, and that he can sense such sounds as dog barking and vehicular braking in particular. Furthermore, the deaf patient indicated that this study will be very beneficial for those who are deaf, should this system be developed. This fulfills one of our major goals for this study, which is to improve quality of life for deaf individuals.
Author Contributions
M.Y. and C.K. designed the study; M.Y. performed the study; C.K. analyzed the data; and M.Y. and C.K. wrote the paper.
Conflicts of Interest
The authors declare no conflict of interest.
References
- Cornelius, C.; Marois, Z.; Sorber, J.; Peterson, R.; Mare, S.; Kotz, D. Vocal resonance as a passive biometric. Available online: http://www.cs.dartmouth.edu/~dfk/papers/cornelius-voice-tr.pdf (accessed on 1 March 2018).
- Chan, M.; Estève, D.; Fourniols, J.-Y.; Escriba, C.; Campo, E. Smart wearable systems: Current status and future challenges. Artif. Intell. Med. 2012, 56, 137–156. [Google Scholar] [CrossRef] [PubMed]
- Swan, M. Sensor mania! The internet of things, wearable computing, objective metrics, and the quantified self 2.0. J. Sens. Actuator Netw. 2012, 1, 217–253. [Google Scholar] [CrossRef]
- Rawassizadeh, R.; Price, B.A.; Petre, M. Wearables: Has the age of smartwatches finally arrived? Commun. ACM 2015, 58, 45–47. [Google Scholar] [CrossRef]
- LeCun, Y.; Bengio, Y.; Hinton, G. Deep learning. Nature 2015, 521, 436–444. [Google Scholar] [CrossRef] [PubMed]
- Chen, L.; Gunduz, S.; Ozsu, M.T. Mixed Type Audio Classification with Support Vector Machine. In Proceedings of the 2006 IEEE International Conference on Multimedia and Expo, Toronto, ON, Canada, 9–12 July 2006; pp. 781–784. [Google Scholar]
- Kim, H.-G.; Moreau, N.; Sikora, T. Audio classification based on MPEG-7 spectral basis representations. IEEE Trans. Circuits Syst. Video Technol. 2004, 14, 716–725. [Google Scholar] [CrossRef]
- Kiranyaz, S.; Qureshi, A.F.; Gabbouj, M. A generic audio classification and segmentation approach for multimedia indexing and retrieval. IEEE Trans. Audio Speech Lang. Process. 2006, 14, 1062–1081. [Google Scholar] [CrossRef]
- Ma, L.; Milner, B.; Smith, D. Acoustic environment classification. ACM Trans. Speech Lang. Process. 2006, 3, 1–22. [Google Scholar] [CrossRef]
- Eronen, A.J.; Peltonen, V.T.; Tuomi, J.T.; Klapuri, A.P.; Fagerlund, S.; Sorsa, T.; Lorho, G.; Huopaniemi, J. Audio-based context recognition. IEEE Trans. Audio Speech Lang. Process. 2006, 14, 321–329. [Google Scholar] [CrossRef]
- Su, F.; Yang, L.; Lu, T.; Wang, G. Environmental sound classification for scene recognition using local discriminant bases and HMM. In Proceedings of the 19th ACM International Conference on Multimedia, Scottsdale, AZ, USA, 28 November–1 December 2011; pp. 1389–1392. [Google Scholar]
- Wang, J.-C.; Wang, J.-F.; He, K.W.; Hsu, C.-S. Environmental sound classification using hybrid SVM/KNN classifier and MPEG-7 audio low-level descriptor. In Proceedings of the International Joint Conference on Neural Networks, 2006, IJCNN’06, Vancouver, BC, Canada, 16–21 July 2006; pp. 1731–1735. [Google Scholar]
- Reed, C.M.; Delhorne, L.A. The reception of environmental sounds through wearable tactual aids. Ear Hearing 2003, 24, 528–538. [Google Scholar] [CrossRef] [PubMed]
- Chu, S.; Narayanan, S.; Kuo, C.-C.J. Environmental sound recognition with time–frequency audio features. IEEE Trans. Audio Speech Lang. Process. 2009, 17, 1142–1158. [Google Scholar] [CrossRef]
- Alías, F.; Socoró, J.C.; Sevillano, X. A review of physical and perceptual feature extraction techniques for speech, music and environmental sounds. Appl. Sci. 2016, 6, 143. [Google Scholar] [CrossRef]
- Shin, S.-H.; Hashimoto, T.; Hatano, S. Automatic detection system for cough sounds as a symptom of abnormal health condition. IEEE Trans. Inf. Technol. Biomed. 2009, 13, 486–493. [Google Scholar] [CrossRef] [PubMed]
- Schröder, J.; Cauchi, B.; Schädler, M.R.; Moritz, N.; Adiloglu, K.; Anemüller, J.; Doclo, S.; Kollmeier, B.; Goetze, S. Acoustic event detection using signal enhancement and spectro-temporal feature extraction. In Proceedings of the 2013 IEEE Workshop on Applications of Signal Processing to Audio and Acoustics (WASPAA’13), New Paltz, NY, USA, 20–23 October 2013. [Google Scholar]
- Niessen, M.E.; Van Kasteren, T.L.; Merentitis, A. Hierarchical sound event detection. In Proceedings of the 2013 IEEE Workshop on Applications of Signal Processing to Audio and Acoustics (WASPAA’13), New Paltz, NY, USA, 20–23 October 2013. [Google Scholar]
- Kugler, M.; Tossavainen, T.; Nakatsu, M.; Kuroyanagi, S.; Iwata, A. Real-time hardware implementation of a sound recognition system with in-field learning. IEICE Trans. Inf. Syst. 2016, 99, 1885–1894. [Google Scholar] [CrossRef]
- Jeyalakshmi, C.; Krishnamurthi, V.; Revathi, A. Development Of Speech Recognition System For Hearing Impaired In Native language. J. Eng. Res. 2014, 2. [Google Scholar] [CrossRef]
- Sakajiri, M.; Miyoshi, S.; Nakamura, K.; Fukushima, S.; Ifukube, T. Voice pitch control using tactile feedback for the deafblind or the hearing impaired persons to assist their singing. In Proceedings of the 2010 IEEE International Conference on Systems Man and Cybernetics (SMC), Istanbul, Turkey, 10–13 October 2010; pp. 1483–1487. [Google Scholar]
- Kingsbury, B.E.; Morgan, N.; Greenberg, S. Robust speech recognition using the modulation spectrogram. Speech Commun. 1998, 25, 117–132. [Google Scholar] [CrossRef]
- Reynolds, D.A.; Quatieri, T.F.; Dunn, R.B. Speaker verification using adapted Gaussian mixture models. Digit. Signal Process. 2000, 10, 19–41. [Google Scholar] [CrossRef]
- Lozano, H.; Hernáez, I.; Picón, A.; Camarena, J.; Navas, E. Audio classification techniques in home environments for elderly/dependant people. In International Conference on Computers for Handicapped Persons, 2010; Springer: Berlin/Heidelberg, Germany, 2010; pp. 320–323. [Google Scholar]
- Oberle, S.; Kaelin, A. Recognition of acoustical alarm signals for the profoundly deaf using hidden Markov models. In Proceedings of the 1995 IEEE International Symposium on Circuits and Systems, ISCAS’95, Seatlle, WA, USA, 30 April–3 May 1995; pp. 2285–2288. [Google Scholar]
- Beskow, J.; Granström, B.; Nordqvist, P.; Al Moubayed, S.; Salvi, G.; Herzke, T.; Schulz, A. Hearing at home-communication support in home environments for hearing impaired persons. In Proceedings of the INTERSPEECH 2008, Brisbane, Australia, 22–26 September 2008; pp. 2203–2206. [Google Scholar]
- Seoane, F.; Mohino-Herranz, I.; Ferreira, J.; Alvarez, L.; Buendia, R.; Ayllón, D.; Llerena, C.; Gil-Pita, R. Wearable biomedical measurement systems for assessment of mental stress of combatants in real time. Sensors 2014, 14, 7120–7141. [Google Scholar] [CrossRef] [PubMed]
- Shull, P.B.; Damian, D.D. Haptic wearables as sensory replacement, sensory augmentation and trainer–A review. J. Neuroeng. Rehabilit. 2015, 12, 59. [Google Scholar] [CrossRef] [PubMed]
- Hinton, G.; Deng, L.; Yu, D.; Dahl, G.E.; Mohamed, A.-R.; Jaitly, N.; Senior, A.; Vanhoucke, V.; Nguyen, P.; Sainath, T.N. Deep neural networks for acoustic modeling in speech recognition: The shared views of four research groups. IEEE Signal Process. Mag. 2012, 29, 82–97. [Google Scholar] [CrossRef]
- Salamon, J.; Bello, J.P. Deep convolutional neural networks and data augmentation for environmental sound classification. IEEE Signal Process. Lett. 2017, 24, 279–283. [Google Scholar] [CrossRef]
- Dahl, G.E.; Yu, D.; Deng, L.; Acero, A. Context-dependent pre-trained deep neural networks for large-vocabulary speech recognition. IEEE Trans. Audio Speech Lang. Process. 2012, 20, 30–42. [Google Scholar] [CrossRef]
- Deng, L.; Li, J.; Huang, J.-T.; Yao, K.; Yu, D.; Seide, F.; Seltzer, M.; Zweig, G.; He, X.; Williams, J. Recent advances in deep learning for speech research at Microsoft. In Proceedings of the 2013 IEEE International Conference on Acoustics, Speech and Signal Processing (ICASSP), Vancouver, BC, Canada, 26–31 May 2013; pp. 8604–8608. [Google Scholar]
- Sukič, P.; Štumberger, G. Intra-Minute Cloud Passing Forecasting Based on a Low Cost IoT Sensor—A Solution for Smoothing the Output Power of PV Power Plants. Sensors 2017, 17, 1116. [Google Scholar] [CrossRef] [PubMed]
- Laleye, F.A.; Ezin, E.C.; Motamed, C. Fuzzy-based algorithm for Fongbe continuous speech segmentation. Pattern Anal. Appl. 2017, 20, 855–864. [Google Scholar] [CrossRef]
- Baranwal, N.; Nandi, G. An efficient gesture based humanoid learning using wavelet descriptor and MFCC techniques. Int. J. Mach. Learn. Cybern. 2017, 8, 1369–1388. [Google Scholar] [CrossRef]
- Noda, J.J.; Travieso, C.M.; Sánchez-Rodríguez, D. Fusion of Linear and Mel Frequency Cepstral Coefficients for Automatic Classification of Reptiles. Appl. Sci. 2017, 7, 178. [Google Scholar] [CrossRef]
- Paliwal, K.K. Spectral subband centroid features for speech recognition. In Proceedings of the 1998 IEEE International Conference on Acoustics, Speech and Signal Processing, Seattle, WA, USA, 12–15 May 1998; pp. 617–620. [Google Scholar]
- Soong, F.; Juang, B. Line spectrum pair (LSP) and speech data compression. In Proceedings of the IEEE International Conference on Acoustics, Speech, and Signal Processing, ICASSP'84, San Diego, CA, USA, 19–21 March 1984; pp. 37–40. [Google Scholar]
- Sugamura, N.; Farvardin, N. Quantizer design in LSP speech analysis-synthesis. IEEE J. Sel. Areas Commun. 1988, 6, 432–440. [Google Scholar] [CrossRef]
- Gulzar, T.; Singh, A.; Sharma, S. Comparative analysis of LPCC, MFCC and BFCC for the recognition of Hindi words using artificial neural networks. Int. J. Comput. Appl. 2014, 101, 22–27. [Google Scholar] [CrossRef]
- Adeniyi, K.I. Comparative Study on the Performance of Mel-Frequency Cepstral Coefficients and Linear Prediction Cepstral Coefficients under different Speaker's Conditions. Int. J. Comput. Appl. 2014, 90, 38–42. [Google Scholar]
- Chow, D.; Abdulla, W.H. Speaker identification based on log area ratio and gaussian mixture models in narrow-band speech. In PRICAI 2004: Trends in Artificial Intelligence; Springer: Berlin/Heidelberg, Germany, 2004; pp. 901–908. [Google Scholar]
- Glowacz, A. Diagnostics of DC and induction motors based on the analysis of acoustic signals. Meas. Sci. Rev. 2014, 14, 257–262. [Google Scholar] [CrossRef]
- Yağanoğlu, M.; Köse, C. Wearable Vibration Based Computer Interaction and Communication System for Deaf. Appl. Sci. 2017, 7, 1296. [Google Scholar] [CrossRef]
- Cano, P.; Batle, E.; Kalker, T.; Haitsma, J. A review of algorithms for audio fingerprinting. In Proceedings of the 2002 IEEE Workshop on Multimedia Signal Processing, St. Thomas, VI, USA, 9–11 December 2002; pp. 169–173. [Google Scholar]
- Wang, J.-C.; Lee, Y.-S.; Lin, C.-H.; Siahaan, E.; Yang, C.-H. Robust environmental sound recognition with fast noise suppression for home automation. IEEE Trans. Autom. Sci. Eng. 2015, 12, 1235–1242. [Google Scholar] [CrossRef]
Figure 1.
Speech/voice recognition system.
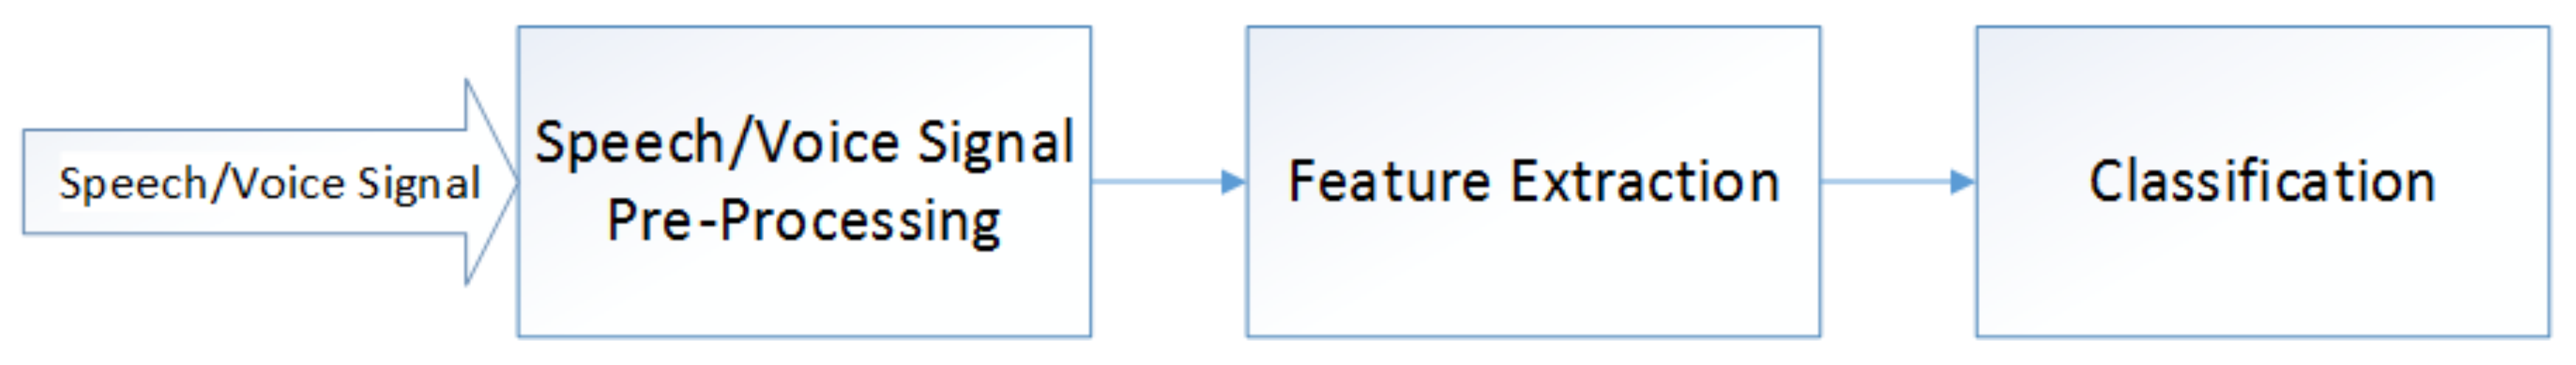
Figure 2.
Our developed wearable device.

Figure 3.
Our wearable device system.

Figure 4.
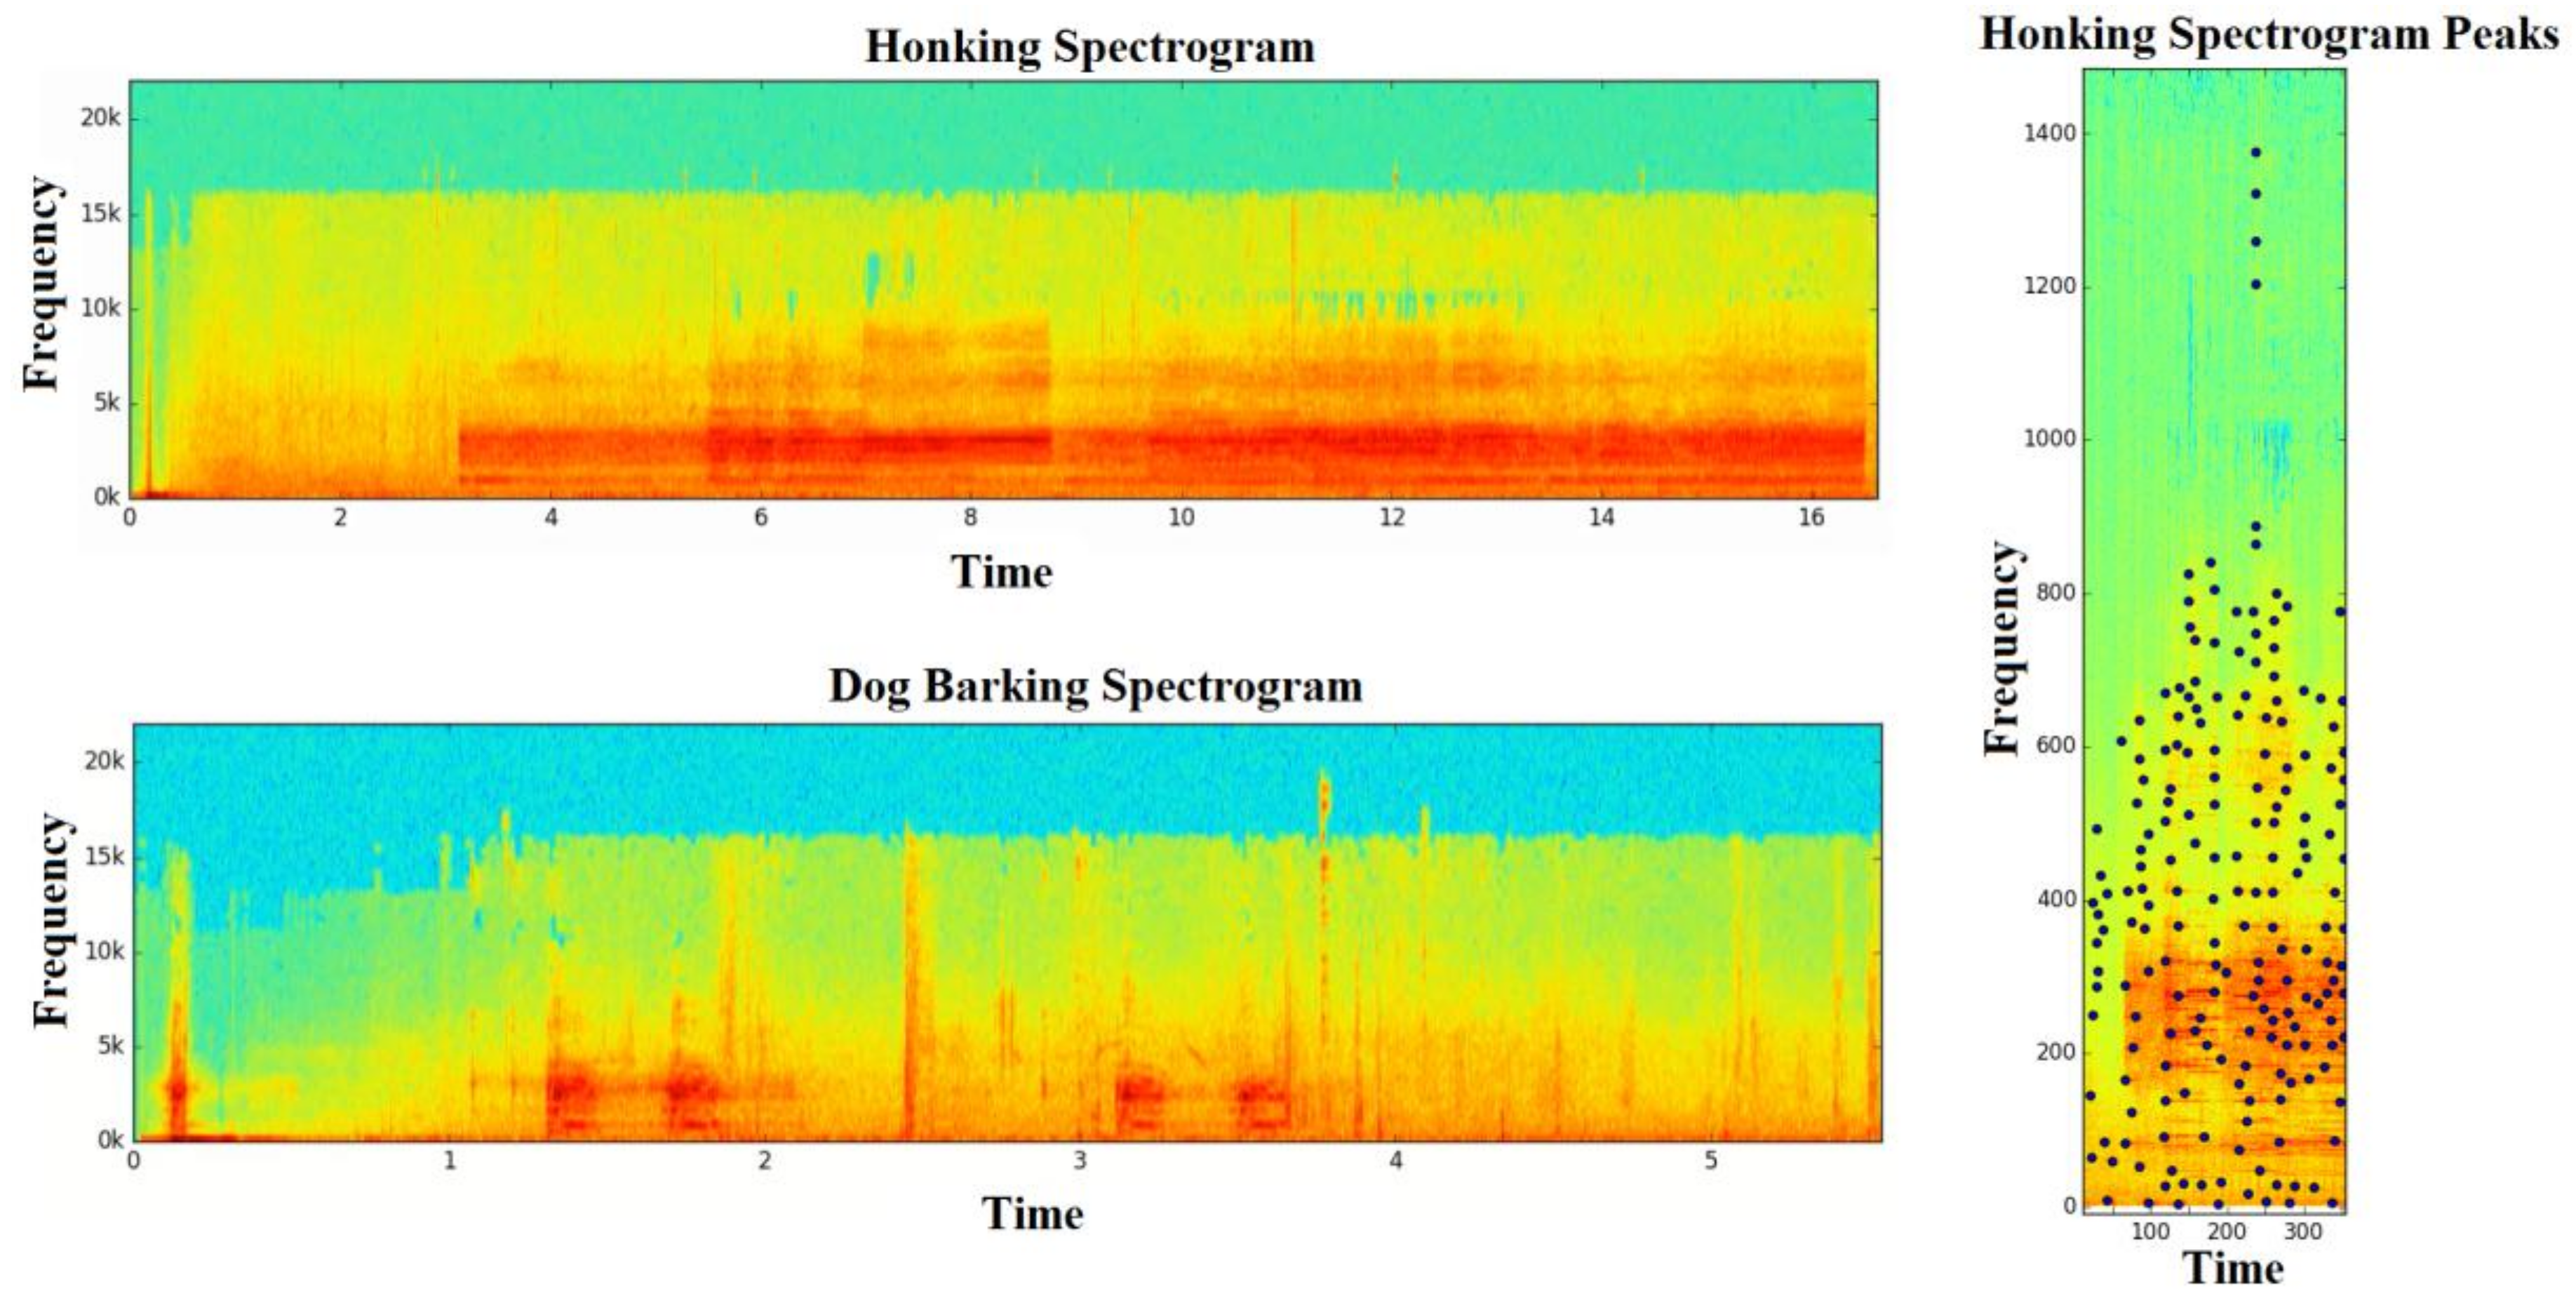
Different sounds spectrograms.

Figure 5.
Our wearable device test environment.

Figure 6.
Comparison of indoor sounds.
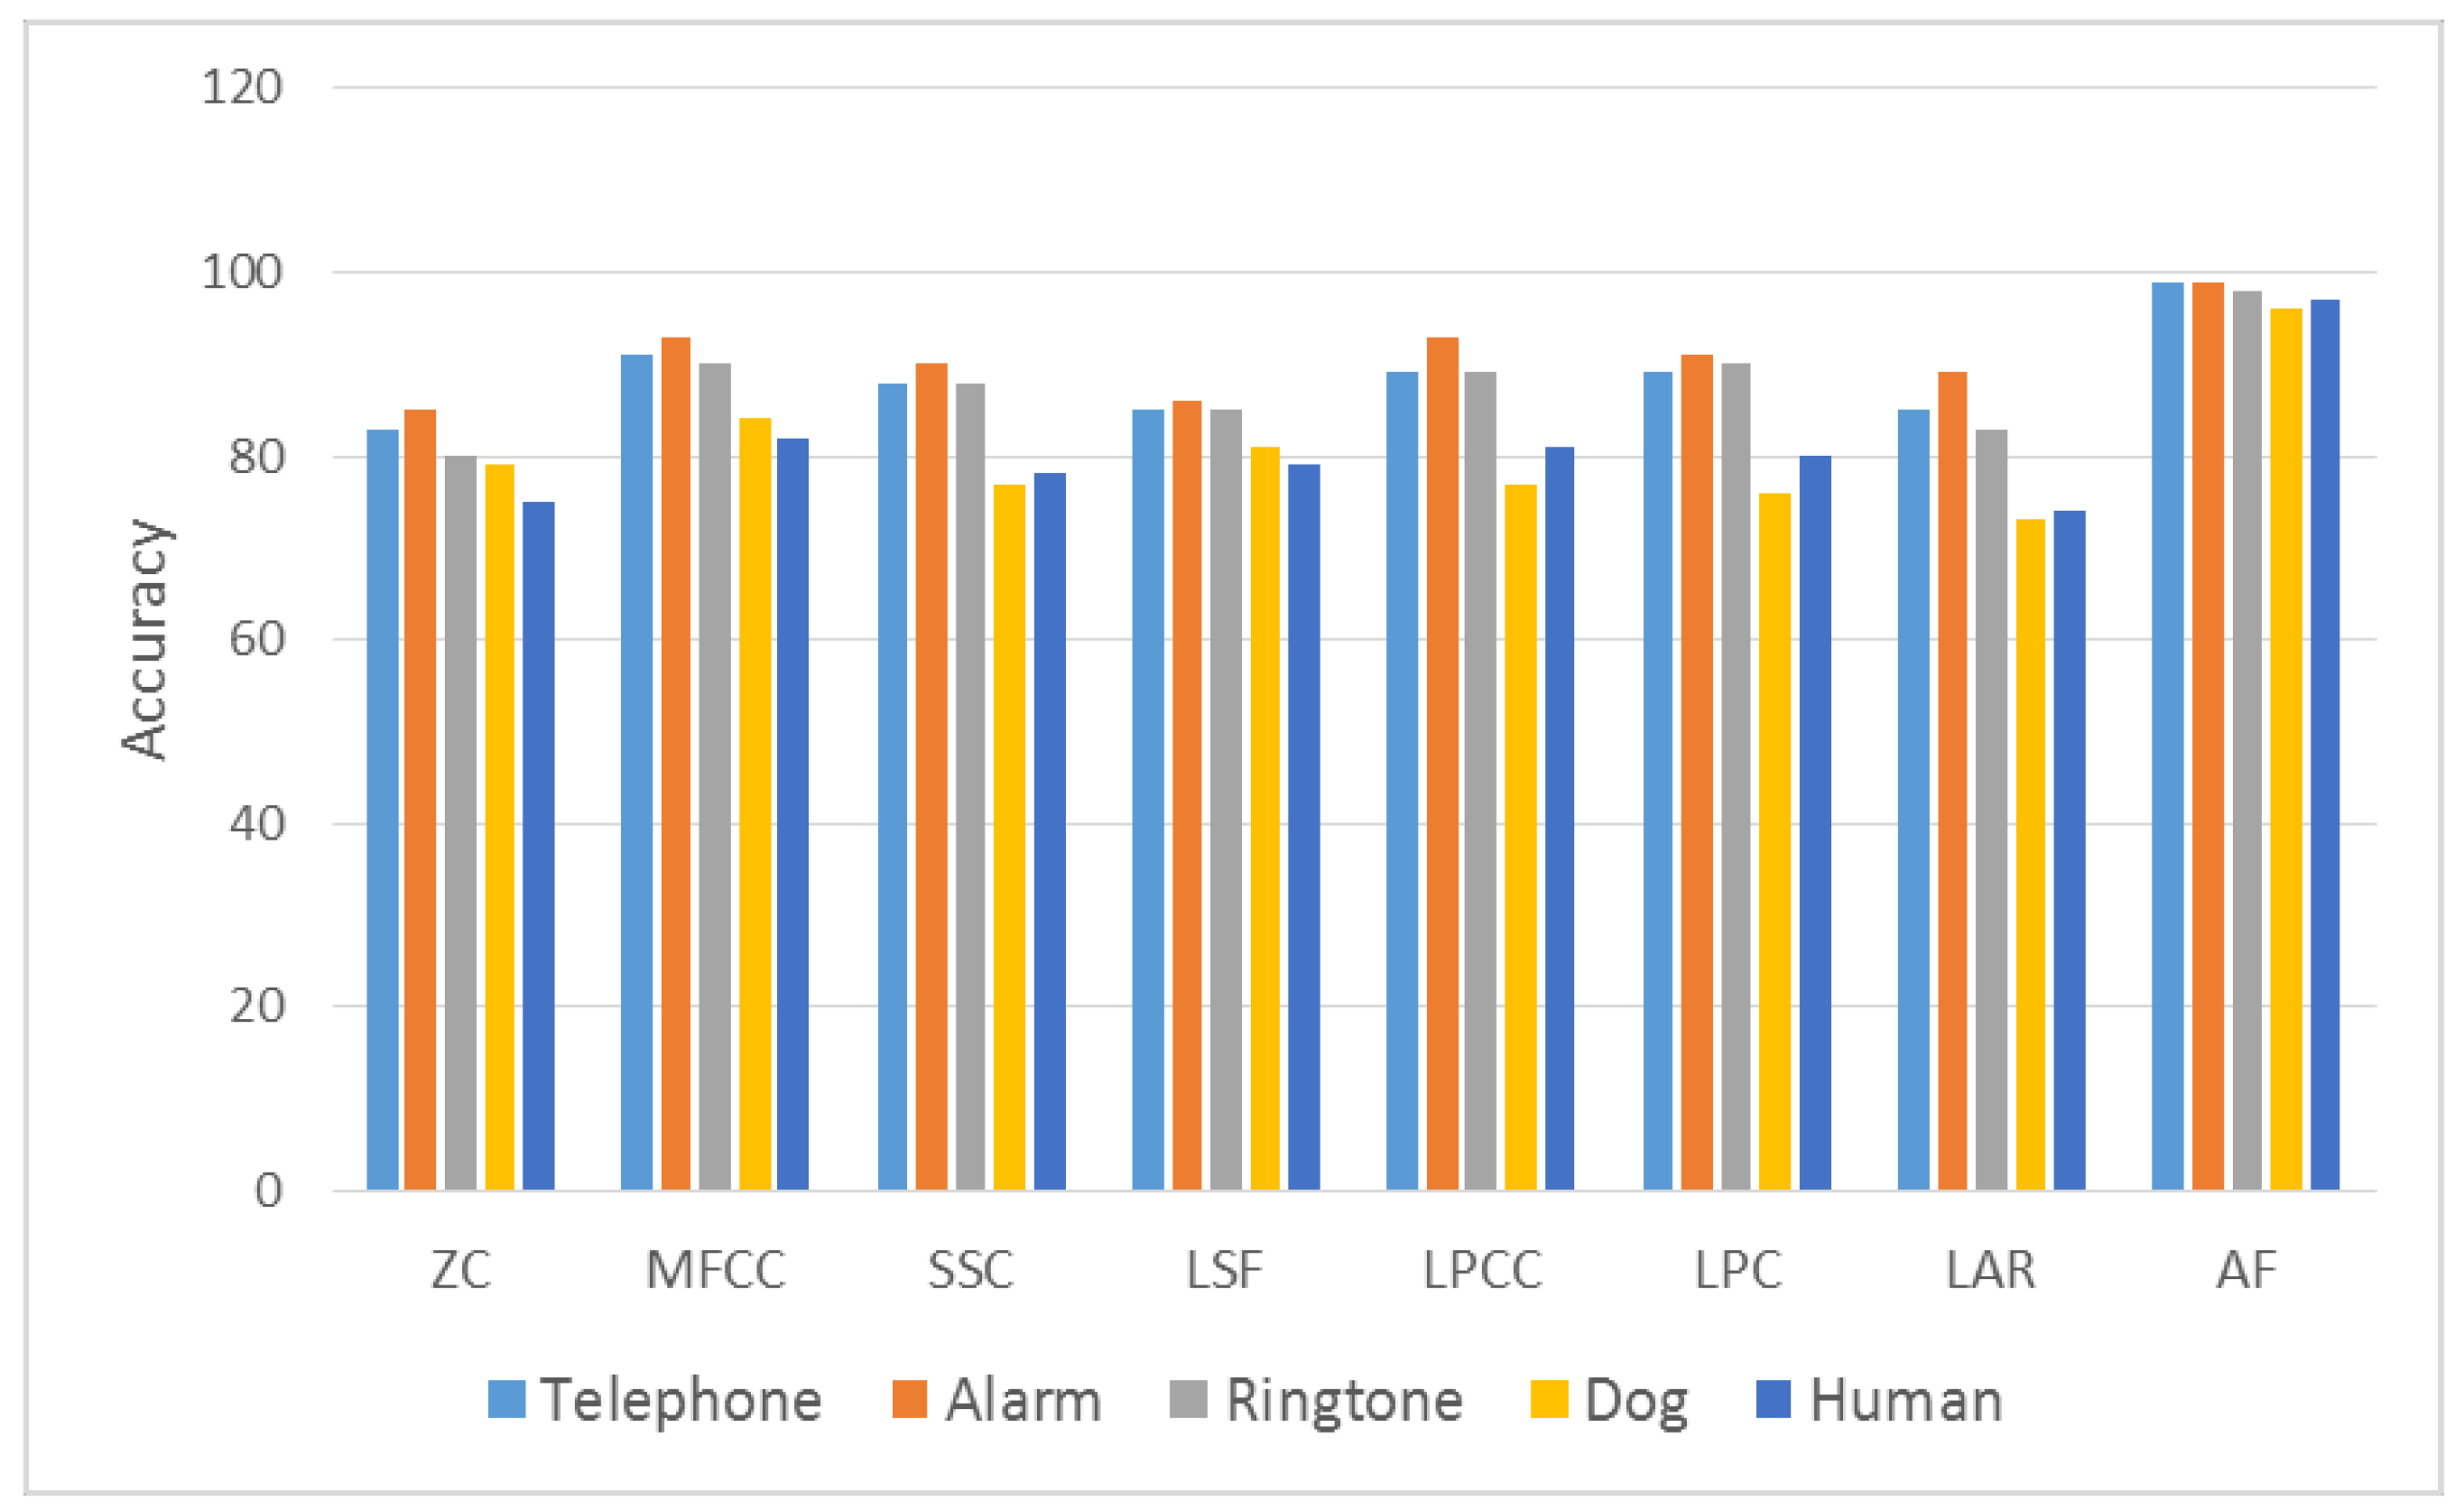
Figure 7.
Comparison of outdoor sounds.
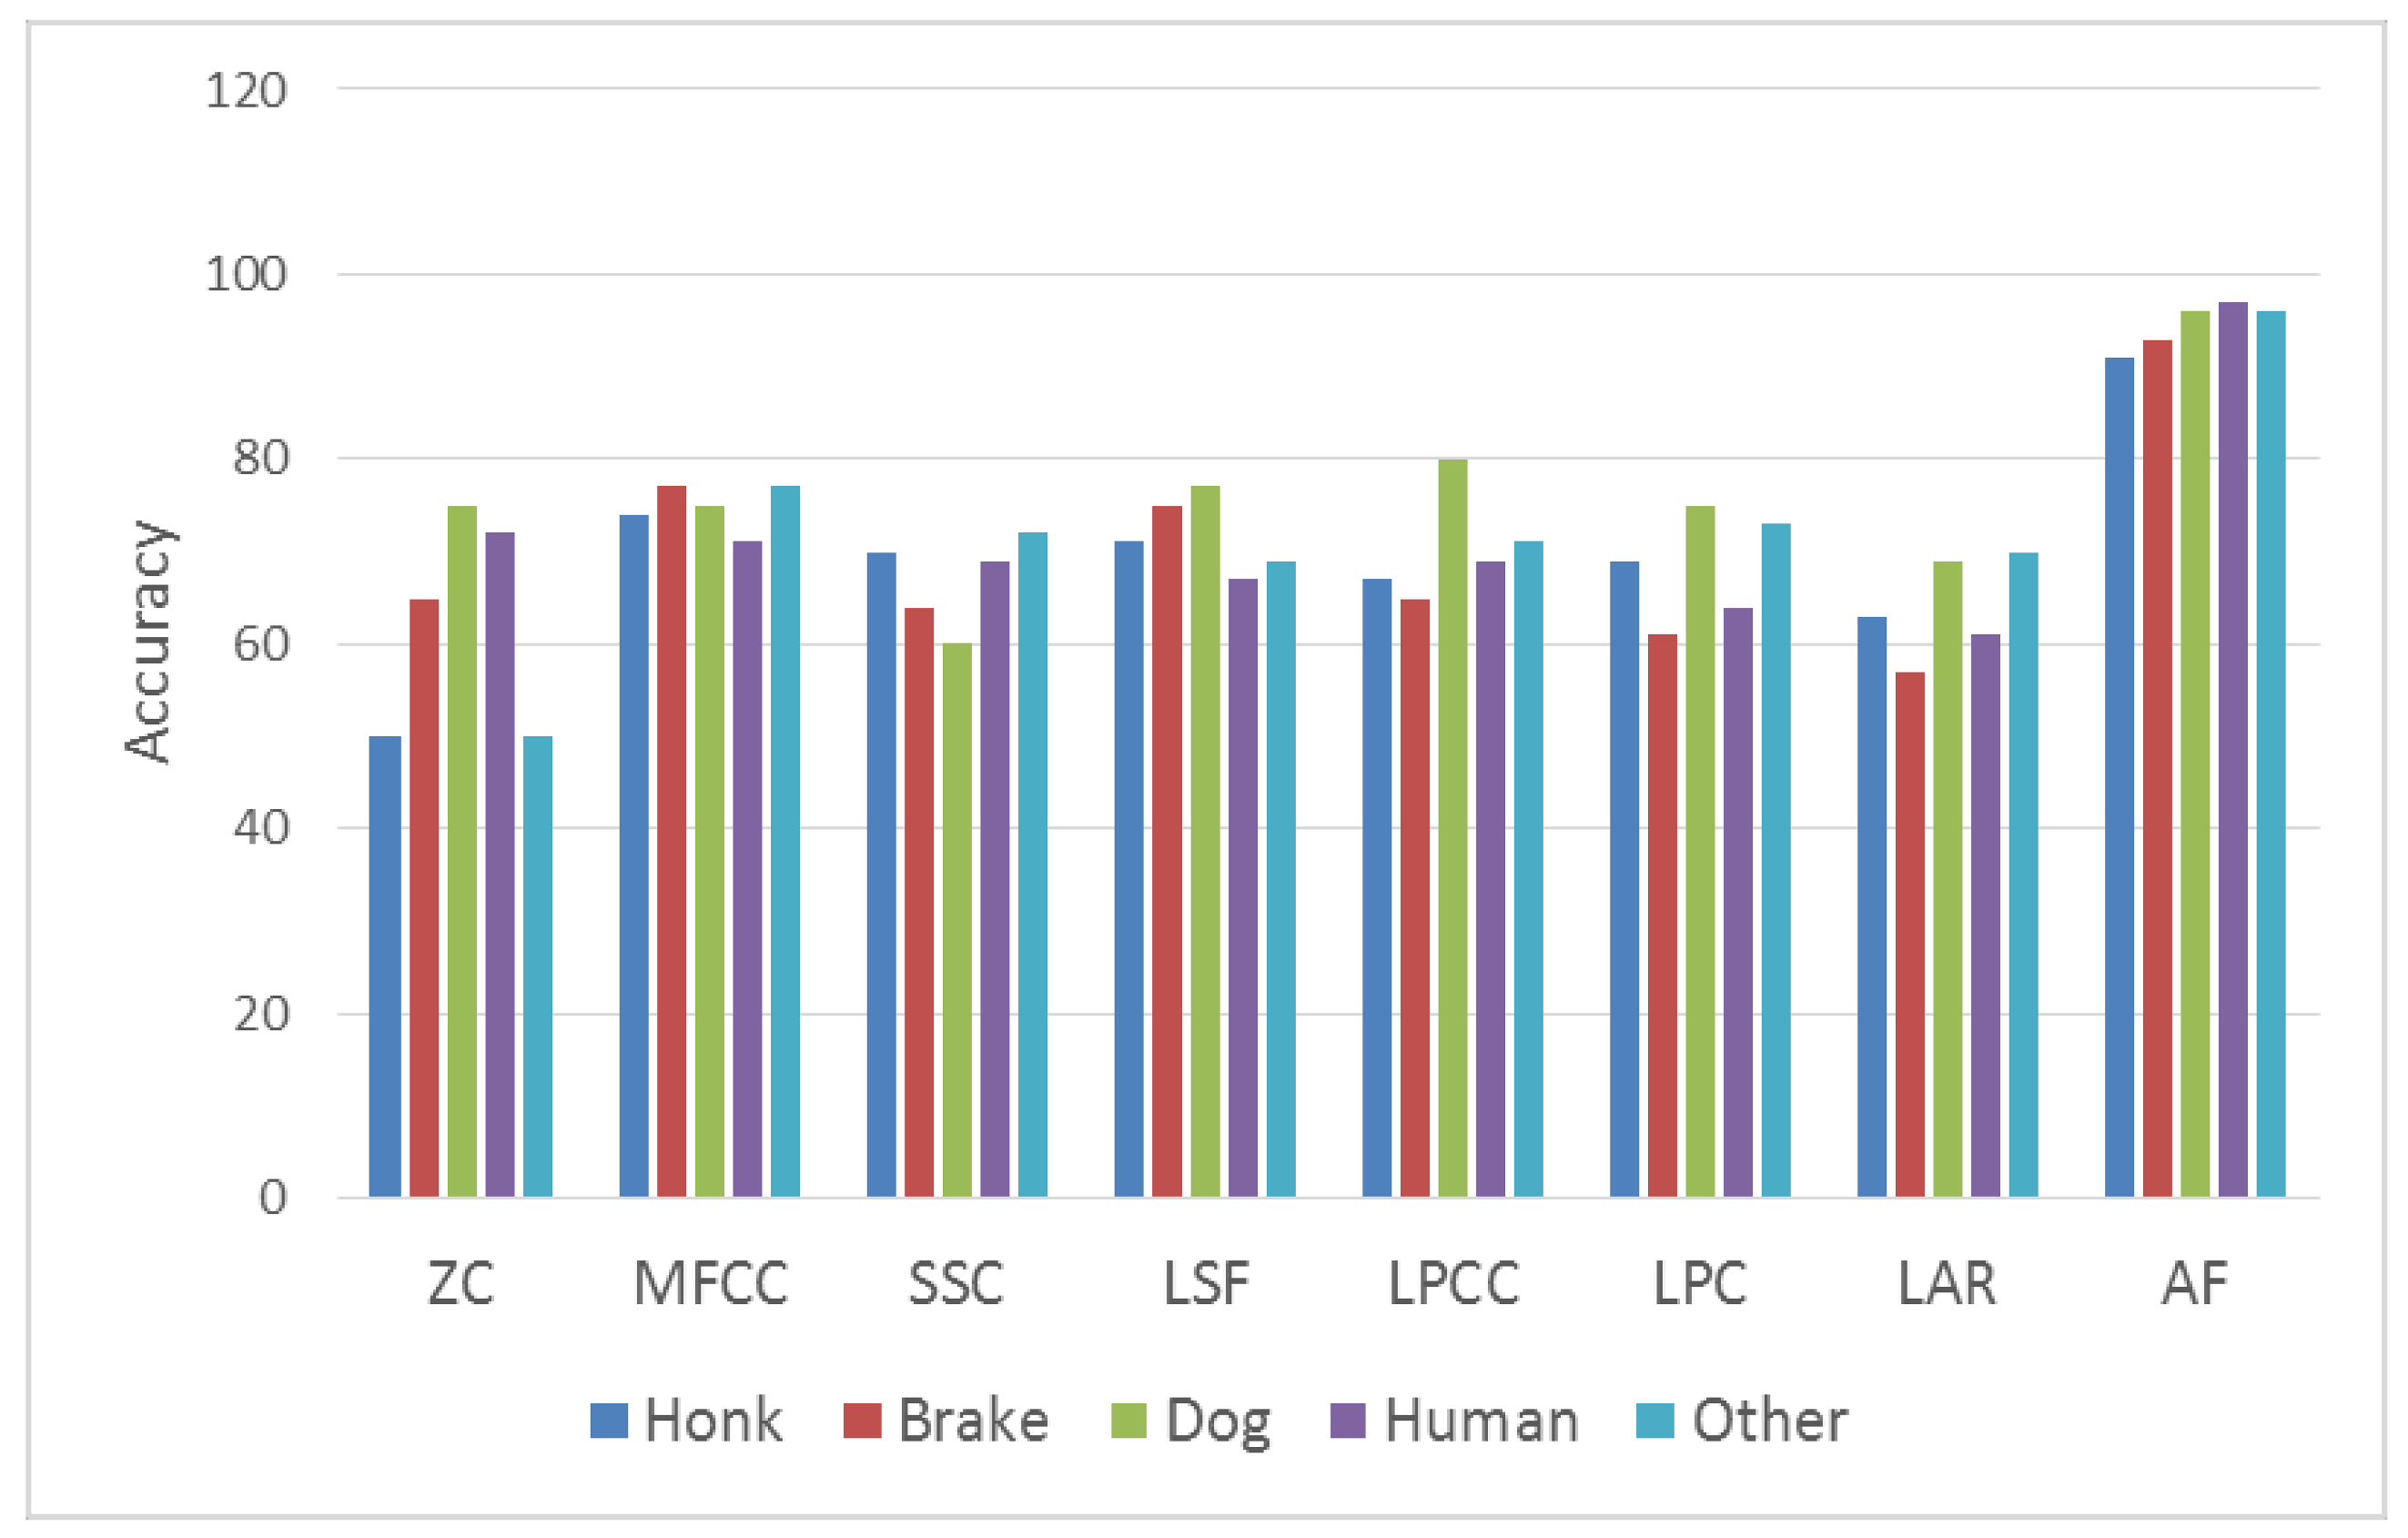
Figure 8.
Indoor sounds (a) Telephone, (b) Alarm, (c) Ringtone ROC curves.
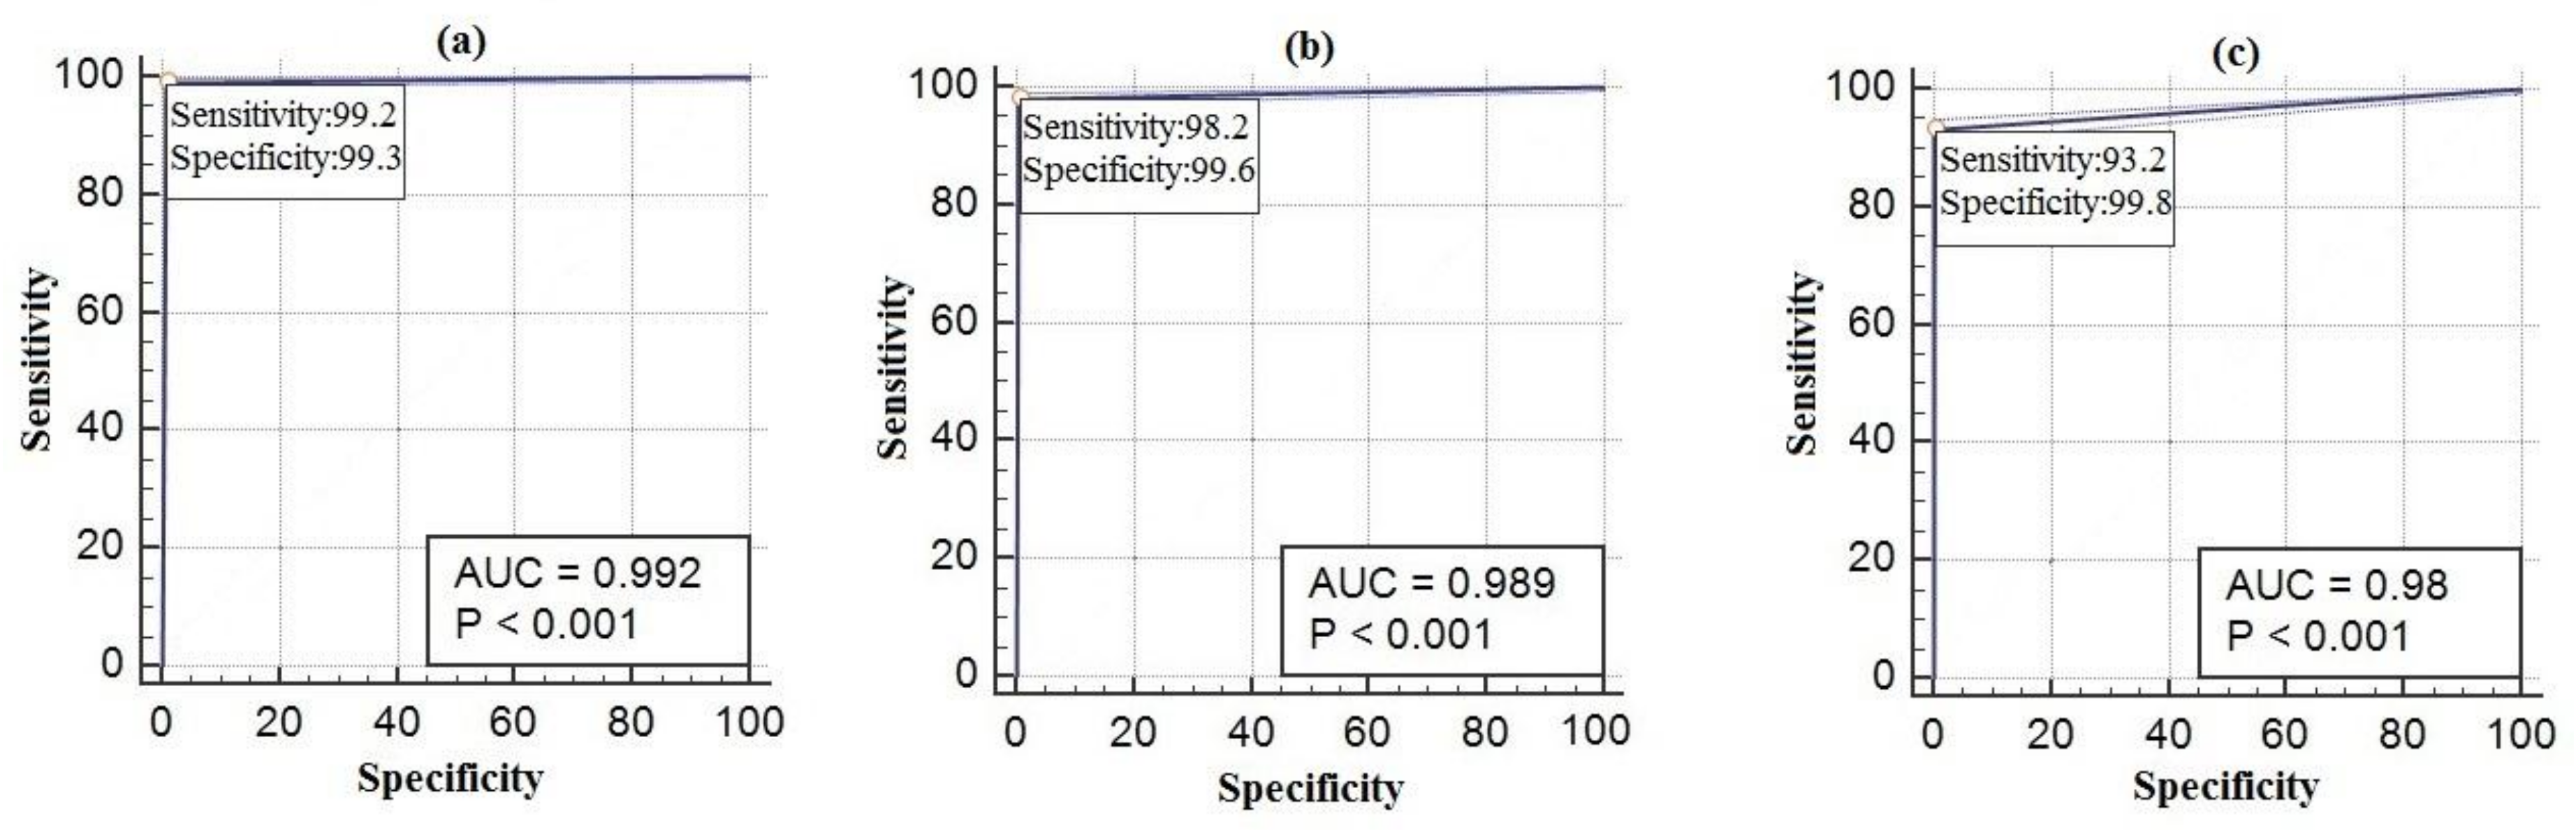
Figure 9.
Outdoor sounds (a) Honk, (b) Brake, (c) Dog Barking, (d) Human ROC curves.
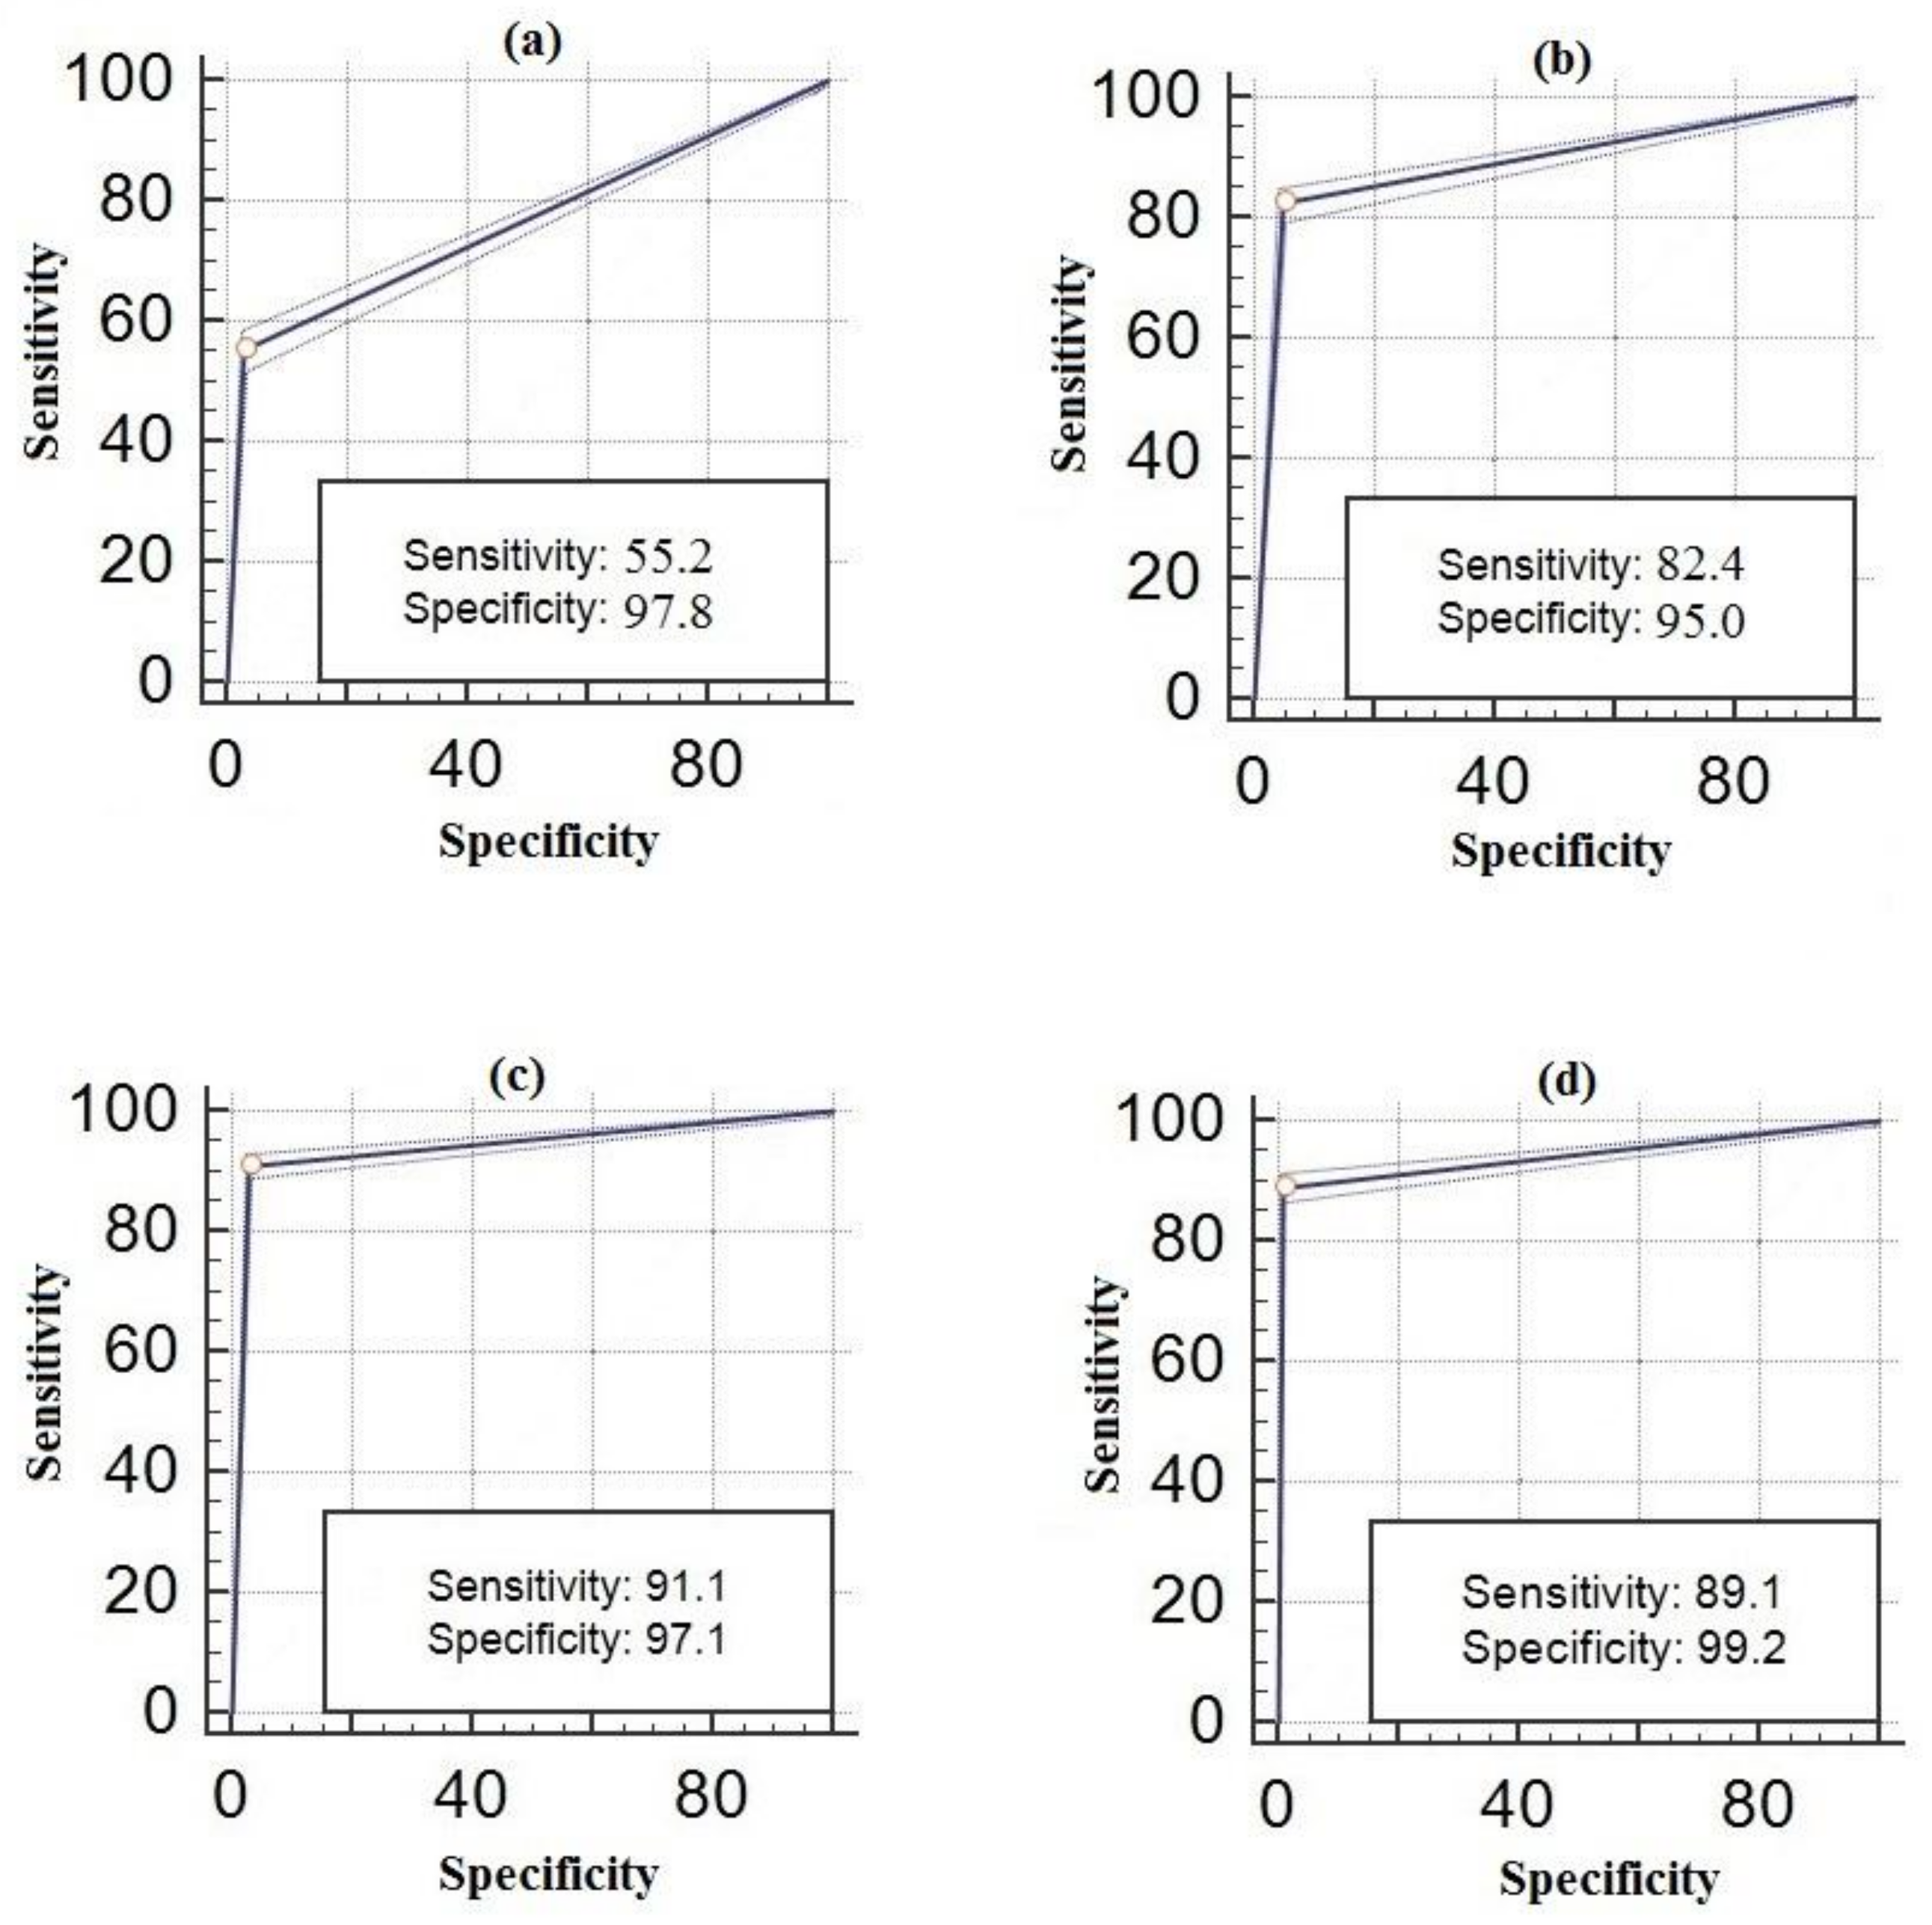
Figure 10.
Audio fingerprint method comparison in different test environment.

Figure 11.
Comparison of deaf and normal hearing people.

Table 1.
Confusion matrix.
| Predicted Class | |||
|---|---|---|---|
| Actual Class | Positive | Negative | |
| Positive | TP (True Positive) | FN (False Negative) | |
| Negative | FP (False Positive) | TN (True Negative) | |
Table 2.
Confusion matrix of sounds in real time.
| Telephone | Alarm | Ringtone | Honk | Brake | Dog | Human | Other Sounds | |
|---|---|---|---|---|---|---|---|---|
| Telephone | 1240 | 3 | 7 | 0 | 0 | 0 | 0 | 0 |
| Alarm | 12 | 1228 | 10 | 0 | 0 | 0 | 0 | 0 |
| Ringtone | 48 | 30 | 1165 | 0 | 0 | 0 | 1 | 6 |
| Honk | 0 | 0 | 0 | 690 | 380 | 123 | 7 | 50 |
| Brake | 0 | 0 | 0 | 153 | 1030 | 29 | 8 | 30 |
| Dog | 0 | 0 | 0 | 75 | 14 | 1139 | 5 | 17 |
| Human | 2 | 1 | 1 | 18 | 22 | 35 | 1114 | 57 |
| Other sounds | 0 | 0 | 0 | 15 | 18 | 65 | 53 | 1099 |
Table 3.
Real-time test accuracy, sensitivity and specificity values.
| Telephone | Alarm | Ringtone | Honk | Brake | Dog | Human | Other Sounds | |
|---|---|---|---|---|---|---|---|---|
| Accuracy | 0.99 | 0.99 | 0.98 | 0.91 | 0.93 | 0.96 | 0.97 | 0.96 |
| Sensitivity | 0.99 | 0.98 | 0.93 | 0.55 | 0.82 | 0.91 | 0.89 | 0.87 |
| Specificity | 0.99 | 0.99 | 0.99 | 0.97 | 0.95 | 0.97 | 0.99 | 0.98 |
Table 4.
Method comparison using environmental sounds.
| General Accuracy | Accuracy (Real Time, Real People or with Noise) | Method | Database | |
|---|---|---|---|---|
| Ma et al. [9] | 92% | 35% | MFCC + HMM | 12 kinds of acoustic environment, 10 different acoustic environments |
| Eronen et al. [10] | 69% | 58% | HMM, KNN | 225 real-world recordings, 24 different contexts |
| Su et al. [11] | 81% | %28.6 | Local Discriminant Bases | 10 audio scenes and 21 sound events |
| Wang et al. [12] | 85.1% | DVM + KNN | 12 common kinds of home environmental sound (totally 527 sound files) | |
| Wang et al. [46] | 89.78% (Clean Sound) | 84.25% (SNR: 15 dB) | MFCC | 469 sound files (10 Classes) |
| Wang et al. [46] | 90.63% (Clean Sound) | 88.51% (SNR: 15 dB) | Wavelet Subspace-based | 469 sound files (10 Classes) |
| Our study | 98% (Clean Sound) | 90% (SNR: 15 dB) | Audio Fingerprint | 10,000 sound (8 Classes) |
| Our study | 98% (Clean Sound) | 94% (SNR: average 20 dB) | Audio Fingerprint | 10,000 sound (8 Classes) |
© 2018 by the authors. Licensee MDPI, Basel, Switzerland. This article is an open access article distributed under the terms and conditions of the Creative Commons Attribution (CC BY) license (http://creativecommons.org/licenses/by/4.0/).
Share and Cite
MDPI and ACS Style
Yağanoğlu, M.; Köse, C. Real-Time Detection of Important Sounds with a Wearable Vibration Based Device for Hearing-Impaired People. Electronics 2018, 7, 50. https://doi.org/10.3390/electronics7040050
AMA Style
Yağanoğlu M, Köse C. Real-Time Detection of Important Sounds with a Wearable Vibration Based Device for Hearing-Impaired People. Electronics. 2018; 7(4):50. https://doi.org/10.3390/electronics7040050
Chicago/Turabian StyleYağanoğlu, Mete, and Cemal Köse. 2018. "Real-Time Detection of Important Sounds with a Wearable Vibration Based Device for Hearing-Impaired People" Electronics 7, no. 4: 50. https://doi.org/10.3390/electronics7040050
Note that from the first issue of 2016, this journal uses article numbers instead of page numbers. See further details here.