Simulation Model for Blockchain Systems Using Queuing Theory


1
School of Computer Science, University of Electronic Science & Technology, Chengdu 611731, China
2
Department of Computer Science, Sukkur IBA University, Sukkur 65200, Pakistan
3
Department of Electrical Engineering, Sukkur IBA University, Sukkur 65200, Pakistan
*
Author to whom correspondence should be addressed.
Electronics 2019, 8(2), 234; https://doi.org/10.3390/electronics8020234
Submission received: 26 January 2019
/
Revised: 10 February 2019
/
Accepted: 13 February 2019
/
Published: 19 February 2019
(This article belongs to the Special Issue Distributed Computing and Storage)
Abstract
:In recent years, blockchains have obtained so much attention from researchers, engineers, and institutions; and the implementation of blockchains has started to revive a large number of applications ranging from e-finance, e-healthcare, smart home, Internet of Things, social security, logistics and so forth. In the literature on blockchains, it is found that most articles focused on their engineering implementation, while little attention has been devoted to the exploration of theoretical aspects of the system; however, the existing work is limited to model the mining process only. In this paper, a queuing theory-based model is proposed for understanding the working and theoretical aspects of the blockchain. We validate our proposed model using the actual statistics of two popular cryptocurrencies, Bitcoin and Ethereum, by running simulations for two months of transactions. The obtained performance measures parameters such as the Number of Transactions per block, Mining Time of Each Block, System Throughput, Memorypool count, Waiting Time in Memorypool, Number of Unconfirmed Transactions in the Whole System, Total Number of Transactions, and Number of Generated Blocks; these values are compared with actual statistics. It was found that the results gained from our proposed model are in good agreement with actual statistics. Although the simulation in this paper presents the modeling of blockchain-based cryptocurrencies only, the proposed model can be used to represent a wide range of blockchain-based systems.
1. Introduction
In 2008, an unknown person or a group with the pseudonym ‘Satoshi Nakamoto’ introduced a revolutionary concept of Peer-to-Peer (P2P) electronic cash systems and named it ‘Bitcoin’ (a digital currency). This P2P digital currency system was meant to discourage third party involvement for financial transactions between unknowns in a trusted and verifiable way [1]. In January 2009, the same group or person made the software available as an open source code and launched the first digital currency in history [2]. The underlying technology of Bitcoin is the blockchain, which provides a consistent and immutable ordered list of transaction blocks chained together, with all the peers in P2P network maintaining their own copy of the blockchain, known as the distributed ledger. The core protocol of the Bitcoin currency is consensus, which requires all the peers in network to agree upon every single entry of a block in the distributed ledger [1,3].
Recently, blockchains have received tremendous attention from several researchers. The emergence of blockchain technology in the form of digital currencies has influenced many other fields such as e-healthcare, e-finance, real estate, e-voting, supply chains, Smart homes, Smart cities, Smart Industries, the Internet of Things, and so forth [3,4,5,6]. The popularity of blockchains is natural, as they have the potential to provide desirable features by replacing centralized communication architectures. But the problem with Bitcoin is that it requires a time-consuming processes to achieve the security and integrity of the system; and Bitcoin mining is considered a severly time and resource consuming procedure [7,8].
There have been several attempts to reduce the required time and increase productivity by modifying the characteristics of the underlying algorithms. New cryptocurrencies similar to Bitcoin are termed as alt-coins; currently, Ethereum, BitShares, Dash, DogeCoin, LiteCoin, PeerCoin, and Ripple are the best-known currencies to have been inspired by Bitcoin [9,10,11,12,13,14,15]. Today, there are 2116 cryptocurrencies [16], and the majority of them are crafted on the same blockchain distributed technology, albeit with a modified set of principles and improved characteristics [15].
As most of applications implement a blockchain, the analytical modeling and simulation of blockchain systems are essential for performance evaluations and behavior observations. Unfortunately, fewer efforts have been dedicated to simulation modeling of blockchains [17]; papers in literature are very few, and almost all of them only the analytical modeling of Bitcoin. Quan-Lin Li et al. [17] described an entire blockchain, specifically mining operations only, using a single queue; the transactions in queue were assumed for the block generation process and transactions in service were assumed for the block building process. Yoshiaki Kawase [18] provided a study on Queuing theory to represent transaction confirmation times for Bitcoin. Some work was also done on game theory by Bisias et al. [19], Lewenberg et al. [20] and Houy et al. [21].
In this paper, we have done the simulation modeling of a blockchain system using queuing theory. The proposed model can be used to observe the realistic behaviors of both a memory and a mining pool for any blockchain System. In contrast to previous work, our process is enhanced in several ways; it provides the simplified simulation to model both the memory pool using M/M/1 and the mining pool using the M/M/c queue, and provides more detailed observations of both. Using the proposed model, we present observations for important indices such as the number of transactions per block, the mining time of each block, the number of transactions per second, memorypool count, waiting time in the memory pool, the number of unconfirmed transactions in the whole system, the total number of transactions, and the number of generated blocks.
The proposed model for our blockchain was first used to obtain ideal statistics in Bitcoin simulations. And then, it was used to validate the data from real-time blockchain applications of Bitcoin and Ethereum. The statistics from the proposed model are compared with actual stats, and it was found that the proposed model was able to estimate real-time scenarios with only minor errors.
The rest of the paper is arranged as follows: Section 2 covers the backgrounds of Bitcoin, Ethereum and their underlying blockchain technologies. Section 3 is about the proposed reference model; Section 4 presents the details of the simulation setup for the memory pool and mining process using the queuing theory model in JMT, JSIMgraph, and presents the obtained results. Section 5 validates our model by simulating 60 days of actual statistics for both Bitcoin and Ethereum, and compares the obtained results with actual stats; Section 6 provides the proposed simulation model for multiple types of implementations of blockchains. A conclusion is presented in Section 7.
2. Preliminaries
To understand blockchains, we set Bitcoin as our reference in this section. Bitcoin is a P2P electronic cash system, the core technology behind which is the blockchain. Bitcoin discourages the involvement of third parties (e.g. banks) by spreading multiple copies of transaction blocks among the peers of the network [1]. Each participant in the blockchain network maintains his/her own data store to keep the transactions, known as a distributed ledger [19]. As in P2P networks, all peers are equal, i.e., every node in the network is able to provide and consume services. Similarly, in the Bitcoin P2P network, transactions can be initiated by anyone in network and are disseminated in unstructured decentralized networks for services, where anyone else can serve as a miner [1]. Currently, Bitcoin possesses the maximum market share in cryptocurrencies, i.e., 52.5% [16].
In Bitcoin, the transactions are recorded with a cryptographic signature by the sender, and are broadcast to the network. The initiated transaction remains unconfirmed in a temporary placeholder at the nodes of the network known as a memory-pool [22]. Once the pool reaches a certain size or a specified time to create a block, anybody in the network can pick those transactions and combine them to create a new block; the block is then signed using Merkle root, which contains information about all the transactions in it [1]. The new block is then tested for validity by solving a time-consuming mathematical puzzle to find the correct nonce by a miner; a valid block containing valid transactions is then added to a local blockchain, and further distributed in the network with the same puzzle and the discovered nonce which was used to solve the puzzle, as the miner’s Proof-of-Work [1,23].
The received nodes verify whether the newly-mined block is valid. If so, it is added to their local blockchain and forwarded to further networks leading to its ultimate propagation across the entire network. The miner who discovered the nonce for a block will receive the reward of a fresh release of Bitcoins [20], [24]. Figure 1, shows the complete process of mining a new block of transactions and appending it to the blockchain.
Every single block is a data packet with a header and a payload. The header contains metadata: block id, hash of the block, hash of previous block and the timestamp. The payload section contains only transactions. A blockchain is an immutable ledger of transactions; multiple copies of all transactions are recorded as a ledger and are distributed over the peer nodes in the network known as the ‘distributed ledger’. No master or lead copy of the distributed ledger exists to alter the blocks once they have been added [25,26]. In this ledger, the blocks are linked to their preceding block by using the hash of a previous block. This chain of linking to previous blocks goes up to the Genesis (first block) block mined by Satoshi Nakamoto on January 3, 2009 [27].
Symbolically, blockchains can be considered as an ordered pair of ; where G represents the Genesis block and B is the main chain of blocks:
The addition of a new block requires the verification of its true relationship with the previous block ; once the block is verified, it is appended on to the chain. In Bitcoin, new blocks are generated at a frequency of every 10 minutes [1]. To break the integrity of the blockchain by amending is mathematically a very difficult task, which requires a massive amount of computation power compared even to that required in mining process [1]. Each transaction’s arrival and the addition of newly-mined blocks in the blockchain is a 5-Step process, as shown in Figure 2.
2.1. Arrival of New Transactions
All nodes in the network can initiate transactions to transfer the digital assets to the available peers in network [28]. The arrival of new transactions is an independent factor, and it varies day to day, in Bitcoin, the number of transactions varies from 200,000 to 350,000 per day.
2.2. Memory Pool
The memory pool is a temporary placeholder or shared space which is available to the entire network for the accumulation of transactions, where they wait for to be picked by miners for mining [29]. The waiting transactions in the pool are termed Unconfirmed Transactions. In the case of Bitcoin, after every 10 minutes, the miner chooses a limited number of transactions of an accumulated size of 1 MB to form a block for mining [30]. Once a block is mined, those transactions no longer remain unconfirmed, but become the part of a block in blockchain [28]. At the time of writing, in the Bitcoin network, there are 5000+ unconfirmed transactions (https://www.blockchain.com). This memory pool size is very dynamic and is constantly growing or shrinking according to the number of incoming unconfirmed and leaving confirmed transactions.
2.3. Block Generation
Because of expensive computational resources in the past, jobs were kept on hold for processing operations to be performed in batches. Similarly, in blockchain systems, transactions are kept on hold until a particular time and size are reached for two reasons: one, the mining process is expensive, and two, the propagation of the already mined block in the network [31]. Once the time and size are met, miners are allowed to form a batch. In blockchain systems, a batch is known as a block. A single block varies in the number of transactions; in Bitcoin, the number of transactions per block is in between 1000 and 25001.
2.4. Mining Process
The mining of blockchains is a process to find one correct target value by iterating through billions of values, known as ‘nonce’ [32]. The network nodes with mining capabilities start finding a target value by iterating and incrementing the nonce in every loop. This process is complex and requires huge computational power to find the correct nonce. Finding the correct nonce can be represented as:
where Hash is a cryptographic hash function (such as SHA256), Blockheader is the new set of transactions requiring appending over the ledger as a new block, is the concatenation operation, and D is the global parameter which determines the puzzle.
Once nonce is discovered, the new block is appended into the local blockchain of the miner him/herself, while the blocks’ metadata and discovered nonce as a Proof-of-Work are broadcasted to other peers in the network for validation and updating of their local copy of the distributed ledger of the blockchain [23]. The outcome of this mining process is two-fold; first, it introduces new cryptocurrency coins into the economy in the form of rewards for miners; and second, it makes the crypto payment system strong, trustworthy and secure thanks to powerful computers. The time taken by miner(s) to mine a block is 600 seconds, theoretically, and in a day, there can be 144 blocks mined all over the Bitcoin network [1]. However, the actual number of blocks generated every day, and the average time taken by a block is volatile because of the addition of new mining power every day, which can be calculated as:
To maintain the time interval between the blocks mined by miners, there is a difficulty level of the mathematical puzzle, which is regulated according to available mining resources. The difficulty level of the mathematical puzzle is adjustable, and the Bitcoin software keeps track of newly-generated blocks for two weeks or 2016 blocks, as hardcoded (https://github.com/trottier/original-bitcoin) in the Bitcoin system, to determine the difficulty level [19,33]
where t is the total time spent in the mining process for the previous 2016 blocks.
If the block generation frequency is more than 2016 in two weeks, the difficulty level of mathematical puzzles increases. Currently, the inclusion of Graphical Processing Units (GPUs) and Application Specific Integrated Circuits (ASIC) miners has increased the difficulty level of mathematical puzzles such that a normal computer would take more than a year to solve the puzzle of finding nonce for a single block [34].
Bitcoin mining is thus a race between miners; the faster one will receive the reward, while the others will go empty-handed [35]. Thus, the miner with more hash power has the ability to solve the proof-of-work more quickly than anyone else. This tends to bring the miners into groups known as Mining-Pools; these groupings increase the likelihood of winning the freshly mined Bitcoins [36]. A mining pool is a network of miners; where is a set of miners forming a group.
The reward is a way of releasing new Bitcoins into the economy and offering compensation for the miners’ efforts. Initially, the reward for mining a block was 50 Bitcoins. By rule, this reward is halved every 4 years or every 210,000 Blocks (another hardcoded rule in the Bitcoin software)2. There have been 2 halvings until now; in 2013, the Block reward was 25 Bitcoins, and in 2016 it became 12.5 Bitcoins.
2.5. New Block to Blockchain
Once the block is mined by a miner, it is appended to their local blockchain and broadcasted to the network with the same puzzle and the discovered nonce as its PoW. Everyone else in network will now no longer attempt to resolve that block; instead, they will verify the block by solving the puzzle with the provided nonce. If it is valid, then they will also add the block to their local blockchain. This process is known as ‘Consensus’, where all or the majority of nodes reache an agreement to add the new block to their blockchain [37,38].
2.6. Ethereum
Ethereum is the most well-known blockchain platform after Bitcoin, with a digital currency named ‘Ether’ [39]. The cryptocurrency Ether is used for the execution of smart contracts between unknown parties for transactions. The basic technology of Ethereum uses a blockchain, but it is more versatile in nature [40,41]. The smart contract in Ethereum provides a service of trust between unknown parties. And the applications usings Ethereum’s smart contract vary from a smart voting system, domain name registration, contracts and agreements, real-estate property dealing, and the distributed autonomous organizations [39,42]. Ethereum is different to Bitcoin in several ways; unlike Bitcoin it calculates computation and storage using a gas metric; the gas has a limit for the network, which can be consumed by peers in the network. By putting the limitation on the network in terms of gas usage, it protects against overloading. Also, the Block generation frequency in Ethereum occurs very often [9,38,43]. The gas limit and block generation frequency are discussed in detail later in Section 4.
2.7. Queuing Theory
Queuing Theory is a mathematical method for analyzing different type of systems and observing their behavior related to system performance and the quality of service. It ranges from the analysis of service chains to arbitrary complex queues of huge network systems. It is usually used to analyze the probability distribution in a continuous-state space [44,45]. Several models of queuing systems are represented by Kendall’s notation to classify system types and their queuing events. All types of representations are described using three factors, i.e., A/S/c, where A is the arrival, S is the size of the job and c is the number of serving stations [46]. Popular alternative notations are M/M/c, and in rest of the paper, we will be using this nomenclature. In this article, we focus on two variations of queue types and a pair of Fork-Join stations in concatenation for our proposed model M/M/1 and M/M/c.
The model M/M/1 is used to model the memory pool of the blockchain. In this model, the arrivals are Poisson-Distributed and the service time is exponentially distributed, while the number of serving stations is only one. The mining pool is modeled with the M/M/c model; in this model, the number of servers is more than one. In real scenarios, the miners work in a huge network group to solve a single block puzzle. Similarly, in our model, there are multiple miners in the system to solve a single block of Transactions.
Fork-Join are two stations like queues which are used to achieve fast processing and minimize service time; in many cases, the system workload is abstracted as jobs, and is split into several manageable tasks. All tasks are synchronized and forwarded for parallel processing (possibly by heterogeneous servers) and are joined again as a job after the completion of all the related tasks [47]. In parallel processing, this concept is also known as ‘threads’.
Typically, c dimensional Fork-Join stations are part of queuing system that is operated by c number of parallel servers; the servers are synchronized for the flow of the arrival and departure of tasks from the queue. A customer arrives in the system in batches of size J of no larger than the number of servers . In fork primitives, the J number of customers is immediately assigned to the c number of Servers for parallel processing. After J number of customers involved in a batch completes the service, the batch is immediately formed at a Join station. The Join station is synchronized with a Fork station and possesses a temporary memory buffer of infinite capacity, where the serviced customers wait for reunion with customers whose service has not yet been completed [48].
Fork-Join queues are studied in the field modeling of disk arrays, parallel processing and distributed systems [49]. For more information on the analytical modeling of For-Join queues, please refer to Gelenbe’s book [50] and Cheeha Kim And Ashok K. Aguwala’s article for an analysis of fork-join queue [51]. An analysis of the queues used in the paper, i.e., M/M1 and M/M/c, is given in Lazowska Edward et al.’s book [52].
3. Proposed Model
As depicted in Figure 3, we segregated a blockchain network into two types of pools: one type of nodes deal with unconfirmed transactions in the Memory-pool, where transactions generated by various users are accumulated to be sent to miners. The second is the network of Mining nodes (Mining-pool); these peers of networks select the transactions from the memory pool to generate the block and start mining them. At any given time, there can be only one block in the mining pool. However, inside the mining pool, a mining job can be divided into numerous multiple tasks or threads for parallel processing in by several mining nodes on the network. But all of those jobs should be part of the same block, once the job to mine a block is accomplished; all parts are combined again at the joining station and are dispatched to the rest of the network.
Figure 4 shows the proposed model of our blockchain System; we consider a memory pool as a single queue with a single server, and a mining pool with multiple numbers of servers or miners, typically a few more than the size of a block. However, a real blockchain network is composed of hundreds of millions of users and miners, and the proposed model can also be scaled up for that purpose. But for simplicity, we chose the simplest model to discuss here. The memory pool is configured using an M/M/1, and the mining pool with an M/M/c, queue. The Mining-pool is placed between the set of Fork and Join Stations. The fork is used for two purposes; the first is to accumulate the transactions to manage the specified block size and time, and the second is to generate the threads to be mined by multiple miners in parallel. The capacity of a fork is limited to one block size, once the required number of transactions is reached. Each transaction is converted into one thread (however, there could be many threads for one transaction) and passed to a mining pool where a number of miners from the pool can receive the threads to perform the mining operation on all threads simultaneously. After completion of mining, all transactions are forwarded to join station where all threads of the block are accumulated to form a block which is then forwarded to the network.
To achieve the ideal time interval between blocks, the mining-pool is configured with a service time equivalent to 600 seconds for the mining of each block. For example, if there are 2000 transactions in a block, the required mining time is 600s and the number of mining nodes in the mining pool is 2100; then, service time for a mining node can be calculated as: .
The fork station doesn’t receive new jobs if it has already reached its maximum capacity. As the fork station is configured with a finite capacity for the size of a block, excess transactions can be dropped, and in a Blockchain network, a packet or transaction cannot be lost due to the broadcasting of the incoming transactions to multiple nodes of the peer-to-peer network. To overcome the drop issue in our model, we used the Block After Service (BAS) rule at the fork station so that if the number of transactions has already reached to the size of a block, the memory-pool will be unable to send further transactions; instead, those transactions are accumulated in the memory-pool.
In our proposed model, we used a first-come-first-serve (FCFS) queuing policy to model all the stations including the Memory-pool, Fork, and Mining-pool. However, the queuing policy can be modified for the specific type of simulation. The arrival of transactions follows Poisson-Distribution, and after the mining and joining of transactions, the transaction block leaves the system.
4. Simulation Setup and Results
We simulated our proposed model in Java Modeling Tools (JMT, Politecnico di milano, 1.0.3, Milano, Italy), a suite of open-source toolkits. It is a discrete event simulator for performance evaluations; the suite includes tools for general-purpose queuing and Petri net simulations, bottleneck identification, workload characterization, and Markov chain models. It also provides features like fork-join, finite capacity region and several types of distributions for the arrival and service at any station. In addition to this, it has a whatif analysis option to iterate scenarios for multiple numbers of times by varying the arrival or service rates [53].
The simulation of the proposed model consists of a small-sized Blockchain System, as discussed in an earlier section. Figure 5 shows the simulation setup in JSImgraph. The proposed model consists of a source station named ‘Transactions’, two queuing stations, M/M/1 named ‘Mempool’ and M/M/c named ‘Mining pool’, one set of fork-join stations named ‘Block-Generation’ and’ Join’, and finally, a sink station named ‘Dispatch Blocks’.
4.1. Calculation of Simulation Parameters
Three different simulation experiments were performed on our proposed model; the first is with the syntactically ideal statistics of Bitcoin for one-day, while the other two simulations were performed for Bitcoin and Ethereum’s actual stats, obtained from reliable explorers for 60 days of transactions (For Bitcoin www.blockchain.com; For Ethereum www.etherscan.io; and www.etherchain.org;). However, where required, the parameters are calculated using the formulas discussed in this section.
At the time of writing, in Bitcoin, the average number of transactions per block is 2002, the average number of confirmed transactions per second is 3.056, and the average number of blocks per day is 1333. However, the average size of a transaction can be calculated by the , which increased from 308 to 560 bytes from 2011 to 2018 [www.blockchain.com]. Furthermore, keeping the limitations of Bitcoin under consideration as hard coded in Satoshi’s Blockchain for Bitcoin:
- Block size should not exceed 1 Megabyte
- Block Generation and Mining time should be 600 seconds (10 minutes)
We took generous numbers for simulation purposes. We considered that one transaction of 500 bytes in size and 1 Megabyte is equal to 1048576 bytes; thus, transactions per block, therefore is the average number of confirmed transactions per second, and a total of 144 blocks are mined with being the total number of transactions per day. The number of blocks, , can be calculated using:
where T is the total time and is block-mining time. For simulating a single day, T is 86400 seconds, and ideally, is 600 seconds. The average number of transactions per block can be calculated as:
where is the number of Transaction per day, which can be calculated by:
The arrival rate can be calculated as:
where is the number of unconfirmed transactions at the end of each day:
And the mean mining time is calculated as:
where, m is number of miners in the mining pool.
Table 1 shows the simulation parameters of the Bitcoin cryptocurrency. We set the number of incoming transactions to be a little higher than the mining capacity to observe the unconfirmed transactions in the memory pool.
4.2. Results
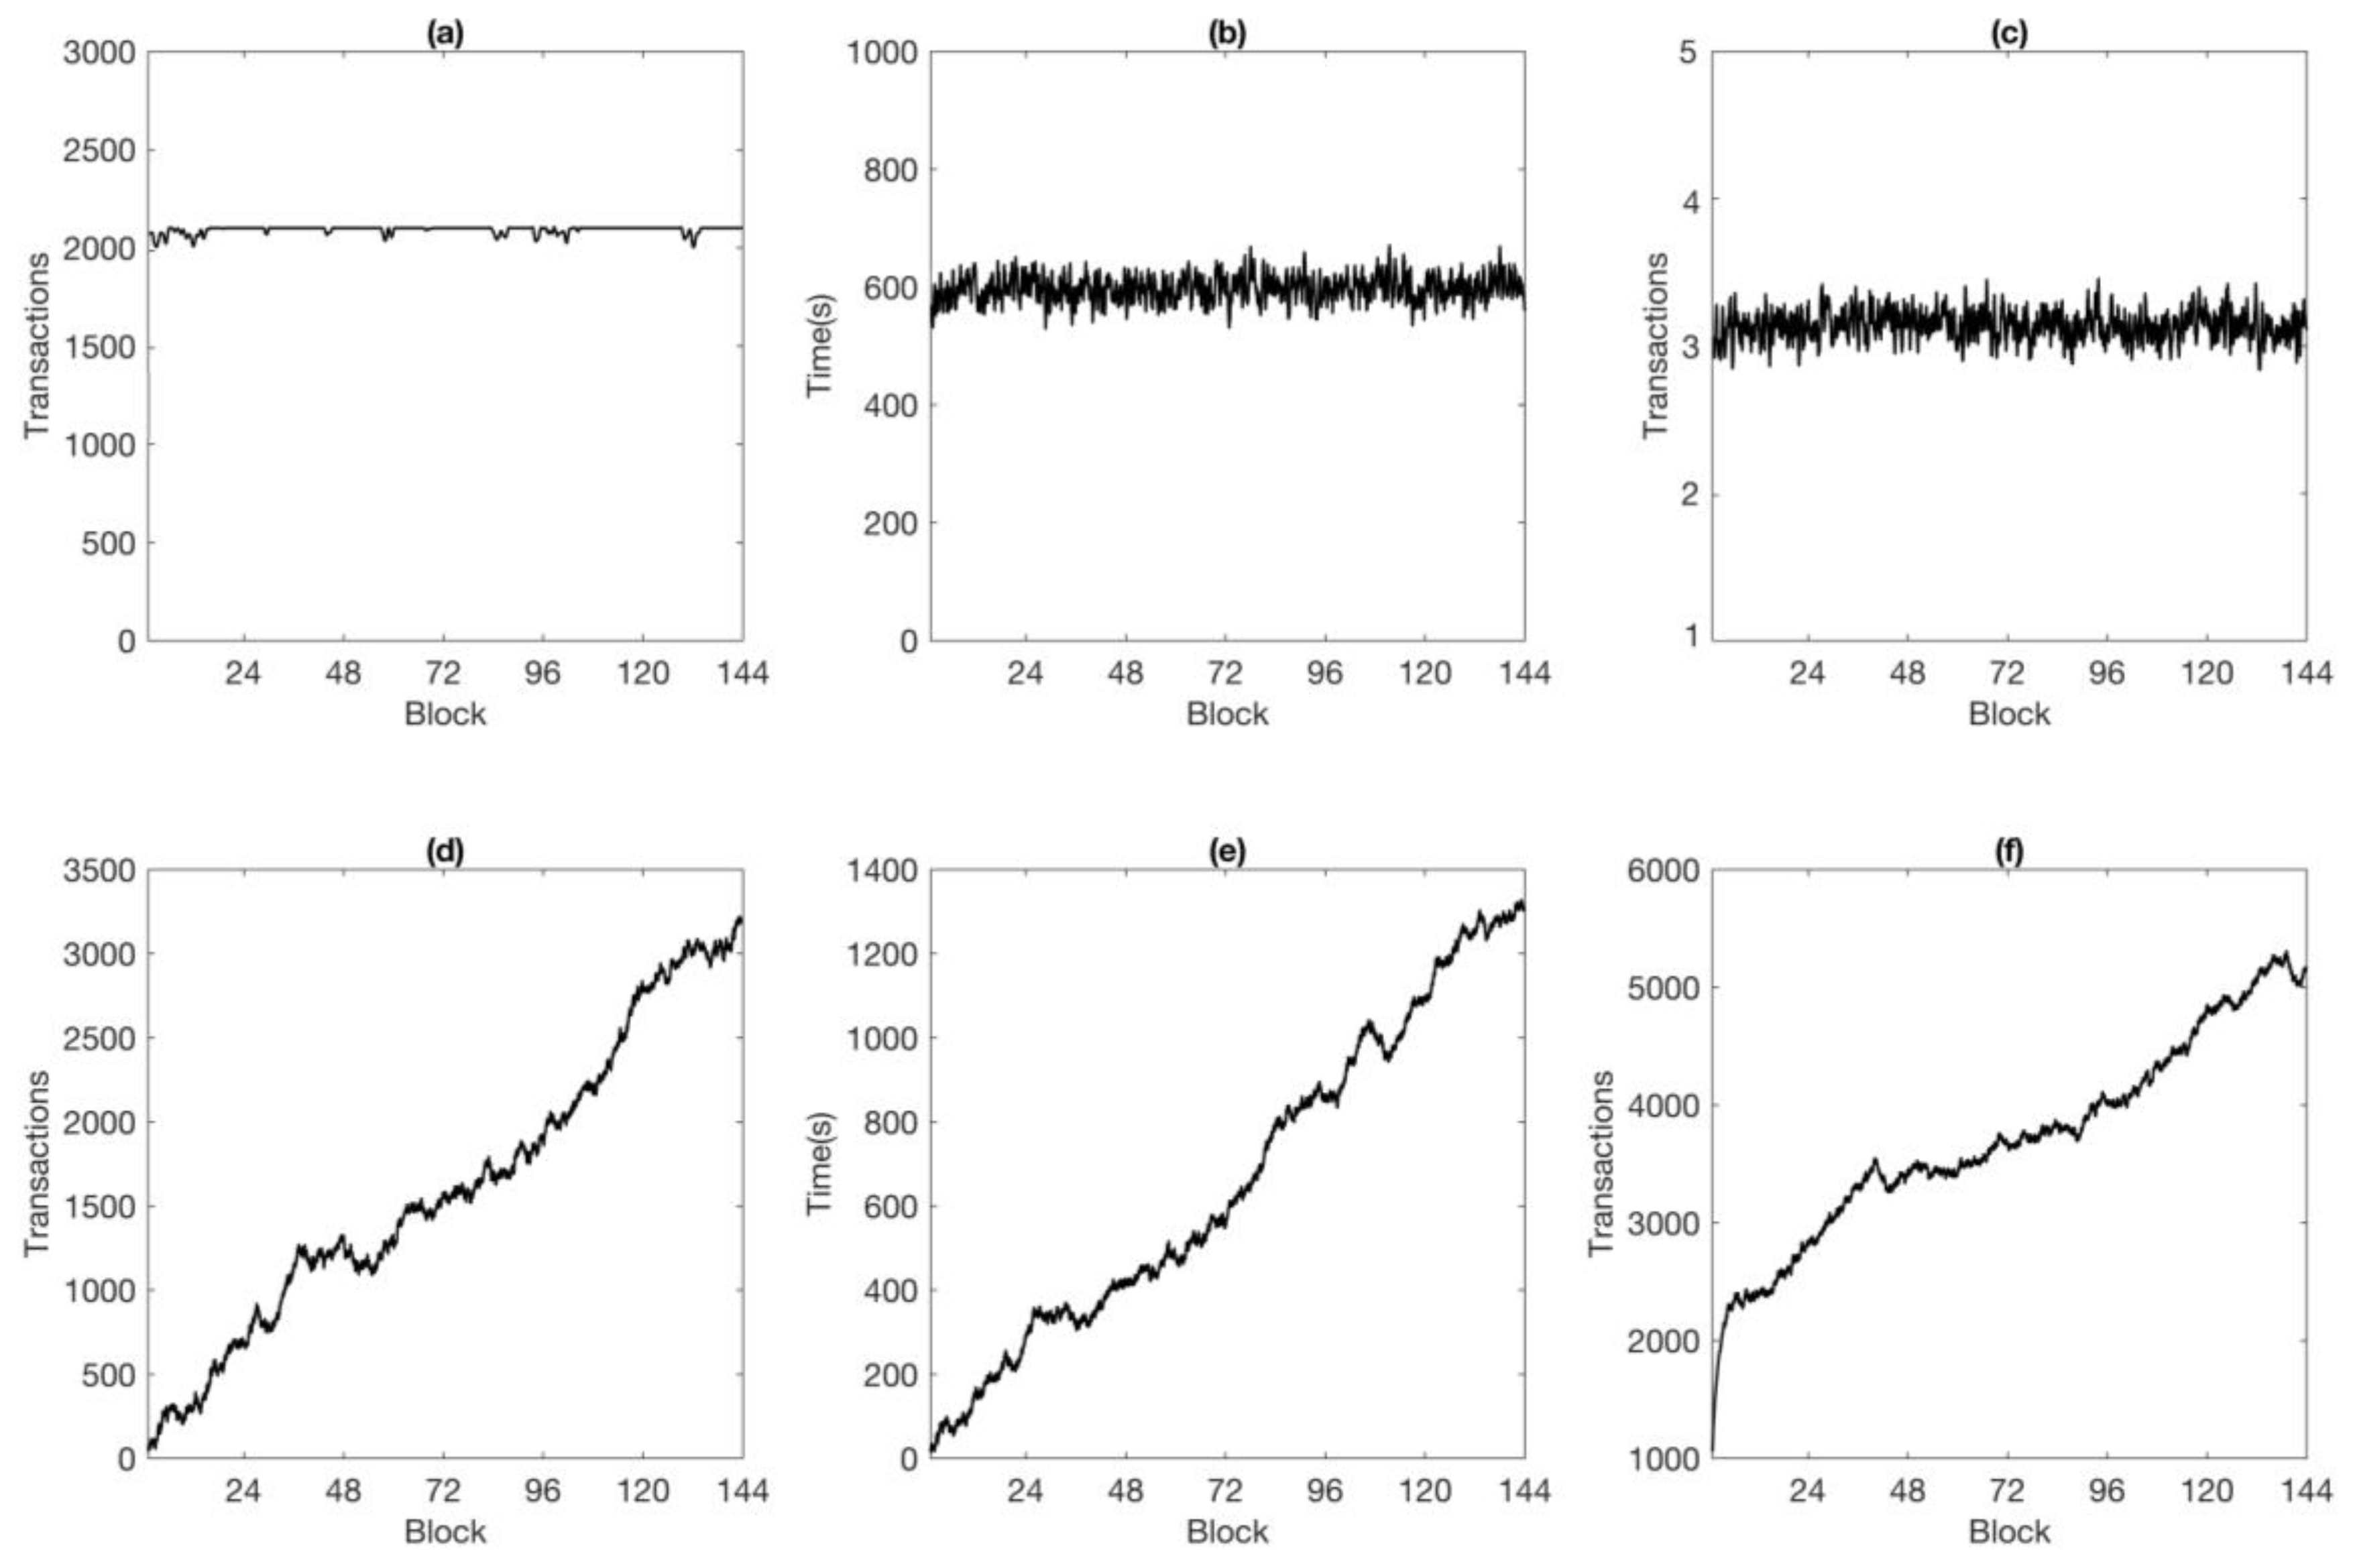
The aim of this study is to first time provide a simulation model to study the behavior of a blockchain system using queuing theory. The proposed model is applicable to small and large-scale systems, and also for the short- and long-term modeling of any such system. In this section, we present the short-term simulation results of the Bitcoin Cryptocurrency for one-day. The results are given in Figure 6a–f, summarizing the observation during one-day transactions with the Bitcoin cryptocurrency. The simulation was performed with the parameters mentioned in Table 1. The important indices, which are being considered by Bitcoin explorer3 to evaluate day-to-day transactions, are obtained from the proposed simulation model. The performance metrics shown in Figure 6 are: (a) Number of Transactions per block (b) Mining Time of Each Block (c) Number of Transactions per Second (d) Memorypool count (e) Waiting Time in Memorypool (f) Number of Unconfirmed Transactions in the Whole System.
4.2.1. Number of Transactions Per Block
In the ideal theoretical assumptions of Bitcoin, the number of transactions per block should not exceed the size limit of 1 MB, and as discussed in Section 4, we assumed that there are 2100 Tx/blocks. However, the trend in Figure 6a shows starting first block with 1400 transactions and then increasing, at a point the system becomes stable and provides 2100 for the remainder of the generated blocks.
4.2.2. Mining Time of Each Block
Refer to Section 4.1 for the hardcoded rules of a blockchain that stipulate that, ideally, a block should take around 10 minutes (or 600s) to be discovered by a miner. However, this time restriction cannot be exactly observed in real situations; there are always variations in mining times, and one block is different to another in terms of its difficulty of mining. In this graph, we can see that the time to mine a block varies from block to block, which is very realistic. The fluctuation of mining times was between 587s and 609s, and the average mining time of the whole day was 600s/block.
4.2.3. Number of Transactions Per Second
The number of confirmed transactions per second per block, or the system throughput, is the most criticized parameter of Bitcoin when it comes to comparing it with Visa and other payment systems [54,55]. This graph shows the average number of confirmed transactions per second per block, which means the time that it took for a transaction to be successfully mined.
4.2.4. Mempool Count
We assumed that the number of arrivals to the system is a little more than those serviced at the mining station. For example, if the number of transactions arriving at the system is 3.55/s and the total mining capacity is 3.5, then at some point, the transactions will start accumulating in the Mempool. This affects the Bitcoin system, and the number of accumulated unconfirmed transactions can be observed to increase throughout the day.
4.2.5. Waiting Time in Mempool
Each transaction arriving in the Bitcoin system has to wait some time before being selected by any miner. And as the memory count grows, the wait time for transactions to be selected by a miner also increases. This trend is reflected in both the memory pool count and the memory pool wait time. As long as the count keeps increasing, the waiting time for a newly-arrived transaction in the system will also grow.
4.2.6. Number of Unconfirmed Transactions in the Whole System
The arrival of transactions per day is unpredictable; at a given time, there could be a large number of transactions entering the system, while in the next moment, the number of arrivals may be lower than usual. Thus, incoming transaction requests from the users are not fixed, and the processing time and system capacity have several constraints, forcing the system to behave in a particular and prescribed way, i.e., the processing of system is load-independent. In our simulation, the number of arrivals was set to be a little higher than necessary, i.e., from the waiting ones in the Mempool count, while those are not the only transactions present in the system at a given time.
The Bitcoin mining process never goes into an idle state; so we can say that at any given time, there are a certain number of transactions accumulated at the fork, and some are waiting for reunion at the join stations to complete a block. The transactions inside the mining station and Mempool all together corresponds to the number of unconfirmed transactions in the whole system. This performance index is not usually discussed in Bitcoin stats, but it is one of the most important factors which should also be considered in the evaluation of any system.
5. Validation of Proposed Model
Due to the unavailability of benchmarking for Blockchain [56,57], we took 60 days of actual statistics from the two most popular currencies, Bitcoin and Ethereum, to validate our proposed model. The actual states of both are basically the status of transactions occurring in their systems every day. As discussed in Section 2, unlike Bitcoin, Ethereum’s computation and storage uses a gas metric, and the network limits that can be consumed by its users, by putting the limitation on the network in terms of gas usage, is actually a protection mechanism against overloading. Generally, during normal times of the day, the size of Ethereum is around 1500,000 gases, and its basic complexity is 21000 gases. Thus, transactions could fit into a block. In data size it is also different than Bitcoin; 1 block of Ethereum has a size less than 2KB; also, Ethereum is account based instead of transaction based. We took two different implementations of blockchains to validate our model’s flexibility, with promising results.
In this validation process, we took 60 days of actual stats, from the period from 26 October 2018 to 24 December 2018, from reliable explorers of both currencies. For Bitcoin, we used www.blockchain.com, and for Ethereum the collected data was from two resources: www.etherscan.io and www.etherchain.org. Table 2 shows the average of the collected parameters for the 60 days.
For all Bitcoin’s required parameter, data is easily available, while for the Ethereum, and and the Memory pool count is an average of 4 days (20 December to 24 December) only. Also, the average values of collected data for Bitcoin are not in equilibrium; as such, we needed to modify the parameters, so we adjusted , and . Table 3 shows the modified parameters for the simulation:
Table 4. Shows the input parameters and their respective values; the simulation setup is executed 60 times with varying service rates in all iterations of the WhatIf analysis.
Results
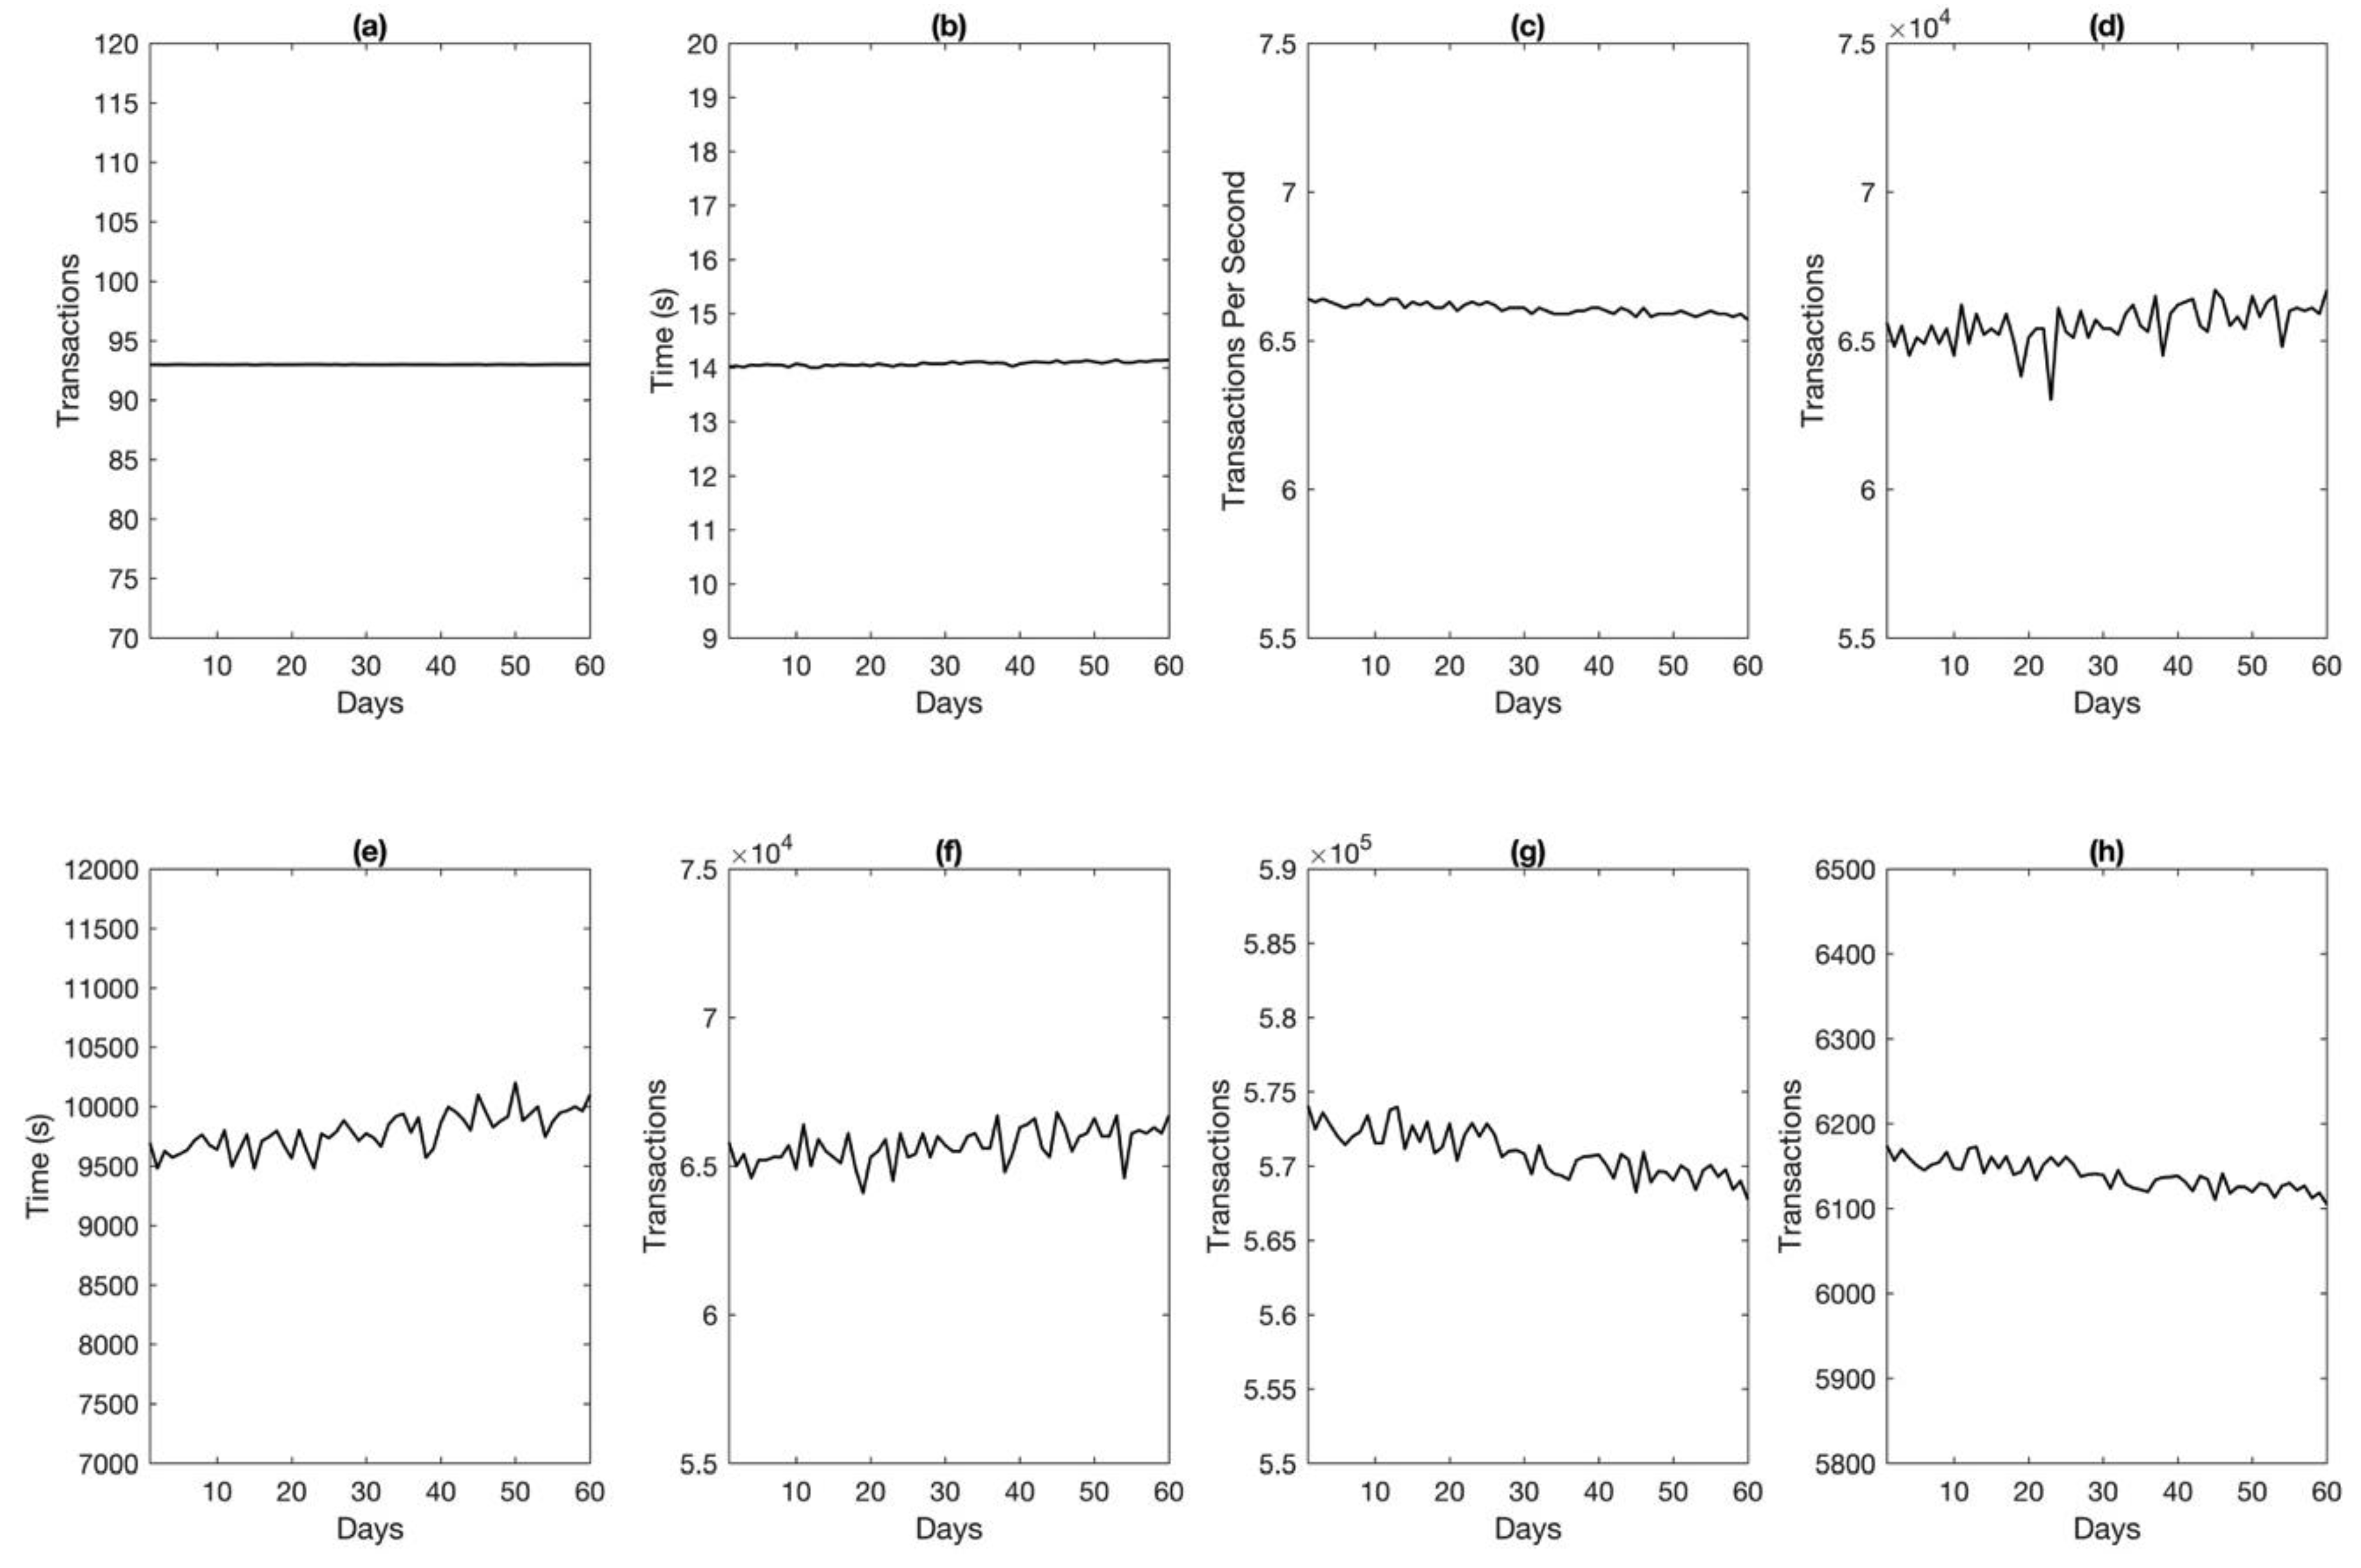
The blockchain systems Bitcoin and Ethereum were simulated using the proposed model for validation purposes. Figure 7 and Figure 8 shows the results of our simulation for both currencies. The graphs in the figures depict (a) the Number of Transactions per block (b) the Mining Time of Each Block (c) the Number of Transactions Per Second (d) the Memorypool count (e) the Waiting Time in the Memorypool, as discussed in the previous section. However, additionally, two more parameters, i.e., (f) Total Number of Transactions, and (g) Average Number of Blocks, were also computed. The total number of transactions is the number of overall confirmed transactions each day, and the average number of blocks is the number of blocks mined each day. Figure 7a–g shows the Bitcoin simulation for 60 days, and Figure 8a–g shows the simulation of Ethereum for 60 days.
The conducted simulation has service time as a variable in each iteration for both Bitcoin and Ethereum; it can be assumed that every day, the service rate of miners varies a little; for example, in the case of Bitcoin, day one had a service rate of 0.001536, day two of 0.001537, day three of 0.0015397, up to 0.00165016 on the 60th day of the simulation. The effect of this can be seen in the variation of the number of transactions, number of transactions per second, mining time and number of generated blocks, shown in Figure 7b,c,f,g,h. With the increase in the number of transactions, the number of blocks generated every day also increased, as did the throughput or transactions per second, while the mining time decreased. Similarly, with the increase in the number of incoming transactions, the number of accumulated elements in the memory pool also increased, as shown in Figure 7d, because the incoming transactions were higher in number than the number that could be processed. Thus, if the incoming transactions accumulates in the memory pool, the average wait time for transactions in the Mempool also increase every day. As discussed earlier, the number of unconfirmed transactions shown in Figure 7f is higher than the Mempool count shown in Figure 7d, because the number of transactions in the Mempool in not only unconfirmed in the system, but the transactions including fork, Mining-pool and join stations all together are the number of unconfirmed transactions.
Furthermore, it should be noted that the simulation has some limitations in dealing with the the number of transactions in a block. As shown in Figure 7a, it was 2003 for all days; however, in actual scenarios, this varies. But due to the fixed size of the fork, the number of transactions was 2003 throughout the simulation. However, in Figure 6a this parameter exhibited different behavior. The reason for this was that the simulation of an ideal scenario had no remaining transactions in the Mempool from the previous day, i.e., it started from zero, while the simulation we ran for actual statistics had some initial values for the parameters fork and Mempool, as given in Table 4. Thus, when the simulation started, a number of transactions had already accumulated inside the Memory pool and fork, from which the fork accumulation was instantly dispatched as a batch for Mining-pool without any delay.
With the set of new parameter values shown in Table 4, Figure 8a–h shows the simulation for Ethereum. There is a huge difference in the parameters of Bitcoin and Ethereum. In Ethereum, the number of transactions every day is twice that of Bitcoin, the number of transactions per block is very few, and the block generation frequency is higher; and the average number of accumulated transactions in the Mempool was ten times that of Bitcoin during the selected days. The definition of simulation indices for Ethereum should be assumed to be that discussed earlier for Bitcoin.
For further validation of our proposed model, Table 5 shows a comparison of the simulation results and actual values. As the simulation was performed on average values for 60 days of transactions in Bitcoin and Ethereum, a comparison was also drawn for the averages. The achieved results are in good agreement with actual values; and the error percentage was less than 1% for all parameters. The Percent Error is calculated as the absolute difference of simulated and actual values divided by the actual values and multiplied by 100. Values being marked with Not Available (N/A) for actual statistics in the case of Memory-pool Wait and Total Number of Unconfirmed Transactions results from these values not being provided by any explorer; thus, the comparison of errors of those is not applicable here. And the number of transactions per block is fixed in our proposed model due to the use of a fork for fixed size of batch generation. Thus the obtained result from the simulation is also fixed with zero percent error.
However, the Mempool count for Ethereum has a 1.478% level of error; the reason for this is that the actual data for the Mempool count during those 60 days of transactions were not available, so we assumed only a 4-day average to perform the simulation for the period of the sixty days. Thus, the difference in actual and simulated data is inevitable. It is also worth noting that the same parameter, Mempool count for Bitcoin, is in very good agreement with actual stats.
6. Applications of Proposed Model
A blockchain is a ledger of entries replicated over the nodes of entire network; it has the ability to create variety of applications on top of its distributed architecture. Ethereum unveiled the blockchain’s potential by introducing smart contracts, which are there to establish a bond (in the literal sense, i.e., an unbreakable chain) between unknown parties for a specified purpose. The contracts have discouraged the need for third party involvement and provided the foundation for the new generation of online applications [58].
In this paper, the proposed model is queuing theory-based, which is one of the most popular system performance evaluation and optimization tools for performing simulations of distributed and parallel systems. The proposed model can be used to represent for variety of blockchain applications. We divided the applications of our model into two broad categories, i.e., cryptocurrencies, and the new generation of applications over Internet, where a new generation of applications includes Smart Voting systems, the Banking and Finance Industry, enhanced transparency of supply chains, smart healthcare systems, and many IoT applications.
6.1. Cryptocurrencies
As exemplified in this paper, a number of performance indices can be calculated for the optimization of existing cryptocurrencies, also forecasting the mining capacity, rewards received for the mining power one has, and performing comparisons of diverse type of currencies. It will be possible to estimate the power utilization and required mining power using the proposed model.
6.2. New Generation of Applications over Internet
A wide range of applications can be simulated to reveal system behavior, such as, the latency involved in information retrieval, waiting time, queue time, processing time, throughput, power utilization, and response time.
7. Conclusion
Blockchains remain relatively unexplored for theoretical modeling; in this paper, we propose a model to simulate a blockchain using queuing theory. The proposed model is constructed by using one M/M/1 queue as a Memory Pool, a set of fork-join for batch generation, and an M/M/c queue as a Mining pool. The proposed model is a simple yet powerful means to reveal many important indices such as (a) the Number of Transactions per block (b) the Mining Time of Each Block (c) System Throughput/Transactions per second (d) Memory-pool count (e) Waiting Time in Memory-pool (f) Number of Unconfirmed Transactions in Whole System (g) Total Number of Transactions and (h) Number generated of Blocks. First, the proposed model was used to evaluate ideal statistics of a single day’s transactions in Bitcoin. And then the model was used to simulate 2 months of actual statistics of Bitcoin and Ethereum for validation. The obtained results are in good agreement, with a minor error percentage. Although, the proposed model is used to evaluate cryptocurrencies in this paper, it is still able to simulate a variety of blockchain-based systems for performance evaluations and optimization.
Author Contributions
Conceptualization, R.A.M. and J.A.; Formal analysis, R.A.M.; Methodology, R.A.M.; Software, R.A.M.; Supervision, J.P.L.; Writing—original draft, R.A.M.; Writing—review & editing, R.A.M. and J.A.
Funding
This work was supported by the National Natural Science Foundation of China (Grant No. 61370073), National High Technology Research and Development Program of China (Grant No. 2007AA01Z423), Project of Science and Technology Department of Sichuan Province; and Chengdu Civil-Military Integration Project Management Co., Ltd.
Conflicts of Interest
The authors declare no conflict of interest.
References
- Nakamoto, N. Bitcoin: A Peer-to-Peer Electronic Cash System. Available online: https://bitcoin.org/bitcoin.pdf (accessed on 20 January 2019).
- Reid, F.; Harrigan, M. An analysis of anonymity in the bitcoin system. In Security and Privacy in Social Networks; Springer: New York, NY, USA, 2013; pp. 197–223. [Google Scholar]
- Zhu, X.; Badr, Y. Identity Management Systems for the Internet of Things: A Survey Towards Blockchain Solutions. Sensors 2018, 18, 4215. [Google Scholar] [CrossRef] [PubMed]
- Dewivedi, A.D.; Srivastava, G.; Dhar, S.; Singh, R. A Decentralized Privacy-Preserving Healthcare Blockchain for IoT. Sensors 2019, 19, 326. [Google Scholar] [CrossRef] [PubMed]
- Figorilli, S.; Antonucci, F.; Costa, C.; Pallottino, F.; Raso, L.; Castiglione, M.; Pinci, E.; Vecchio, D.D.; Colle, G.; Proto, A.R. A blockchain implementation prototype for the electronic open source traceability of wood along the whole supply chain. Sensors 2018, 18, 3133. [Google Scholar] [CrossRef] [PubMed]
- Qu, C.; Tao, M.; Yuan, R. A hypergraph-based blockchain model and application in internet of things-enabled smart homes. Sensors 2018, 18, 2784. [Google Scholar] [CrossRef] [PubMed]
- Eyal, I.; Gencer, A.E.; Sirer, E.G.; Van Renesse, R. Bitcoin-NG: A Scalable Blockchain Protocol. In Proceedings of the 13th USENIX Symposium on Networked Systems Design and Implementation (NSDI ’16), Santa Clara, CA, USA, 16–18 March 2016; pp. 45–59. [Google Scholar]
- Miller, A.; Juels, A.; Shi, E.; Parno, B.; Katz, J. Permacoin: Repurposing bitcoin work for data preservation. In Proceedings of the 2014 IEEE Symposium on Security and Privacy (SP), Berkeley, CA, USA, 18–21 May 2014; pp. 475–490. [Google Scholar]
- Buterin, V. Ethereum White Paper, GitHub Repos., 2013. Available online: https://github.com/ethereum/wiki/wiki/White-Paper (accessed on 20 January 2019).
- BitShares 2.0-Industrial-grade decentralized (DPoS) eco-system on blockchain. Available online: https://bitshares.org/ (accessed on 20 January 2019).
- Dash Official Website|Dash Crypto Currency—Dash. Available online: www.dash.org (accessed on 20 January 2019).
- Dogecoin. Available online: https://dogecoin.com/ (accessed on 20 January 2019).
- Litecoin, Litecoin-Open Source P2P Digital Currency, 2013. Available online: https://litecoin.org/ (accessed on 20 January 2019).
- Home—Peercoin. Available online: https://peercoin.net/ (accessed on 20 January 2019).
- Ciaian, P.; Rajcaniova, M.; Kancs, D. Virtual relationships: Short- and long-run evidence from BitCoin and altcoin markets. J. Int. Financ. Mark. Institutions Money 2018, 52, 173–195. [Google Scholar] [CrossRef] [Green Version]
- Cryptocurrency Market Capitalizations|CoinMarketCap. Available online: https://coinmarketcap.com/ (accessed on 19 January 2019).
- Li, Q.L.; Ma, J.-Y.; Chang, Y.-X. Blockchain Queueing Theory, 2018. Available online: https://arxiv.org/abs/1808.01795 (accessed on 20 January 2019).
- Kawase, Y.; Kasahara, S. Transaction-confirmation time for bitcoin: A Queueing analytical approach to blockchain mechanism. In Lecture Notes in Computer Science (including subseries Lecture Notes in Artificial Intelligence and Lecture Notes in Bioinformatics); Springer: New York, NY, USA, 2017; pp. 75–88. [Google Scholar]
- Biais, B.; Bisiere, C.; Bouvard, M.; Casamatta, C. The Blockchain Folk Theorem, 2018. Available online: https://papers.ssrn.com/sol3/papers.cfm?abstract_id=3108601 (accessed on 20 January 2019).
- Lewenberg, Y.; Bachrach, Y.; Sompolinsky, Y.; Zohar, A.; Rosenschein, J.S. Bitcoin mining pools: A cooperative game theoretic analysis. In Proceedings of the International Joint Conference on Autonomous Agents and Multiagent Systems, Istanbul, Turkey, 4–8 May 2015; pp. 919–927. [Google Scholar]
- Houy, N. The Bitcoin Mining Game, 2014. Available online: https://papers.ssrn.com/sol3/papers.cfm?abstract_id=2407834 (accessed on 20 January 2019).
- Baqer, K.; Huang, D.Y.; McCoy, D.; Weaver, N. Stressing out: Bitcoin ‘stress testing’. In Lecture Notes in Computer Science (including subseries Lecture Notes in Artificial Intelligence and Lecture Notes in Bioinformatics); Springer: Berlin, Germany, 2016; pp. 3–18. [Google Scholar]
- Gervais, A.; Karame, G.O.; Wüst, K.; Glykantzis, V.; Ritzdorf, H.; Capkun, S. On the Security and Performance of Proof of Work Blockchains. In Proceedings of the 2016 ACM SIGSAC Conference on Computer and Communications Security—CCS’16, New York, NY, USA, 24–28 October 2016; pp. 3–16. [Google Scholar]
- Carlsten, M.; Kalodner, H.; Weinberg, S.M.; Narayanan, A. On the Instability of Bitcoin Without the Block Reward. In Proceedings of the 2016 ACM SIGSAC Conference on Computer and Communications Security—CCS’16, New York, NY, USA, 24–28 October 2016; pp. 154–167. [Google Scholar]
- Isaja, M.; Soldatos, J. Distributed ledger technology for decentralization of manufacturing processes. In Proceedings of the 2018 IEEE Industrial Cyber-Physical Systems, St. Petersburg, Russia, 15–18 May 2018; pp. 696–701. [Google Scholar]
- Michael, J.W.; Cohn, A.; Butcher, J.R. Blockchain Technology And Regulatory Investigations. 2018. Available online: https://www.steptoe.com/images/content/1/7/v2/171967/LIT-FebMar18-Feature-Blockchain.pdf (accessed on 19 November 2018).
- Ron, D.; Shamir, A. Quantitative analysis of the full Bitcoin transaction graph. In Lecture Notes in Computer Science (including subseries Lecture Notes in Artificial Intelligence and Lecture Notes in Bioinformatics); Springer: Berlin, Germany, 2013; pp. 6–24. [Google Scholar]
- Drescher, D. Blockchain Basics; Springer: Berlin, Germany, 2017. [Google Scholar]
- Atik, J.; Gerro, G. Hard Forks on the Bitcoin Blockchain: Reversible Exit, Continuing Voice. 1 Stan. J. Blockchain L. Pol. 1 2018. Available online: https://stanford-jblp.pubpub.org/pub/hard-forks-bitcoin (accessed on 20 January 2019).
- McGinn, D.; Birch, D.; Akroyd, D.; Molina-Solana, M.; Guo, Y.; Knottenbelt, W.J. Visualizing Dynamic Bitcoin Transaction Patterns. Big Data 2016, 4, 109–119. [Google Scholar] [CrossRef] [PubMed] [Green Version]
- Sapirshtein, A.; Sompolinsky, Y.; Zohar, A. Optimal selfish mining strategies in bitcoin. In Lecture Notes in Computer Science (including subseries Lecture Notes in Artificial Intelligence and Lecture Notes in Bioinformatics); Springer: Berlin, Germany, 2017; pp. 515–532. [Google Scholar]
- Malone, D.; O’Dwyer, K.J. Bitcoin Mining and its Energy Footprint. In Proceedings of the 25th IET Irish Signals & Systems Conference 2014 and 2014 China-Ireland International Conference on Information and Communities Technologies (ISSC 2014/CIICT 2014), Limerick, Ireland, 26–27 June 2014; pp. 280–285. [Google Scholar]
- Grunspan, C.; Pérez-Marco, R. Double Spend Races. 2017. Available online: https://arxiv.org/abs/1702.02867 (accessed on 20 January 2019).
- Sompolinsky, Y.; Zohar, A. Bitcoin’s Underlying Incentives. Commun. ACM 2018, 15, 29–52. [Google Scholar] [CrossRef]
- Laszka, A.; Johnson, B.; Grossklags, J. When bitcoin mining pools run dry: A game-theoretic analysis of the long-term impact of attacks between mining pools. In Lecture Notes in Computer Science (including subseries Lecture Notes in Artificial Intelligence and Lecture Notes in Bioinformatics); Springer: Berlin, Germany, 2015; pp. 63–77. [Google Scholar]
- Johnson, B.; Laszka, A.; Grossklags, J.; Vasek, M.; Moore, T. Game-Theoretic Analysis of DDoS Attacks Against Bitcoin Mining Pools. In Financial Cryptography and Data Security; Springer: Berlin, Germany, 2014; pp. 72–86. [Google Scholar]
- Underwood, S. Blockchain beyond bitcoin. Commun. ACM 2016, 59, 15–17. [Google Scholar] [CrossRef] [Green Version]
- Hao, Y.; Li, Y.; Dong, X.; Fang, L.; Chen, P. Performance Analysis of Consensus Algorithm in Private Blockchain. In Proceedings of the IEEE Intelligent Vehicles Symposium, Proceedings, Changshu, China, 26–30 June 2018; pp. 280–285. [Google Scholar]
- Azaria, A.; Ekblaw, A.; Vieira, T.; Lippman, A. MedRec: Using blockchain for medical data access and permission management. In Proceedings of the 2016 2nd International Conference on Open and Big Data, OBD 2016, Vienna, Austria, 22–24 August 2016; pp. 25–30. [Google Scholar]
- Buterin, V. Ethereum White Paper: A Next Generation Smart Contract & Decentralized Application Platform. 2014. Available online: https://www.ethereum.org/pdfs/EthereumWhitePaper.pdf (accessed on 20 January 2019).
- Buterin, V. A Next-Generation Smart Contract and Decentralized Application Platform. 2013. Available online: https://s3.us-east-2.amazonaws.com/bci-static/downloads/ethereum_whitepaper.pdf (accessed on 20 January 2019).
- Christidis, K.; Devetsikiotis, M. Blockchains and Smart Contracts for the Internet of Things. IEEE Access 2016, 4, 2292–2303. [Google Scholar] [CrossRef]
- Luu, L.; Chu, D.-H.; Olickel, H.; Saxena, P.; Hobor, A. Making Smart Contracts Smarter. In Procedings of the CCS ’16 Proceedings of the 2016 ACM SIGSAC Conference on Computer and Communications Security, Vienna, Austria, 24–28 October 2016; pp. 254–269. [Google Scholar]
- Jiang, G.; Fan, Y.; Jiang, G.; Fan, Y. A Method for Analyzing the Impact of Intra-System and Inter-System Interference on DME Based on Queueing Theory. Sensors 2019, 19, 348. [Google Scholar] [CrossRef] [PubMed]
- Meng, T.; Li, X.; Zhang, S.; Zhao, Y. A hybrid secure scheme for wireless sensor networks against timing attacks using continuous-time Markov chain and queueing model. Sensors 2016, 16, 1606. [Google Scholar] [CrossRef] [PubMed]
- Zhang, J.; Han, G.; Qian, Y. Queuing theory based co-channel interference analysis approach for high-densitywireless local area networks. Sensors 2016, 16, 9. [Google Scholar]
- Marin, A.; Rossi, S.; Sottana, M. Biased Processor Sharing in Fork-Join Queues. In Proceedings of the International Conference on Quantitative Evaluation of Systems, Beijing, China, 4–7 September 2018; pp. 273–288. Available online: https://link.springer.com/chapter/10.1007%2F978-3-319-99154-2_17 (accessed on 20 January 2019).
- Baccelli, F.; Makowski, A.M.; Shwartz, A. The fork-join queue and related systems with synchronization constraints: stochastic ordering and computable bounds. Adv. Appl. Probab. 1989, 21, 629–660. [Google Scholar] [CrossRef]
- Boxma, O.J.; Koole, G.; Liu, Z. Queueing-theoretic solution methods for models of parallel and distributed systems. In Performance Evaluation of Parallel and Distributed Systems-Solution Methods; Boxma, O.J., Koole, G.M., Eds.; CWI: Amsterdam, The Netherlands, 1994; pp. 1–24. [Google Scholar]
- Gelenbe, E. Multiprocessor Performance; John Wiley & Sons, Inc.: New York, NY, USA, 1989. [Google Scholar]
- Kim, C.; Agrawala, A.K. Analysis of the Fork-Join Queue. IEEE Trans. Comput. 1989, 38, 250–255. [Google Scholar] [CrossRef]
- Lazowska, E.; Zahorjan, J.; Graham, G.; Sevcik, K. Quantitative System Performance: Computer System Analysis Using Queuing Network Models; Prentice-Hall, Inc.: Upper Saddle River, NJ, USA, 1984. [Google Scholar]
- Bertoli, M.; Casale, G.; Serazzi, G. JMT: Performance Engineering Tools for System Modeling. ACM SIGMETRICS Perform. Eval. Rev. 2009, 36, 6. [Google Scholar] [CrossRef]
- Kokoris-Kogias, E.; Jovanovic, P.; Gailly, N.; Khoffi, I.; Gasser, L.; Ford, B. Enhancing Bitcoin Security and Performance with Strong Consistency via Collective Signing. In Proceedings of the 25th USENIX Security Symposium, Austin, TX, USA, 10–12 Auguest 2016; pp. 279–296. [Google Scholar]
- Patron, T. The Bitcoin Revolution: An Internet of Money; Diginomics: Utrecht, The Netherlands, 2015. [Google Scholar]
- Buchanan, B.; Naqvi, N. Building the Future of EU: Moving Forward with International Collaboration on Blockchain. JBBA 2018, 1, 1–4. [Google Scholar] [CrossRef]
- Thakkar, P.; Nathan, S.; Vishwanathan, B. Performance Benchmarking and Optimizing Hyperledger Fabric Blockchain Platform. 2018. Available online: https://arxiv.org/abs/1805.11390 (accessed on 20 January 2019).
- Barnes, D. Blockchain Manoeuvres: Applying Bitcoin’s Technology to Banking. 2015. Available online: https://pdfs.semanticscholar.org/11f3/3397d35fd4916f9fdf6c89b84ea50802bbd1.pdf (accessed on 20 January 2019).
Figure 1.
Transactions in Bitcoin Network.

Figure 2.
New Block Addition Process Flow.

Figure 3.
Blockchain Network segregated into two types of pools.

Figure 4.
Workflow of the Proposed model for blockchain Based Systems.

Figure 5.
Simulation Model for Blockchain System using JSImgraph.

Figure 6.
Simulation of one-day ideal statistics of Bitcoin in Proposed Model. (a) Number of Transactions per block; (b) Mining Time of Each Block; (c) Average Number of Transactions Per second; (d) Memorypool count; (e) Waiting Time in Memorypool; (f) Number of Unconfirmed Transactions in the Whole System.

Figure 7.
Simulation of Sixty days of actual statistics for Bitcoin with the Proposed Model (a) Number of Transactions per block (b) Mining Time of Each Block (c) Average number of Transactions Per Second (d) Memorypool count (e) Waiting Time in Memorypool (f) Number of Unconfirmed Transactions in the Whole System (g) Total Number of Transactions (h) Average Number of Blocks.

Figure 8.
Simulation of Sixty days of actual statistics of Ethereum with the Proposed Model (a) Number of Transactions per block; (b) Mining Time of Each Block; (c) Average number of Transactions Per Second; (d) Memorypool count; (e) Waiting Time in Memorypool; (f) Number of Unconfirmed Transactions in Whole System; (g) Total Number of Transactions; (h) Average Number of Blocks.


Table 1.
Simulation Parameter of Bitcoin’s one-day transactions.
| Stations | Parameters Description | Values |
|---|---|---|
| Source | Transaction Arrival rate | 3.55 (λ(s)) |
| Memory Pool | Number of Transactions dispatched from Mempool | 0.2856 (1/μ(s)) |
| Policy | FCFS | |
| Queue Capacity | ∞ | |
| Fork/Join | Number of Jobs | 2100 (Tx/Block) |
| Number of Tasks (block) | 1 | |
| Policy | FCFS | |
| Finite Capacity | 2100 | |
| Drop Rule | BAS | |
| Mining Pool | Mining Rate | 0.0016 (1/μ(s)) |
| Number of Miners | 2200 | |
| Policy | FCFS | |
| Queue Capacity | 2100 | |
| Drop Rule | BAS | |
| Execution Parameters | Number of Total Transactions | 306720 |
| Simulation Time | 86400s |
Table 2.
Actual statistics of Bitcoin and Ethereum for past 60 days.
| No. of Tx/day | Mempool Count | Tx/block | Mine Time | Confirmed Tx/Sec | No. of Blocks |
|---|---|---|---|---|---|
| Bitcoin (60-Day Average) | |||||
| 264197.016 | 5641 | 2003 | 626.139 | 3.057 | 133.77 |
| Ethereum (60-Day Average) | |||||
| 557478.783 | 66523.5* | N/A | 14.096 | N/A | 6055.233 |
Table 3.
Parameters Considered for the Simulation.
| No. of Tx/day | Mempool Count | Tx/block | Mine Time | Confirmed Tx/Sec | No. of Blocks |
|---|---|---|---|---|---|
| Bitcoin (60-Day Average) | |||||
| 275247 | 5641 | 2003 | 626.139 | 3.1857 | 137 |
| Ethereum (60-Day Average) | |||||
| 570274.56 | 66523.5 | 93.03 | 14.096 | 6.6 | 6129.398 |
Table 4.
Input Parameters for Simulation of Bitcoin and Ethereum.
| Stations | Parameters Description | Bitcoin | Ethereum |
|---|---|---|---|
| Source | Transaction Arrival rate | 3.432 (λ(s)) | 6.57 (λ(s)) |
| Memory Pool | Transactions dispatched from Mempool | 0.2941 | 0.1503 |
| Policy | FCFS | FCFS | |
| Queue Capacity | ∞ | ∞ | |
| Fork | Number of Jobs | 2003 (Tx/Block) | 93 (Tx/Block) |
| Number of Tasks (Block) | 1 | 1 | |
| Policy | FCFS | FCFS | |
| Finite Capacity | 2003 | 93 | |
| Drop Rule | BAS | BAS | |
| Mining Pool Queue | Mining Rate | 0.001546 to 0.001650 (1/μ(s)) | 0.07137 to 0.07082 (1/μ(s)) |
| Number of Miners | 2200 | 100 | |
| Policy | FCFS | FCFS | |
| Queue Capacity | 2003 | 93 | |
| Drop Rule | BAS | BAS | |
| Execution Parameters | Number of Total Transactions | 275247 | 570274 |
| Initial Mempool Transactions | 5641 | 66523 | |
| Initial Transactions in Fork | 2003 | 93 | |
| Simulation Time | 86400s | 86400s | |
| Repetition Seeds (days) | 60 | 60 |
Table 5.
Comparison of Actual vs. Simulated Results.
| Parameters (Average) | Bitcoin | Ethereum | ||||
|---|---|---|---|---|---|---|
| Actual | Simulated | Percent Error | Actual | Simulated | Percent Error | |
| Tx Per block () | 2003 | 2003 | 0% | 93 | 93 | 0 |
| Mining Time () | 626.139 | 627.2323 | 0.174% | 14.096 | 14.073 | 0.163% |
| Tx/Sec (Txs) | 3.18 | 3.1930 | 0.409% | 6.6 | 6.60770 | 0.116% |
| Mempool Count (U) | 6847.441 | 6849.1740 | 0.025% | 66523.5 | 65540 | 1.478% |
| Mempool Wait (Mempw) | N/A | 2257.7936 | N/A | N/A | 9787.944 | N/A |
| Unconfirmed Tx in System (Uday) | N/A | 8876.95 | N/A | N/A | 65688.33 | N/A |
| Total Number of Tx/day (Txday) | 275247 | 275876.78 | 0.228% | 570274 | 570906 | 0.11% |
| Number of Blocks () | 137.4 | 137.731 | 0.241% | 6129.398 | 6139.5225 | 0.165% |
© 2019 by the authors. Licensee MDPI, Basel, Switzerland. This article is an open access article distributed under the terms and conditions of the Creative Commons Attribution (CC BY) license (http://creativecommons.org/licenses/by/4.0/).
Share and Cite
MDPI and ACS Style
Memon, R.A.; Li, J.P.; Ahmed, J. Simulation Model for Blockchain Systems Using Queuing Theory. Electronics 2019, 8, 234. https://doi.org/10.3390/electronics8020234
AMA Style
Memon RA, Li JP, Ahmed J. Simulation Model for Blockchain Systems Using Queuing Theory. Electronics. 2019; 8(2):234. https://doi.org/10.3390/electronics8020234
Chicago/Turabian StyleMemon, Raheel Ahmed, Jian Ping Li, and Junaid Ahmed. 2019. "Simulation Model for Blockchain Systems Using Queuing Theory" Electronics 8, no. 2: 234. https://doi.org/10.3390/electronics8020234
Note that from the first issue of 2016, this journal uses article numbers instead of page numbers. See further details here.