City Marathon Active Timing System Using Bluetooth Low Energy Technology


1
College of Mechanical and Electrical Engineering, National Taipei University of Technology, Taipei 10608, Taiwan
2
Institute of Mechatronic Engineering, National Taipei University of Technology, Taipei 10608, Taiwan
*
Author to whom correspondence should be addressed.
Electronics 2019, 8(2), 252; https://doi.org/10.3390/electronics8020252
Submission received: 9 November 2018
/
Revised: 29 January 2019
/
Accepted: 1 February 2019
/
Published: 22 February 2019
(This article belongs to the Special Issue RFID, WPT and Energy Harvesting)
Abstract
:This study proposes and implements city marathon timing technology using Bluetooth Low-Energy (BLE) communication technology. This study also performs a prevalidation of the athletes’ physiological sensory data that is sent out by the same timing system—the BLE active communication technology. In order to verify the timing and positioning technology, 621 K records of static measurement of the Received Signal Strength Indicator (RSSI) were first collected. The trend of the RSSI between the location and the BLE Receiver when the runners carried a BLE Tag was analyzed. Then, the difference between the runners’ passing timestamp and the runners’ actual passing time when the runners carried a BLE Tag and ran past the BLE Receivers was dynamically recorded and analyzed. Additionally, the timing sensing rate when multiple runners ran past the BLE Receivers was verified. In order to confirm the accuracy of the time synchronization in the remote timing device, the timing error, synced by the Network Time Protocol (NTP), was analyzed. A global positioning system (GPS) signal was used to enhance the time synchronization’s accuracy. Additionally, the timing devices were separated by 15 km, and it was verified that they remained within the timing error range of 1 ms. The BLE communication technology has at least one more battery requirement than traditional passive radio frequency identification (RFID) timing devices. Therefore, the experiment also verified that the BLE Tag of this system can continue to operate for at least 48 h under normal conditions. Based on the above experimental results, it is estimated that the system can provide a timing error of under ±156 ms for each athlete. The system can also meet the scale of the biggest international city marathon event.
1. Introduction
On 12 March 2017, more than 20,000 people signed up for the Zurich Marató de Barcelona in Europe. According to a report published on the marathon’s website, a radio frequency identification (RFID) reader was set up every 5 km; however, about 1.88% of the readers did not record the runners’ passing time [1]. The next year, the miss rate of the RFID readers was reduced to 0.60%; however, it was still not complete [2]. The calculation of the RFID missing detection rates is based on the statistics of the runners who completed the competition, and the statistics for the runners who retired mid-competition had been eliminated. To be expected, after participating in a 42.195 km marathon race, the contestants lacking some of their timing records may not have had a pleasant experience.
An RFID reader’s missing a detection may be caused by runner-related actions when the runner passes the tag reader in addition to technical problems. For example, it could be caused by a wrongly placed RFID tag. Normally, the usage rule for RFID tags recommends that they be worn on the chest or on the instep and tied with a shoelace. When an RFID reader reads a tag’s data in circumstances where a runner has placed their foot on the antenna of the RFID reader in the mat, the reading quality could be detuned. The RFID signal also could be hindered by a hand or an arm, which may cause a missed detection. A missed detection could also be caused by moisture from rain or sweat. Furthermore, a missed detection could be caused by a protocol or wireless radio government regulations [3]. The fact that RFID readers have technical problems was proved a long time ago. Studies have improved the reception methods of RFID readers and the antenna configuration such that the scores that runners obtain can reach a 100% detection rate [4,5]. This may have to be verified in a perfect environment, i.e., one in which no interference exists. In addition, the timing system of RFID in passive mode cannot resolve problems with transmitting the physiological sensory data of athletes.
A study in which each runner wore a Bluetooth Low-Energy (BLE) device and received the BLE device’s broadcast signal from a mobile phone showed that this system could achieve a 100% acquisition rate of the timing score and actively transmitted information that individual runners required [6]. However, the trick is to track the time points that the runners pass through every radius of a fixed point on the track within 25 m or 12.5 m. In addition, because this is through a large range of receiving blocks, the time difference that is received will be obviously enlarged. For example, a runner running at a speed of 5 m/s will have a difference of up to ±5 s; that is, ±25 m/5 = ±5 s. Runners with a slower speed of 1 m/s will be more likely to have a difference of nearly ±25 s; that is, ±25 m/1 = ±25 s.
According to the International Association of Athletics Federations (IAAF) [7] (RULE 165, page 175), a Photo Finish image is used to capture the race results, and the highest resolution accuracy is 10 ms. The resolution accuracy of Transponder Timing Systems is 0.1 s and is recorded to the next whole second. Therefore, in addition to achieving a 100% record of athletes’ timing results and the ability to transmit athletes’ physiological sensory data, a new system must also meet the minimum timing resolution requirement of at least 0.1 s. Additionally, the time record should be kept in seconds.
In addition to considering the timing mechanism, this lightweight active communication device that is carried by the athletes must also have a synchronization timing mechanism for the full marathon distance of 42.195 km. Each contestant participating in a city marathon can have their own precise timing data and can transmit other relevant notification information as needed. At present, studies have only considered the transmission of the individual battery power of the BLE Tag to simulate other data communication needs in the future. The indication of battery power level uses only 12 bits in the payload of 31 bytes.
Many studies on wearable sensing devices have been carried out [8,9,10]. The question of how to simultaneously transmit the physiological data of all of the athletes in a running race with a single timing system needs to be researched.
At present, in city marathons, most of the participants are amateurs. When they participate in a competition without professional training, they are often prone to sports accidents, especially in urban marathons or mountain marathons. Therefore, the purpose of this study is to increase the provision of timing schemes with existing communication technologies while maintaining the ability to transmit information, such as accidental injury notifications or physiological sensory data for each athlete, in the future.
2. Structure and Analysis of the System
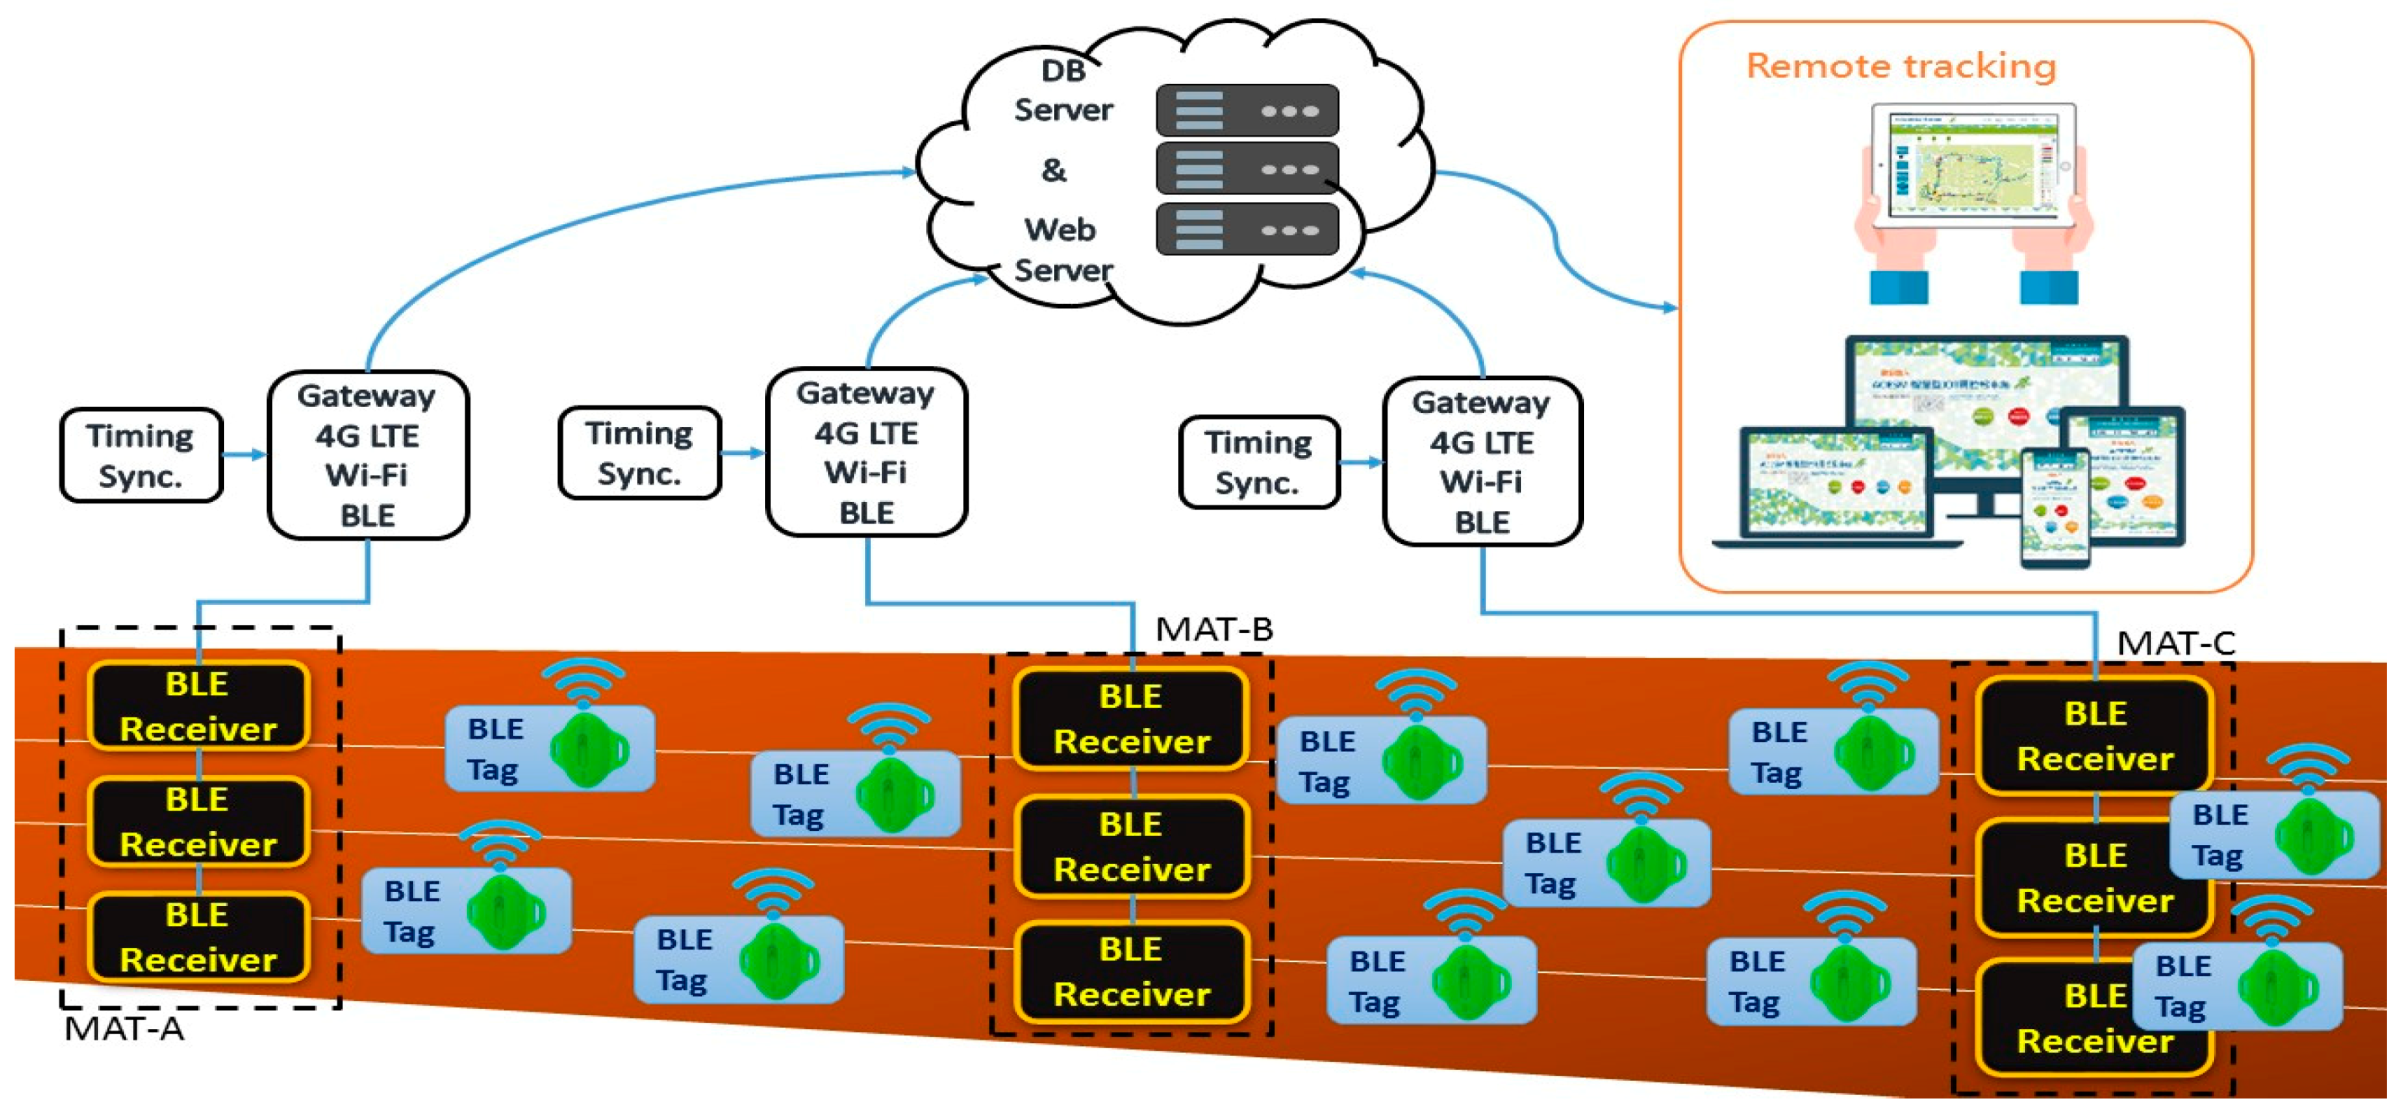
This study uses Bluetooth Low-Energy (BLE) 4.0 radio communication technology [11,12]. Each runner is required to carry a BLE Tag transmitter. A BLE Receiver is placed on the start line, on the finish line, and at 500-m intervals along the track, as shown in Figure 1.
The BLE Receiver is a serial-connected BLE receiver device that is covered with a rubber case as a mat.
When a runner runs across each mat, the BLE Receiver will receive the broadcast radio data signal from the BLE Tag that the runner carries. The received time for the information is the passing time of the runner who passes the receiver. The information in the broadcast radio data is the bib number and the battery power level in the BLE Tag carried by the runner who passes the receiver. Each BLE Receiver transmits the data from the respectively connected gateways to the cloud server via the wireless network, and the server performs operations to analyze the performance of each runner or present relevant information.
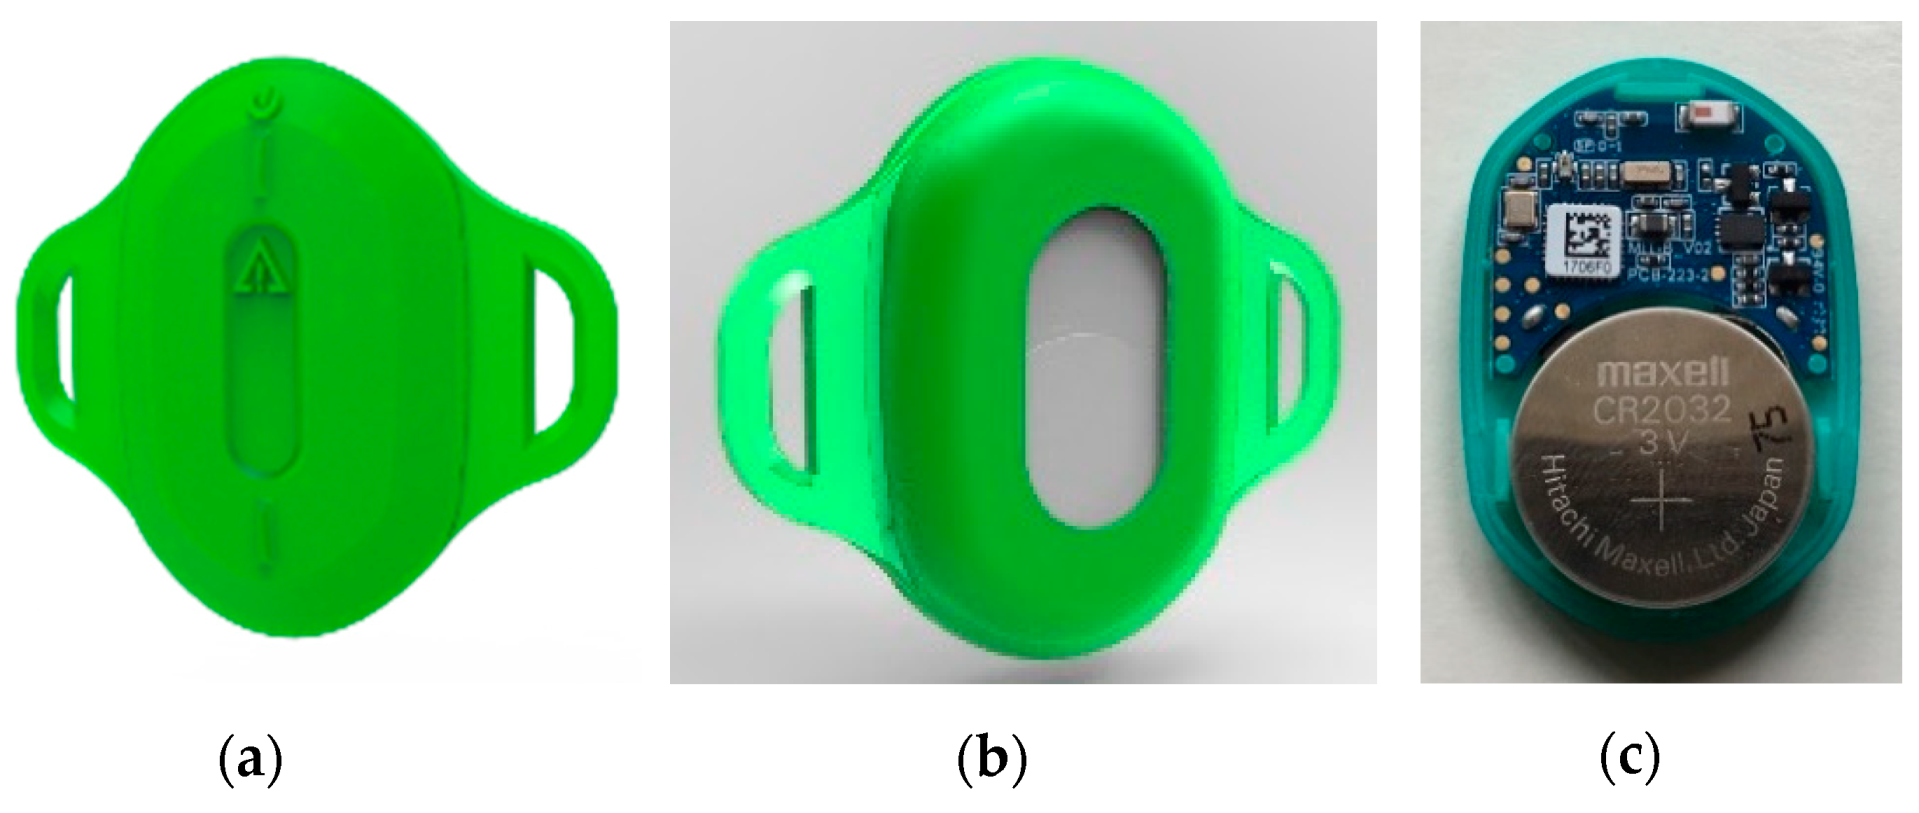
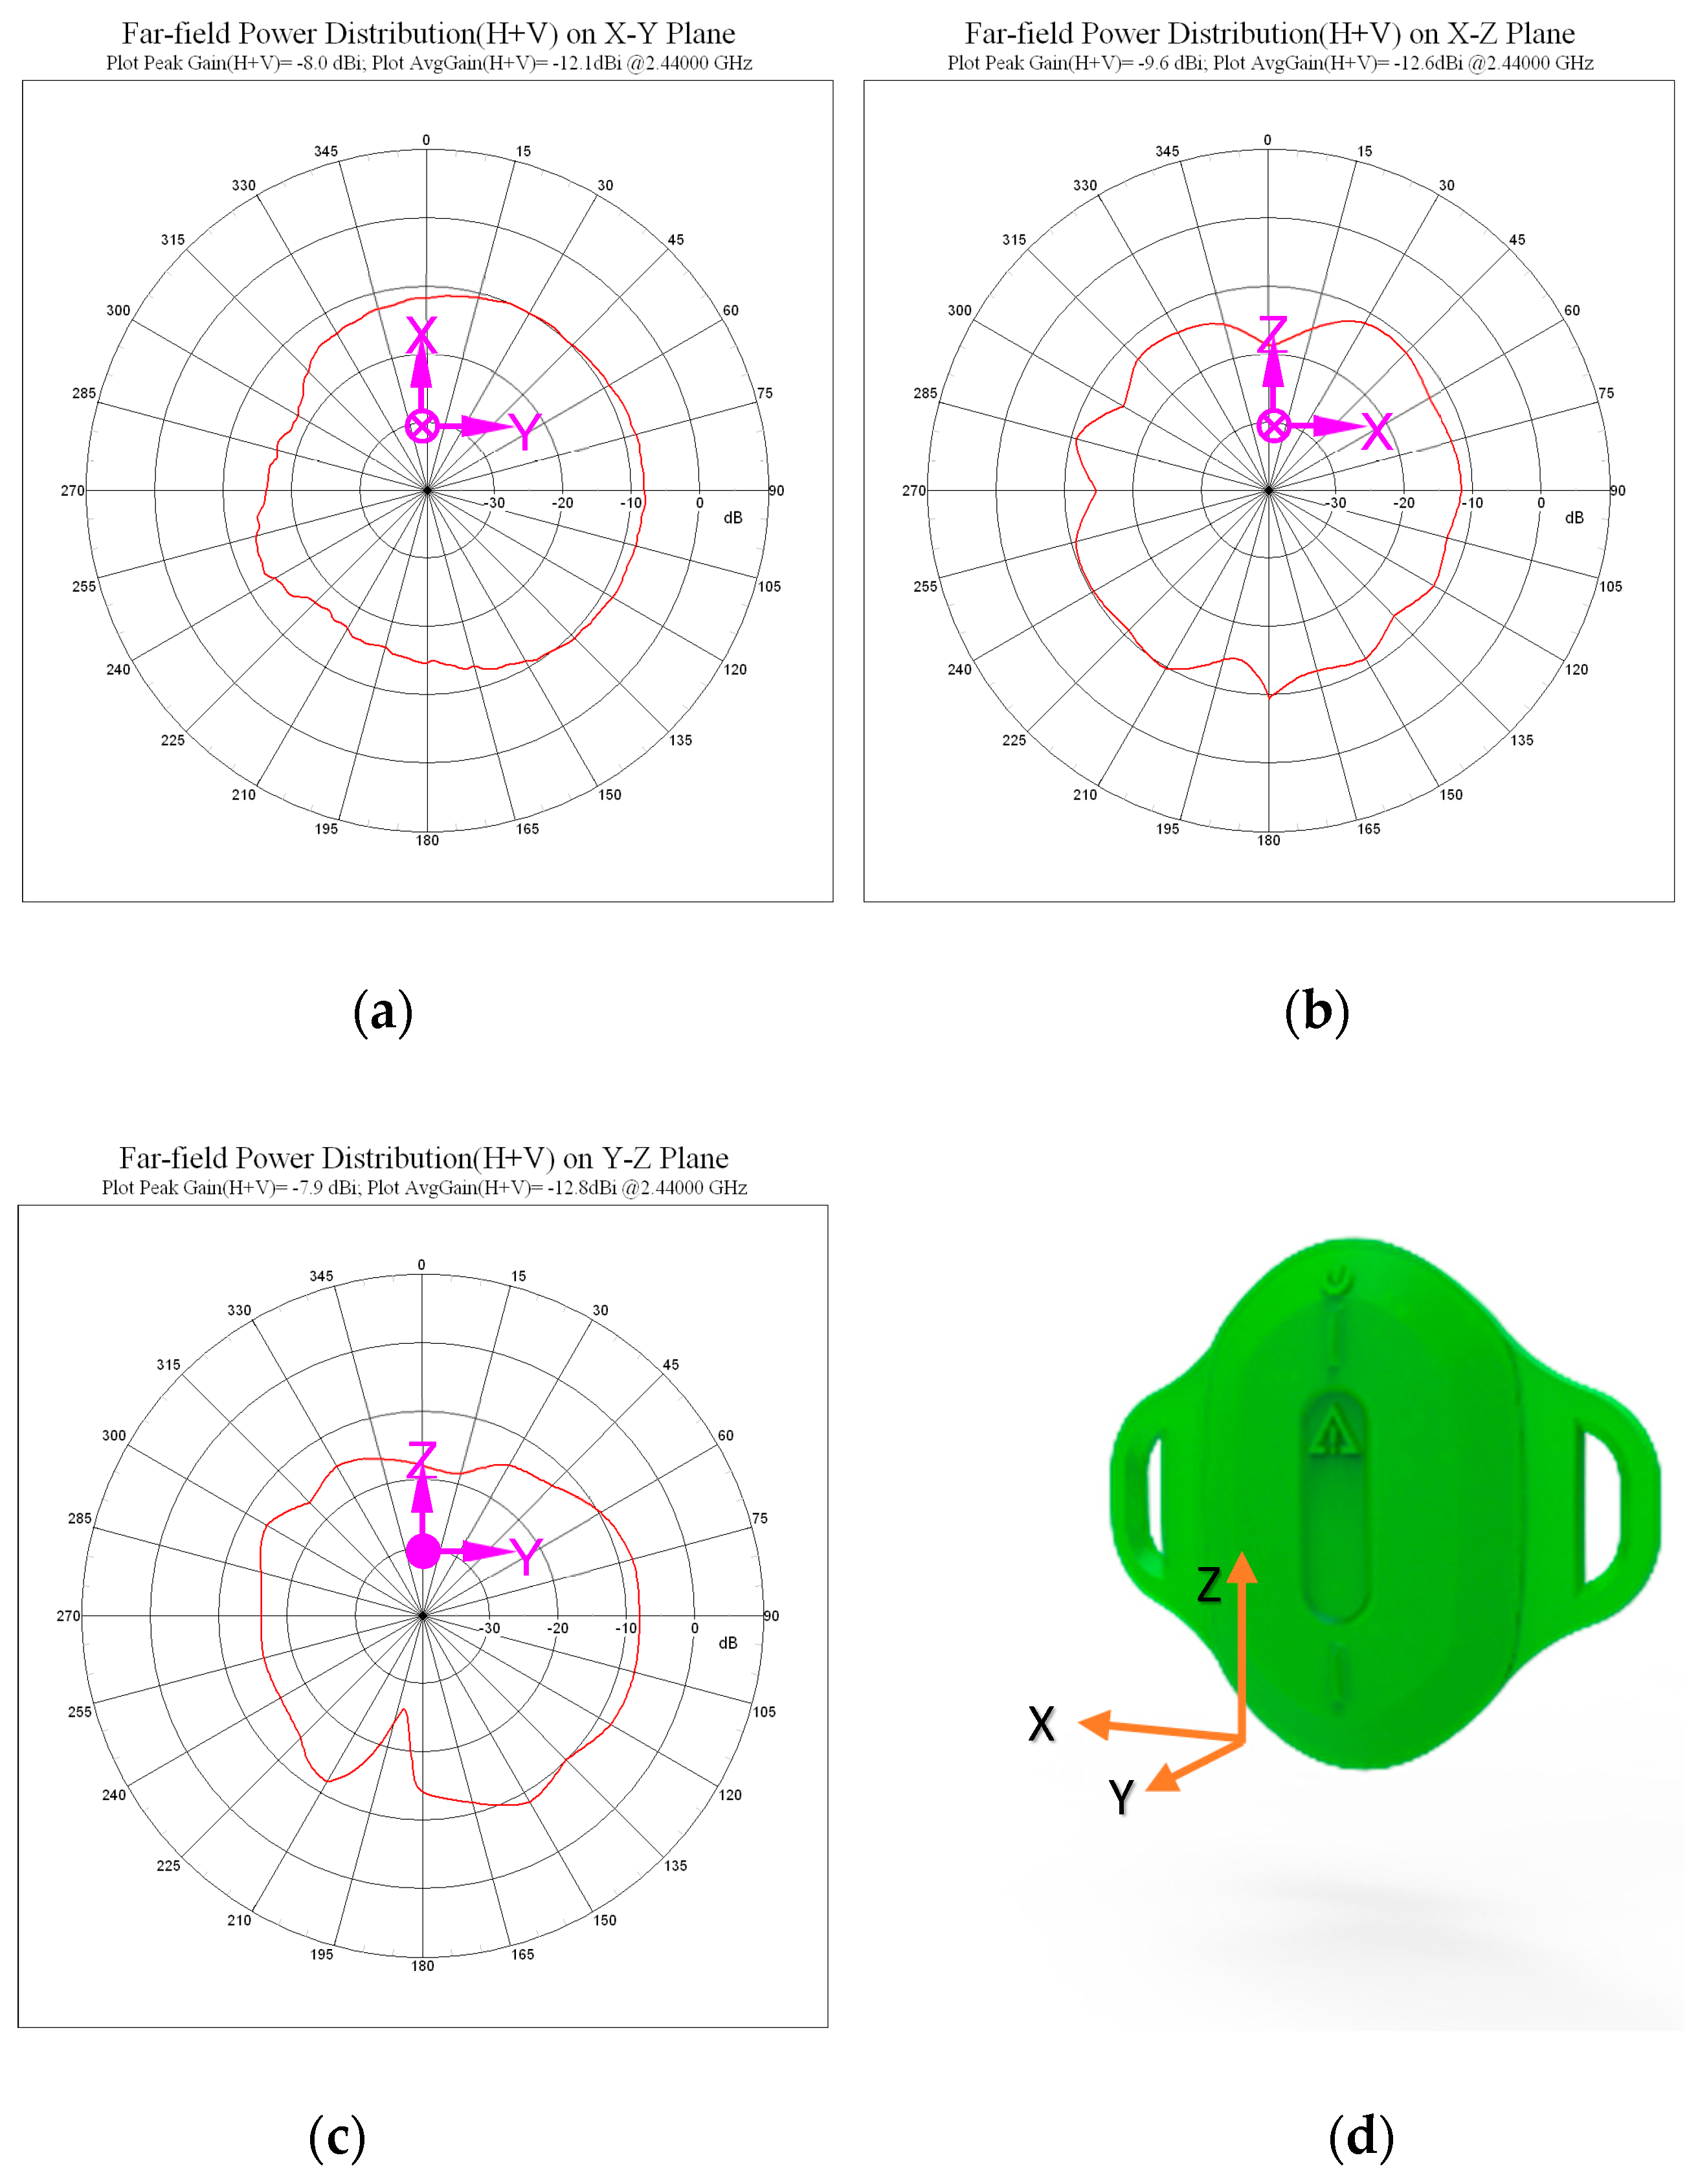
As shown in Figure 2a–c, the industrial design of the BLE Tag that a runner carries considers a shape that can be tied with a shoelace to the runner’s instep or that has a ring hole for a pin or cloth tie used to attach the tag to the runner’s chest. In actual production, the BLE circuit is wrapped and protected with a green silicone housing. The housing reduces the impact of motion and prevents water damage to the circuit. The BLE Tag’s internal components include a BLE signal transmission integrated circuit and a battery, and the tag further includes a user interface, such as a light-emitting diode (LED) and a button. Figure 3 shows the results of a radiation far-field power distribution test on the BLE Tag. After the antenna matching circuit calibration, the BLE Tag with a battery, the plastic case, and the silicone housing was tested. Figure 3a–c show the different test plane directions, and Figure 3d shows the coordinate axis. Referring to the far-field power distribution data on the Y-Z Plane, as shown in Figure 3c, the field strength has a difference of 9 dBi (−9 dBi~−18 dBi) from the Y axis to the Z axis, and then to the range of the -Y axis (90° through 0° to 270°). Referring to the far-field power distribution data on the X-Y Plane, as shown in Figure 3a, the field strength has a difference of 5 dBi (−9 dBi~−14 dBi) from the X axis to the Y axis, and then to the range of the -X axis (0° through 90° to 180°). This shows that the direction in which the BLE Tag is worn causes the BLE Receiver to appear in a different orientation, and there is also a significant difference in signal strength.
The BLE Tag operates to continuously broadcast individual signals after it starts. In order to improve the accuracy of timing for a runner who passes the BLE Receiver, the strategy is to reduce the distance and range of the BLE radio frequency (RF) signal’s broadcast, and to only receive the signal when a runner passes across the BLE Receiver. Secondly, the cycle time of the BLE RF broadcast signal is shortened to improve the time division accuracy. Based on the World Record for the 42.195 km marathon, the average running speed is about 57.81 cm per 100 ms [13]. Therefore, the BLE Receiver continuously receives the BLE Tag’s broadcast radio signal and analyzes and makes a judgment on the intersection time point of the nearest signal from the BLE Tag. When the time division point of the distance converges and is controlled to be within 57.81 cm, the detected timing error will be less than 100 ms.
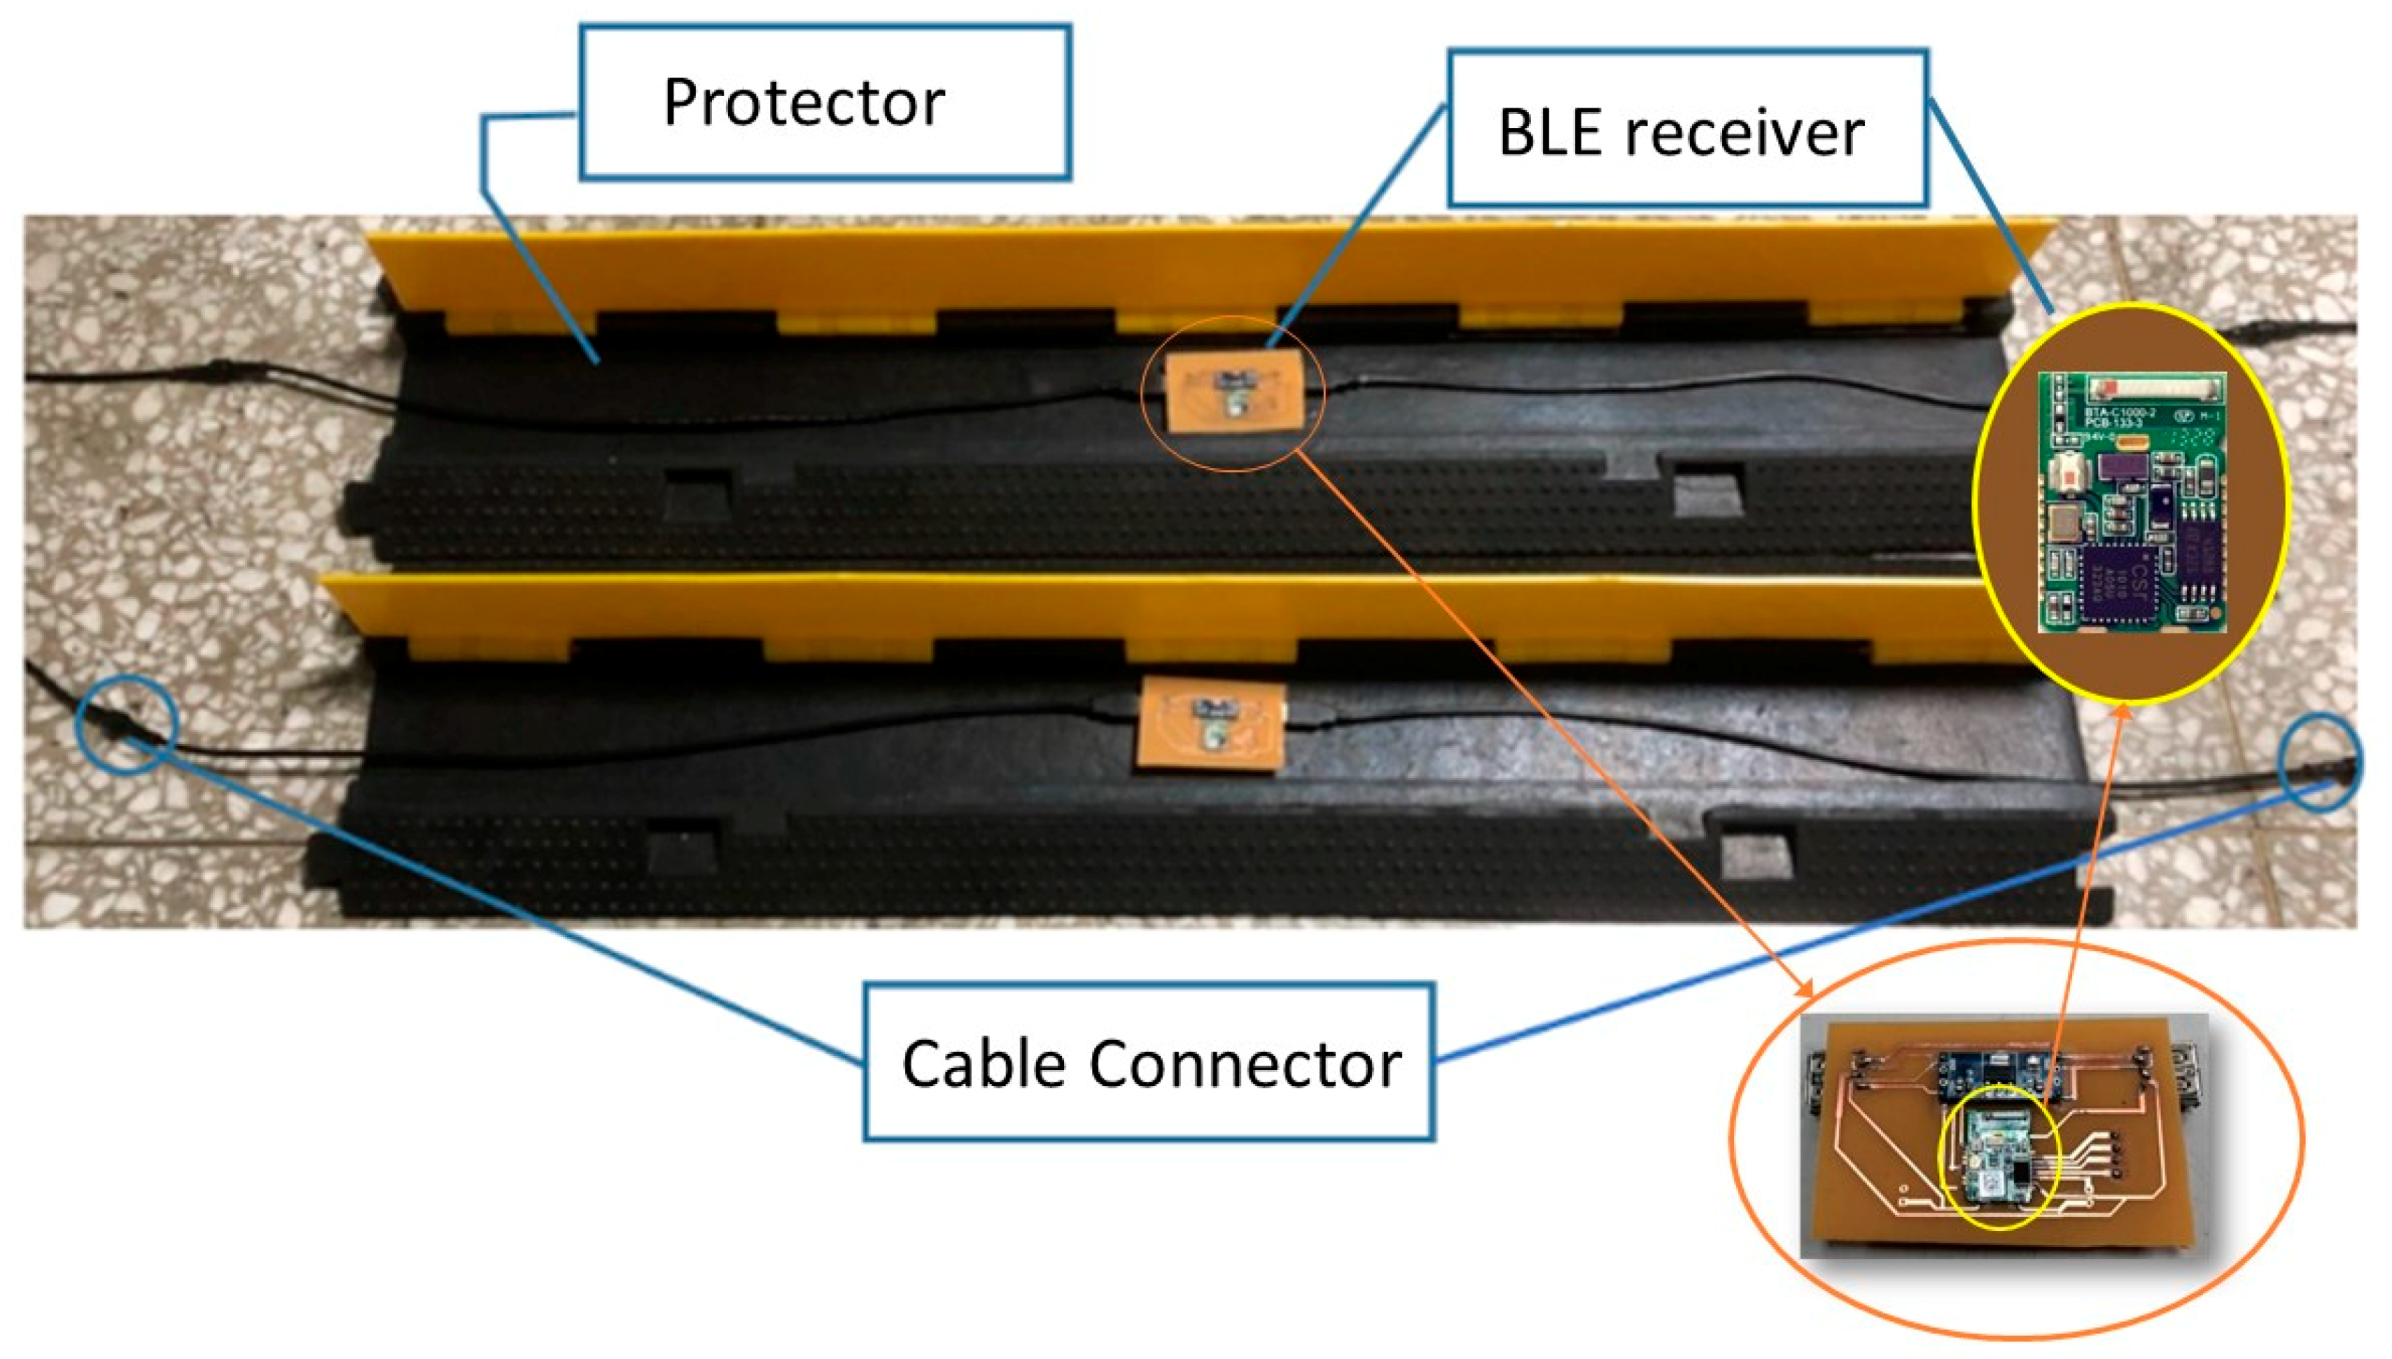
The BLE Receiver is placed in a yellow jacket cable protector, as shown in Figure 4. This protector is commonly used as a wiring board on roads. It is suitable for use in serial connections and can withstand heavy loads. Therefore, the protector can withstand a runner’s footstep. On the other hand, because of its yellow and eye-catching design, and its sloped and cushioned rubber outer structure, it is less likely to cause a runner to trip over when crossing it. The BLE Receiver’s electrical part includes a BLE Receiver integrated circuit module (CSR1010), a power regulator, a power supply cable, and a data transmission cable. All electrical cables were wrapped in waterproof IP68-sealed joints and wiring.
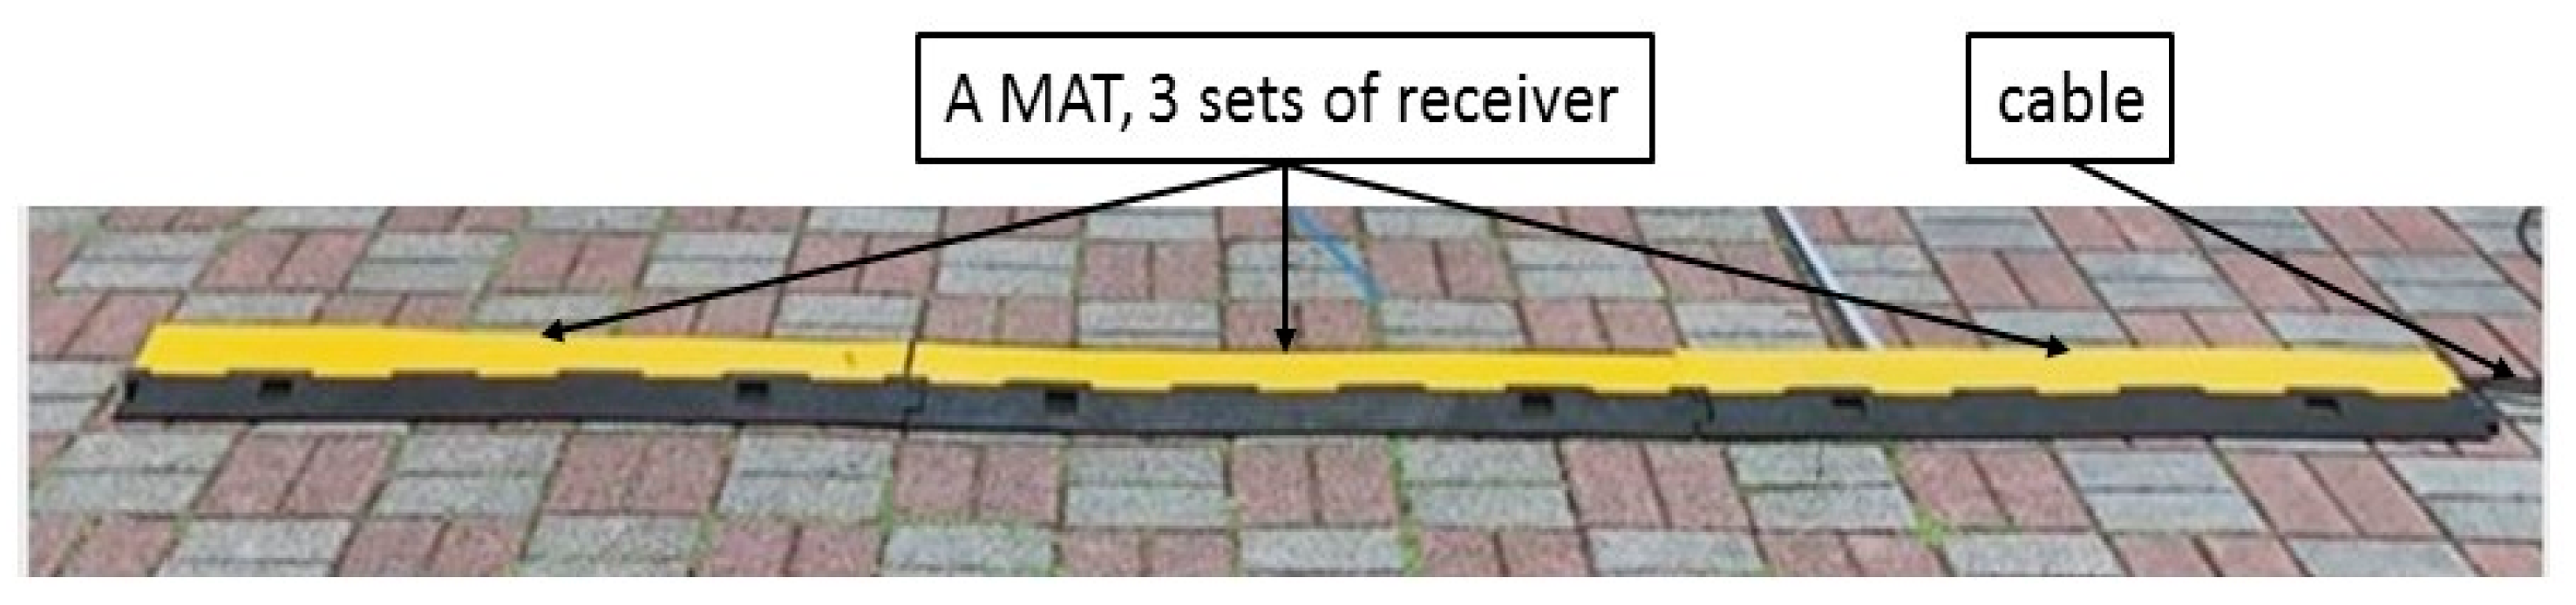
There is no specific rule that determines the width of a city marathon track. The starting line of the track is particularly wide because it is expected to accommodate most of the runners at the same time. Therefore, the main design consideration for the mat is that we should easily and quickly be able to connect BLE Receivers in series to cover an entire runway’s width to accommodate different race scale requirements. As shown in Figure 5, there are three BLE Receivers connected in series as a longer mat (MAT); so, all runners should be covered by BLE Receivers in the mat when they run across the mat.
In fact, in 2011, the Valencia Marathon had a total of 5,866 participants, an 8-m wide track, and up to 52 people passing per second at the same time. It averaged 6.5 people per second per meter. In 2012, the Boston Marathon had a total of 25,062 participants, an 11-m wide track, and at most 46 people passing per second [3] (p. 29). It averaged 4.2 people per second per meter. Therefore, we will set the athlete passing capacity per meter of runway width to 4.2–6.5 people per second. That is, the three BLE Receivers should cover a 3-m wide runway when placed on the track. The three BLE Receivers should also be able to process information on at least 20 (6.5 × 3 = 19.5) runners passing simultaneously. This will exceed the scale of an international city marathon.
The basic structure and operation instructions of a BLE Receiver are as follows:
- A BLE Receiver’s structure includes an integrated circuit board for receiving BLE signals, a serial communication line, a power supply circuit with a cable, and a yellow jacket cable protector.
- A MAT is built with several sets of BLE Receivers. Depending on the track width, the MAT should lie full across the runway. Each set of BLE Receivers is placed in series per meter with each other.
- The terminal point of the mat is connected in series to the Gateway and power supply unit.
- During operation, the BLE Receivers continuously receive and filter the BLE signals of a specific Universal Unique Identifier (UUID) [11], and synchronize the built-in clocks of all serial-connected BLE Receivers through input/output (I/O) electrical signals every 10 min.
- When continuously receiving the same BLE Tag’s signal, the BLE Receiver analyzes and determines the closest time point.
- All collected data is transferred to the Gateway simultaneously according to the final judgment time sequence.
The terminal end of a BLE Receiver is connected in series to the Gateway. The Gateway also performs time synchronization control and supplies the power to its series-connected BLE Receivers.
Although an official race time is the time that has elapsed between the starting gunshot and the athlete reaching the finish line [14] (page 154), in city marathons, the amateur or leisure runners calculate their scores in net time. Therefore, the correctness and accuracy of the start and end times are particularly important. The time synchronization of this experimental design used a wireless network connection to obtain the UTC time of the Internet time server. The remaining small timing error was then compensated for by the pulse-per-second (PPS) signal of a global positioning system (GPS, U-BLOX NEO-6 MV2; the accuracy for the PPS is 30 ns in root mean square (RMS), 99% <60 ns) [15]. An original GPS signal’s accuracy can be within 10 ns [16]. Texas Instruments tested the PPS signal jitter of three sets of GPSs, and found it to be less than ±30 ns [17].
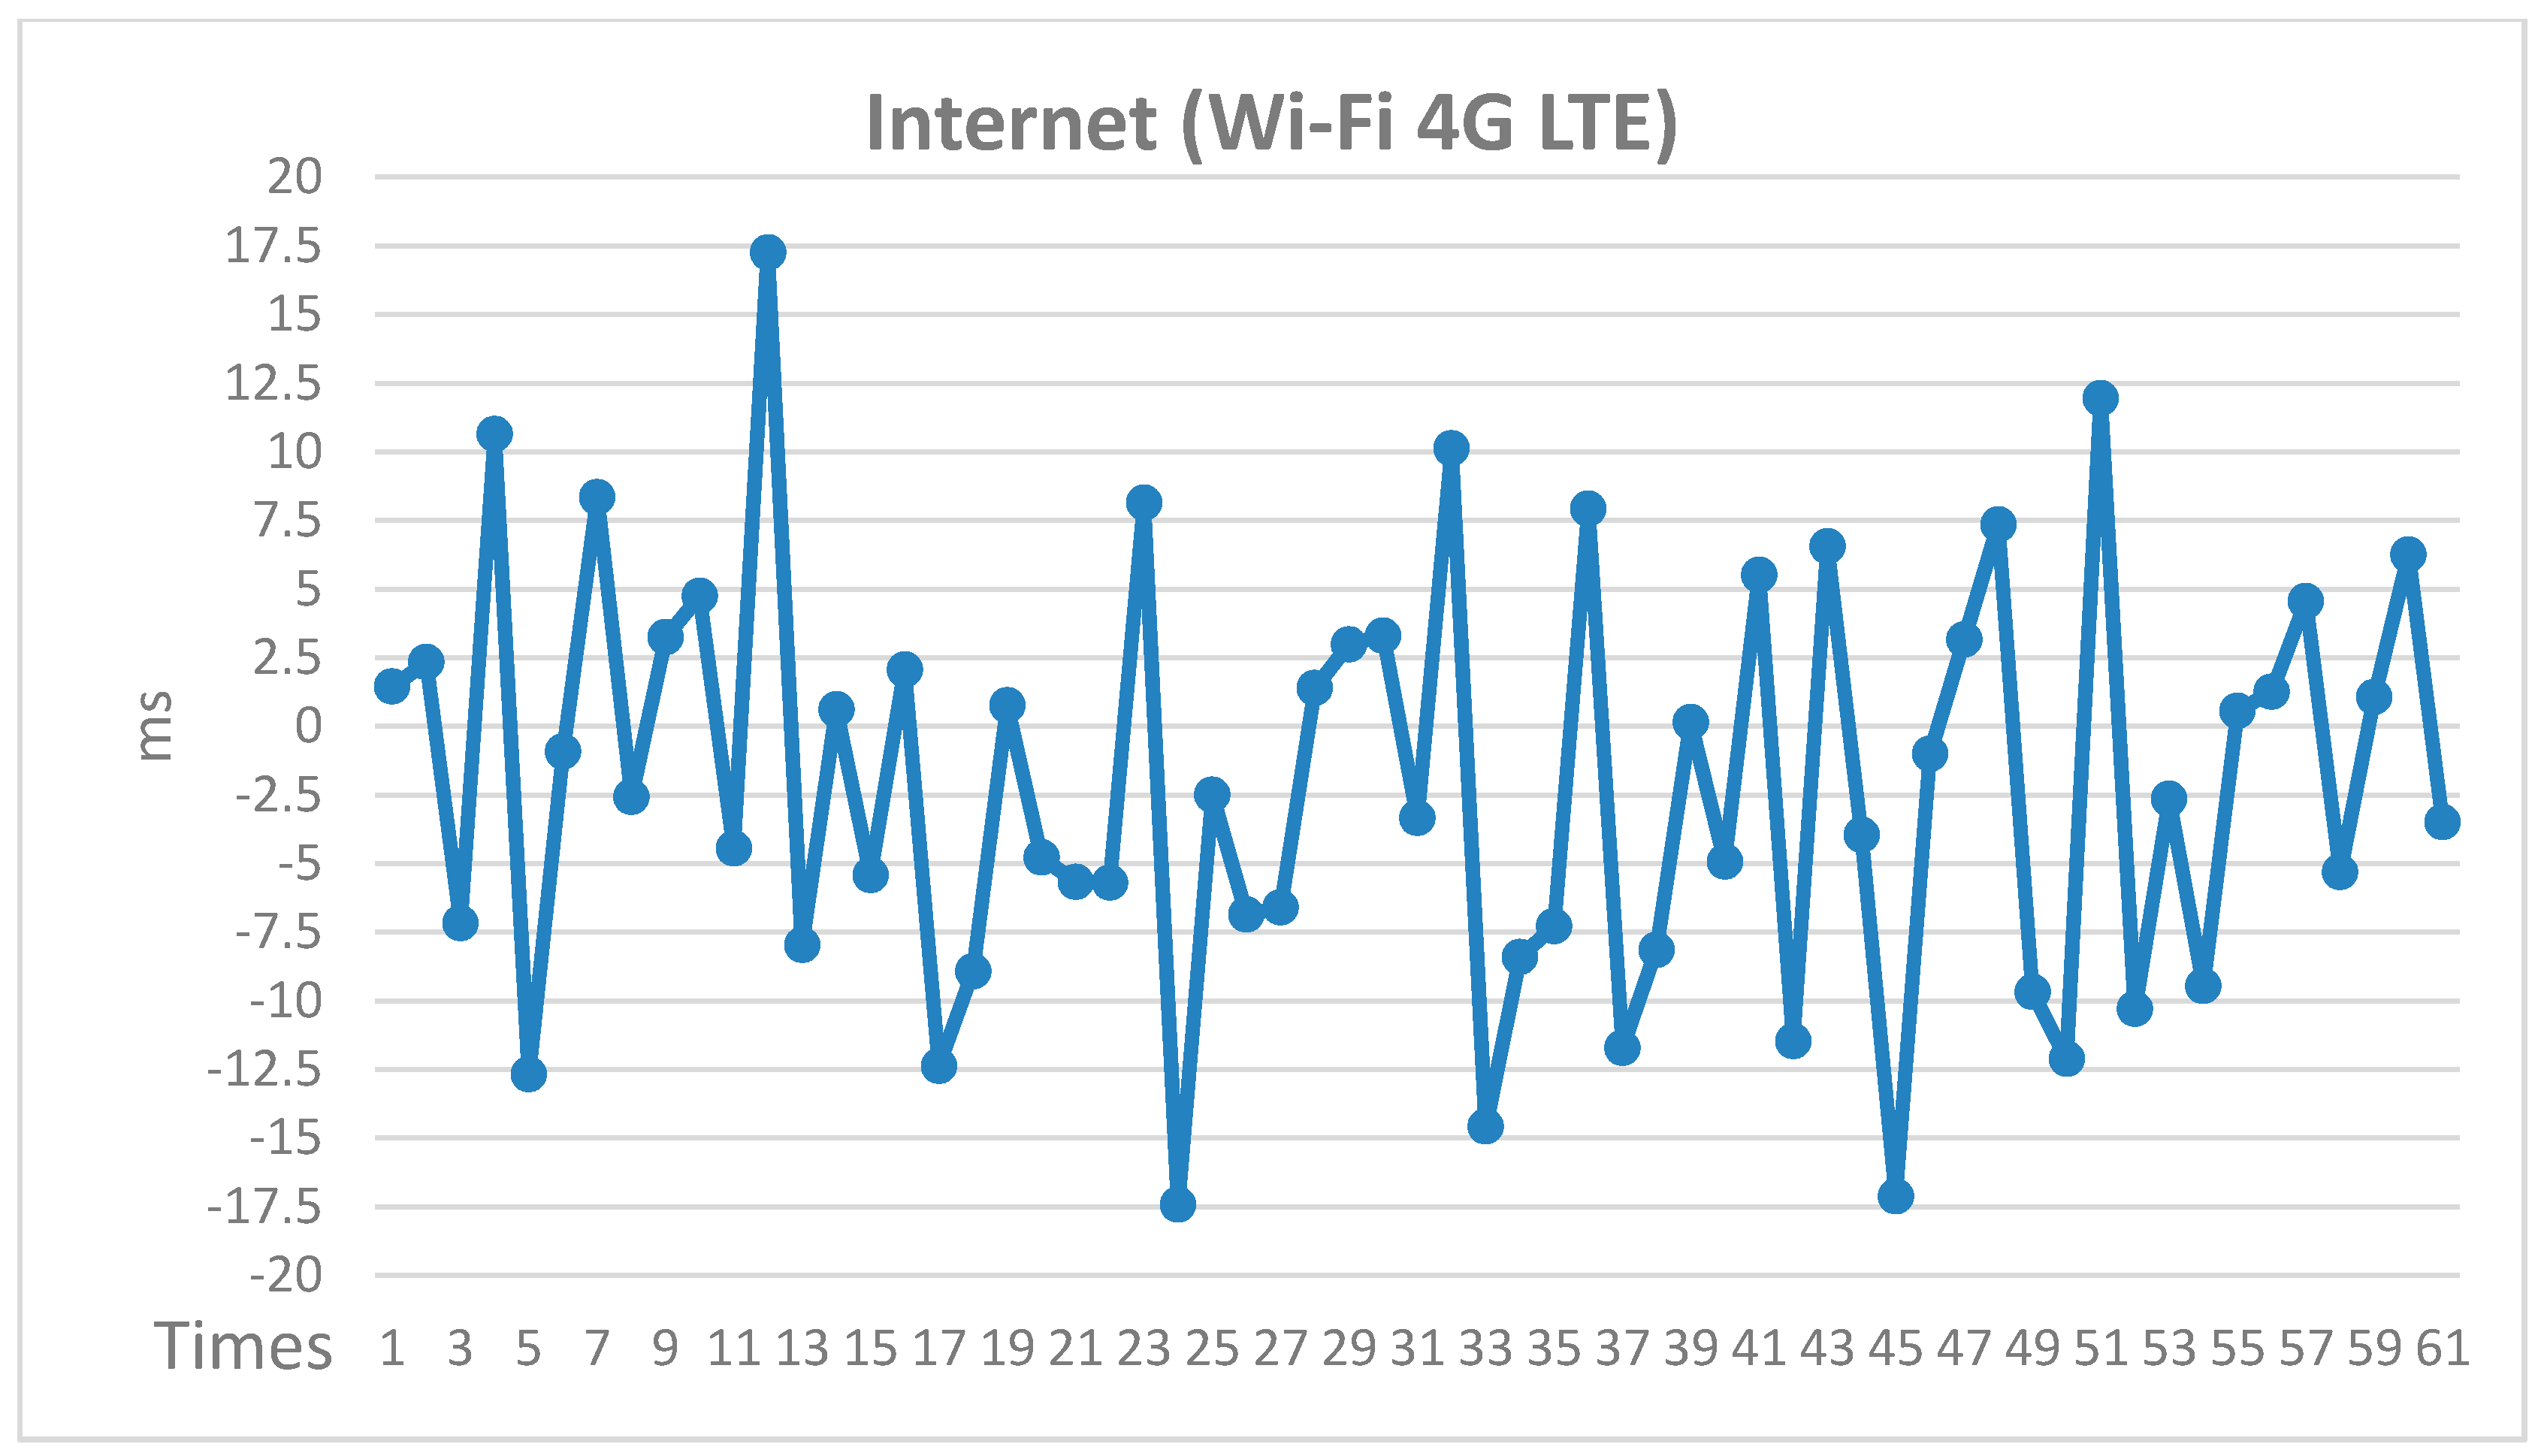
In the preliminary experiment, it was found that, for the network time synchronization, the execution of the Network Time Protocol (NTP) through 4G LTE and Wi-Fi takes up to 21 s [18,19]. Moreover, in the actual connection environment, the maximum offset error in 61 synchronization tests was ±17.5 ms, as shown in Figure 6. In order to prevent the GPS signal from being obscured by the environment and not received for a while, the system was designed to not be completely dependent on the GPS time signal. Instead, it uses a synchronous cycle every 10 min to calibrate the timing interference or timing error inside the BLE Receiver. The built-in crystal oscillator of the BLE Receiver, which is made with the Bluetooth chip CSR1010, has an offset error of ±25 ppm according to the specifications [20]. Therefore, after 10 min of operation, the maximum time offset could be ±15 ms, as shown in Equation (1). The correction method for the system provides an I/O trigger every 10 min. After every 10 min of operation, a calibration procedure is performed. The BLE Receiver uses the 10-min trigger signal to correct the internal timer, and then an internal maneuver adjustment is performed. For example, if the 10-min error is +15 ms, the system time will be corrected by −1 ms every 40 s.
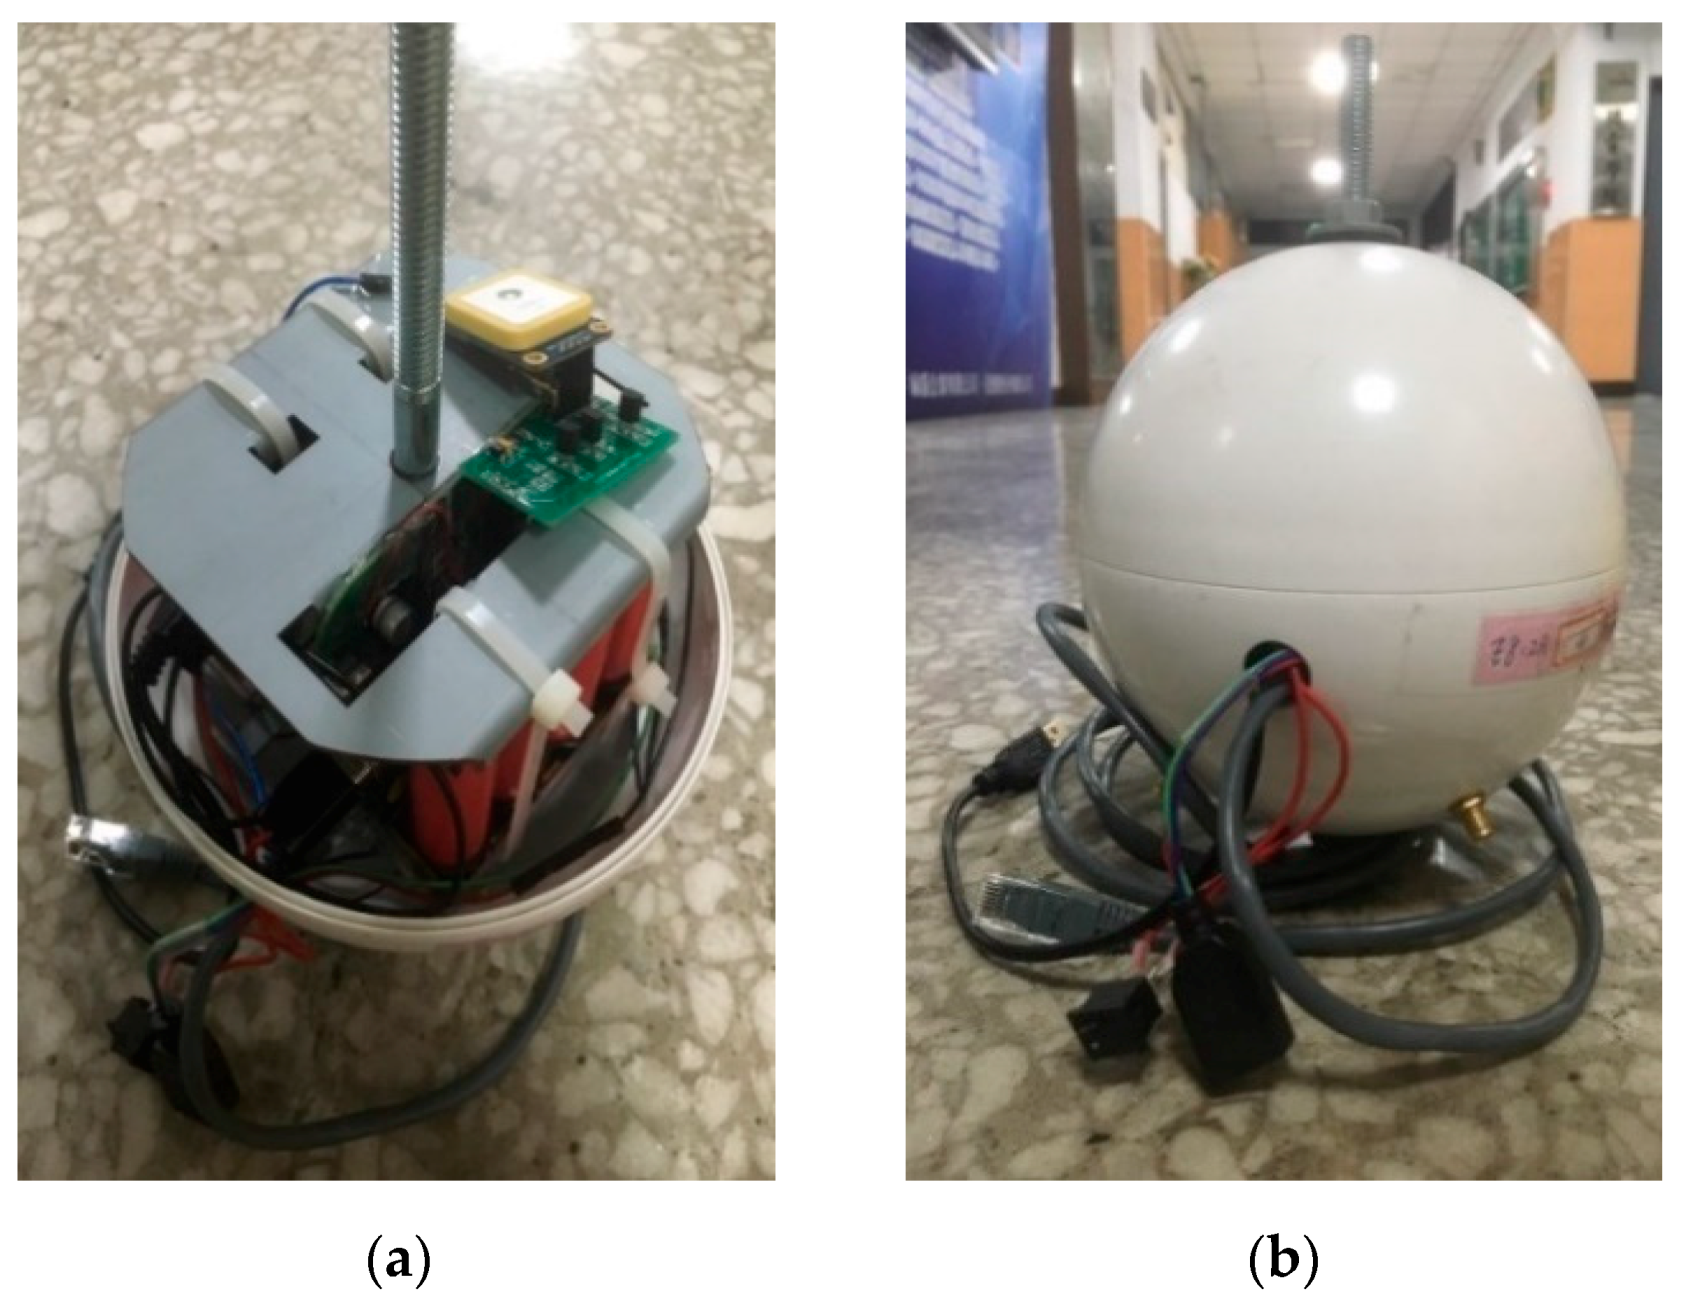
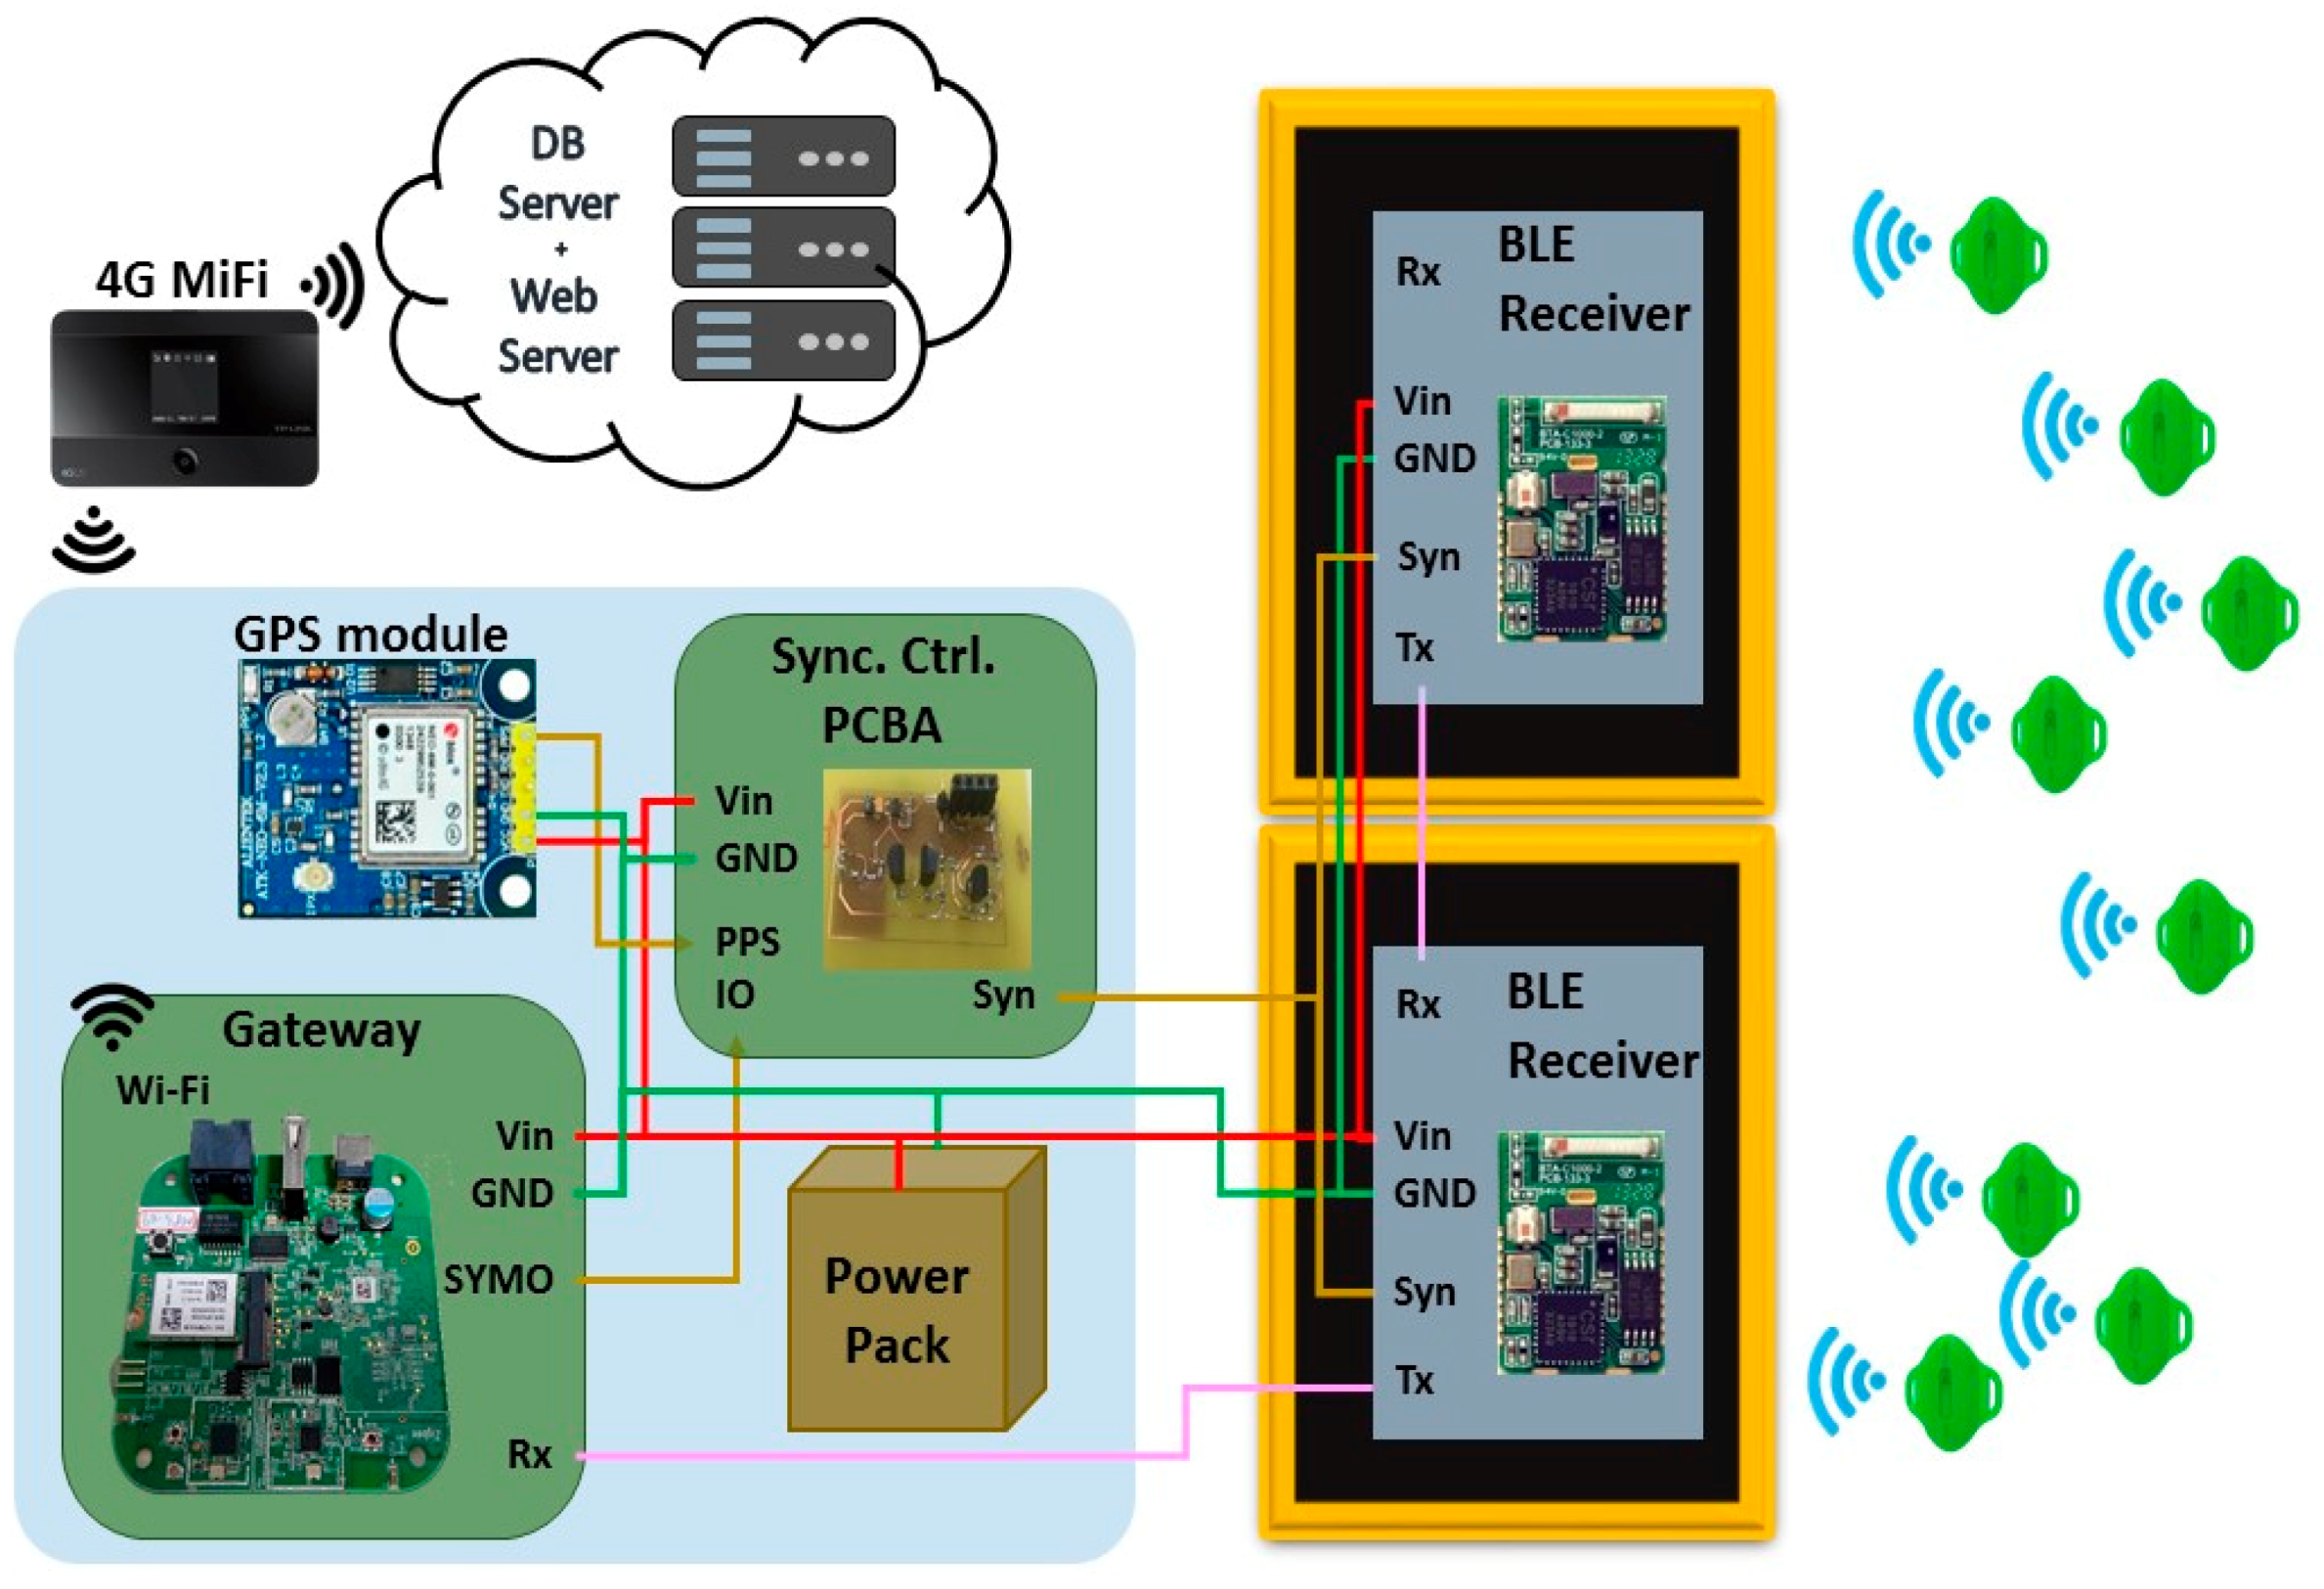
The internal structure and appearance of the Gateway are shown in Figure 7. The structure of the BLE Receiver connected to the Gateway and the GPS is shown in Figure 8. When a BLE Tag is close to the BLE Receiver, the information on the runner who carries the tag will be received by the BLE Receiver. All of the data that the Gateway obtains will be sent out to the 4G LTE by way of a Wi-Fi interface, and will then be sent to the server in the cloud.
The operation instructions of the BLE Receiver, the GPS, and the Gateway are as follows:
- The battery supplies power to the Gateway, the BLE Receiver, and GPS module.
- The gateway starts the NTP synchronization every hour at 9, 19, 29, 39, 49, and 59 min, so that the internal clock error of the Gateway is less than ±200 ms at each of these time points. Figure 6 shows that, in the preliminary experiment, the internal clock error was 17.5 ms.
- The Gateway performs the GPS PPS signal unmasking for 0.7 s every hour at 0, 10, 20, 30, 40, and 50 min and 0.3 s in advance. This allows for the 100 ms GPS PPS signal to appear every 10 min on time and trigger the synchronization function on the serial-connected BLE Receiver via the I/O port.
- The Gateway receives information from the BLE Tags that are carried by runners who pass by the BLE Receiver. When a runner’s signal repeats, the data that exceed the strength threshold are retained, and then are transmitted to the cloud server in a time-series for every 3 s.
- The cloud system includes an Internet of Things (IOT) server by Node.js, a MongoDB database, and a web server by Node.js. Through the Gateway’s network, the IOT server receives the time points and messages of each runner who passes over a fixed-point BLE Receiver in the mat. All of the data are saved in the MongoDB database directly by the IOT server. The web server accesses the same MongoDB database to provide online access to the event’s progress and event-related information [21].
For example, the world record for the 100-m sprint was created by Usain Bolt of Jamaica at 9.58 s at the 2009 World Championships [22]. The average movement speed for 100 ms is 104.38 cm. At the 100-m sprint level, when the runner enters the 3-m detection range of the BLE Receiver, the BLE Receiver receives the time within about 287 ms. According to the record of the 2017 Zurich Barcelona Marathon, the first place finish time was 2 h 8 m 56 s, and the longest finish time was 6 h 28 m 48 s [1]. The marathon’s average speed was 54.54 cm per 100 ms to 18.09 cm per 100 ms. When a runner enters the BLE Receiver’s detection range, the receiver will receive the time within about 546–1664 ms. Therefore, regardless of whether the runner passes the BLE Receiver at the average speed for a 100-m sprint or the average speed for a general marathon, there is ample detection time.
3. Experiment
3.1. The BLE RF Signal and the Transmission and Reception of the Maximum Applicable Frequency
In general, marathon competition times use the “second” as their minimum unit. When a runner wears a BLE Tag and passes a BLE Receiver, the amount and density of the received signal affect the accuracy of the runner’s time. The BLE Tag’s broadcasting interval should be in the range of 20 ms to 10.24 s. The shorter the cycle time, the more power is consumed, but the more precise the time [11] (CS 4.0, Vol 6, p. 59).
A BLE Receiver receives over 7500 broadcast signals in 30 s under no restrictions. A test was performed using eight BLE Tags, with each one broadcasting a signal in a 20-ms period. It was found that there could be 12,000 signals broadcast in 30 s. That is, each BLE Receiver could process 250 complete data packets per second for wireless reception and wired communication to the Gateway.
The BLE Tag used in this experiment was made by CSR1010. Its Bluetooth transmitter had eight levels of power control, from 7 to 0, from 9 dBm to 25 dBm of dynamic change. In the BLE Tag real measurement, the conducted power on the feeding point of the antenna had the following levels: level 7 at 6 dBm; level 6 at 2 dBm; level 5 at −2 dBm; level 4 at −6 dBm, and level 3 at −10 dBm. The different level affects the transmission distance, measured at level 7 at 14 m Max, as well as the successful transmission of data. Transmitter power also indirectly affects the accuracy of passing time. The experimental goal is that when the runner runs through, it will only begin to receive the passing time signal within 3 m of the distance from the BLE Receiver.
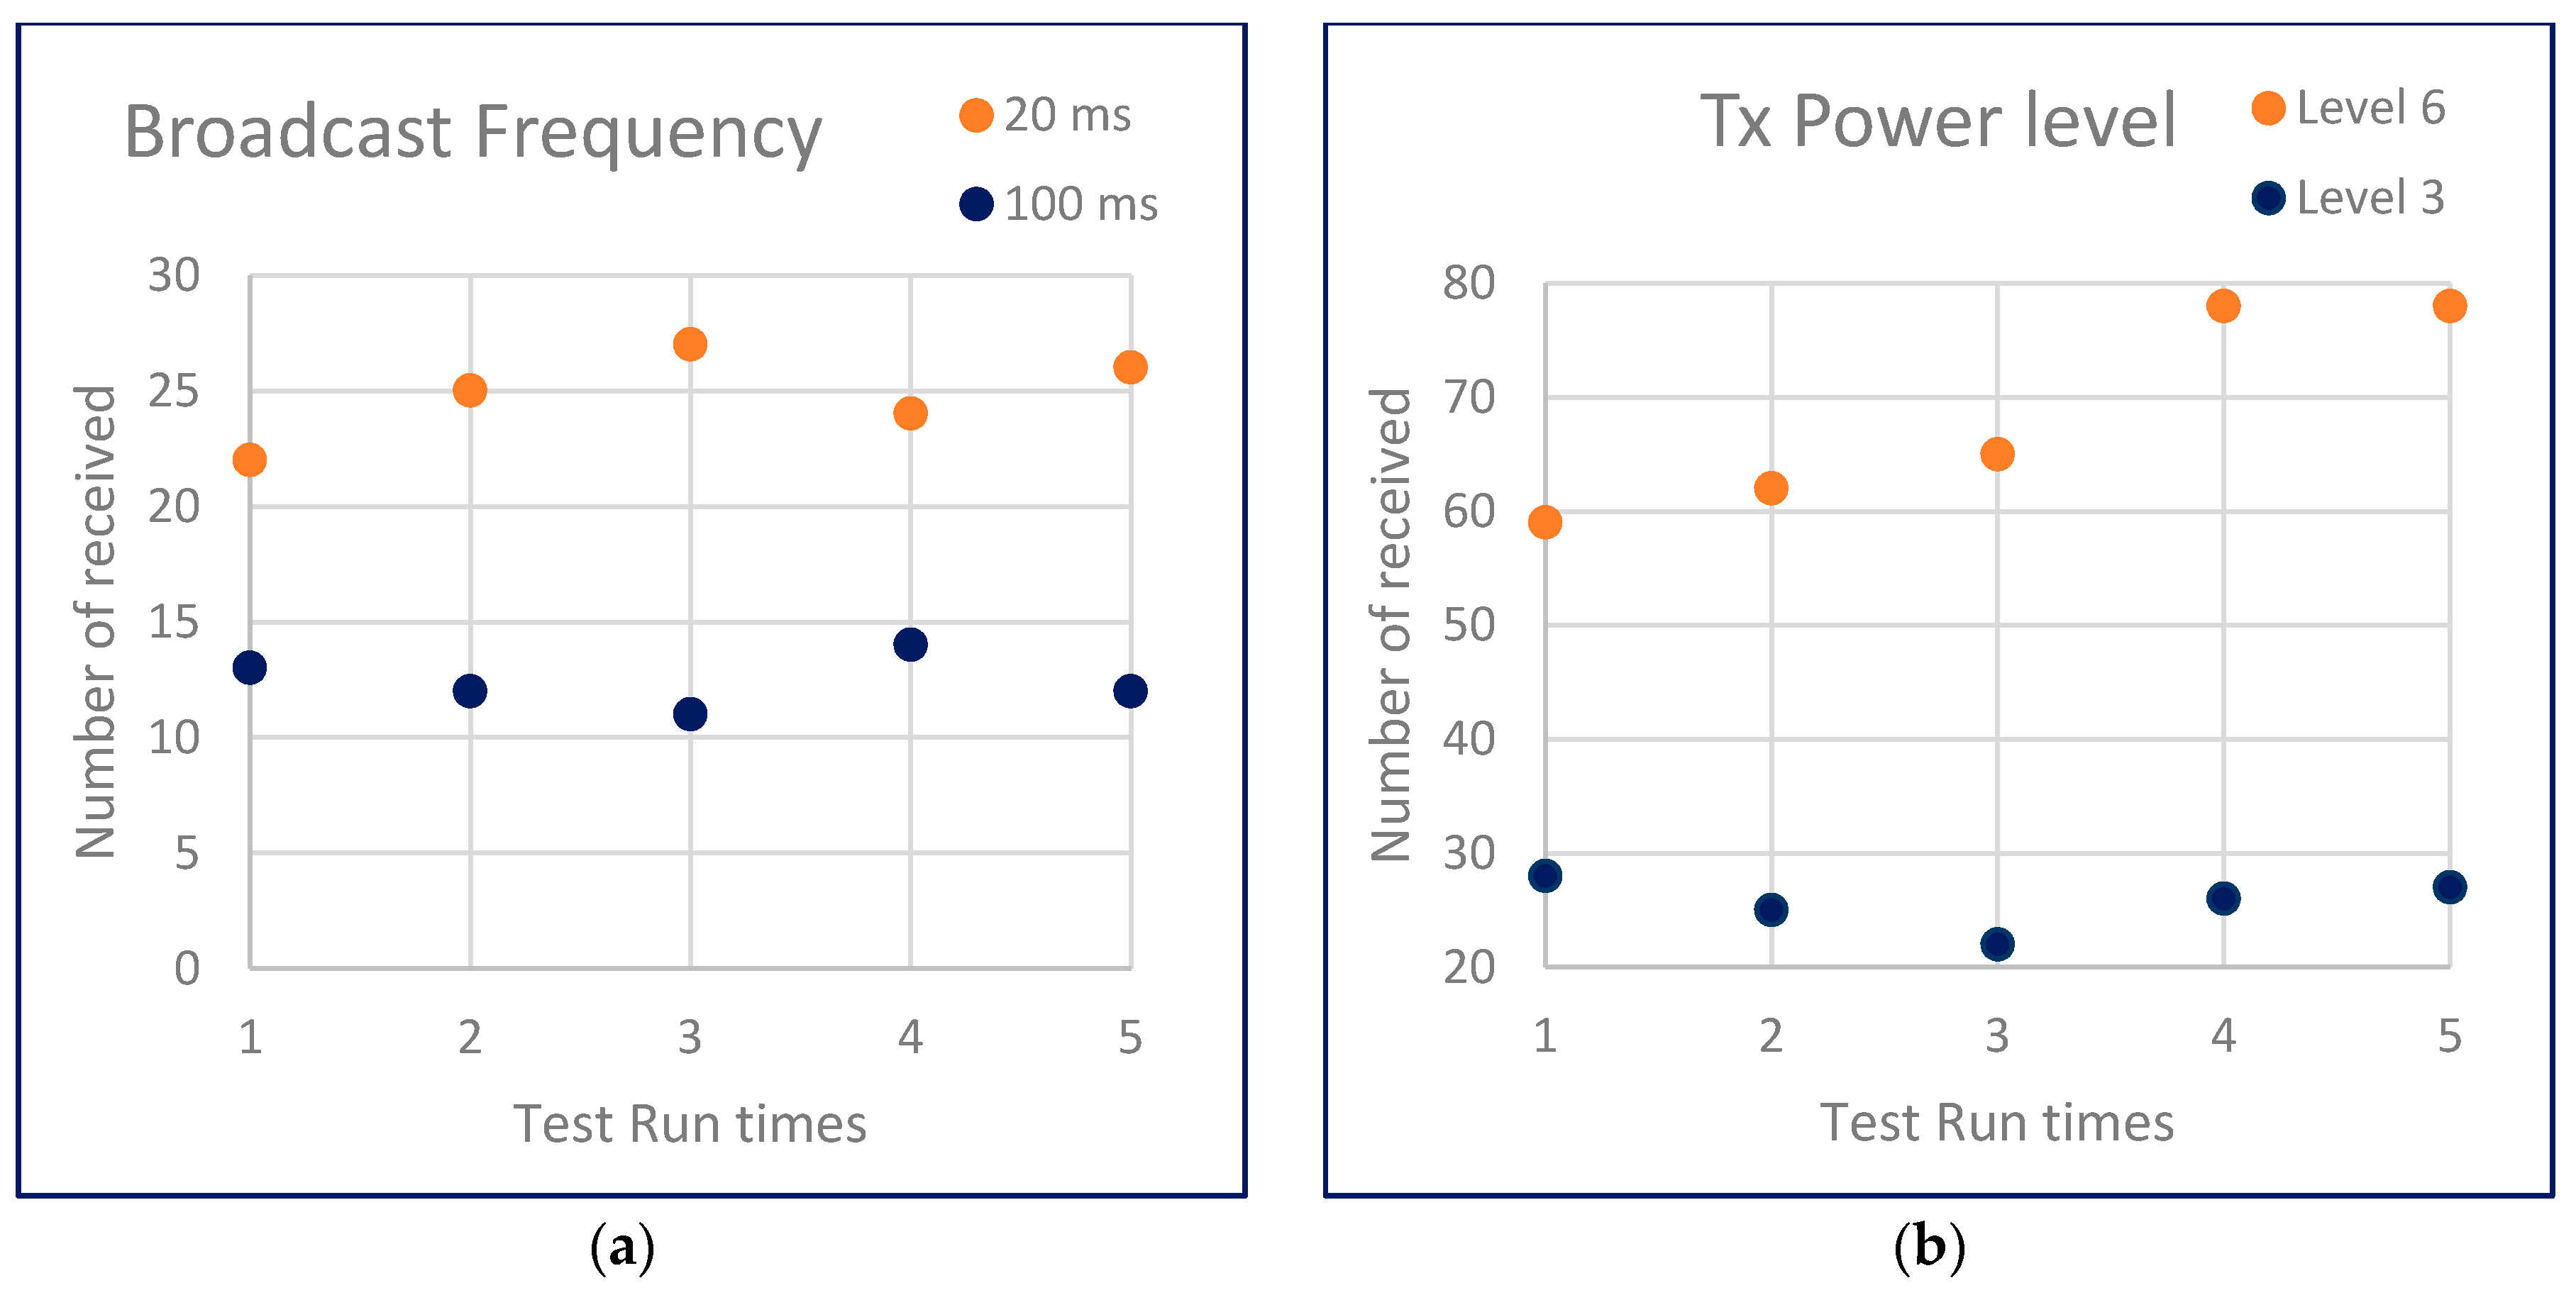
The experiment compares the BLE Tag advertisement periods of 20 ms and 100 ms, transmitting (Tx) Power level 3, and the runner passes the receiver at a speed of 2 m per second. The 20 ms periodic advertisement can receive a sufficient number of signals. As shown in Figure 9a, the average number of received signals every 20 ms is 24.8 and (12.4 every 100 ms). The same experimental test advertisement period is fixed at 20 ms. When the power is set as Level 3 or Level 6, the times at which the target number can be collected are all enough for subsequent recognition. As shown in Figure 9b, the average number of received signals is 25 and 67.8 for Tx power level 3 and 6, respectively.
3.2. BLE RF Signal Strength and BLE Receiver Position Static Relationship Test
Generally, the present city marathon requires the RFID tag to be placed on the chest or instep. Therefore, this experiment compared the RSSI characteristics of the BLE Tag signal on the chest and on the instep. We statistically analyzed and compared the impact of the BLE Tag configuration relationship on the change of the RSSI received by the BLE Receiver, as shown in Figure 10. The test was performed at a horizontal position of Ds from −420 cm to 120 cm and a height of Hs from 0 cm to 30 cm. Each test point records 200 to 600 data sent by four BLE Tags. For higher resolution RSSI, the receiver was CC2640.
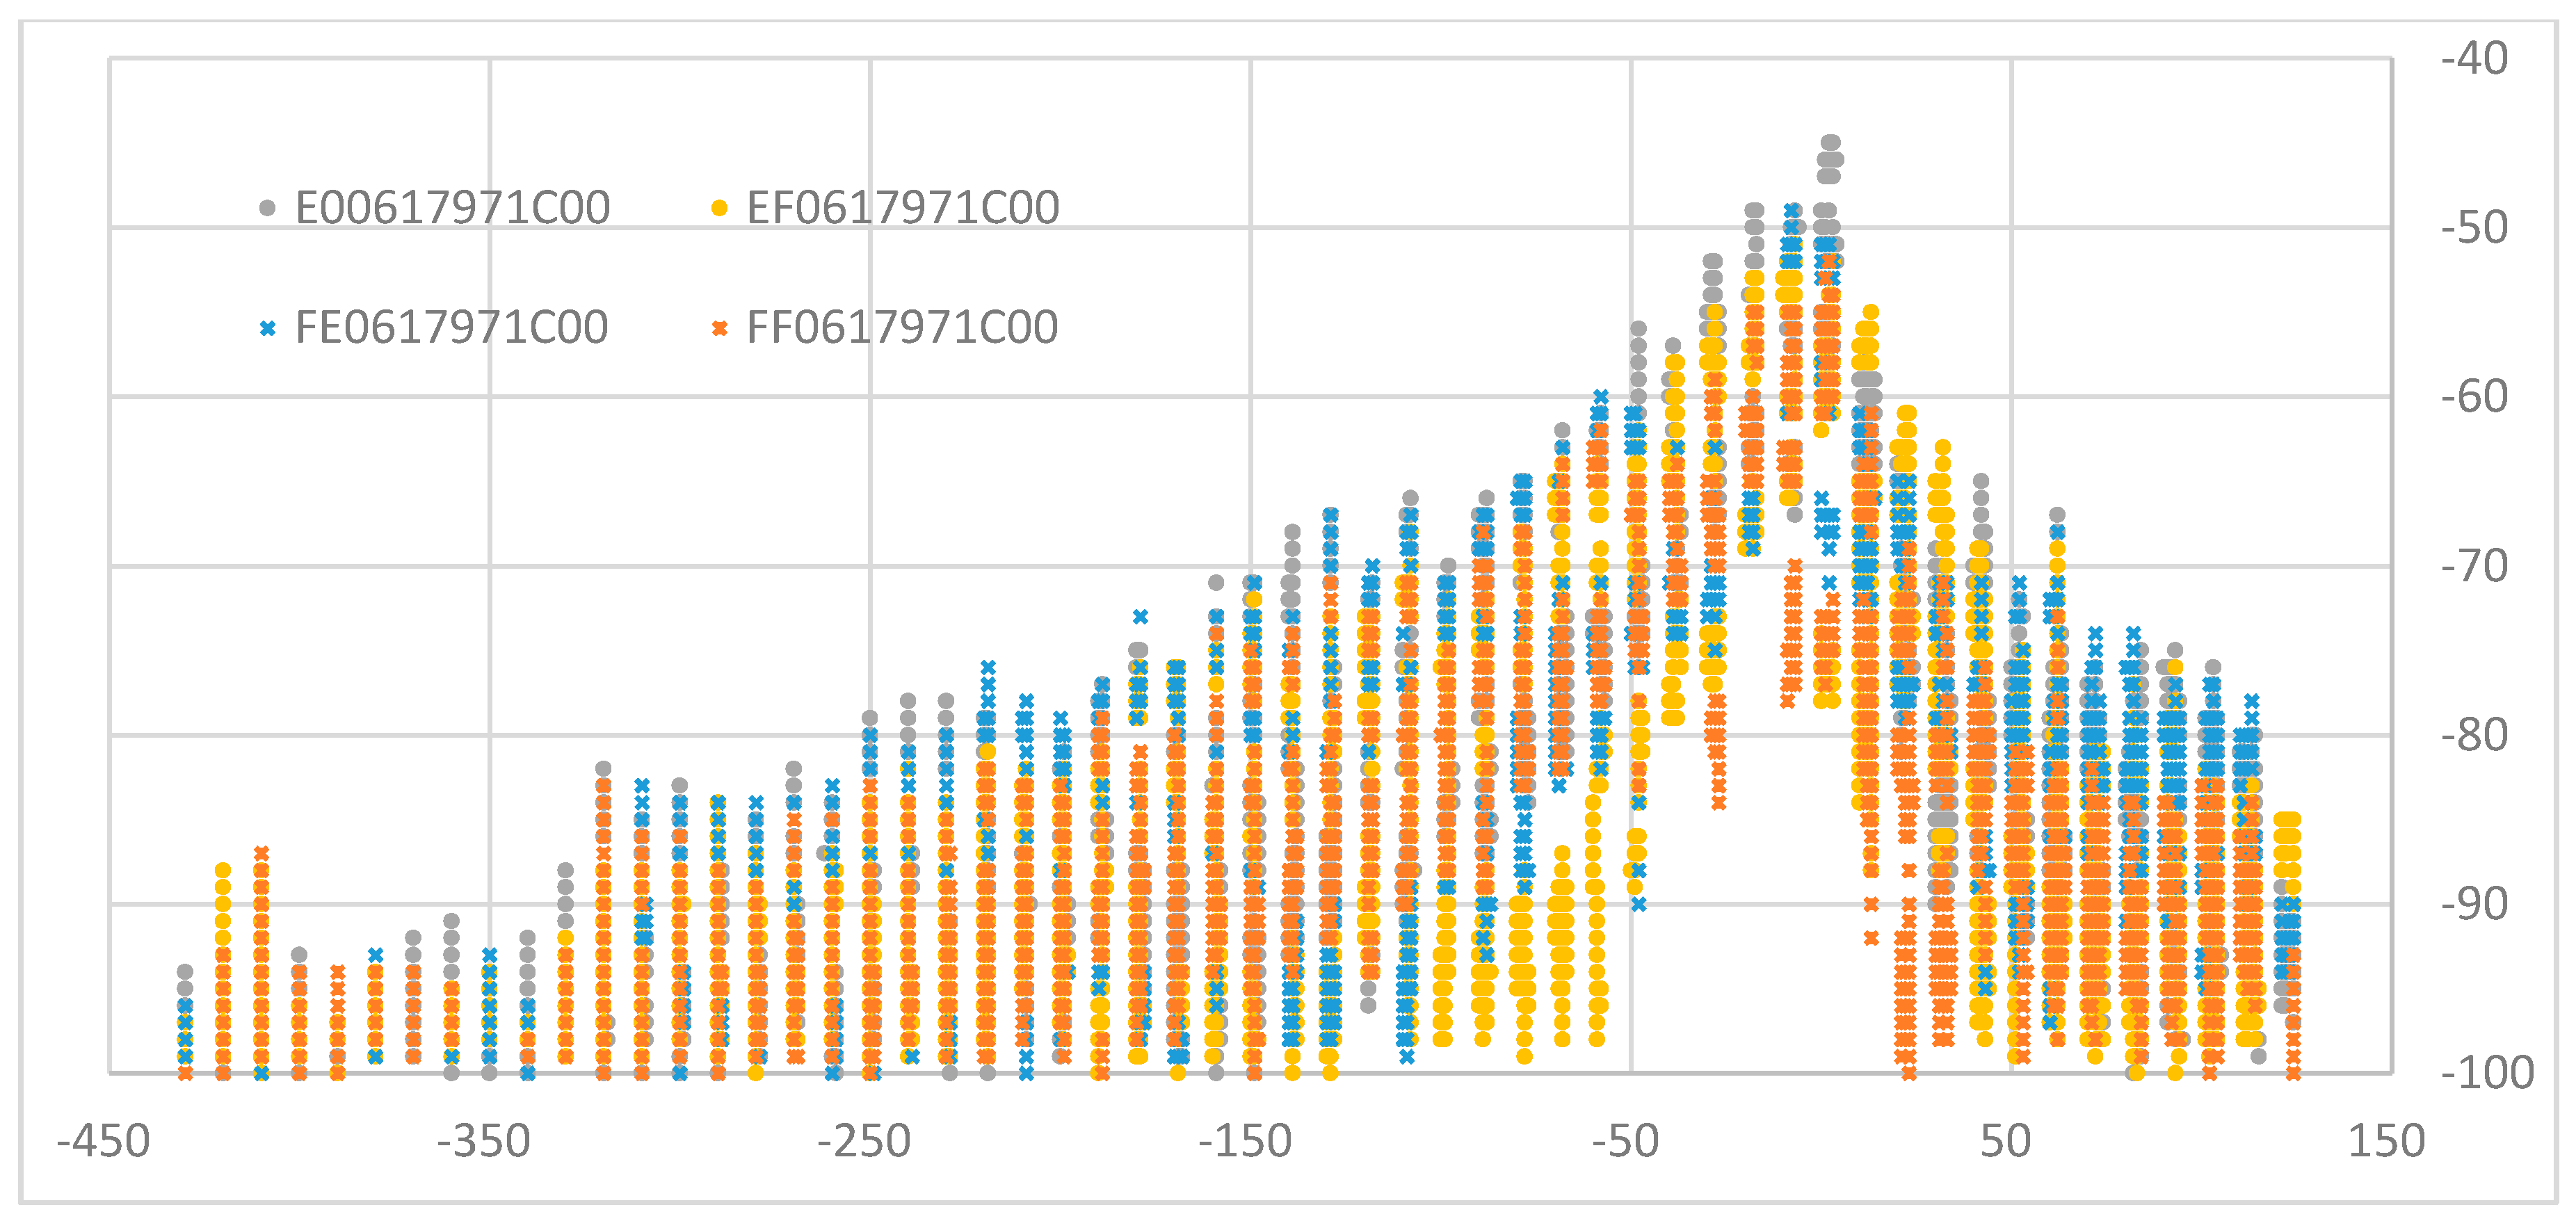
3.2.1. The BLE Receiver Receives the Signal Intensity Variation Distribution According to the BLE Tag Installed on the Instep and the Relative Position Change
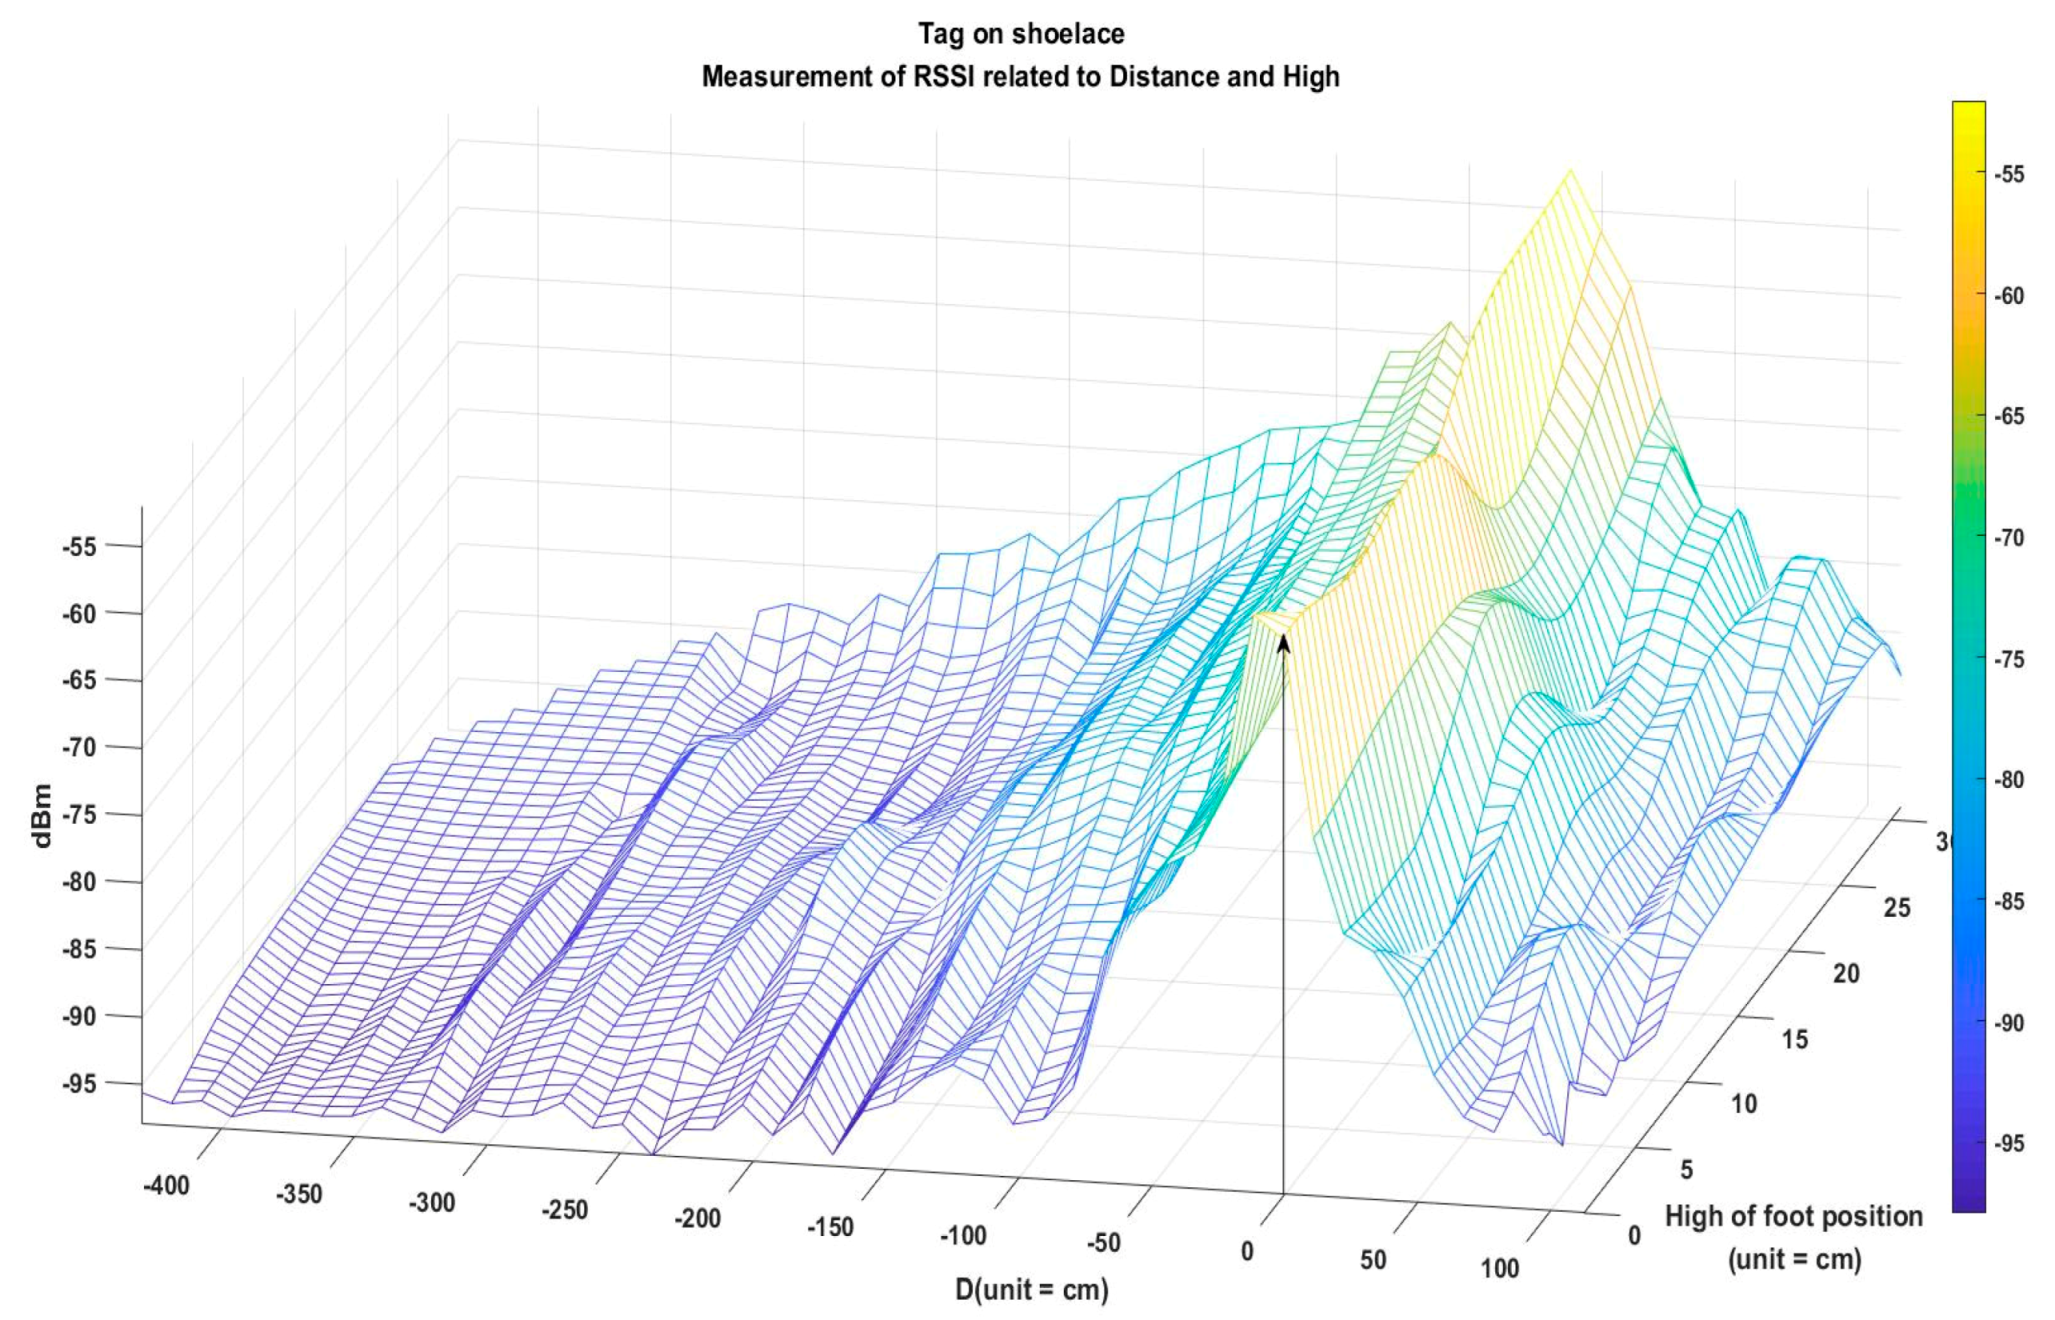
The RSSI intensity trend shows that the closer the BLE Tag is to the BLE Receiver, the stronger the signal when the BLE Tag is on the instep. The RSSI intensity above the BLE Receiver is the strongest. As shown in Figure 11, the received RSSI data at different test points were collected and drawn as a surface by the function griddata (Ds, Hs, RSSI, Xq, Yq, ‘cubic’) in Matlab [23]. This makes it easier to see the trend. The surface of RSSI = f (Ds, Hs) was obtained at each point by experimenting with BLE Tags on the instep. The original data of RSSI vs. location are shown in Figure A2 of Appendix A.
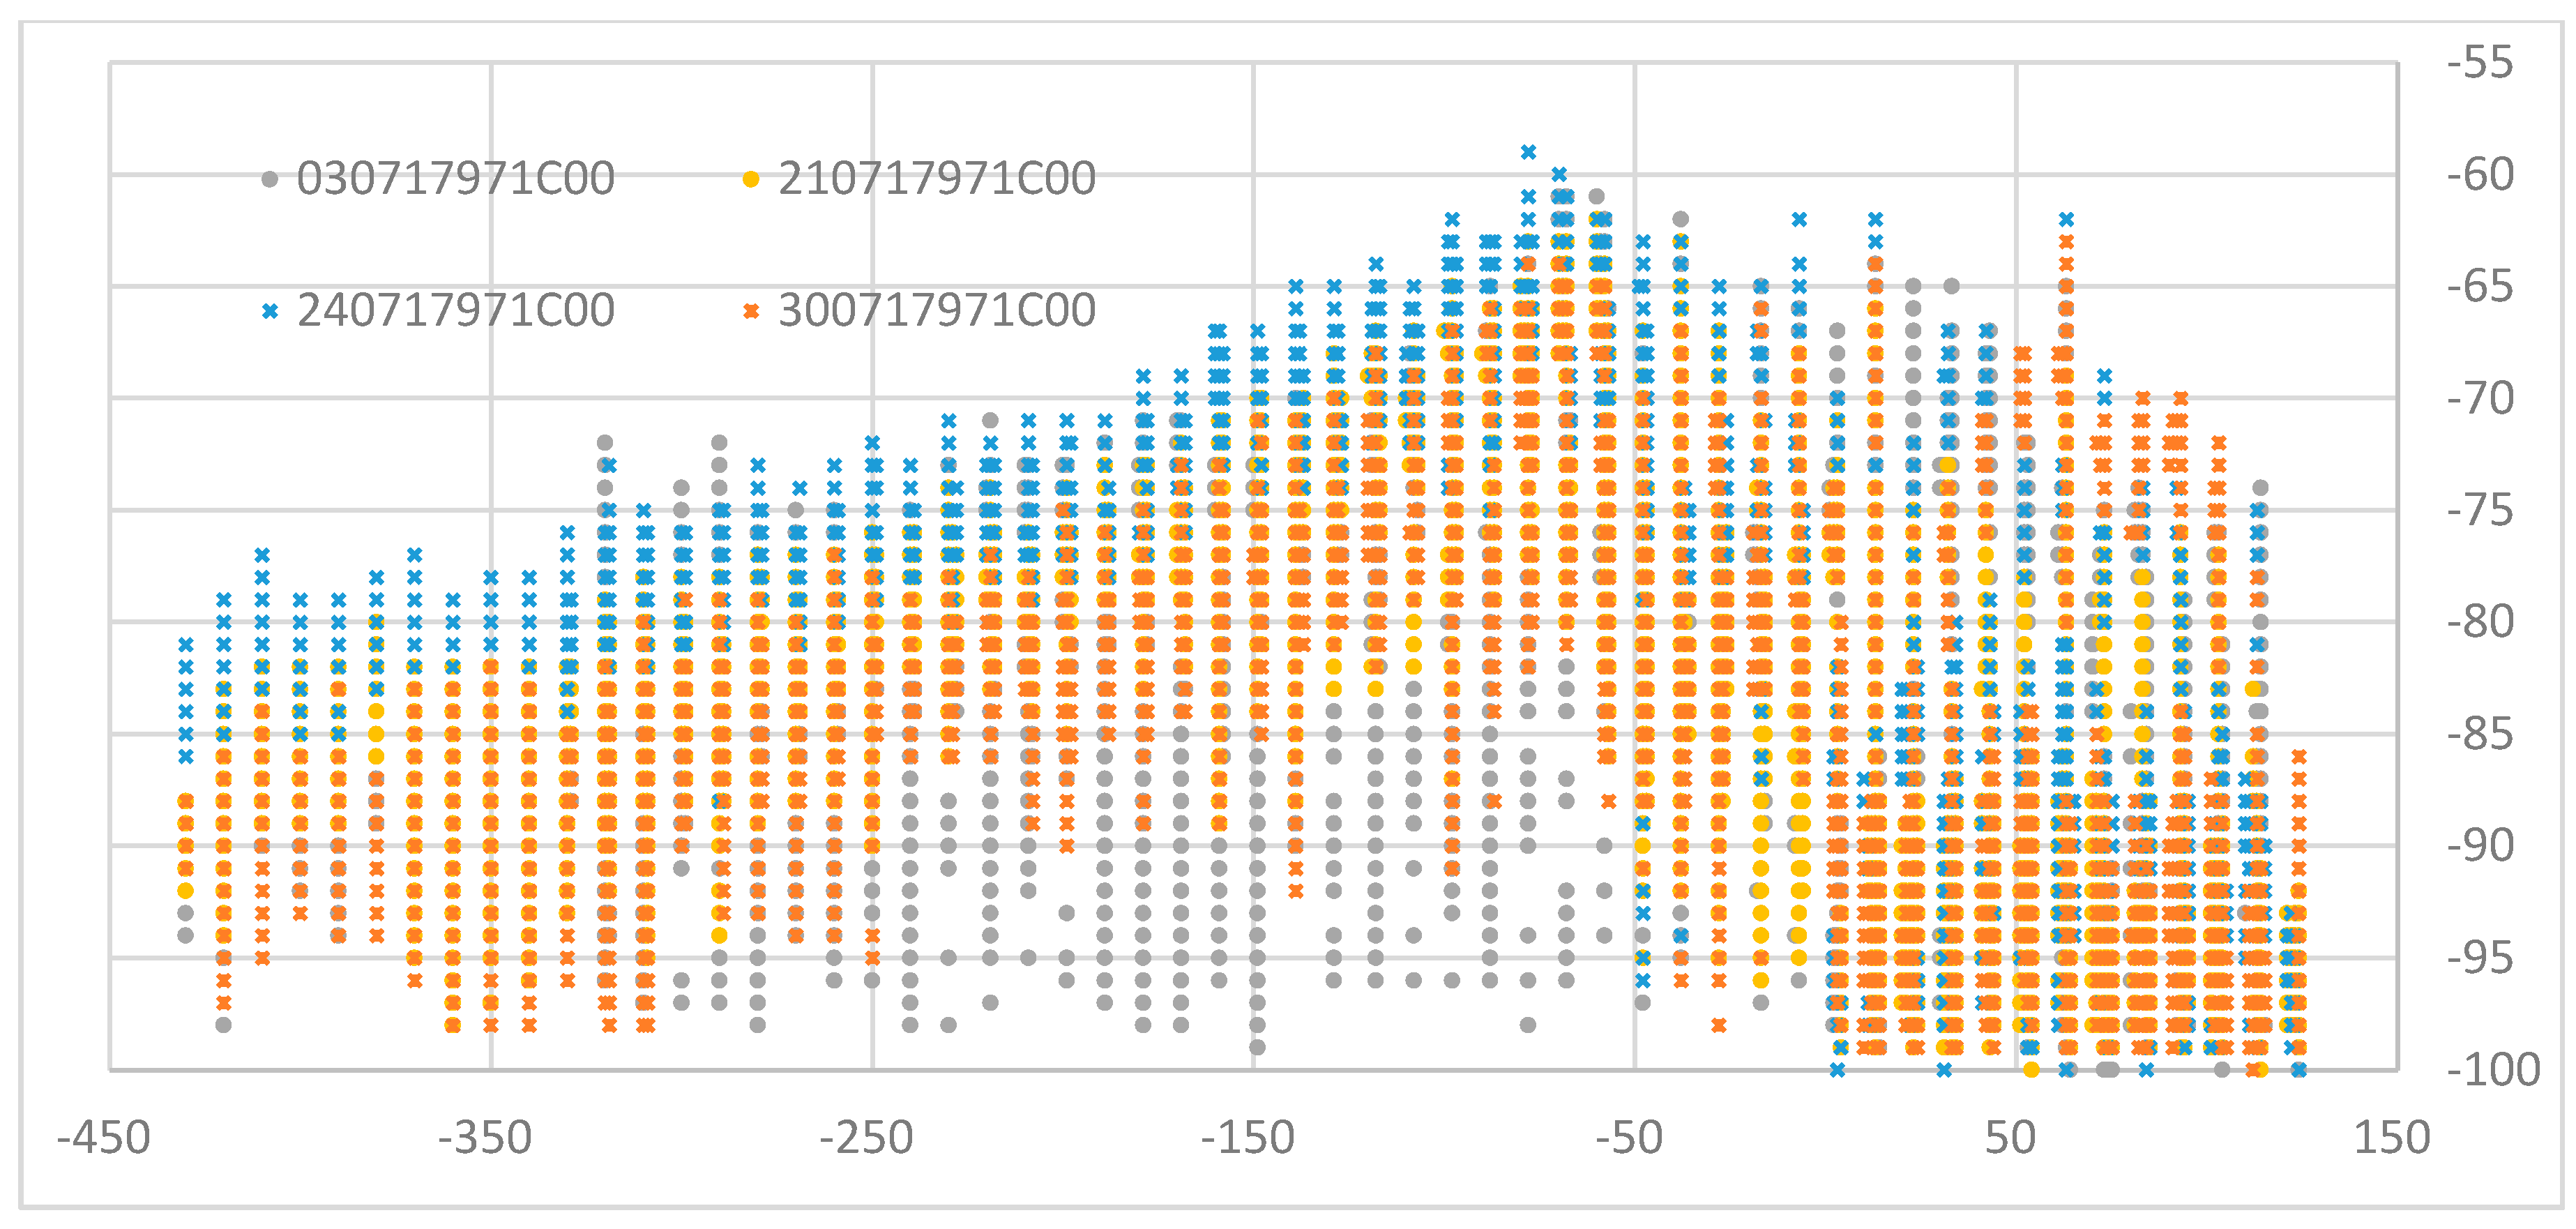
3.2.2. The BLE Receiver Receives the Signal Intensity Variation Distribution According to the BLE Tag Installed on the Chest and the Relative Position Change
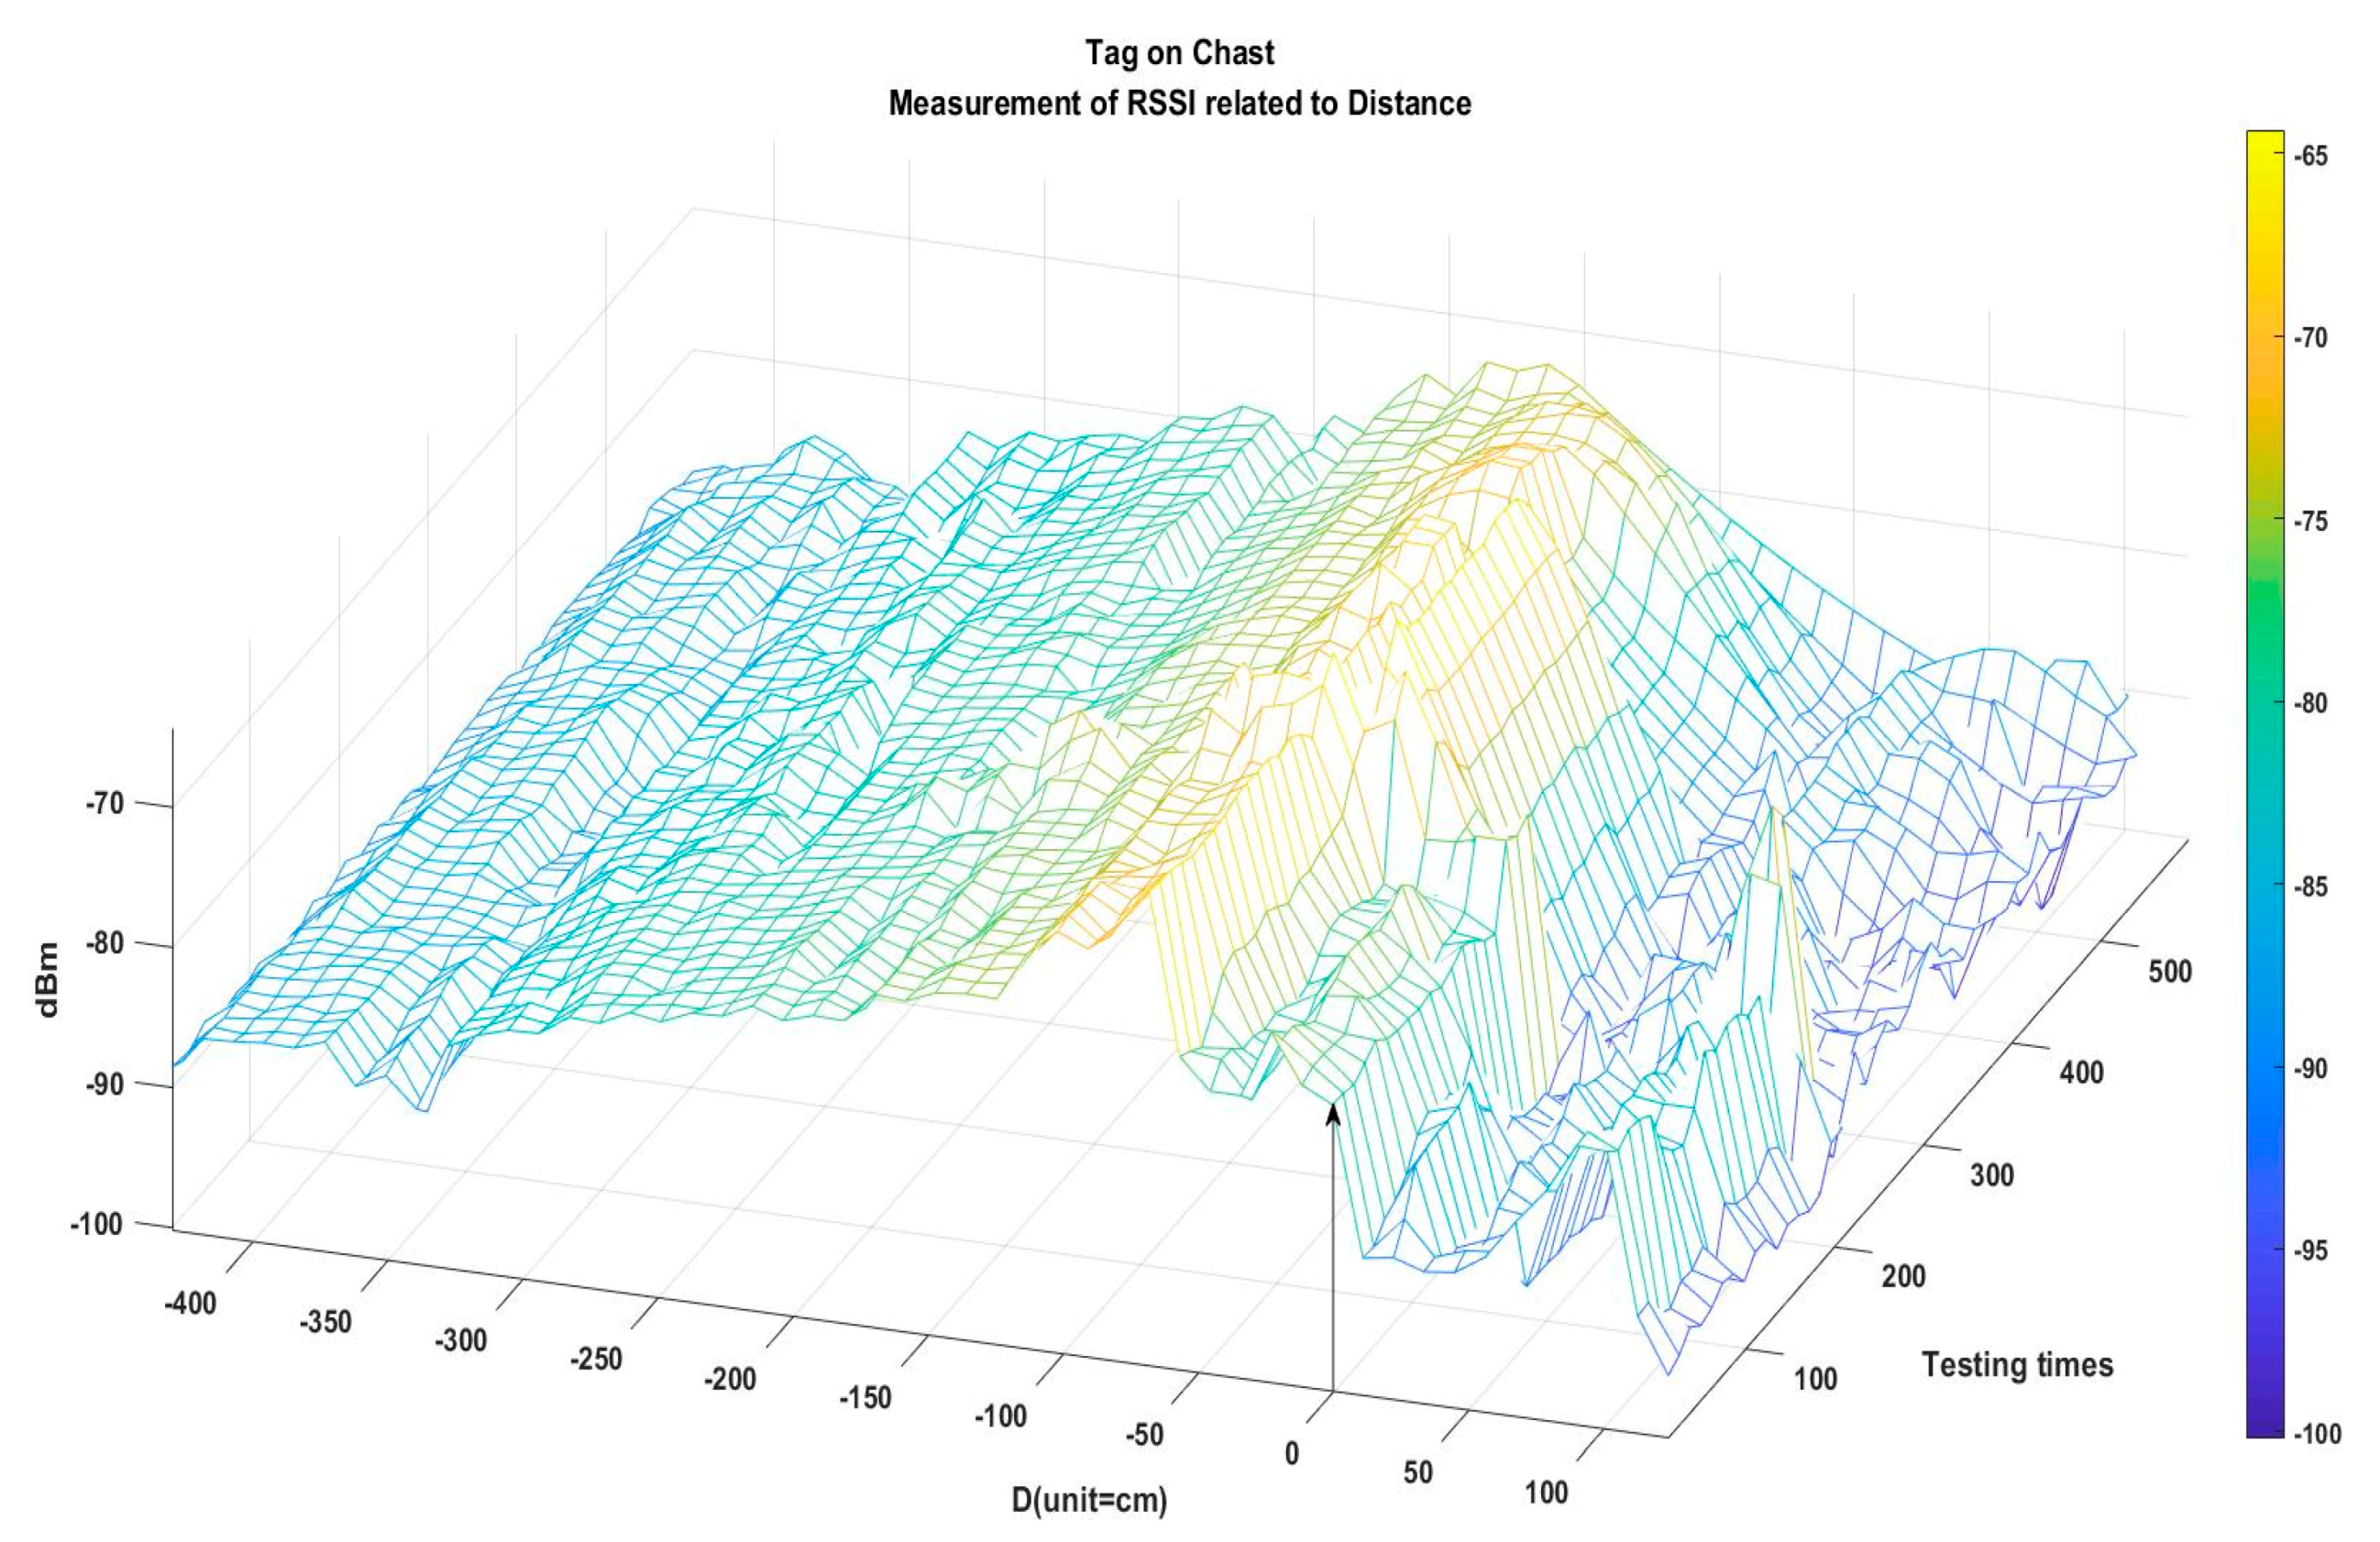
The RSSI shows that the trend is growing in strength. However, when the BLE Tag is placed on the chest, the RSSI signal is strongest in the range of 100 cm to 50 cm in front of the BLE Receiver, not directly above the BLE Receiver. As shown in Figure 12, the surface of RSSI = f (Ds, Hs) was obtained at each point by experimenting with BLE Tags on the chest. The original data of RSSI vs. location are shown in Figure A1 of Appendix A.
According to the intensity convergence relationship, the analysis static experiment results show that the BLE Tag is better placed on the instep than on the chest due to strong human body absorption of 2.4 GHz microwave signal. In the case of the BLE Tag placed on the chest, a strong trend is in the range of about 100 cm to 50 cm in advance. In the case of the BLE Tag placed on the instep, the average signal strength trend and the front–rear distance relationship are more influential than the height of the foot.
3.3. Confirm the Time Difference between the BLE Receiver’s Decision and the Runner’s Passing Time
In order to further clarify the time relationship between the real time-received RSSI and runner position when the runner runs through the BLE Receiver, a dynamic experiment was performed. The experiment related to the BLE Tag was divided into chest configuration and instep configuration. The BLE Tag signal advertisement period was 20 ms, and its Tx power was controlled at Level 3 to 5, allowing the reading distance to fall within 3 m. The BLE Receiver determines the runner passing time based on the last un-attenuated RSSI receipt time. All data with RSSI and timestamp were sent from the BLE Receiver through UART to USB bridge IC by way of the USB interface to a notebook computer. The experiment using a high-speed camera captures the runner’s moving position and all related data with RSSI and timestamp; these data were shown on the notebook computer in real time. Using the high-speed camera, the video is captured at a speed of 120 frames per second. In general, the forward movement of the runner is at a distance of 2 cm to 5 cm between each frame of the video. Then, the error amount of the actual passing time point and the BLE Receiver determined the timestamp point to be analyzed.
3.3.1. The BLE Tag Is Mounted in the Chest Position—Analysis of the Timing Error between the Time of Runner Crossing the BLE Receiver and the Timestamp by Signal Strength
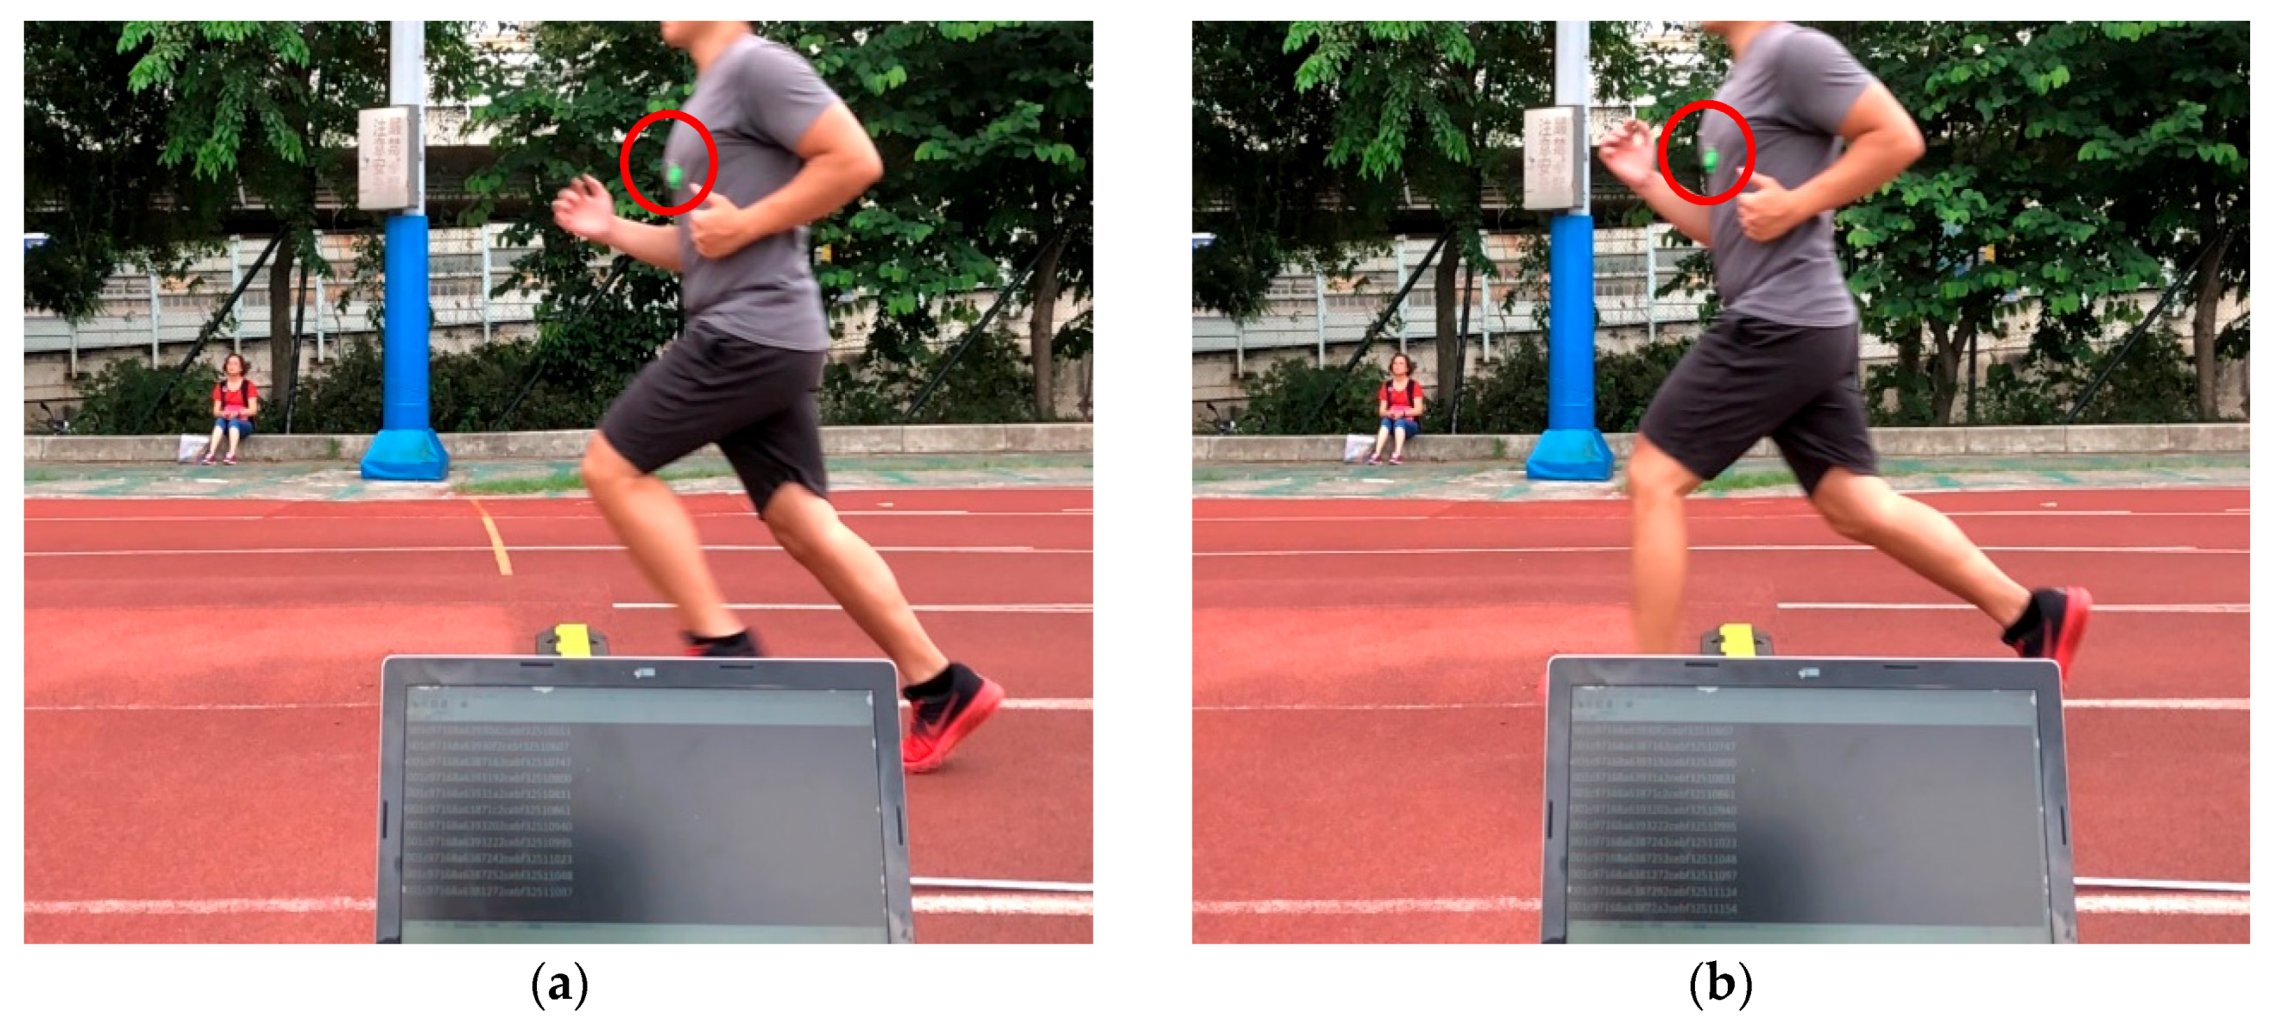
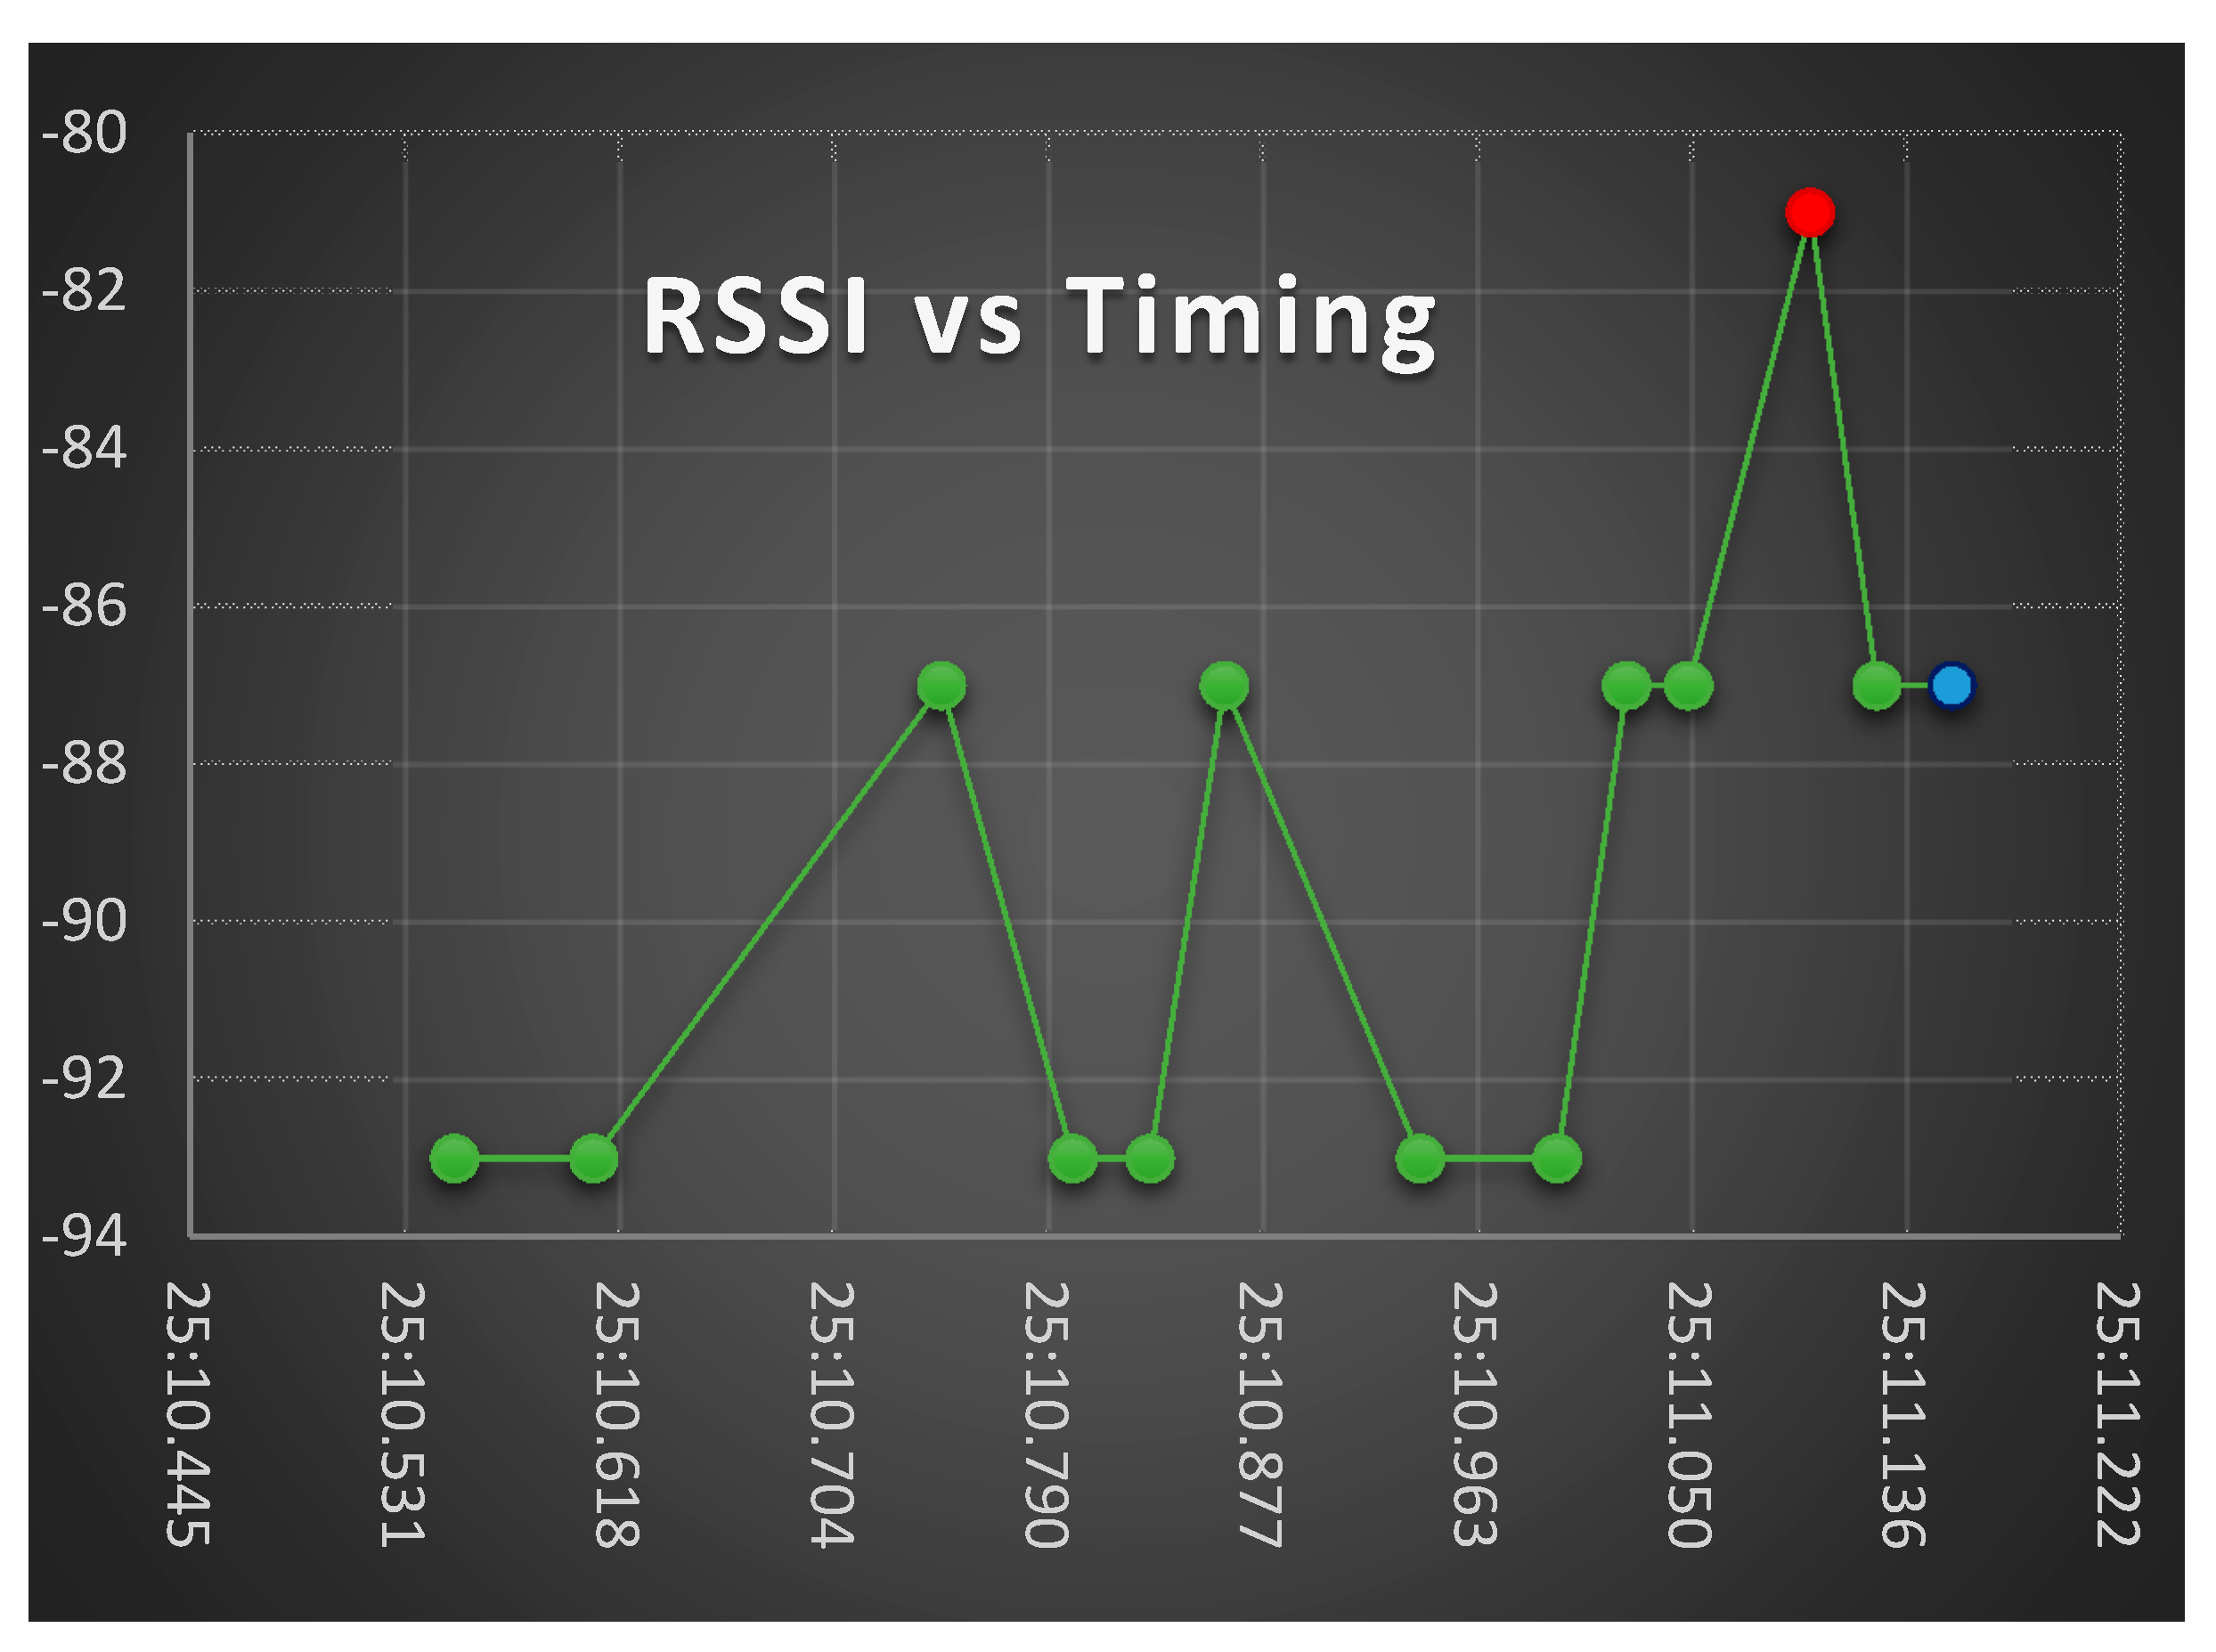
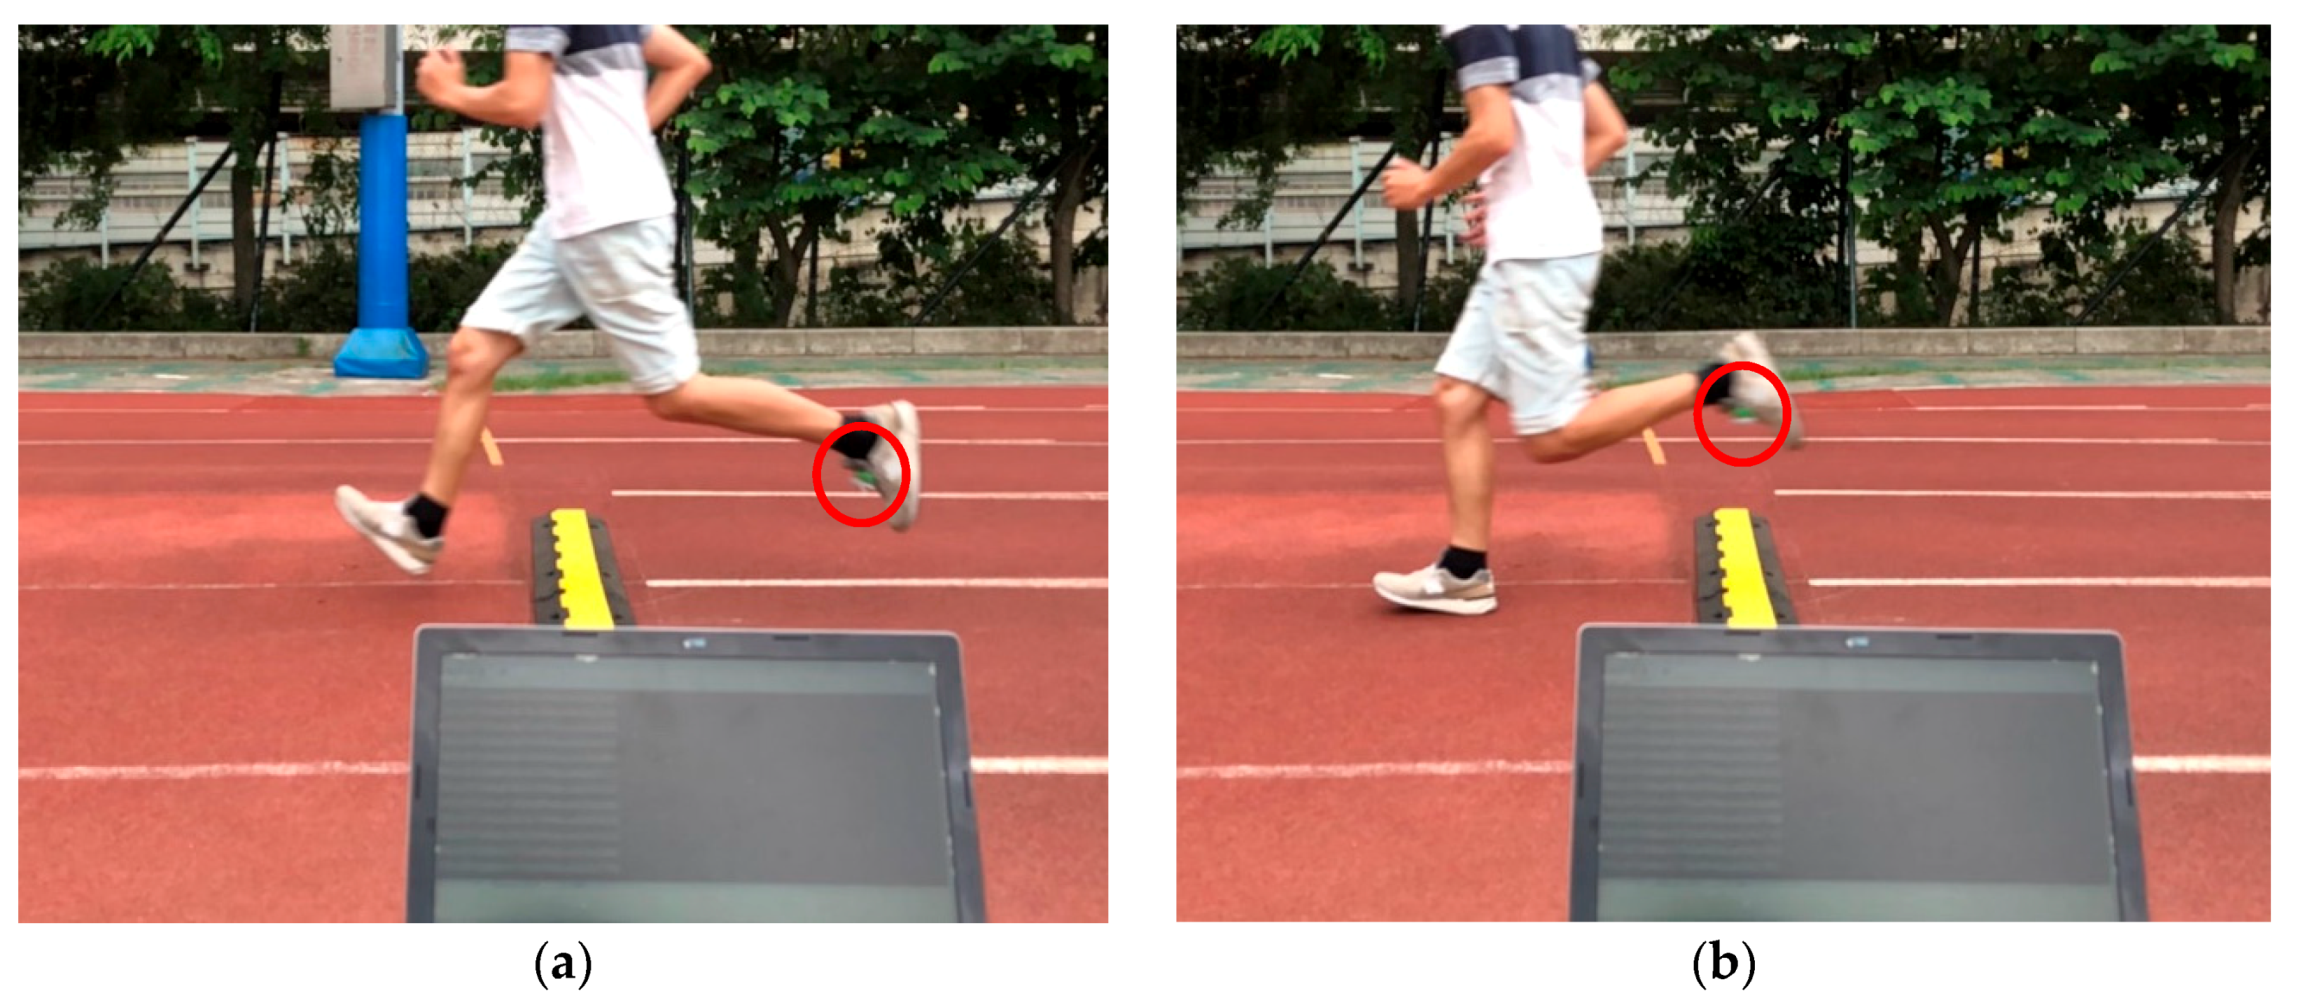
Table 1 summarizes the data in one running test of the dynamic experiment in which the BLE Tag was worn on the chest of the runner. The runner’s position was captured by a high-speed camera, along with the RSSI signal received by the BLE receiver in real time. The BLE Receiver sets the last RSSI non-attenuated signal and related timestamp as each running test result in the dynamic experiment. The message in red text shows the information related to the RSSI, set by the BLE Receiver, as shown in Figure 13a. The message in blue text shows the information related to the runner passing at the top of the mat confirmed by the high-speed camera, as shown in Figure 13b. The timing error can be obtained by the time difference between the red text and the blue text.
3.3.2. The BLE Tag Is Mounted on the Instep Position—Analysis of the Timing Error between the Time of Runner Crossing the BLE Receiver and the Timestamp by Signal Strength
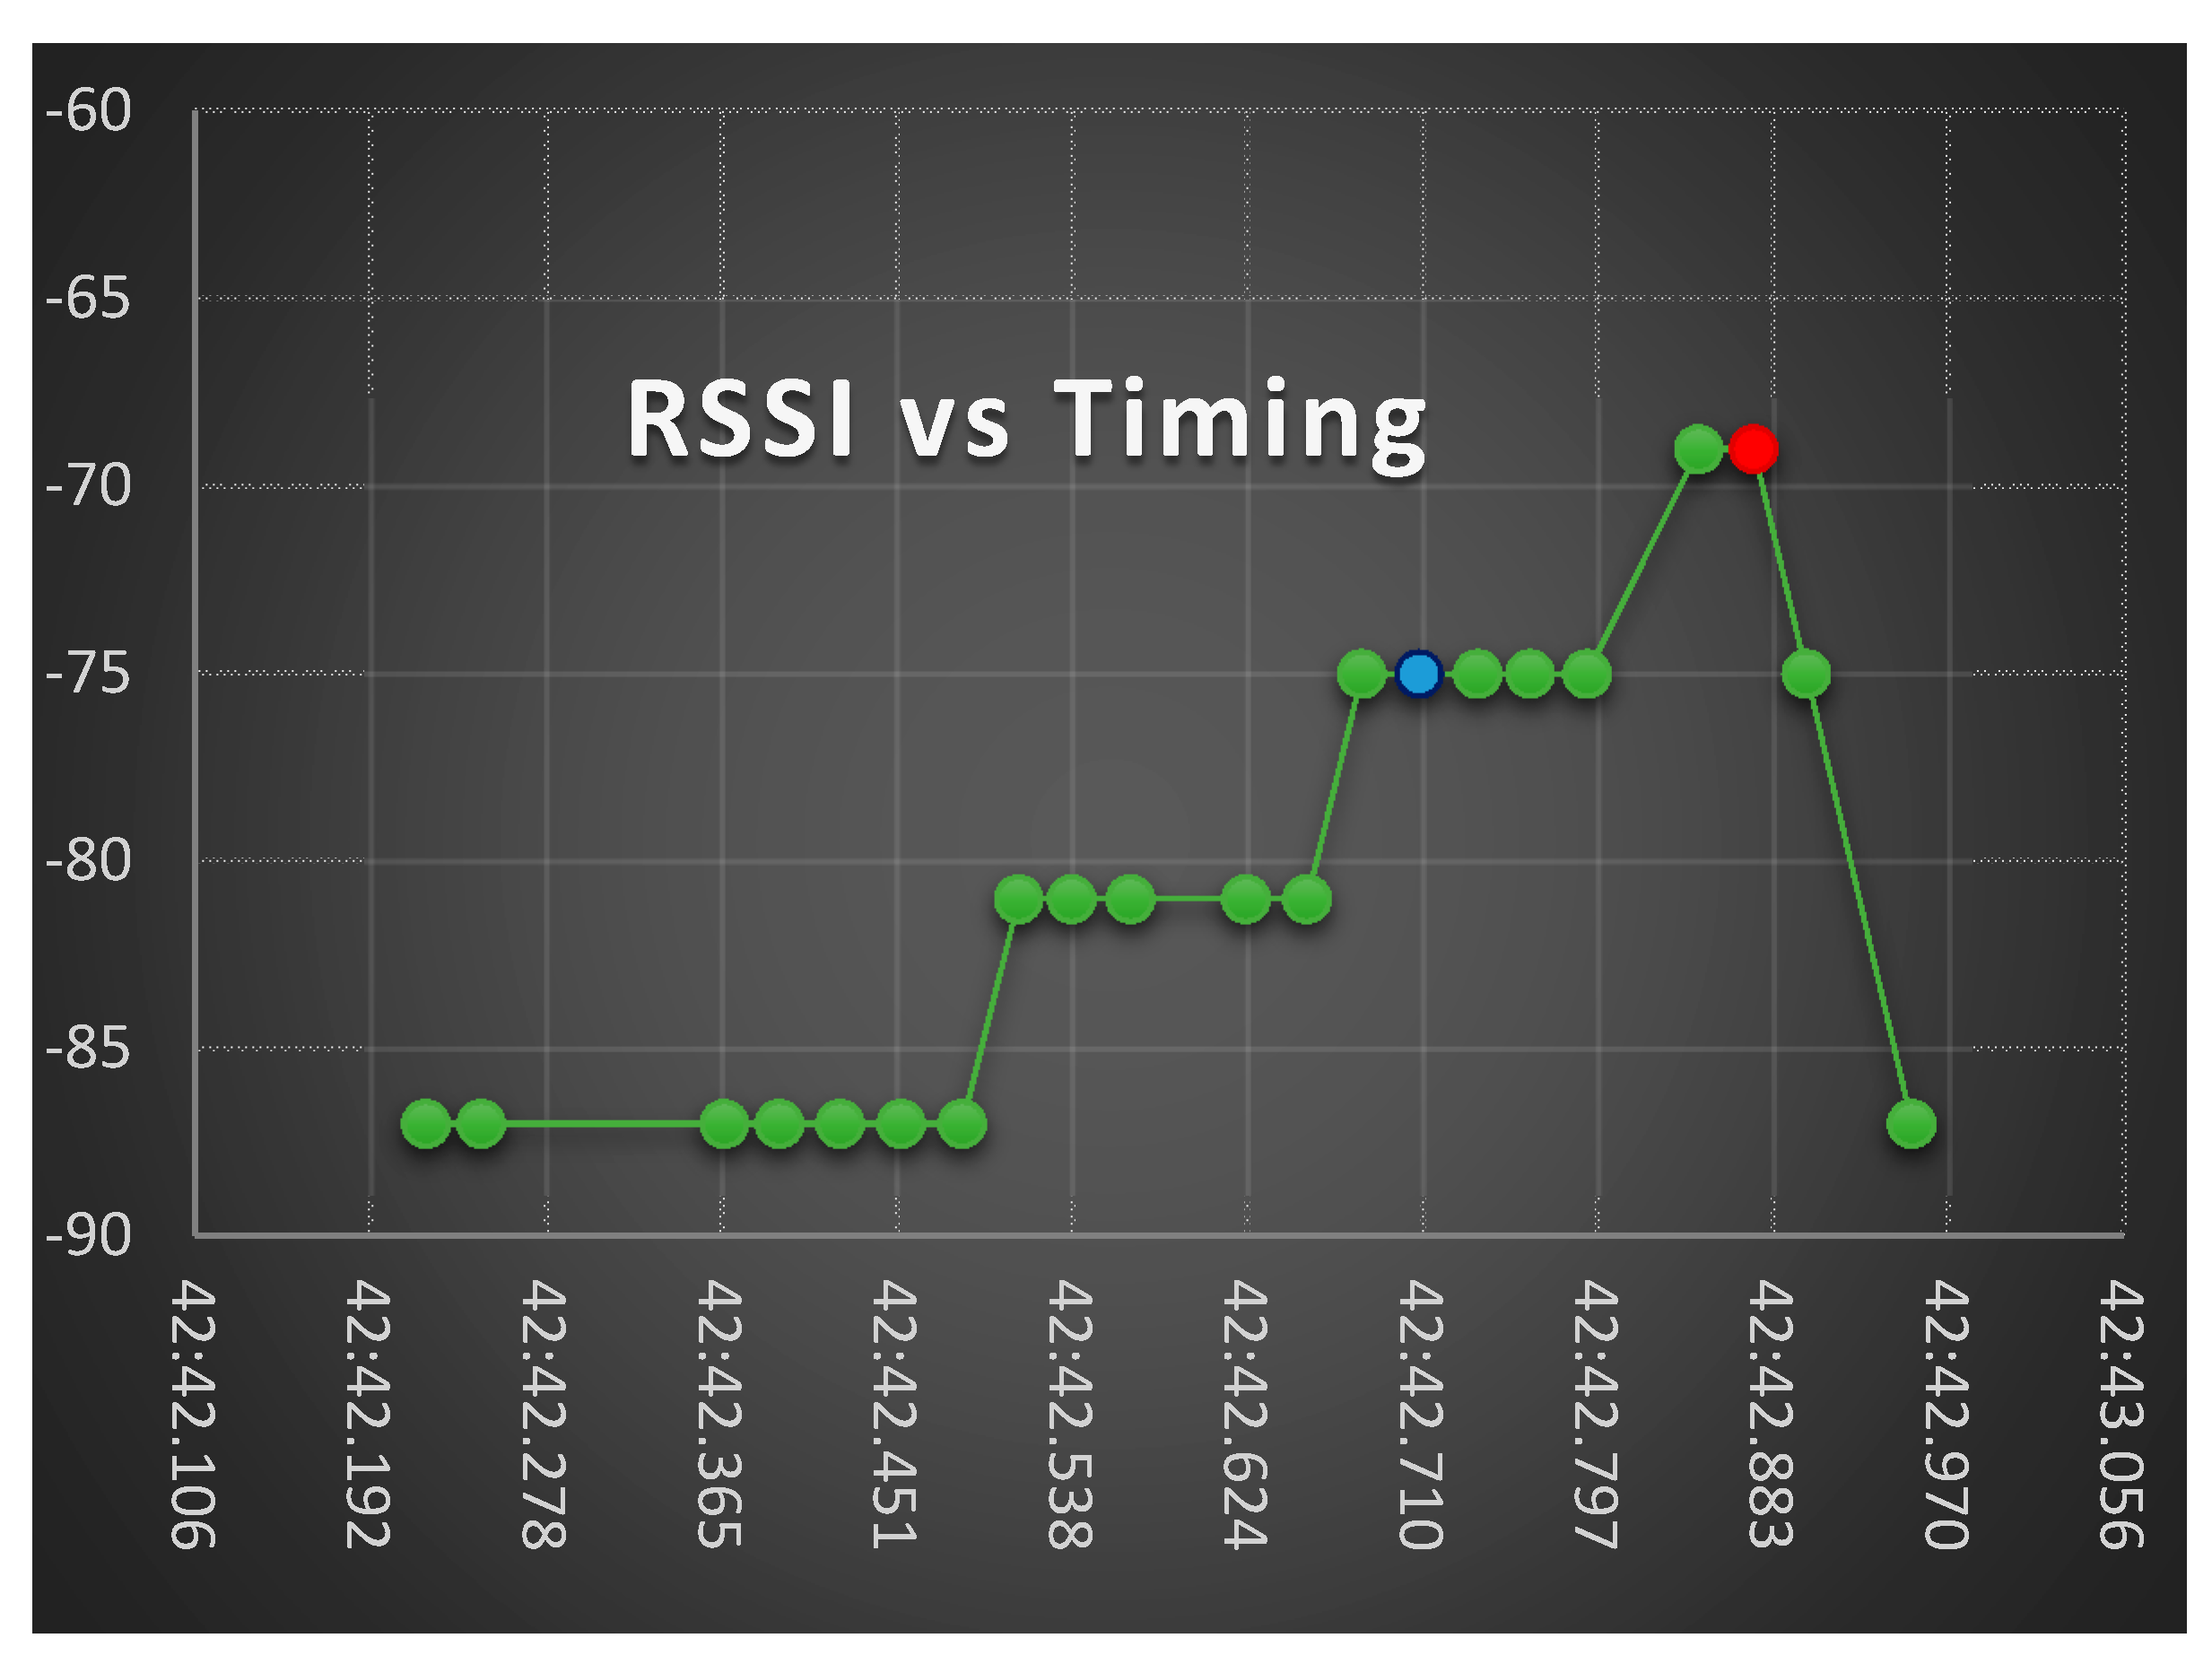
Table 6 summarizes the data in one running test of the second time dynamic experiment where the BLE Tag was tied to the runner’s instep. The runner’s position was captured by a high-speed camera, along with the RSSI signal received by the BLE Receiver in real time. The BLE Receiver sets the last one RSSI non-attenuated signal and related timestamp as each running test result in the dynamic experiment. The message in red text shows the information related to the RSSI, set by the BLE Receiver, as shown in Figure 15b. The message in blue text shows the information related to the runner passing at the top of the mat, confirmed by the high-speed camera, as shown in Figure 15a. The timing error can be obtained by the time difference between the red text and the blue text.
Figure 16 shows the RSSI dynamic change versus the receiving time, i.e., the one-time running test results of Table 6. The dynamic experimental completed data for different Tx power level settings are shown in Table 7, Table 8 and Table 9.
Table 10 compares the results of Table 7, Table 8 and Table 9 in terms of the mean and one standard deviation. It shows that the Tx Power Level 4 has acceptable results with a smaller average value than that of Level 3 and a smaller one standard deviation than that of Level 5. The AVERAGE() is average calculates based on the value of collected data. The STDEVPA() is standard deviation calculates based on the data as entire population.
This dynamic experiment shows that the BLE Tag is detected within 100 ms regardless of whether it is worn on the chest or instep. The timing error of the BLE Tag worn on the chest is 89.72 ms ahead, and the standard deviation display is more concentrated, at about 64.21 ms. The timing error of the BLE Tag worn on the instep is 52.72 ms behind, and the standard deviation display timing error is more dispersed, at about 113.37 ms.
3.4. Dynamic Analysis on the Effects of Performance Improvement of the Multi-Group BLE Receiver
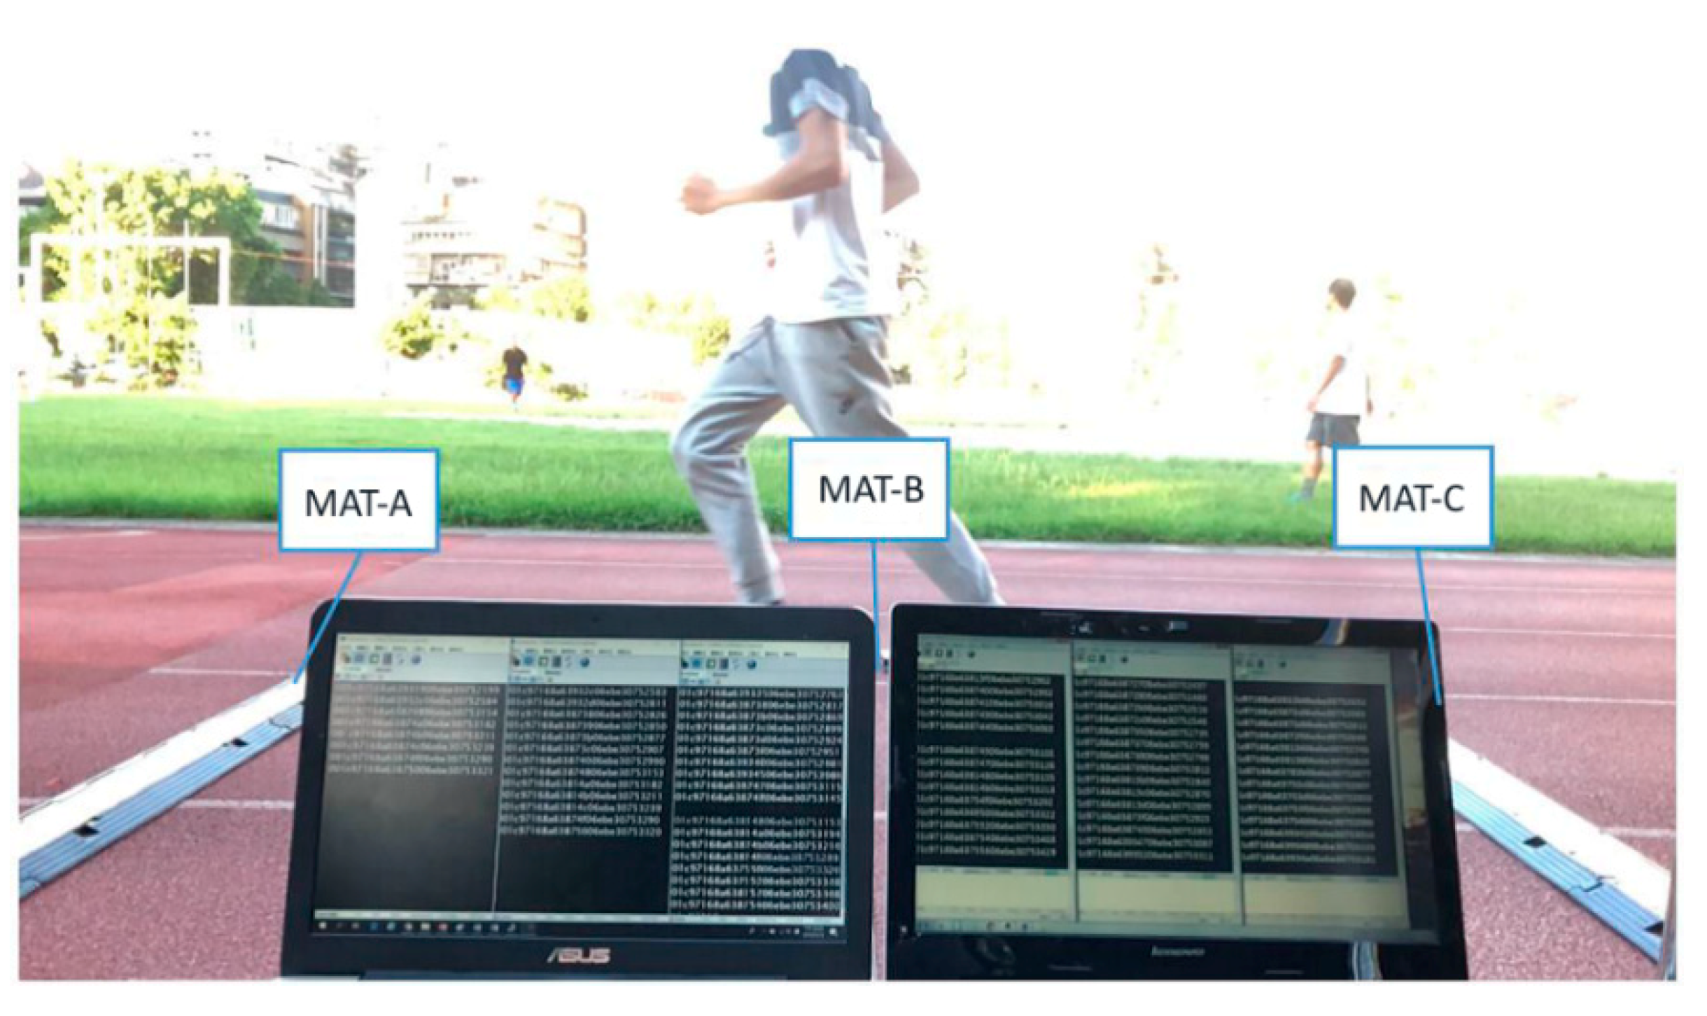
The RFID timing scheme has multiple signal receiving devices to ensure that the signal is received. The active mode of the BLE Receiver improves the reception accuracy and prevents the intrusion of multiple people from causing data loss. The experiment also configures multiple receivers for comparison. The three BLE Receivers are connected in series and then connected to individual Gateways, referred to as a set of MAT, as shown in Figure 5 and Figure 17. In the range of 2 m, three sets of MAT are placed at a distance of 1 m. The experiment sets a runner to run through three sets of MAT to verify the timing error between the real passing time with each MAT and the related timestamp judged by each BLE Receiver. The BLE Receiver sets the timestamp according to the last received RSSI non-attenuated signal. The BLE Tag signal advertisement period is still set to 20 ms and the intensity is set to Level 4.
Using a high-speed camera, the experiment captures the runner’s running position and all data including the RSSI and related timestamp.
3.4.1. The BLE Tag Is Mounted in the Chest Position
Figure 17 shows the dynamic experiments with three sets of MAT; the BLE Tag is placed on the runner’s chest. The experiment was run 10 times. Three sets of MAT received three different passing times. The timing error of the three sets of MAT could be shortened after arithmetic mean processing. From the 10 experimental data, the average of the four timing errors and one standard deviation were obtained, as shown in Table 11.
3.4.2. The BLE Tag Is Mounted on the Instep
Like the previous experiment of three sets of MAT, the BLE tag is placed on the runner’s instep. Additionally, the experiment was run 10 times. Three sets of MAT receive three different passing times. After arithmetic means processing, one standard deviation was calculated, as shown in Table 12.
According to the results of the dynamic experiment, when three BLE Receivers are used, the accuracy will increase by about 1/2 to 1/3 due to the direct arithmetic mean calculation, as shown in Table 13.
As shown in Table 13, the results of this experiment also show that, in terms of timing error, using the BLE Tag on the chest is more accurate than using the BLE Tag on the instep. Using the BLE Tag on the chest makes the detection time more advanced, with an average equal to 63.07 ms. Using the BLE Tag on the instep makes the detection time fall behind, with an average equal to −25.57 ms.
3.5. Dynamic Analysis of Multiple Runners Running through Three Groups of BLE Receivers
According to the above experimental conclusions, the single-pass running situation, whether static or dynamic, can be regarded as the passing time point of the runner according to the time point before the final BLE Receiver receives the un-attenuated RSSI. When multiple BLE Receivers are used, the accuracy of the passing time can be improved. Therefore, it is further verified whether multiple runners still maintain the same level when passing through the receiver at the same time. The BLE signal advertisement period, intensity, etc., are set as in the previous experiment. The experimental measurement analyzes the relative position and intensity of the BLE Receiver through the mutual interference of the runners and evaluates the value of the timing error.
3.5.1. Two Runners with the BLE Tags Installed in the Chest Position
The experiment was conducted simultaneously by two runners, side by side, comparing the actual time obtained through three BLE Receivers and the time obtained by receiving signal analysis.
As shown in Table 14, the results of the experiment show that two runners with a BLE tag on their respective chests ran through the three sets of MAT at the same time.
The value of 49.72 ms is one standard deviation of Runner-A’s five-pass timing error. The value of 27.40 ms is one standard deviation of Runner-B’s five-pass timing error. The value of 46.01 ms is one standard deviation of the total ten-pass timing error.
3.5.2. Two Runners with BLE Tags Mounted on their Instep
The experiment was conducted simultaneously by two runners, side by side, comparing the actual time obtained through three BLE Receivers and the time obtained by receiving signal analysis.
As shown in Table 15, the results of the experiment show that two runners with a BLE tag on their respective insteps ran through the three sets of MAT at the same time. The value of 22.47 ms is one standard deviation of Runner-A’s five-pass timing error. The value of 32.76 ms is one standard deviation of Runner-B’s five-pass timing error. The value of 30.28 ms is one standard deviation of the total ten-pass timing error.
3.5.3. Four Runners with BLE Tags Mounted in the Chest Position
The experiment was conducted simultaneously by four runners, comparing the actual time obtained through three BLE Receivers and the time obtained by receiving signal analysis.
As shown in Figure 18, the experiment allowed four runners with a BLE Tag on their respective chests to run through the three sets of MAT, one by one, in a short period of time. Table 16 shows the experimental results. The values of 6.31, 15.11, 13.87 and 14.07 ms are one standard deviation of Runner-A, Runner-B, Runner-C and Runner-D’s five-pass timing error, respectively. The value of 14.24 ms is one standard deviation of the twenty-pass timing error.
3.5.4. Four Runners with BLE Tags Mounted in the Instep Position
The experiment was conducted simultaneously by four runners, comparing the actual time obtained through three BLE Receivers and the time obtained by receiving signal analysis.
As shown in Figure 19, the experiment allowed four runners with a BLE Tag on their respective insteps to run through the three sets of MAT, one by one, in a short period of time. Table 17 shows the experimental results. The values of 40.12, 54.32, 44.65 and 40.86 ms are one standard deviation of Runner-A, Runner-B, Runner-C and Runner-D’s five-pass timing error, respectively. The value of 51.82 ms is one standard deviation of the twenty-pass timing error.
The dynamic experimental results show that when three BLE Receivers are used, regardless of whether one, two or four runners pass through the BLE Receiver in the short period of time, the timing error is measured by one standard deviation, which is more accurate than the experiment using one BLE Receiver. The degree is relatively more accurate—when the BLE Tag is on the chest, it is about 14.24~46.01 ms; when the BLE Tag is on the instep, it is about 30.28~51.82 ms. All cases are smaller than the experiment using one BLE Receiver, as shown in Table 18. In terms of 6 standard deviations, the timing error at the start or finish line will be less than ±156 ms.
3.6. Dynamic Analysis of BLE Receiver Data Loss Rate in Multi-Person Situations
According to the above experimental results, the experimental measurement of the timing error is in the range of 6 standard deviations, no more than ±156 ms, regardless of whether a single runner or multiple runners ran through three sets of MAT. Therefore, the experiment verifies the reception situation in the case of more runners passing at the same time, as shown in Figure 20.
The advertisement period and intensity of the BLE Tag signal are all set as in the previous experiment. In the range of 2 m, three sets of MAT are placed at a distance of 1 m. Each running test consisted of 20 runners passing at the same time, 12 tests were performed, and 240 time measurements were taken, as shown in Table 19. The passing time of one of the BLE Tags was not successfully read by Mat-C, but Mat-A and Mat-B successfully read it. As such, the time judgment could still be completed, so it was determined that all of them were read, even though the actual signal receiving rate was 99.86%.
3.7. Time Synchronization between Devices
There are many timing devices along a city marathon track, not just 42.195 km away from the start line or the stop line. Each device’s time synchronization must be considered and the accuracy must be measured.
3.7.1. Measure Four Timing Devices in the Same Place
The time synchronization experiment between the devices was tested on two Gateways, A and B, which were connected to the Internet via Wi-Fi and 4G LTE. Gateway A completes the NTP network clock synchronization first. When Gateway B has a clear time difference, Gateway B performs NTP network clock synchronization. The two Gateways are compared in terms of clock messages sent out per second via the UART interface, until the two Gateways have the same data. At this time, Gateway B also completes NTP network synchronization. The experimental results are as follows: it takes about 20 s to complete the NTP clock synchronization procedure in a wireless network and a 4G LTE connection environment.
The PPS of the GPS signal-assisted synchronization experiment was tested on four Gateways. After each Gateway completed clock synchronization by the NTP function, each gateway determined a timer to turn off the PPS’s signal mask on their respective GPS. So, each PPS signal was respectively delivered to its respective BLE Receiver. The experiment used an oscilloscope to display the synchronization signals received by the four BLE Receivers. The experimental results fell within a range of 10 μs, as shown in Figure 21. The time synchronization experiment confirmed that the time devices have a high capacity to achieve accurate time synchronization.
3.7.2. Measure Two Timing Devices at 15 km Distance
In order to further ensure that the timing devices on the starting line, finish line and any other different mileage points on the city marathon track had the same precise synchronization trigger signal, the time synchronization experiment was carried out in different places.
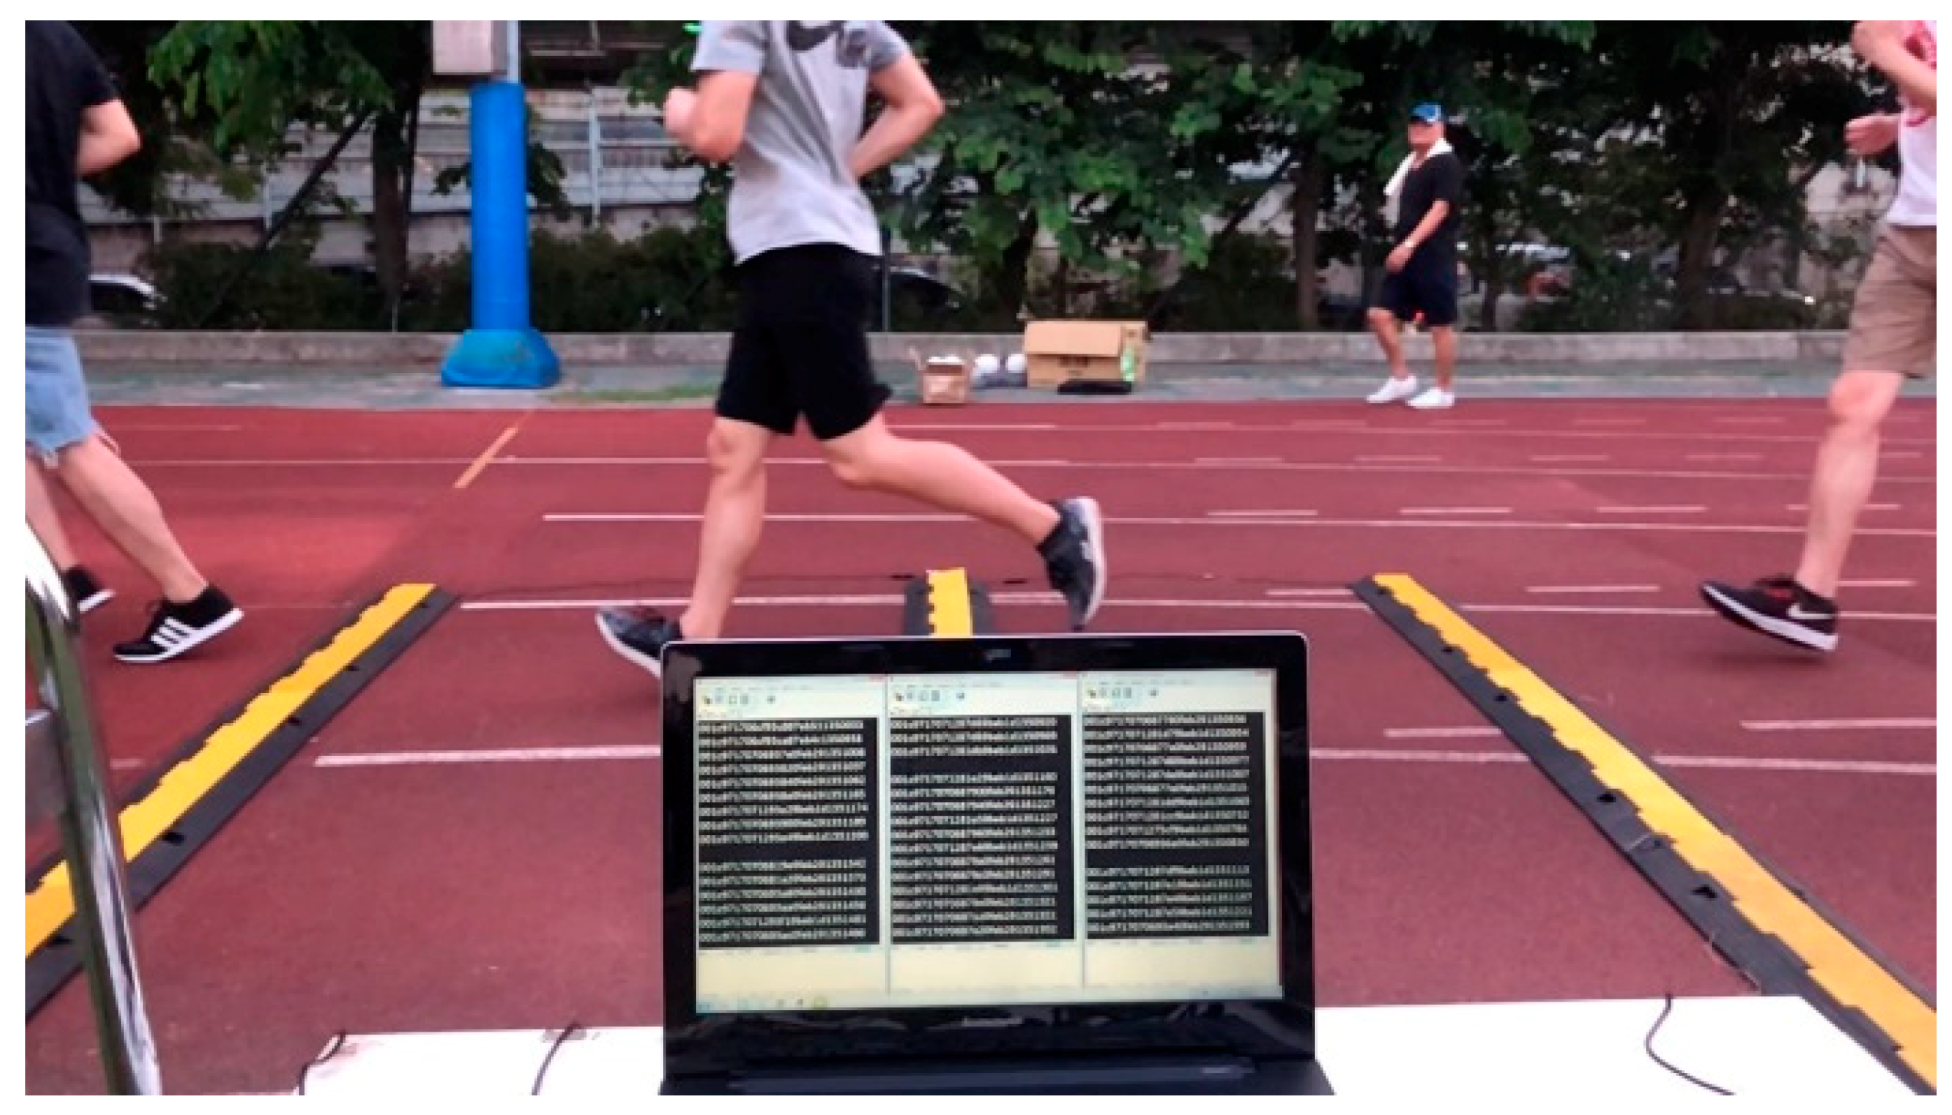
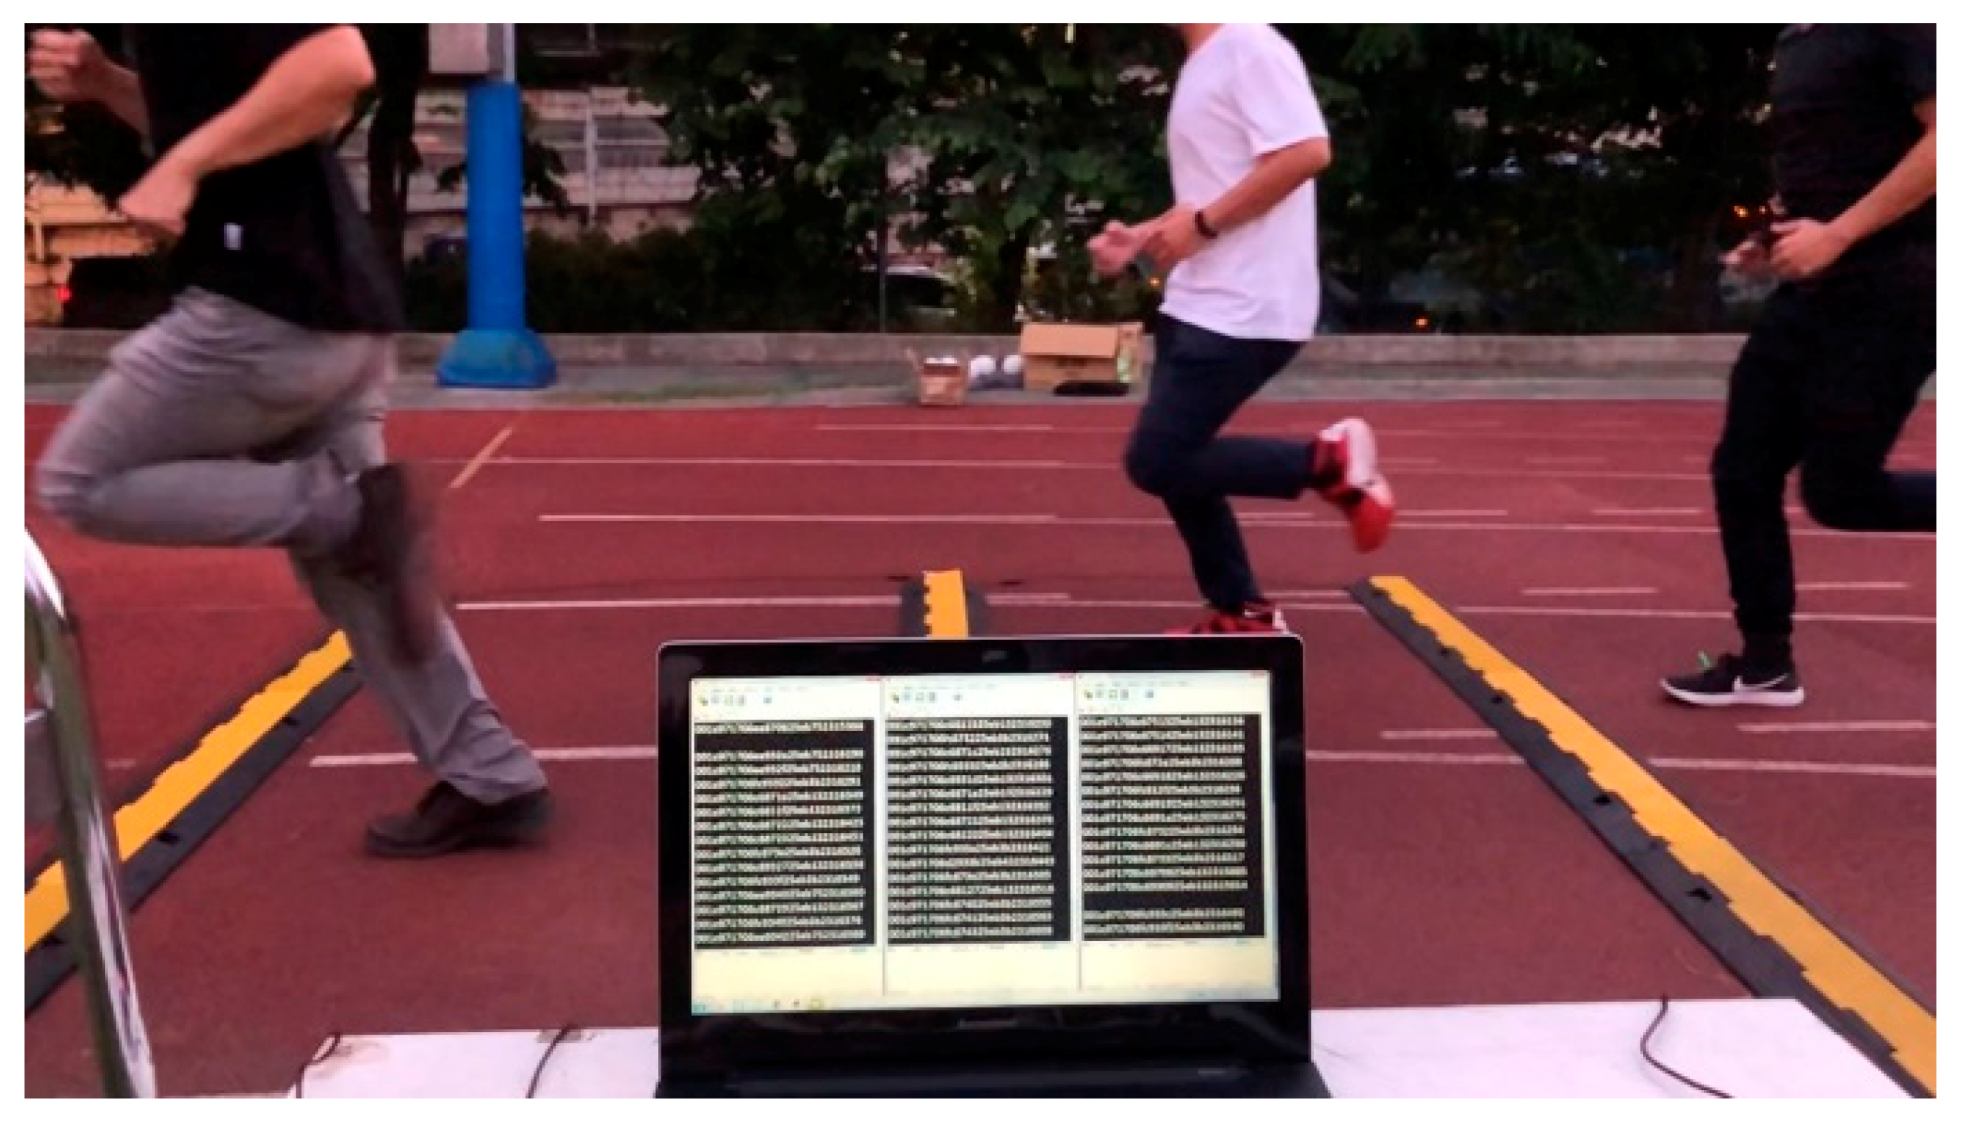
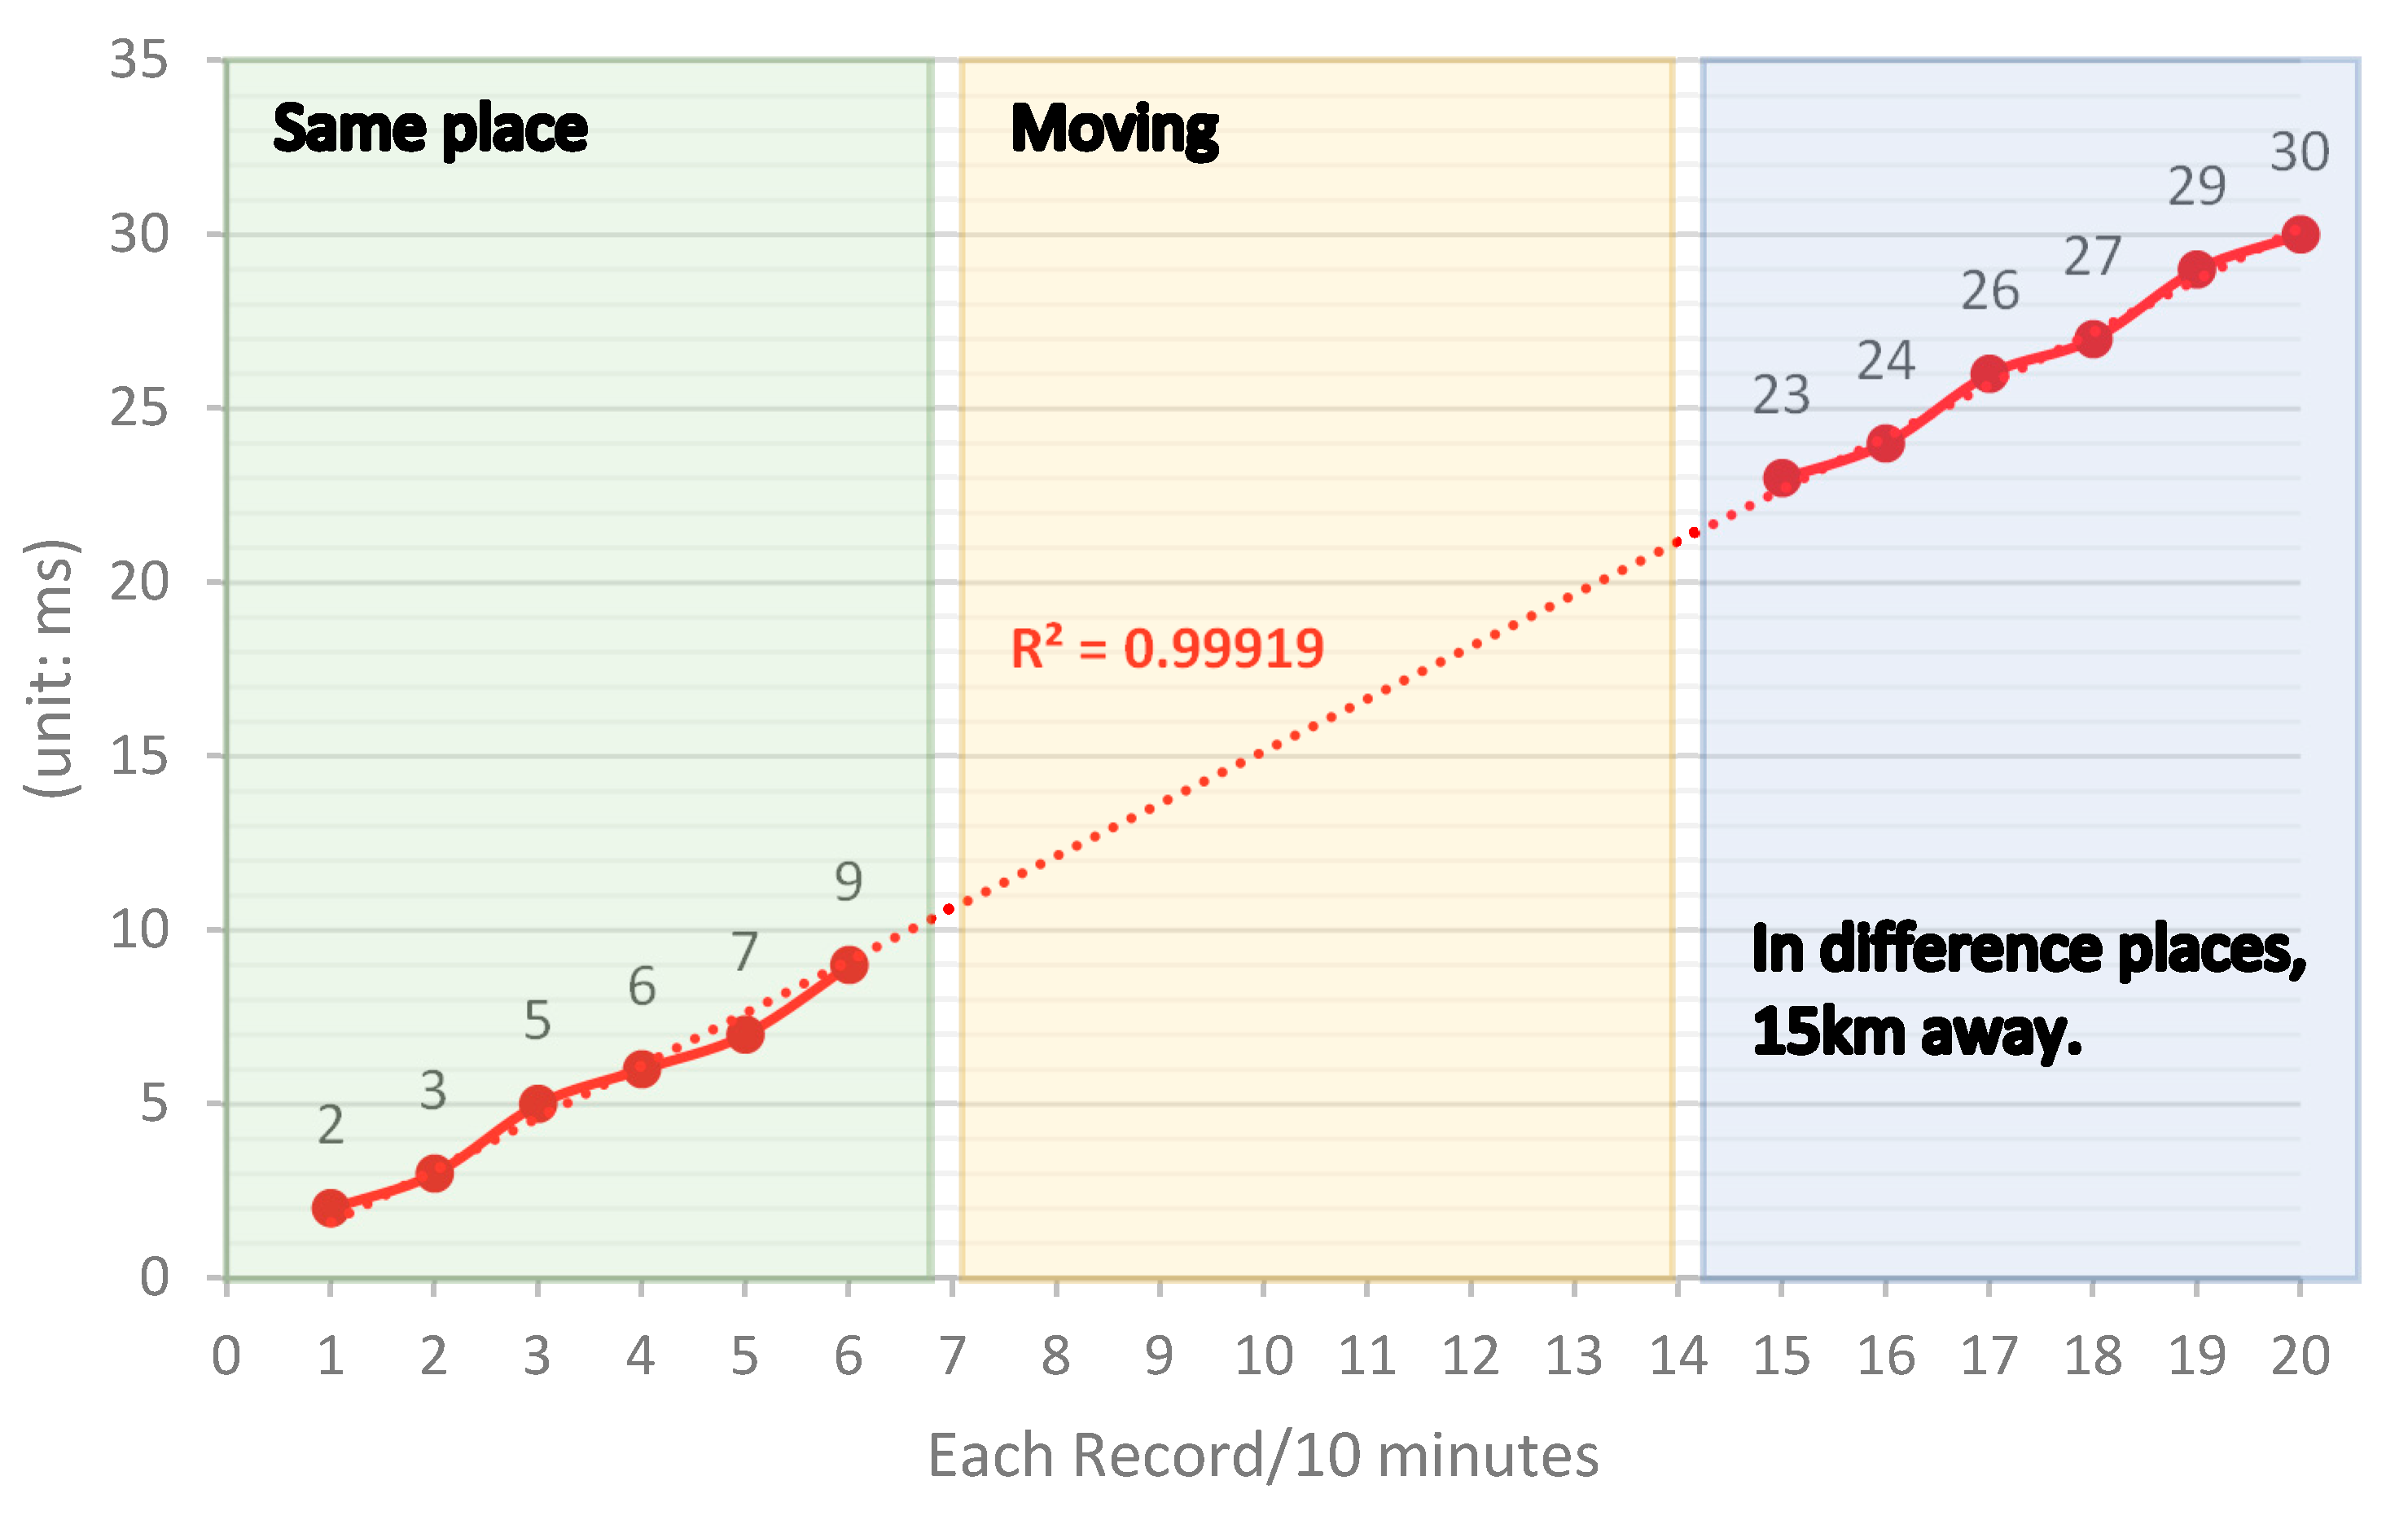
As in the previous experiment, four timing devices at the same position, around the 1-m range, ensured extremely accurate synchronous trigger signals. The time synchronization experiment in different places is to record the time difference trajectory of the trigger signal sent by the two timing devices during the correct operation of the network time synchronization and the PPS of the GPS signal-assisted pair. The estimated timing devices are two sets of Gateways, A and B, including their respective GPS, 4G LTE, and power system. The standard timing device is the other two A’ and B’ BLE Receivers that perform timing operations with their own internal crystal oscillators. The BLE Receivers, A’ and B’, had different clock speeds [24]. When a trigger signal from Gateways A and B was received every 10 min, the two sets of BLE Receivers, A’ and B’, responded to timing signals from their respective internal clock. When the ambient temperature tends to be uniform, the crystal oscillators of the two A’ and B’ microprocessors are stable with a fixed amount of drift. When the experiment was carried out, the time synchronization of devices such as A’, B’, A, and B was initially performed at the same place. Thereafter, Gateways A and B triggered their own A’ or B’ responses to the internal timestamp every 10 min. The system also started to record the time difference between two timestamps. The time difference was recorded six times over an hour, then the B and B’ devices were moved to a distance of 15 km away, and the time difference continued to be recorded every 10 min.
As shown in Figure 22, the results of the experiment were analyzed by Regression analysis. The trajectory shows that the time difference recorded from the same place to different locations was tested by the coefficient of determination. The measured experimental value R2 is 0.99919.
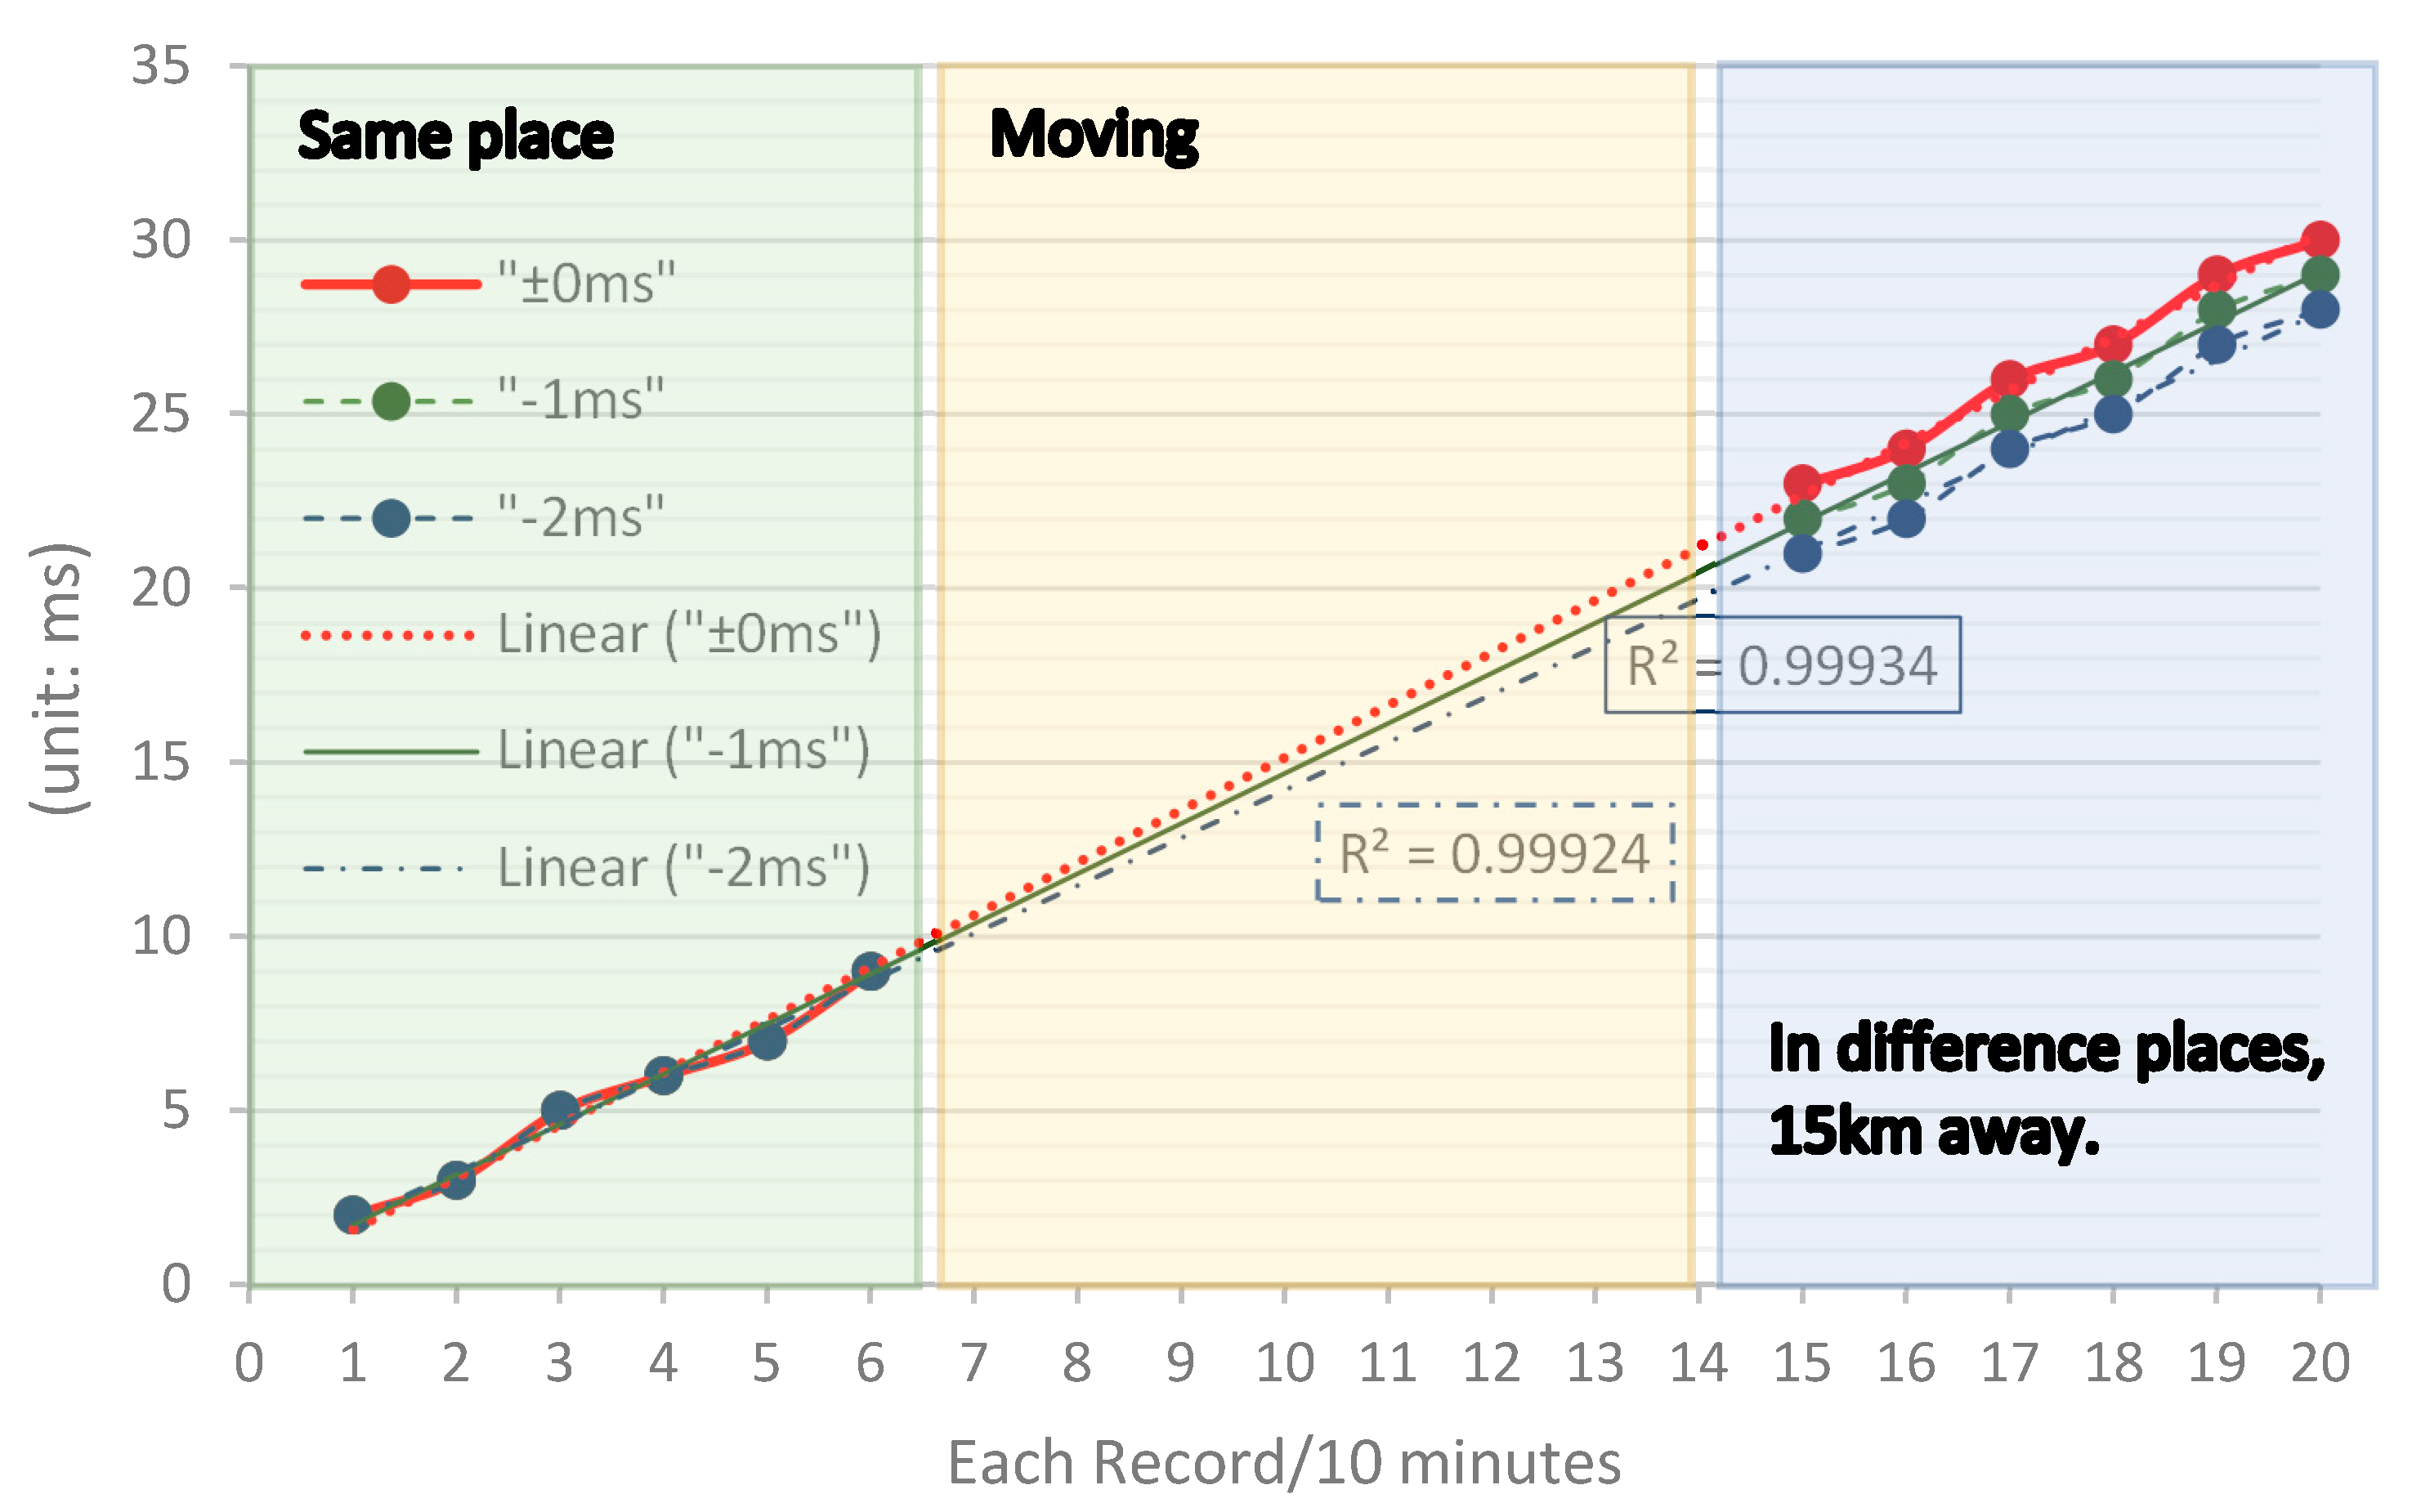
Figure 23 shows the original experimental data and relative correction data. The trajectory of “−1 ms” assumes that the synchronization time of Gateway B after movement is 1 ms faster. If the relative correction were made, the trajectory with the same location should be displayed as a straight line; similar to the trajectory of “−2 ms”, it was assumed that the synchronization time of Gateway B after movement was 2 ms faster. Comparing the different correction values, only the two closest correction trajectories are retained.
Comparing the R2 values of “±0 ms”, “−1 ms”, and “−2 ms”, the trend line of “−1 ms” is closest to the straight line; R2 is 0.99934. Therefore, the time synchronization method used in this experiment has a measurement error of 1 ms across 150 to 200 min in different locations and environments. This 1 ms time unit is also the smallest unit that the system can measure.
This experiment confirms that the timing devices have a high accuracy timing synchronization capability not only in the same place but also 15 km away.
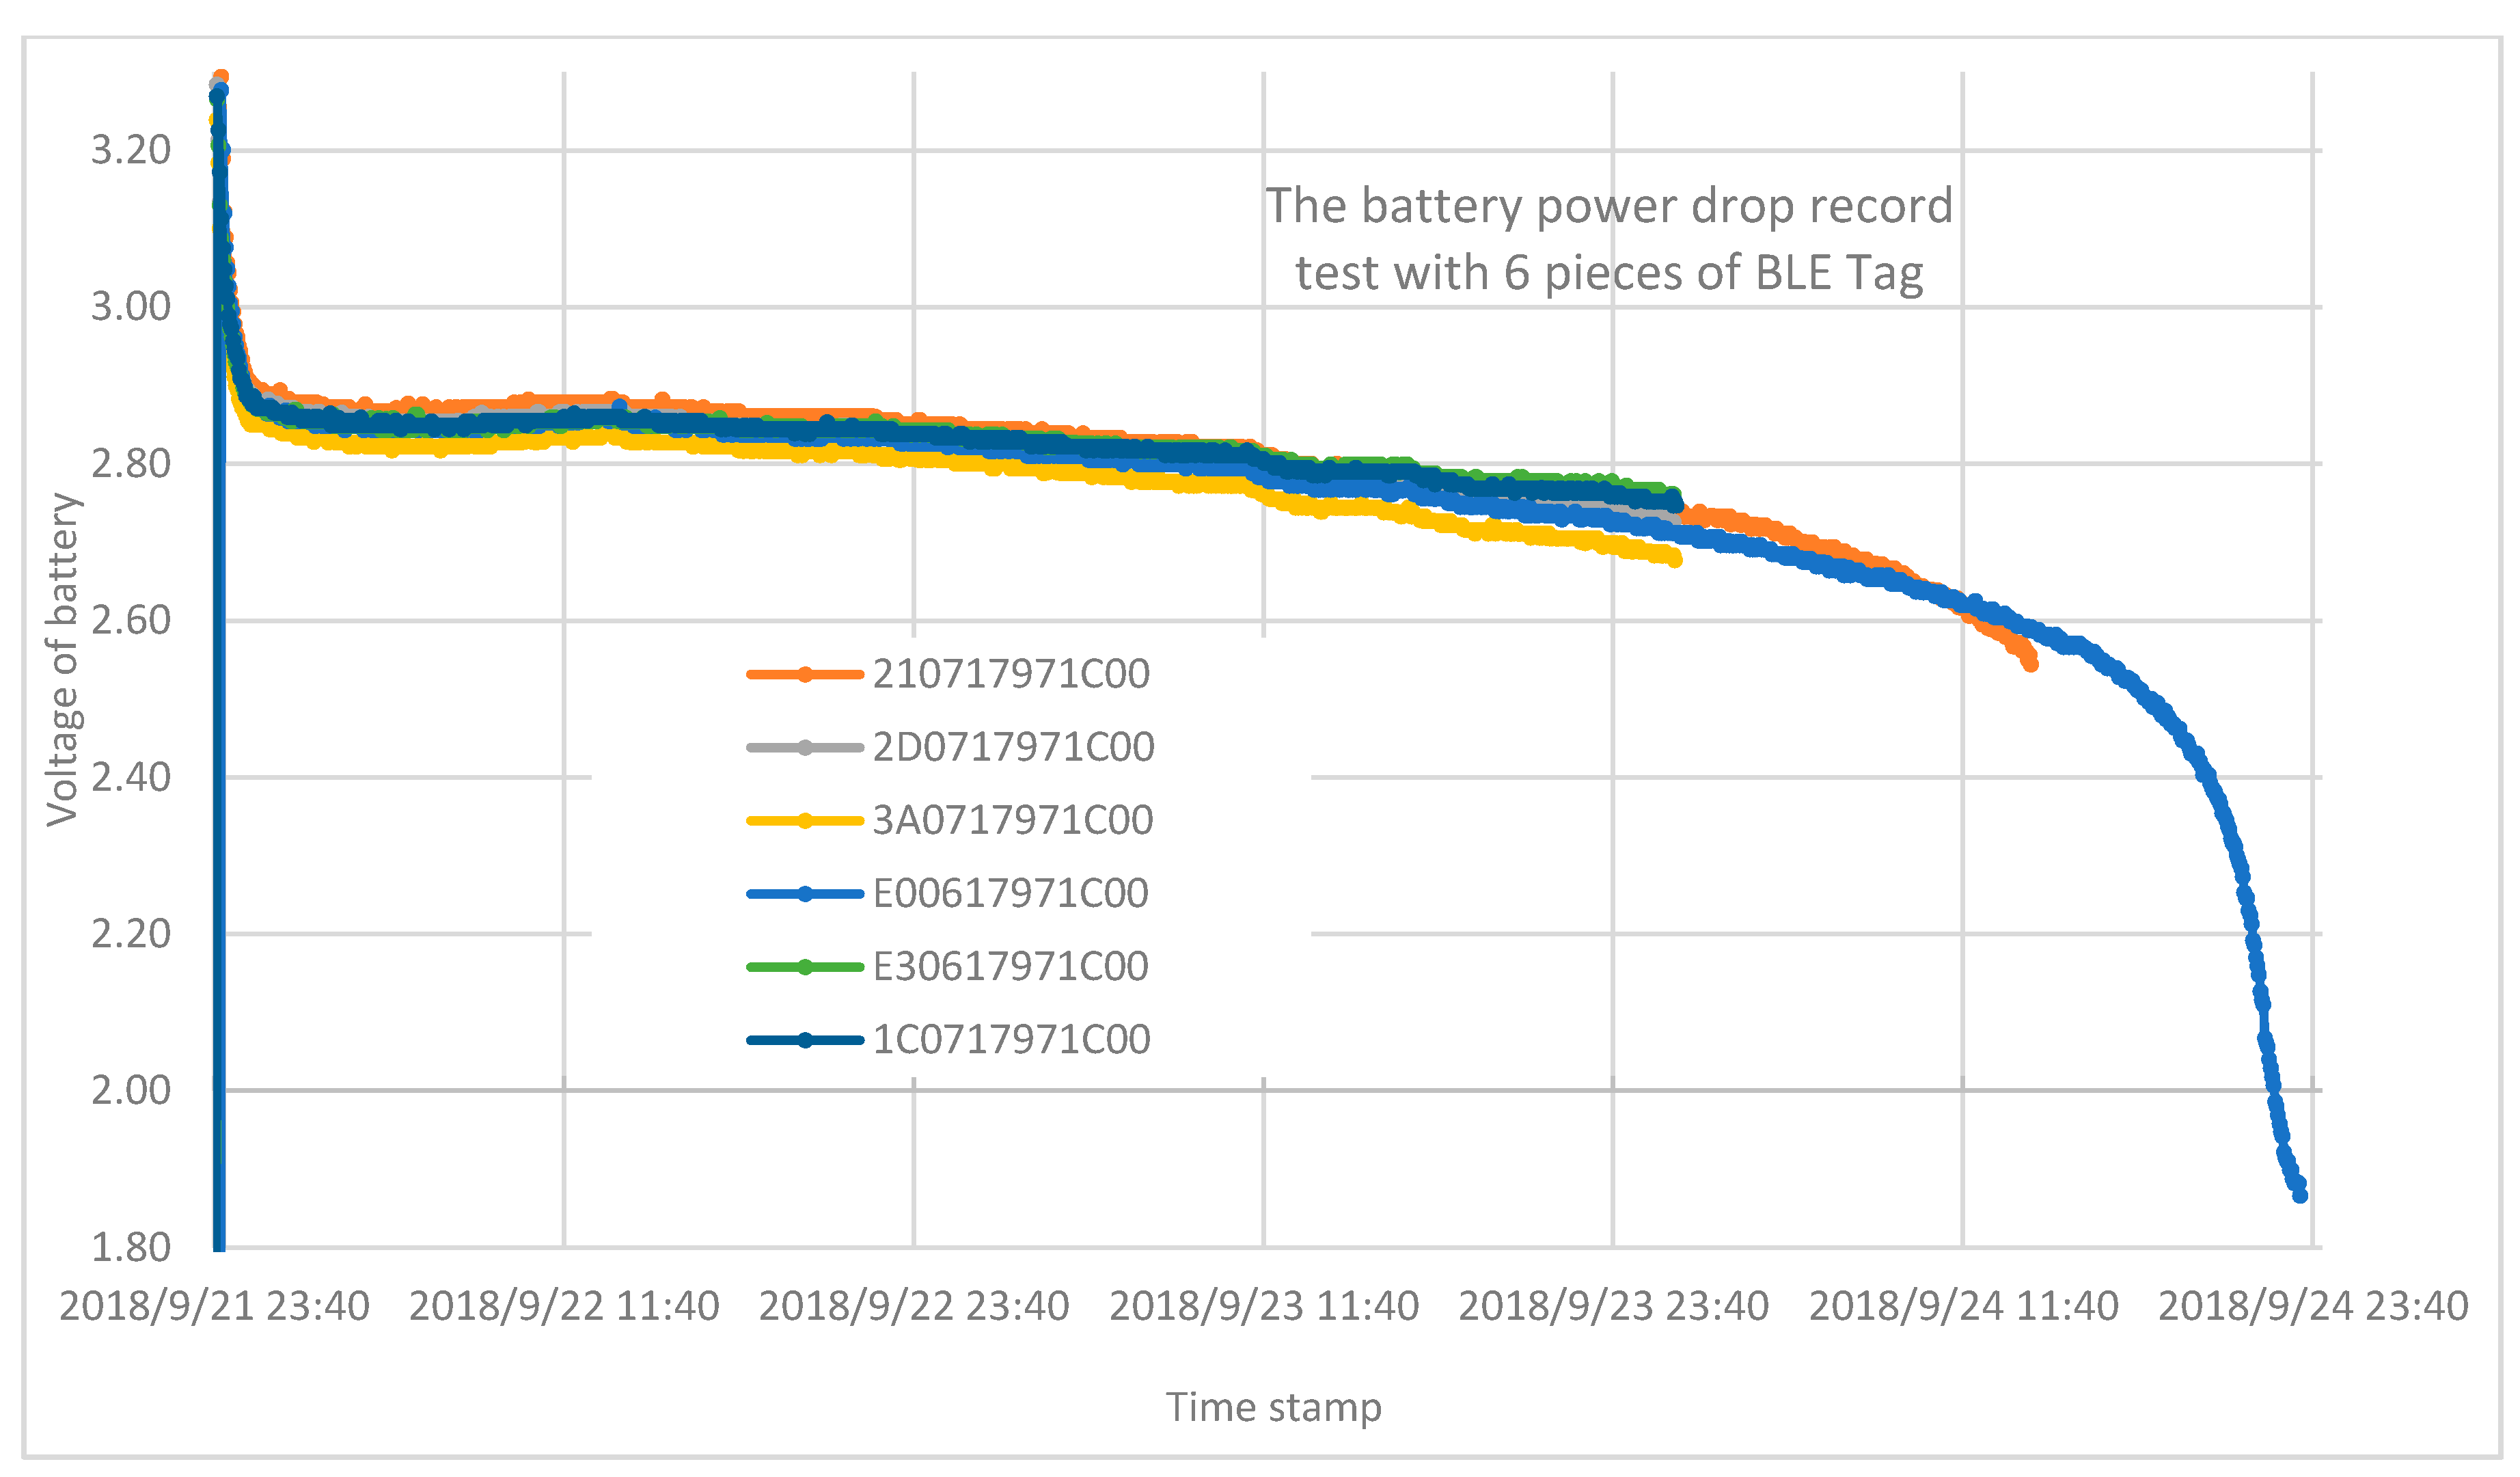
3.8. BLE Tag Battery Operation Time Experiment
Six BLE Tags were arbitrarily selected, the period of advertisement was set to 20 ms, and six new CR2032 (Maxell Lithium Battery CR2032) batteries life were tested.
Experimental results: at least 48 h of continuous use, up to nearly 72 h, as shown in Figure 24.
4. Discussion and Conclusions
This study tries to replace the traditional RFID timing system with a Bluetooth active communication system. The Bluetooth active communication system uses the BLE Tag to continuously send out the radio signal at an advertising frequency of 20 ms, which is used as a timing beacon and satisfies the IAAF timing 0.1-s minimum resolution. After reducing the BLE Tag transmit power, the BLE Receiver can receive the broadcast timing beacon signal only within a short distance of around 3 m. Due to the low power consumption architecture of the original BLE communication system, the BLE Tag can be supplied for 48 h or even longer with a single button battery.
The time detection method is based on the BLE Tag worn by the runner. Along the race track, a set of BLE Receivers and networking equipment could be set up every 500 m instead of 5 km in the case of the RFID timing system. When the runner passes each BLE Receiver, the related BLE Receiver performs passing time detection, and the networking equipment transmits the related data that are sent out from the BLE Tag by way of the BLE Receiver. When the BLE Receiver receives the same BLE Tag signal, the last received time before the un-attenuated signal is the closest time of the runner passing the BLE Receiver.
In the experimental case of three sets of MAT separated by 1 m, the accuracy of the passing time measurement can be further improved to within ±156 ms. During the entire race, the timing device continuously synchronizes the Internet time server and GPS signals every 10 min to minimize the timing offset in the whole of the system. On the track, a set of MATs and networking devices were set every 500 m. Even if the distance were extended to 15 km, the timing synchronization error only falls within 1 ms.
The experiment was performed on a three-meter-wide runway of a track with three BLE Receivers connected in series as a fixed-point receiver, MAT. In the experimental case, the scale as the international city marathon race is 20 runners passing the MAT per second, regardless of whether runners wear the BLE Tags on their chests or on their insteps; the passing time rate obtained by MAT can be measured at 99.86%. As for the purpose of compensation, three sets of MAT were placed at a distance of 2 m, the obtained signal rate was 100%. If all three MATs obtain the runner’s passing time, the timing accuracy will be increased. If there is a MAT that fails to obtain the runner’s passing time, no matter which of the three, the runner’s passing time can still be correctly obtained. However, the accuracy may not be optimal.
In the case of timing using three MATs, the middle MAT is used as the main timing standard. If two MATs lose a runner’s passing time, the maximum score error for the runner may have a timing error of 1 m divided by the runner’s average speed, or, the deviation of the timing can no longer be optimized.
BLE Receivers can be connected in series, as many times as needed. When the scale of the marathon competition differs, the number of connections in series can be increased, and the range of width for the received signal can be increased, too. This means that the number of runners passing at the same time will also be increased.
The operating architecture of this Bluetooth timing system includes BLE Tags and cloud-connected serial BLE Receivers with Gateway and 4G LTE. In addition to exceeding the IAAF’s requirements for the Transponder Timing Systems of the race, it also meets the expectations of the future transmission of athletes’ physiological sensory information. Because of the simple equipment and precise operation, a set of time-receiving devices, MAT, could be placed every 500 m. Even walkers have the opportunity to pass an MAT within 10 min. In this way, physiological monitoring will be carried out at least every 10 min on the track in the future.
Finally, the system receives the timing data of each runner’s starting point, end point, and other time detection points, i.e., it completes the speed curve of each runner’s mileage and time. Therefore, the advanced training of runners and mutual observation can be performed more professionally.
Author Contributions
Conceptualization, C.-I.S. and J.-T.H.; Data curation, C.I.S., S.-C.W. and M.-F.C.; Formal analysis, C.-I.S., J.-T.H., S.-C.W. and M.-F.C.; Funding acquisition, J.-T.H.; Investigation, C.-I.S., S.-C.W. and M.-F.C.; Methodology, C.-I.S. and J.-T.H.; Project administration, J.-T.H.; Resources, J.-T.H.; Software, C.-I.S., S.-C.W. and M.-F.C.; Supervision, J.-T.H.; Validation, C.-I.S., S.-C.W. and M.-F.C.; Visualization, C.-I.S., S.-C.W. and M.-F.C.; Writing—original draft, C.-I.S.; Writing—review & editing, C.-I.S. and J.-T.H.
Funding
This research received no external funding
Acknowledgments
This work has been supported in part by Qualcomm Taiwan and agency, Supreme Electronics Co., Ltd.
Conflicts of Interest
The authors declare no conflicts of interest.
Appendix A
The static experimental test data, tested with four BLE Tags, directly showing the RSSI vs. the location, are shown in Figure A1 and Figure A2. Many data marks are overlapping and it is difficult to identify the trends.
Figure A1.
Static experiment test with four BLE Tags on the chest.

Figure A2.
Static experiment test with four BLE Tags on the instep.

References
- Championchip. Available online: https://xipgroc.cat/en/curses/MaratoBCN2017/42k/resultats (accessed on 19 October 2018).
- ZMB 2018–Results. Available online: https://resultados.zurichmaratobarcelona.es/2018/en/results/ (accessed on 19 October 2018).
- Immerzeel, F.J.C. How to optimize a RFID UHF System for Mass Sports Timing. Master’s Thesis, Delft University of Technology, Delft, The Netherlands, 21 September 2012. [Google Scholar]
- Polivka, M.; Svanda, M.; Hudec, P. The optimization of the RFID system for the identification of sportsmen in mass races. In Proceedings of the 37th European Microwave Conference, EUMC, Munich, Germany, 9–12 October 2007. [Google Scholar] [CrossRef]
- Svanda, M.; Polivka, M.; Premysl, H. Application of the UHF RFID System for the Identification of Sportsmen in Mass Races. Eur. Microw. Assoc. 2007. Available online: http://www.skvor.cz/microwave/eumaproceedings2007.pdf (accessed on 10 February 2019).
- Perez-Diaz-de-Cerio, D.; Hernández-Solana, Á.; Valdovinos, A.; Valenzuela, J.L.; Perez-Diaz-de-Cerio, D.; Hernández-Solana, Á.; Valdovinos, A.; Valenzuela, J.L. A low-cost tracking system for running race applications based on bluetooth low energy technology. Sensors 2018, 18, 922. [Google Scholar] [CrossRef] [PubMed]
- International Association of Athletics Federations. 2016. Available online: https://www.iaaf.org/news/iaaf-news/competition-rules-2016-2017 (accessed on 10 February 2019).
- Wixted, A.J.; Member, S.; Thiel, D.V.; Member, S.; Hahn, A.G.; Gore, C.J.; Pyne, D.B.; James, D.A. Measurement of energy expenditure in elite athletes using MEMS-based triaxial accelerometers. IEEE Sens. J. 2007, 7. [Google Scholar] [CrossRef]
- Ahmadi, A.; Mitchell, E.; Destelle, F.; Gowing, M.; OConnor, N.E.; Richter, C.; Moran, K. Automatic activity classification and movement assessment during a sports training session using wearable inertial sensors. In Proceedings of the 2014 11th International Conference on Wearable and Implantable Body Sensor Networks, IEEE, Zurich, Switzerland, 16–19 June 2014; pp. 98–103, ISBN 978-1-4799-4959-5. [Google Scholar] [CrossRef]
- Stupar, D.Z.; Bajic, J.S.; Manojlovic, L.M.; Slankamenac, M.P.; Joza, A.V.; Zivanov, M.B. Wearable low-cost system for human joint movements monitoring based on fiber-optic curvature sensor. IEEE Sens. J. 2012, 12, 3424–3431. [Google Scholar] [CrossRef]
- Archived Core Specifications | Bluetooth Technology Website. Available online: https://www.bluetooth.com/specifications/bluetooth-core-specification/archived-specifications (accessed on 17 October 2018).
- Radio Versions | Bluetooth Technology Website. Available online: https://www.bluetooth.com/bluetooth-technology/radio-versions (accessed on 17 October 2018).
- International Association of Athletics FederationsWorld Records | iaaf.org. Available online: https://www.iaaf.org/records/by-category/world-records (accessed on 17 October 2018).
- International Association of Athletics Federations Competition Rules 2012–2013 in Force as from 1st November 2011 100 Years of Athletics Excellence Centenary Edition. Available online: http://atletismocanario.es/wp-content/uploads/2014/04/manual_english.pdf (accessed on 17 October 2018).
- D.R7_GY-NEO6MV2-GPS-Module-Datasheet. Available online: https://www.u-blox.com/sites/default/files/products/documents/NEO-6_DataSheet_(GPS.G6-HW-09005).pdf (accessed on 10 February 2019).
- How Accurate Is GPS Time?—RACELOGIC Support Centre. Available online: https://racelogic.support/01VBOX_Automotive/01General_Information/Knowledge_Base/How_Accurate_is_GPS_time%3F (accessed on 28 October 2018).
- TI GPS PPS Timing Application Note Application Note. 2012. Available online: http://processors.wiki.ti.com/images/f/f1/TI_GPS_PPS_Timing_AppNote.pdf (accessed on 28 October 2018).
- Network Time Synchronization Research Project. Available online: https://www.eecis.udel.edu/~mills/ntp.html (accessed on 3 November 2018).
- Mills, D.L. Internet time synchronization: The network time protocol. IEEE Trans. Commun. 1991, 39, 1482–1493. [Google Scholar] [CrossRef]
- CSR Joins QualcommCSR1010 QFN Data Sheet. 2015. Available online: https://www.qualcomm.com/media/documents/files/csr1010-data-sheet.pdf (accessed on 10 February 2019).
- Joolrat, S.; Saikaew, K.R.; Tengrungroj, M.; Jiranuwattanawong, P.; Janpanich, C.; Sornsakda, K. RFID data processing in a real-time monitoring system for marathons Suchart. Eng. Appl. Sci. Res. 2016, 43, 94–99. [Google Scholar]
- Top Ten Fastest 100 Meter Sprinters in History–Rankings.com. Available online: https://www.rankings.com/sports-track-sprinters/ (accessed on 21 October 2018).
- Interpolate 2-D or 3-D Scattered Data–MATLAB Griddata. Available online: https://www.mathworks.com/help/matlab/ref/griddata.html (accessed on 23 October 2018).
- Vig, J.R.; Walls, F.L. Fundamental limits on the frequency instabilities of quartz crystal oscillators. In Proceedings of the IEEE 48th Annual Symposium on Frequency Control, Boston, MA, USA, 1–3 June 1994; pp. 506–523. [Google Scholar]
Figure 1.
The application structure. DB, database; BLE, Bluetooth Low-Energy; MAT, There are several BLE Receivers connected in series as a longer mat.
Figure 1.
The application structure. DB, database; BLE, Bluetooth Low-Energy; MAT, There are several BLE Receivers connected in series as a longer mat.

Figure 2.
The BLE Tag. (a) Stereoscopic appearance; (b) back view; (c) internal component.

Figure 3.
The radiation far-field power distribution of the BLE Tag. (a) The X-Y plane; (b) the X-Z plane; (c) the Y-Z plane; and (d) the coordinate axis directions.
Figure 3.
The radiation far-field power distribution of the BLE Tag. (a) The X-Y plane; (b) the X-Z plane; (c) the Y-Z plane; and (d) the coordinate axis directions.

Figure 4.
A BLE Receiver in a yellow jacket cable protector.

Figure 5.
A MAT with a set of three BLE Receivers.

Figure 6.
The Network Time Protocol (NTP) synchronization test results.

Figure 7.
The Gateway. (a) The internal structure and (b) appearance.

Figure 8.
The Gateway, global positioning system (GPS), and synchronization control board connected to the BLE Receivers. PCBA, Printed Circuit Board Assembly; GND, ground; PPS, pulse-per-second; IO, input output; SYMO, synchronous mask output.
Figure 8.
The Gateway, global positioning system (GPS), and synchronization control board connected to the BLE Receivers. PCBA, Printed Circuit Board Assembly; GND, ground; PPS, pulse-per-second; IO, input output; SYMO, synchronous mask output.

Figure 9.
The experiment of (a) the five times broadcast frequency test; and (b) the five times Tx Power level test.
Figure 9.
The experiment of (a) the five times broadcast frequency test; and (b) the five times Tx Power level test.

Figure 10.
The received signal strength experiment.

Figure 11.
Static experiment to test the strength of RSSI (Received Signal Strength Indicator) at different locations.
Figure 11.
Static experiment to test the strength of RSSI (Received Signal Strength Indicator) at different locations.

Figure 12.
Static experiment to test the strength of RSSI at different locations.

Figure 13.
The dynamic experiment to test the RSSI related to the different runner locations. (a) Shows the time at which the biggest RSSI was received. (b) Shows the time of the BLE Tag on top of the mat.
Figure 13.
The dynamic experiment to test the RSSI related to the different runner locations. (a) Shows the time at which the biggest RSSI was received. (b) Shows the time of the BLE Tag on top of the mat.

Figure 14.
The RSSI on the BLE Receiver related to the receiving time.

Figure 15.
The dynamic experiment to test the RSSI related to the different locations, while the BLE Tag is on the instep. (a) Shows the time of the runner on top of the mat. (b) Shows the time at which the biggest RSSI was received.
Figure 15.
The dynamic experiment to test the RSSI related to the different locations, while the BLE Tag is on the instep. (a) Shows the time of the runner on top of the mat. (b) Shows the time at which the biggest RSSI was received.

Figure 16.
The RSSI on the BLE Receiver related to the receiving time.

Figure 17.
The dynamic experiment of three sets of MAT when a BLE Tag is on the runner’s chest.

Figure 18.
Four runners with a BLE Tag on their respective chests ran through the three sets of MAT one by one.
Figure 18.
Four runners with a BLE Tag on their respective chests ran through the three sets of MAT one by one.

Figure 19.
Four runners with a BLE Tag on their respective insteps ran through the three sets of MAT one by one.
Figure 19.
Four runners with a BLE Tag on their respective insteps ran through the three sets of MAT one by one.

Figure 20.
Runners with 20 different BLE Tag configurations, running through three sets of MAT.

Figure 21.
The time synchronization experiment assisted by PPS (pulse-per-second) of GPS (global positioning system).
Figure 21.
The time synchronization experiment assisted by PPS (pulse-per-second) of GPS (global positioning system).

Figure 22.
The time synchronization experiment with a distance of 15 km.

Figure 23.
Comparison of synchronized experiments with −1 ms and −2 ms corrections.

Figure 24.
Six BLE Tags working time experiment recorded using six CR2032 batteries.


Table 1.
One dynamic experiment in which the BLE Tag was on the chest.
| Received Data from BLE Receiver | RSSI | Timing (MM:SS.ms) |
|---|---|---|
| 001c97168a63930d2cebf32510551 | −93 | 25:10.551 |
| 001c97168a63930f2cebf32510607 | −93 | 25:10.607 |
| 001c97168a6387162cebf32510747 | −87 | 25:10.747 |
| 001c97168a6393192cebf32510800 | −93 | 25:10.800 |
| 001c97168a63931a2cebf32510831 | −93 | 25:10.831 |
| 001c97168a63871c2cebf32510861 | −87 | 25:10.861 |
| 001c97168a6393202cebf32510940 | −93 | 25:10.940 |
| 001c97168a6393222cebf32510995 | −93 | 25:10.995 |
| 001c97168a6387242cebf32511023 | −87 | 25:11.023 |
| 001c97168a6387252cebf32511048 | −87 | 25:11.048 |
| 001c97168a6381272cebf32511097 | −81 | 25:11.097 |
| 001c97168a6387292cebf32511124 | −87 | 25:11.124 |
| 001c97168a63872a2cebf32511154 | −87 | 25:11.154 |
Table 2.
The dynamic experiment when the Tx power of the BLE Tag on the chest is set at Level 3.
| On Chest Tx Level 3 | Passing Time (mm:ss.ms) | RSSI Max Time (mm:ss.ms) | Time Difference |
|---|---|---|---|
| Run 1 | 31:06.972 | 31:06.903 | −69 ms |
| Run 2 | 31:50.393 | 31:50.320 | −73 ms |
| Run 3 | 32:38.049 | 32:37.645 | −404 ms |
| Run 4 | 33:00.558 | 33:00.510 | −48 ms |
| Run 5 | 33:23.203 | 33:23.118 | −85 ms |
| Run 6 | 03:11.832 | 03:11.741 | −91 ms |
| Run 7 | 03:40.135 | 03:39.702 | −433 ms |
| Run 8 | 04:03.985 | 04:03.643 | −342 ms |
| Run 9 | 04:23.866 | 04:23.780 | −86 ms |
| Run 10 | 04:46.991 | 04:46.923 | −68 ms |
| Run 11 | 05:07.672 | 05:07.308 | −364 ms |
| Run 12 | 05:32.707 | 05:32.631 | −76 ms |
| Run 13 | 05:56.183 | 05:56.120 | −63 ms |
| Run 14 | 06:15.596 | 06:15.464 | −132 ms |
| Run 15 | 06:34.881 | 06:34.510 | −371 ms |
| Run 16 | 06:52.639 | 06:52.587 | −52 ms |
| Run 17 | 07:11.363 | 07:11.075 | −288 ms |
| Run 18 | 07:30.717 | 07:30.644 | −73 ms |
Table 3.
The dynamic experiment when the Tx power of the BLE Tag on the chest is set at Level 4.
| On Chest Tx Level 4 | Passing Time (mm:ss.ms) | RSSI Max Time (mm:ss.ms) | Time Difference |
|---|---|---|---|
| Run 1 | 18:09.802 | 18:09.774 | −28 ms |
| Run 2 | 19:42.485 | 19:42.397 | −88 ms |
| Run 3 | 20:22.244 | 20:22.190 | −54 ms |
| Run 4 | 20:49.133 | 20:49.005 | −128 ms |
| Run 5 | 21:26.809 | 21:26.670 | −139 ms |
| Run 6 | 21:59.378 | 21:59.326 | −52 ms |
| Run 7 | 22:35.270 | 22:35.220 | −50 ms |
| Run 8 | 23:04.321 | 23:04.194 | −127 ms |
| Run 9 | 23:33.283 | 23:33.112 | −171 ms |
| Run 10 | 24:02.906 | 24:02.858 | −48 ms |
| Run 11 | 25:11.154 | 25:11.097 | −57 ms |
| Run 12 | 25:39.325 | 25:39.251 | −74 ms |
| Run 13 | 26:08.478 | 26:08.177 | −301 ms |
| Run 14 | 26:40.792 | 26:40.712 | −80 ms |
| Run 15 | 27:30.097 | 27:30.045 | −52 ms |
| Run 16 | 28:06.836 | 28:06.778 | −58 ms |
| Run 17 | 28:48.745 | 28:48.718 | −27 ms |
| Run 18 | 29:35.930 | 29:35.849 | −81 ms |
Table 4.
The dynamic experiment when the Tx power of the BLE Tag on the chest is set at Level 5.
| On Chest Tx Level 5 | Passing Time (mm:ss.ms) | RSSI Max Time (mm:ss.ms) | Time Difference |
|---|---|---|---|
| Run 1 | 07:28.039 | 07:28.066 | 27 ms |
| Run 2 | 09:01.095 | 09:01.014 | −81 ms |
| Run 3 | 00:39.815 | 00:39.759 | −56 ms |
| Run 4 | 01:05.709 | 01:05.794 | 85 ms |
| Run 5 | 01:36.125 | 01:35.985 | −140 ms |
| Run 6 | 01:57.592 | 01:57.300 | −292 ms |
| Run 7 | 02:20.510 | 02:20.325 | −185 ms |
| Run 8 | 02:40.529 | 02:40.504 | −25 ms |
| Run 9 | 03:00.786 | 03:00.671 | −115 ms |
| Run 10 | 03:27.269 | 03:27.217 | −52 ms |
| Run 11 | 03:58.143 | 03:58.090 | −53 ms |
| Run 12 | 04:24.276 | 04:24.224 | −52 ms |
| Run 13 | 04:46.854 | 04:46.717 | −137 ms |
| Run 14 | 05:09.454 | 05:09.349 | −105 ms |
| Run 15 | 05:35.028 | 05:34.941 | −87 ms |
| Run 16 | 05:56.379 | 05:56.141 | −238 ms |
| Run 17 | 06:19.792 | 06:19.738 | −54 ms |
| Run 18 | 06:42.226 | 06:41.998 | −228 ms |
Table 5.
Comparison of different Tx power levels with the BLE Tag on the chest.
| Place on Chest | Tx Power Level 3 | Tx Power Level 4 | Tx Power Level 5 |
|---|---|---|---|
| The MAX of Time Difference | −48 | −27 | 85 |
| The MIN of Time Difference | −433 | −301 | −292 |
| Mean, AVERAGE() | −173.22 | −89.72 | −99.33 |
| The Standard Deviation | 140.59 | 64.21 | 91.61 |
Table 6.
One dynamic experiment in which the BLE Tag was on the chest.
| Received Data from BLE Receiver | RSSI | Timing (MM:SS.ms) |
|---|---|---|
| 001c97168a6387534febce4242219 | −87 | 42:42.219 |
| 001c97168a6387554febce4242246 | −87 | 42:42.246 |
| 001c97168a63875a4febce4242366 | −87 | 42:42.366 |
| 001c97168a63875c4febce4242393 | −87 | 42:42.393 |
| 001c97168a63875d4febce4242423 | −87 | 42:42.423 |
| 001c97168a63875f4febce4242453 | −87 | 42:42.453 |
| 001c97168a6387604febce4242483 | −87 | 42:42.483 |
| 001c97168a6381624febce4242511 | −81 | 42:42.511 |
| 001c97168a6381634febce4242537 | −81 | 42:42.537 |
| 001c97168a6381644febce4242566 | −81 | 42:42.566 |
| 001c97168a6381674febce4242623 | −81 | 42:42.623 |
| 001c97168a6381694febce4242653 | −81 | 42:42.653 |
| 001c97168a63756a4febce4242680 | −75 | 42:42.680 |
| 001c97168a63756b4febce4242708 | −75 | 42:42.708 |
| 001c97168a63756d4febce4242737 | −75 | 42:42.737 |
| 001c97168a63756e4febce4242763 | −75 | 42:42.763 |
| 001c97168a63756f4febce4242791 | −75 | 42:42.791 |
| 001c97168a6369724febce4242846 | −69 | 42:42.846 |
| 001c97168a6369734febce4242873 | −69 | 42:42.873 |
| 001c97168a6375754febce4242899 | −75 | 42:42.899 |
| 001c97168a6387774febce4242951 | −87 | 42:42.951 |
Table 7.
The dynamic experiment when the Tx power of the BLE Tag on the instep is set at Level 3.
| On Instep Tx Level 3 | Passing Time (mm:ss.ms) | RSSI Max Time (mm:ss.ms) | Time Difference |
|---|---|---|---|
| Run 1 | 15:31.843 | 15:31.820 | −23 ms |
| Run 2 | 15:52.057 | 15:51.969 | −88 ms |
| Run 3 | 16:11.305 | 16:11.467 | 162 ms |
| Run 4 | 16:28.681 | 16:28.867 | 186 ms |
| Run 5 | 16:46.907 | 16:47.129 | 222 ms |
| Run 6 | 17:04.336 | 17:04.280 | −56 ms |
| Run 7 | 17:26.137 | 17:26.168 | 31 ms |
| Run 8 | 17:44.774 | 17:44.936 | 162 ms |
| Run 9 | 18:03.881 | 18:04.010 | 129 ms |
| Run 10 | 18:23.226 | 18:23.422 | 196 ms |
| Run 11 | 18:39.643 | 18:39.669 | 26 ms |
| Run 12 | 18:59.678 | 18:59.726 | 48 ms |
| Run 13 | 19:19.453 | 19:19.510 | 57 ms |
| Run 14 | 19:39.730 | 19:39.785 | 55 ms |
| Run 15 | 20:00.773 | 20:00.995 | 222 ms |
| Run 16 | 20:19.660 | 20:19.574 | −86 ms |
| Run 17 | 20:55.295 | 20:55.516 | 221 ms |
| Run 18 | 21:13.274 | 21:13.323 | 49 ms |
Table 8.
The dynamic experiment when the Tx power of the BLE Tag on the instep is set at Level 4.
| On Instep Tx Level 4 | Passing Time | RSSI Max Time | Time Difference |
|---|---|---|---|
| Run 1 | 36:34.404 | 36:34.329 | −75 ms |
| Run 2 | 38:06.331 | 38:06.269 | −62 ms |
| Run 3 | 38:49.538 | 38:49.512 | −26 ms |
| Run 4 | 39:22.899 | 39:22.848 | −51 ms |
| Run 5 | 39:52.109 | 39:52.136 | 27 ms |
| Run 6 | 40:22.510 | 40:22.722 | 212 ms |
| Run 7 | 40:51.778 | 40:51.916 | 138 ms |
| Run 8 | 41:20.363 | 41:20.304 | −59 ms |
| Run 9 | 41:43.551 | 41:43.500 | −51 ms |
| Run 10 | 42:08.160 | 42:08.133 | −27 ms |
| Run 11 | 42:42.708 | 42:42.873 | 165 ms |
| Run 12 | 43:10.598 | 43:10.571 | −27 ms |
| Run 13 | 43:37.672 | 43:37.672 | 0 ms |
| Run 14 | 44:02.936 | 44:03.209 | 273 ms |
| Run 15 | 44:26.617 | 44:26.617 | 0 ms |
| Run 16 | 44:49.645 | 44:49.786 | 141 ms |
| Run 17 | 45:11.313 | 45:11.553 | 240 ms |
| Run 18 | 45:37.601 | 45:37.732 | 131 ms |
Table 9.
The dynamic experiment when the Tx power of the BLE Tag on the instep is set at Level 5.
| On Instep Tx Level 5 | Passing Time (mm:ss.ms) | RSSI Max Time (mm:ss.ms) | Time Difference |
|---|---|---|---|
| Run 1 | 01:05.524 | 01:05.438 | −86 ms |
| Run 2 | 01:27.805 | 01:27.834 | 29 ms |
| Run 3 | 02:09.519 | 02:09.436 | −83 ms |
| Run 4 | 02:31.878 | 02:32.099 | 221 ms |
| Run 5 | 02:53.801 | 02:53.719 | −82 ms |
| Run 6 | 03:18.043 | 03:18.215 | 172 ms |
| Run 7 | 03:42.669 | 03:42.590 | −79 ms |
| Run 8 | 04:18.299 | 04:18.271 | −28 ms |
| Run 9 | 04:41.760 | 04:41.645 | −115 ms |
| Run 10 | 05:07.616 | 05:07.831 | 215 ms |
| Run 11 | 05:30.455 | 05:30.653 | 198 ms |
| Run 12 | 05:51.998 | 05:52.265 | 267 ms |
| Run 13 | 06:19.755 | 06:19.643 | −112 ms |
| Run 14 | 06:41.323 | 06:41.214 | −109 ms |
| Run 15 | 07:09.707 | 07:09.620 | −87 ms |
| Run 16 | 07:30.167 | 07:30.417 | 250 ms |
| Run 17 | 07:53.473 | 07:53.657 | 184 ms |
| Run 18 | 08:16.632 | 08:16.515 | −117 ms |
Table 10.
Comparison of different Tx power levels with the BLE Tag on the instep. STDEVPA(), calculate function of standard deviation.
Table 10.
Comparison of different Tx power levels with the BLE Tag on the instep. STDEVPA(), calculate function of standard deviation.
| Place on Instep | Tx Power Level 3 | Tx Power Level 4 | Tx Power Level 5 |
|---|---|---|---|
| The MAX of Time Difference | 222 | 273 | 267 |
| The MIN of Time Difference | −88 | −75 | −117 |
| Mean, AVERAGE() | 84.06 | 52.72 | 35.44 |
| The Standard Deviation, STDEVPA() | 103.76 | 113.37 | 148.45 |
Table 11.
The dynamic experiment of three sets of MAT when a BLE Tag is on the runner’s chest.
| On Chest Tx Level 4 | MAT-A Time Difference | MAT-B Time Difference | MAT-C Time Difference | AVG. |
|---|---|---|---|---|
| Run 1 | 31 ms | 49 ms | 113 ms | 64.3 ms |
| Run 2 | 89 ms | 50 ms | 51 ms | 63.3 ms |
| Run 3 | 52 ms | 74 ms | 146 ms | 90.6 ms |
| Run 4 | 52 ms | 28 ms | 25 ms | 35 ms |
| Run 5 | 161 ms | 24 ms | 110 ms | 65 ms |
| Run 6 | 28 ms | 25 ms | 77 ms | 43.3 ms |
| Run 7 | 45 ms | 26 ms | 130 ms | 67 ms |
| Run 8 | 57 ms | 55 ms | 31 ms | 47.6 ms |
| Run 9 | 115 ms | 31 ms | 81 ms | 75.6 ms |
| Run 10 | 55 ms | 56 ms | 25 ms | 45.3 ms |
| MAX | 161 | 74 | 146 | 98.33 |
| MIN | 28 | 24 | 25 | 35.00 |
| AVERAGE | 68.50 | 41.80 | 78.90 | 63.07 |
| STDEVPA | 39.49 | 16.39 | 42.59 | 19.77 |
Table 12.
The dynamic experiment of three sets of MAT when the BLE Tag is on the runner’s instep.
| On Instep Tx Level 4 | MAT-A Time Difference | MAT-B Time Difference | MAT-C Time Difference | AVG. |
|---|---|---|---|---|
| Run 1 | −83 ms | 58 ms | −111 ms | −45.33 ms |
| Run 2 | −73 ms | 30 ms | −111 ms | −51.33 ms |
| Run 3 | −85 ms | 85 ms | −153 ms | −51.00 ms |
| Run 4 | −81 ms | 25 ms | −57 ms | −37.67 ms |
| Run 5 | 88 ms | 29 ms | 31 ms | 49.33 ms |
| Run 6 | 28 ms | −52 ms | 25 ms | 0.33 ms |
| Run 7 | 55 ms | −49 ms | 29 ms | 11.67 ms |
| Run 8 | −31 ms | −81 ms | 30 ms | −27.33 ms |
| Run 9 | −164 ms | −113 ms | −59 ms | −112.00 ms |
| Run 10 | 26 ms | −29 ms | 26 ms | 7.67 ms |
| MAX | 88 | 85 | 31 | 49.33 |
| MIN | −164 | −113 | −153 | −112.00 |
| AVERAGE | −32.00 | −9.70 | −35.00 | −25.57 |
| STDEVPA | 74.73 | 61.07 | 68.22 | 42.54 |
Table 13.
Comparison between one MAT and three sets of MAT.
| Tx Power Level 4 | 1 MAT Tag on Chest | 1 MAT Tag on Instep | 3 Sets of MAT Tag on Chest | 3 Sets of MAT Tag on Instep |
|---|---|---|---|---|
| MAX | −27 | 273 | 98.33 | 49.33 |
| MIN | −301 | −75 | 35.00 | −112.00 |
| AVERAGE | −89.61 | 51.28 | 63.07 | −25.57 |
| STDEVPA | 64.21 | 112.05 | 19.77 | 42.54 |
Table 14.
The experiment in which two runners with a BLE Tag on their respective chests ran through three sets of MAT.
Table 14.
The experiment in which two runners with a BLE Tag on their respective chests ran through three sets of MAT.
| On Chest Tx Level 4 | MAT-A Runner-A | MAT-B Runner-A | MAT-C Runner-A | AVG Runner-A | MAT-A Runner-B | MAT-B Runner-B | MAT-C Runner-B | AVG Runner-B |
|---|---|---|---|---|---|---|---|---|
| Run 1 | 57 | 26 | 28 | 37.00 | 25 | 132 | 62 | 73.00 |
| Run 2 | 81 | −79 | −168 | −55.33 | 161 | 77 | 133 | 123.67 |
| Run 3 | 77 | 41 | 26 | 48.00 | 72 | 24 | 30 | 42.00 |
| Run 4 | 113 | 100 | 79 | 97.33 | 31 | 68 | 101 | 66.67 |
| Run 5 | 55 | 59 | 27 | 47.00 | 103 | 120 | 57 | 93.33 |
| MAX | 113 | 100 | 79 | 97.33 | 161 | 132 | 133 | 123.67 |
| MIN | 55 | −79 | −168 | −55.33 | 25 | 24 | 30 | 42.00 |
| AVERAGE | 76.60 | 29.40 | −1.60 | 34.80 | 78.40 | 84.20 | 76.60 | 79.73 |
| STDEVPA | 20.95 | 59.59 | 85.61 | 49.72 | 50.13 | 38.74 | 36.18 | 27.40 |
| Total STDEVPA | 46.01 | |||||||
Table 15.
The experiment in which two runners with a BLE Tag on their respective insteps ran through three sets of MAT.
Table 15.
The experiment in which two runners with a BLE Tag on their respective insteps ran through three sets of MAT.
| On Instep Tx Level 4 | MAT-A Runner-A | MAT-B Runner-A | MAT-C Runner-A | AVG Runner-A | MAT-A Runner-B | MAT-B Runner-B | MAT-C Runner-B | AVG Runner-B |
|---|---|---|---|---|---|---|---|---|
| Run 1 | 54 | −120 | 27 | −13.00 | 105 | −107 | −53 | −18.33 |
| Run 2 | 86 | −174 | 76 | −4.00 | −80 | 57 | −141 | −54.67 |
| Run 3 | 23 | −102 | −54 | −44.33 | 82 | −51 | 29 | 20.00 |
| Run 4 | −81 | 80 | −51 | −17.33 | 88 | −53 | 83 | 39.33 |
| Run 5 | −50 | 25 | −169 | −64.67 | 30 | 24 | −104 | −16.67 |
| MAX | 86 | 80 | 76 | −4.00 | 105 | 57 | 83 | 39.33 |
| MIN | −81 | −174 | −169 | −64.67 | −80 | −107 | −141 | −54.67 |
| AVERAGE | 6.40 | −58.20 | −34.20 | −28.67 | 45.00 | −26.00 | −37.20 | −6.07 |
| STDEVPA | 62.76 | 95.05 | 83.35 | 22.47 | 67.33 | 58.83 | 82.85 | 32.76 |
| Total STDEVPA | 30.28 | |||||||
Table 16.
The experiment in which four runners with a BLE Tag on their respective insteps ran through three sets of MAT.
Table 16.
The experiment in which four runners with a BLE Tag on their respective insteps ran through three sets of MAT.
| On Chest Tx Level 4 | MAT-A Runner-A | MAT-B Runner-A | MAT-C Runner-A | AVG Runner-A | MAT-A Runner-B | MAT-B Runner-B | MAT-C Runner-B | AVG Runner-B |
| Run 1 | 88 | 50 | 83 | 73.67 | 63 | 86 | 83 | 77.33 |
| Run 2 | 104 | 85 | 86 | 91.67 | 77 | 139 | 126 | 114.00 |
| Run 3 | 136 | 53 | 52 | 80.33 | 141 | 63 | 51 | 85.00 |
| Run 4 | 124 | 57 | 77 | 86.00 | 86 | 83 | 52 | 73.67 |
| Run 5 | 85 | 92 | 87 | 88.00 | 59 | 80 | 84 | 74.33 |
| MAX | 136 | 92 | 87 | 91.67 | 141 | 139 | 126 | 114.00 |
| MIN | 85 | 50 | 52 | 73.67 | 59 | 63 | 51 | 73.67 |
| AVERAGE | 107.40 | 67.40 | 77.00 | 83.93 | 85.20 | 90.20 | 79.20 | 84.87 |
| STDEVPA | 19.92 | 17.51 | 12.98 | 6.31 | 29.53 | 25.67 | 27.43 | 15.11 |
| On Chest Tx Level 4 | MAT-A Runner-C | MAT-B Runner-C | MAT-C Runner-C | AVG Runner-C | MAT-A Runner-D | MAT-B Runner-D | MAT-C Runner-D | AVG Runner-D |
| Run 1 | 108 | 81 | 104 | 97.67 | 135 | 57 | 55 | 82.33 |
| Run 2 | 80 | 103 | 63 | 82.00 | 79 | 92 | 59 | 76.67 |
| Run 3 | 84 | 29 | 61 | 58.00 | 26 | 52 | 49 | 42.33 |
| Run 4 | 108 | 62 | 80 | 83.33 | 84 | 57 | 82 | 74.33 |
| Run 5 | 99 | 91 | 92 | 94.00 | 54 | 80 | 85 | 73.00 |
| MAX | 108 | 103 | 104 | 97.67 | 135 | 92 | 85 | 82.33 |
| MIN | 80 | 29 | 61 | 58.00 | 26 | 52 | 49 | 42.33 |
| AVERAGE | 95.80 | 73.20 | 80.00 | 83.00 | 75.60 | 67.60 | 66.00 | 69.73 |
| STDEVPA | 11.81 | 25.86 | 16.55 | 13.87 | 36.16 | 15.60 | 14.67 | 14.07 |
| Total STDEVPA | 14.24 | |||||||
Table 17.
The experiment in which four runners with a BLE Tag on their respective chests ran through three sets of MAT.
Table 17.
The experiment in which four runners with a BLE Tag on their respective chests ran through three sets of MAT.
| On Instep Tx Level 4 | MAT-A Runner-A | MAT-B Runner-A | MAT-C Runner-A | AVG Runner-A | MAT-A Runner-B | MAT-B Runner-B | MAT-C Runner-B | AVG Runner-B |
| Run 1 | 81 | −146 | 49 | −5.33 | −55 | 110 | −89 | −11.33 |
| Run 2 | 54 | −87 | 78 | 15.00 | 53 | −161 | 100 | −2.67 |
| Run 3 | 161 | 74 | 89 | 108.00 | 82 | 81 | 69 | 77.33 |
| Run 4 | 30 | −63 | 60 | 9.00 | −132 | 29 | −134 | −79.00 |
| Run 5 | 83 | −94 | 80 | 23.00 | −109 | 84 | −153 | −59.33 |
| MAX | 161 | 74 | 89 | 108.00 | 82 | 110 | 100 | 77.33 |
| MIN | 30 | −146 | 49 | −5.33 | −132 | −161 | −153 | −79.00 |
| AVERAGE | 81.80 | −63.20 | 71.20 | 29.93 | −32.20 | 28.60 | −41.40 | −15.00 |
| STDEVPA | 44.12 | 73.75 | 14.55 | 40.12 | 85.65 | 98.38 | 105.33 | 54.32 |
| On Instep Tx Level 4 | MAT-A Runner-C | MAT-B Runner-C | MAT-C Runner-C | AVG Runner-C | MAT-A Runner-D | MAT-B Runner-D | MAT-C Runner-D | AVG Runner-D |
| Run 1 | 115 | −89 | 85 | 37.00 | 49 | 157 | 79 | 95.00 |
| Run 2 | 115 | 88 | 54 | 85.67 | 137 | 26 | 56 | 73.00 |
| Run 3 | 102 | 56 | 75 | 77.67 | 86 | 102 | 53 | 80.33 |
| Run 4 | −25 | 73 | −81 | −11.00 | −43 | 77 | 87 | 40.33 |
| Run 5 | −31 | 74 | −115 | −24.00 | −56 | 85 | −88 | −19.67 |
| MAX | 115 | 88 | 85 | 85.67 | 137 | 157 | 87 | 95.00 |
| MIN | −31 | −89 | −115 | −24.00 | −56 | 26 | −88 | −19.67 |
| AVERAGE | 55.20 | 40.40 | 3.60 | 33.07 | 34.60 | 89.40 | 37.40 | 53.80 |
| STDEVPA | 68.12 | 65.49 | 84.25 | 44.65 | 74.25 | 42.24 | 64.04 | 40.86 |
| Total STDEVPA | 51.82 | |||||||
Table 18.
Comparison of experiments with different numbers of runners, and different configurations of BLE Tags, in which runners ran through one or three sets of MAT.
Table 18.
Comparison of experiments with different numbers of runners, and different configurations of BLE Tags, in which runners ran through one or three sets of MAT.
| BLE Tag | 1 man | 1 man | 1 man | 1 man | 2 men | 2 men | 4 men | 4 men |
| Tx Power Level 4 | 1 MAT Tag on chest | 1 MAT Tag on instep | 3 MATs Tag on chest | 3 MATs Tag on instep | 3 MATs Tag on chest | 3 MATs Tag on instep | 3 MATs Tag on chest | 3 MATs Tag on instep |
| MAX | −27 | 273 | 98.33 | 49.33 | 123.67 | 39.33 | 114.00 | 108.00 |
| MIN | −301 | −75 | 35.00 | −112.00 | −55.33 | −64.67 | 42.33 | −79.00 |
| AVERAGE | −89.61 | 51.28 | 63.07 | −25.57 | 57.27 | −17.37 | 80.38 | 25.45 |
| STDEVPA | 64.21 | 112.05 | 19.77 | 42.54 | 46.01 | 30.28 | 14.24 | 51.82 |
| 6 times STDEVPA | ±192.63 | ±336.15 | ±59.31 | ±127.62 | ±138.03 | ±90.84 | ±42.72 | ±155.46 |
Table 19.
The experiment in which 20 BLE Tags passed through three sets of MAT.
| Tag on Chest or at Back | MAT-A | MAT-B | MAT-C | Get Passing Time |
| Run 1 | 20 | 20 | 20 | 20 |
| Run 2 | 20 | 20 | 20 | 20 |
| Run 3 | 20 | 20 | 20 | 20 |
| Run 4 | 20 | 20 | 20 | 20 |
| Run 5 | 20 | 20 | 20 | 20 |
| Run 6 | 20 | 20 | 20 | 20 |
| Tag on Chest or on Instep | MAT-A | MAT-B | MAT-C | Get Passing Time |
| Run 1 | 20 | 20 | 20 | 20 |
| Run 2 | 20 | 20 | 20 | 20 |
| Run 3 | 20 | 20 | 20 | 20 |
| Run 4 | 20 | 20 | 20 | 20 |
| Run 5 | 20 | 20 | 20 | 20 |
| Run 6 | 20 | 20 | 19 | 20 |
© 2019 by the authors. Licensee MDPI, Basel, Switzerland. This article is an open access article distributed under the terms and conditions of the Creative Commons Attribution (CC BY) license (http://creativecommons.org/licenses/by/4.0/).
Share and Cite
MDPI and ACS Style
Sun, C.-I.; Huang, J.-T.; Weng, S.-C.; Chien, M.-F. City Marathon Active Timing System Using Bluetooth Low Energy Technology. Electronics 2019, 8, 252. https://doi.org/10.3390/electronics8020252
AMA Style
Sun C-I, Huang J-T, Weng S-C, Chien M-F. City Marathon Active Timing System Using Bluetooth Low Energy Technology. Electronics. 2019; 8(2):252. https://doi.org/10.3390/electronics8020252
Chicago/Turabian StyleSun, Chun-I, Jung-Tang Huang, Shih-Chi Weng, and Meng-Fan Chien. 2019. "City Marathon Active Timing System Using Bluetooth Low Energy Technology" Electronics 8, no. 2: 252. https://doi.org/10.3390/electronics8020252
Note that from the first issue of 2016, this journal uses article numbers instead of page numbers. See further details here.