Fast Depth Intra Mode Decision Based on Mode Analysis in 3D Video Coding


School of Intelligent Mechatronics Engineering, Sejong University, Seoul 05006, Korea
Electronics 2019, 8(4), 430; https://doi.org/10.3390/electronics8040430
Submission received: 12 March 2019
/
Revised: 4 April 2019
/
Accepted: 11 April 2019
/
Published: 13 April 2019
(This article belongs to the Special Issue Digital Media Processing for Immersive Communications)
Abstract
:Multiview video plus depth (MVD), which consists of a texture image and its associated depth map, has been introduced as a 3D video format, and 3D video coding, such as 3D-HEVC, was developed to efficiently compress this MVD data. However, this requires high encoding complexity because of the additional depth coding. In particular, intra coding using various prediction modes is very complicated. To reduce the complexity, we propose a fast depth intra mode decision method based on mode analysis. The proposed method adaptively reduces the number of original candidate modes in a mode decision process. Experimental results show that the proposed method achieves high performance in terms of the complexity reduction.
1. Introduction
To efficiently transmit high quality video contents over a limited bandwidth, HEVC [1] was developed by the Joint Collaborative Team on Video Coding (JCT-VC), which was established by the ITU-T Video Coding Experts Group (VCEG) and the ISO/IEC Moving Picture Experts Group (MPEG). Since it includes lots of advanced techniques, such as advanced motion vector prediction modes for inter coding and various angular prediction modes for intra coding, very high coding efficiency is obtained. In particular, a rate-distortion (RD) optimization process [2] for the various intra prediction modes provides significantly high coding performance. However, to determine the optimum intra prediction mode, the RD optimization process needs all encoding processes, including transform, quantization, inverse quantization, inverse transform, and entropy coding for each mode. After comparison of the encoding results, the optimum mode maximizing the performance is selected among all possible candidate modes. As a result, the mode decision process with RD optimization places a very high computational burden on HEVC encoders.
3D video coding uses a multiview video plus depth (MVD) format, which consists of a texture image and its corresponding depth map, to reduce 3D data size. Figure 1 shows an example of the MVD format in a Newspaper test sequence. A texture image represents the brightness of an object, whereas a depth map indicates the distance between an object and a camera as a grey scale image. In general, the depth map is used to generate virtual texture views at arbitrary viewpoints, based on a depth image-based rendering (DIBR) technique [3]. Thanks to the high coding performance of the HEVC standard, 3D-HEVC [4] was developed by the Joint Collaborative Team on 3D Video Coding Extension Development (JCT-3V) to efficiently compress this MVD format. High coding performance is provided by using a high correlation between the texture image and the depth map in MVD, but this requires drastically high encoding complexity because of the additional depth coding. In particular, the intra prediction mode decision processes with the RD optimization in both texture and depth coding are very complicated. In addition, 3D-HEVC adopted several advanced prediction methods for the efficient depth intra coding, such as a depth modeling mode (DMM) [5], generic segment-wise DC coding (SDC) [6], and a depth intra skip mode (DIS) [7], which also cause some complexity.
Many fast encoding algorithms were developed to reduce the complexity of the intra coding [8,9,10,11,12,13,14,15] and inter coding [16,17,18] in 3D-HEVC. In particular, there are two research categories to reduce the encoding complexity of the mode decision process in the depth intra coding [8,9,10,11,12,13,14,15]. The first category is to optimize the advanced depth prediction methods and adaptively skip them. Most of fast algorithms in this category were developed to simplify DMM, because it requires much more complicated operations than SDC and DIS. For example, the optimum DMM wedgelet is determined through an exhaustive search process [5]. Fast algorithms proposed in [8,9] adaptively skip this full DMM search in flat and smooth regions. A fast algorithm proposed in [10] simplifies wedgelet candidates, based on the corresponding texture information. In [11], some wedgelet partitions are skipped, based on the information of rough mode decision (RMD). A fast algorithm proposed in [12] reduces the encoding complexity by employing a simplified edge detector. The gradient-based mode filter in [13] is applied to borders of encoded blocks and determines the best positions to reduce the DMM-related mode decision process. A fast algorithm proposed in [14] selectively skips unnecessary DMM processes, based on a simple edge classification.
The second category is to reduce the number of original candidate modes in the original mode decision process, which include planar, DC, and 33 angular prediction modes. Unlike the texture image, the depth map mainly contains homogenous regions and sharp edges at object boundaries. In general, the homogenous areas are compressed with the DC and planar modes. The DC mode uses an average value of adjacent pixels in the prediction, whereas the planar mode employs a weighted average. The sharp edges are usually compressed with the horizontal and vertical modes, which do not need interpolation filtering. Based on this observation, a fast conventional HEVC intra mode decision and adaptive DMM search method (FHEVCI+ADMMS), which was recently developed for the fast intra mode decision [15], only uses the planar, DC, horizontal, and vertical modes in the mode decision process, instead of using the 35 different modes. Also, when the optimum mode among these four modes is the planar or DC mode, DMM is skipped. Even though this method is very simple, it significantly reduces the encoding complexity by reducing the number of candidate modes in the mode decision process, with negligible coding loss. However, based on our analysis, it was observed that there is still room for improvement in simplifying the original mode decision process.
In addition, since the advanced depth prediction methods, such as DMM, SDC, and DIS, have their disabling flags, they can be turned off in real-time applications. On the contrary, there is no flag that can adaptively enable or disable some of the original intra prediction modes. Hence, the research on the second category is very important. In this paper, we performed some useful mode analysis on depth coding, and then generated a mode pattern table based on the analysis. The proposed fast intra mode decision method adaptively reduces the number of candidate modes in the original mode decision process by employing the mode pattern table. Experimental results show that the proposed method outperforms the FHEVCI+ADMMS method, in terms of complexity reduction.
This paper is organized as follows. Section 2 explains an original intra mode decision method in 3D-HEVC and the FHEVCI+ADMMS method in detail. Section 3 shows results of the mode analysis and proposes our fast depth intra mode decision method. Section 4 discusses experimental results including the coding performance and the encoding complexity. Section 5 summarizes this study.
2. Related Work
2.1. Original Depth Intra Mode Decision in 3D-HEVC
The original intra prediction mode decision process determines the optimum mode among the planar, DC, and 33 angular modes [19]. To determine the optimum prediction mode in 3D-HEVC depth coding, the RMD process first calculates the sum of the absolute transformed difference (SATD) of each mode. Based on this SATD cost, a small number of prediction modes are inserted to a RD list. The number of modes selected in RMD depends on the block size. For instance, if the width and height of the block are greater than or equal to sixteen, three modes are added to the RD list. If the width and height are less than sixteen, eight modes are added to the list. Second, the three most probable modes (MPMs) are added to the list. In general, MPMs include the prediction modes of left and above blocks around the current block, and one special mode which is determined according to a predefined rule. For example, if the left and above blocks are compressed with two different modes, the MPMs are set as the two neighboring block modes, and the planar mode as the special mode. If one of the two neighboring modes is planar mode, the special mode is set as DC mode. If the two neighboring modes are the planar and DC modes, the vertical mode is used instead. Next, in order to efficiently predict sharp edges, DMM is added to the list when the minimum SATD cost mode is not the planar mode. Finally, all the candidate modes in the list are compared to each other during the RD optimization. The optimum mode becomes the mode having the minimum RD cost. Figure 2 shows a flowchart of the original depth intra mode decision method in 3D-HEVC.
2.2. State-Of-The-Art Algorithm for Fast Depth Intra Mode Decision
Since a depth map is much simpler than a texture image, as shown in Figure 1, most regions in the depth map are compressed using the planar, DC, horizontal, and vertical prediction modes, which are less complicated than the other modes. Considering the characteristic of the depth map, the FHEVCI+ADMMS method was proposed to reduce the number of original candidate modes and simplify DMM [15]. First of all, the FHEVCI+ADMMS method calculates the RD costs of the planar, DC, horizontal, vertical modes, and then finds the suboptimum mode having the minimum RD cost. Because it does not consider the other 31 angular prediction modes, the computational complexity of their RD cost calculation processes is not required. In addition, it completely ignores RMD and MPM, so the complexity of the SATD comparison and the MPM list construction is avoided. Second, it skips DMM, when the suboptimum mode is the planar or DC mode. DMM consists of two different submodes, which are the explicit wedgelet signalization and intercomponent prediction modes [5]. The explicit wedgelet signalization mode searches the optimum wedgelet partition, and then transmits the partition information. The intercomponent prediction mode predicts a contour partition, based on the texture information. When the suboptimum mode is the horizontal or vertical mode, the RD cost of DMM is calculated with some simplified wedgelet search. Finally, the RD costs of DMM and the suboptimum mode are compared with each other, and then the optimum mode is determined to be the minimum RD cost mode. Since the FHEVCI+ADMMS method only employs the four modes in the original mode decision process and adaptively skips the DMM-related mode decision process, the encoding complexity is significantly reduced. A flowchart of the FHEVCI+ADMMS method is shown in Figure 3.
3. Proposed Method
3.1. Mode Analysis
In order to perform mode analysis in 3D-HEVD, we investigated the computational complexity of both the original and DMM-related mode decision processes. As mentioned in Section 2.1, the original mode decision process is performed in the order of RMD, the MPM list construction, and RD optimization. As mentioned in Section 2.2, The DMM-related mode decision process performs the wedgelet partition search and contour partition prediction modes, and then compares them with the RD optimization. Figure 4 shows the mode decision runtime of each process. In this experiment, we used Poznan_Hall2 and Kendo test sequences with four different quantization parameters (QPs) of 34, 39, 42, and 45. The sequence information and coding options will be discussed in Section 4. It can be observed that the encoding complexity of the original mode decision process is higher than that of the DMM-related mode decision process. In particular, the complexity portion of the original mode decision process is significantly high in the high QP setting. For example, in a Poznan_Hall2 test sequence with QP of 45, the DMM-related encoding time takes about 20% in the overall mode decision process, whereas the encoding time of 80% is required in the original mode decision process. Since the original mode decision process imposes a high computational burden on the 3D-HEVC encoder, we focus on the second research category that reduces the number of original candidate modes.
Figure 5 represents the probability that the optimum prediction mode with the RD optimization is in accordance with the mode having (1) the minimum SATD cost, (2) one of two modes having the first and second minimum costs, and (3) one of three modes having the first, second, and third minimum costs. Since most of areas in the depth map are compressed with the planar, DC, horizontal, and vertical modes, we only considered these four modes. In this experiment, we used Poznan_Hall2, Undo_Dancer, and Shark test sequences with QPs of 39 and 42. As shown in Figure 5, the probability that the minimum SATD cost mode and the optimum mode are the same is relatively low in all the test sequences. For example, the probability is about 80% at a QP of 39 and less than 90% at a QP of 42. However, the probability that two modes having the first and second minimum costs become the optimum mode is greater than or equal to 90%, which indicates the relatively high accuracy. It means that two candidate modes are enough to determine the optimum mode in the mode decision process with the RD optimization. The other test sequences also showed similar results. Therefore, after the SATD cost calculation of the four modes, the proposed method inserts the two modes having the minimum SATD costs into the RD list, and then checks them as the candidate modes. It should be noted that the FHEVCI+ADMMS method directly calculates the RD costs of the planar, DC, horizontal, and vertical modes without the SATD cost calculation. On the other hand, the proposed method compares the RD costs of the two modes, which are the first and second minimum SATD cost modes. Since the proposed method should calculate the SATD costs of the four modes, further efforts are required to reduce the encoding complexity.
3.2. Fast Depth Intra Mode Decision
The proposed method only calculates the SATD costs of the planar, DC, horizontal, and vertical prediction modes, and then adds the first and second minimum cost modes in the RD list. In order to further reduce the encoding complexity, it adaptively reduces the number of candidate modes from two to one. Figure 6 illustrates a correlation between the optimum mode and the minimum SATD cost mode. We used a Poznan_Hall2 sequence with QPs of 39 and 42 in this experiment. When the planar mode is the minimum SATD cost mode (blue), as displayed in Figure 6, the optimum mode is likely to be the planar mode in both QPs. For example, the probability that the planar mode becomes the optimum mode is about 95% and 96% for QPs of 39 and 42, respectively. On the other hand, the probability that the optimum mode is determined to be the DC, horizontal, and vertical modes is drastically low. When the DC mode is the minimum cost mode (green), the probability that the planar and DC modes become the optimum mode is about 53% and 43% with a QP of 39, and about 49% and 46% for a QP of 42, respectively. This suggests that the optimum mode is likely to be the planar or DC mode. When the horizontal mode is the minimum cost mode (orange), the probability that the vertical mode becomes the optimum mode is very low. Similarly, in the case that the vertical mode is the minimum cost mode (yellow), the horizontal mode is most likely not the optimum mode. The other sequences also showed similar results.
Table 1 shows a mode pattern table, which was generated by taking into account the correlation between the optimum mode and the minimum SATD cost mode in Figure 6. In the proposed method, the mode pattern table is used to eliminate the candidate modes in the list. For example, the proposed method adds the first and second minimum cost modes in the RD list, after the SATD cost calculation of the planar, DC, horizontal, and the vertical modes. When the first minimum cost mode is the planar mode, the second minimum cost mode is always eliminated in the list, according to the mode pattern table in Table 1, because the optimum mode is likely to be the planar mode, as displayed in Figure 6 (blue). When the DC mode is the first minimum cost mode, it is eliminated if the second minimum cost mode is one of the horizontal and vertical modes, because the probability that the horizontal and vertical modes become the optimum mode is very low, as shown in Figure 6 (green). However, if it is the planar mode, it remains in the list. Similarly, when the horizontal mode is the first minimum cost mode, it is eliminated if the vertical mode is the second minimum cost mode, and vice versa. Hence, through the adaptive elimination of the second minimum SATD cost mode, the proposed method can reduce the number of candidate modes from two to one. Finally, similar to the mode decision process in 3D-HEVC, the proposed method does not add DMM to the list when the first minimum cost mode is planar. If it is not in planar mode, DMM including the wedgelet signalization and intercomponent prediction modes is added to the list, and is then compared with the original candidate modes through RD optimization. Table 2 shows the nine combinations of the possible candidate modes in the RD list, based on the mode pattern table. If the first minimum SATD cost mode is planar (case 1), the second minimum cost mode is always eliminated and DMM is not added to the list. Otherwise (cases 2 to 9), the second minimum cost mode can be eliminated or remain, but DMM is always added to the list. As a result, the total number of candidate modes for the RD optimization in the proposed method may be one, two, or three, and is strongly dependent on the mode pattern table. Figure 7 presents a flowchart of the proposed depth intra mode decision method using the mode pattern table.
4. Results
The proposed method was implemented on top of a reference software 3D-HTM 14.0. We used eight JCT-3V test sequences with resolutions of 1024 × 768 and 1920 × 1088. Table 3 shows the sequence information. The three view numbers represent indexes of left, center, and right views, and the MVD data for these views is input to 3D-HEVC, as displayed in Figure 8. 3D-HEVC compresses these three views with a P-I-P prediction structure as shown in Figure 9. For example, the center view is encoded as I view, which is called a base view. This base view can be decoded with HEVC because it only performs the inter prediction. On the other hand, both left and right views are encoded as P view using the inter-view prediction. Hence, they are able to use the already encoded views as references in the inter-view prediction. The arrows in Figure 9 show the prediction direction from the reference view into the target view to be compressed. The view synthesis generates six synthesized views by using the three decoded texture images and depth maps, based on a three-view configuration in the 3D video coding. All coding parameters followed all intra setting in the common test conditions (CTC) of JCT-3V [20]. The coding performance was measured according to Bjontegaard delta bitrate (BDBR) and PSNR (BDPSNR) [21] in percentage and dB, respectively, and complexity reduction (CR) was measured with the encoding time as follows:
where ET (reference) and ET (proposed) represent the encoding times of the reference software and the proposed software, respectively.
Table 4 shows the overall performance of the FHEVCI+ADMMS method [15] and the proposed method. BDBR(D) means the overall performances in terms of the average PSNR of the three decoded views over the total coding bitrate of the texture images and the depth maps, and BDBR(S) means the overall performances in terms of the average PSNR of the six synthesized views over the total bitrate [20]. CR(O) was computed with the overall encoding time of the texture images and depth maps in Equation (1), but CR(D) was only calculated with the depth encoding time. Avg. indicates the average performance of all the test sequences. Both the FHEVCI+ADMMS method and the proposed method only increase the bitrates by about 0.1% and 0.6%, in terms of the decoded and synthesized PSNRs on average, respectively, which is a very small coding loss. In terms of the complexity reduction, the proposed method reduces the encoding time by about 10% more than the FHEVCI+ADMMS method, on average. For instance, the proposed method saves the encoding time by 34.42% and 39.27%, on average, and in terms of the overall and depth encoding times, respectively. However, the FHEVCI+ADMMS method only reduces the encoding times by 23.95% and 27.38% on average, in terms of the overall and depth encoding times, respectively. In addition, the proposed method achieves better results than the FHEVCI+ADMMS method in all the test sequences. The FHEVCI+ADMMS method always investigates the four prediction modes—which include the planar, DC, horizontal, and vertical modes—in the original mode decision process with the RD optimization, whereas the proposed method only tests one or two modes, based on the mode pattern table. Hence, a higher encoding time reduction can be achieved.
Table 5 shows the detailed information of both methods. Bits and PSNR were measured with the total coding bitrate and PSNR of the six synthesized views. Avg. indicates the BDBR and BDPSNR performance in each test sequence. As shown in Table 5, even though both methods use a small number of candidate modes in the mode decision, the coding degradation is significantly small at all the QPs. This means that the planar, DC, horizontal, and vertical modes are enough to determine the optimum mode for depth coding. It also demonstrates that the proposed method further reduces the number of candidate modes in these four modes without significant coding loss. In addition, Table 6 shows the mode decision accuracy of the proposed method for QPs of 39 and 42 in percentage. This indicates the degree to which the optimum mode as determined by the proposed method is the same as that determined by the original method, among the four modes. As shown in Table 6, the accuracy is very high for all the test sequences. This indicates that the number of candidate modes can be efficiently reduced based on the mode pattern table in Table 1.
5. Conclusions
This paper proposed the fast intra mode decision method in 3D-HEVC depth coding. Based on the mode analysis, the proposed method generated the mode pattern table, which can adaptively reduce the number of candidate modes in the original intra mode decision process. The experimental results demonstrated that the proposed method is more efficient than the state-of-the-art method in terms of the complexity reduction.
However, the proposed method is only applied to the depth intra coding, so its impact is very limited in real-time applications of 3D-HEVC. Therefore, in future work, I will extend the proposed method to the depth inter coding.
Funding
This work was supported by the National Research Foundation of Korea (NRF) grant funded by the Korea government (MSIT) (No. 2018R1C1B5086072).
Conflicts of Interest
The author declares no conflict of interest.
References
- Sullivan, G.J.; Ohm, J.-R.; Han, W.-J.; Wiegand, T. Overview of the high efficiency video coding (HEVC) standard. IEEE Trans. Circuit Syst. Video Technol. 2012, 22, 1649–1668. [Google Scholar] [CrossRef]
- Ortega, A.; Ranchandra, K. Rate-distortion methods for image and video compression. IEEE Signal Process. Mag. 1998, 15, 23–50. [Google Scholar] [CrossRef]
- Fehn, C. Depth-image-based rendering (DIBR), compression, and transmission for a new approach on 3D-TV. Proc. SPIE 2004, 5291, 93–104. [Google Scholar]
- Sullivan, S.J.; Boyce, J.M.; Chen, Y.; Ohm, J.-R.; Segall, C.A.; Vetro, A. Standardized Extensions of High Efficiency Video Coding (HEVC). IEEE J. Sel. Top. Signal Process. 2013, 7, 1001–1016. [Google Scholar] [CrossRef]
- Muller, K.; Merkle, P.; Tech, G.; Wiegand, T. 3D video coding with depth modeling modes and view synthesis optimization. In Proceedings of the APSIPA Annual Summit and Conference, Hollywood, CA, USA, 3–6 December 2012. [Google Scholar]
- Liu, H.; Chen, Y. Generic segment-wise DC for 3D-HEVC depth intra coding. In Proceedings of the 2014 IEEE International Conference on Image Processing (ICIP), Paris, France, 27–30 October 2014. [Google Scholar]
- Lee, J.Y.; Park, M.W.; Kim, C. 3D-CE1: Depth Intra Skip (DIS) Mode; Doc. JCT3V-K0033; ITU-T SG 16 WP 3 and ISO/IEC JTC 1/SC 29/WG 11: Geneva, Switzerland, 2015. [Google Scholar]
- Gu, Z.; Zheng, J.; Ling, N.; Zhang, P. Fast depth modeling mode selection for 3D HEVC depth intra coding. In Proceedings of the IEEE International Conference on Multimedia and Expo Workshops, San Jose, CA, USA, 15–19 July 2013. [Google Scholar]
- Gu, Z.; Zheng, J.; Ling, N.; Zhang, P. Fast bi-partition mode selection for 3D HEVC depth intra coding. In Proceedings of the IEEE International Conference on Multimedia and Expo Workshops, Chengdu, China, 14–18 July 2014. [Google Scholar]
- Song, Y.; Ho, Y.-S. Simplified inter-component depth modeling in 3D-HEVC. In Proceedings of the IEEE IVMSP Workshop, Seoul, Korea, 10–12 June 2013. [Google Scholar]
- Zhang, M.; Zhao, C.; Xu, J.; Bai, H. A fast depth-map wedgelet partitioning scheme for intra prediction in 3D video coding. In Proceedings of the IEEE International Symposium on Circuits and Systems, Beijing, China, 19–23 May 2013. [Google Scholar]
- Sanchez, G.; Saldanha, M.; Balota, G.; Zatt, B.; Porto, M.; Agostini, L. Complexity reduction for 3D-HEVC depth maps intra-frame prediction using simplified edge detector algorithm. In Proceedings of the IEEE International Conference on Image Processing, Paris, France, 27–30 October 2014. [Google Scholar]
- Sanchez, G.; Saldanha, M.; Balota, G.; Zatt, B.; Porto, M.; Agostini, L. A complexity reduction algorithm for depth maps intra prediction on the 3D-HEVC. In Proceedings of the IEEE Visual Communications and Image Processing Conference, Valletta, Malta, 7–10 December 2014. [Google Scholar]
- Park, C. Edge-based intramode selection for depth-map coding in 3D-HEVC. IEEE Trans. Image Process. 2015, 24, 155–162. [Google Scholar] [CrossRef] [PubMed]
- Zhang, Q.; Yang, Y.; Chang, H.; Zhang, W.; Gan, Y. Fast intra mode decision for depth coding in 3D-HEVC. Multidimens. Syst. Signal Process. 2017, 28, 1023–1226. [Google Scholar] [CrossRef]
- Lei, J.; Duan, J.; Wu, F.; Ling, N.; Hou, C. Fast Mode Decision Based on Grayscale Similarity and Inter-View Correlation for Depth Map Coding in 3D-HEVC. IEEE Trans. Circuit Syst. Video Technol. 2018, 28, 706–718. [Google Scholar] [CrossRef]
- Pan, Z.; Yi, X.; Chen, L. Motion and disparity vectors early determination for texture video in 3D-HEVC. Multimedia Tools Appl. 2018, 1–18. [Google Scholar] [CrossRef]
- Liao, Y.-W.; Chen, M.-J.; Yeh, C.-H.; Lin, J.-R. Efficient inter-prediction depth coding algorithm based on depth map segmentation for 3D-HEVC. Multimedia Tools Appl. 2018. [Google Scholar] [CrossRef]
- Lainema, J.; Bossen, F.; Han, W.-J.; Min, J.; Ugur, K. Intra Coding of the HEVC Standard. IEEE Trans. Circuit Syst. Video Technol. 2012, 22, 1792–1801. [Google Scholar] [CrossRef] [Green Version]
- Rusanovskyy, D.; Müller, K.; Vetro, A. Common Test Conditions of 3DV Core Experiments; Doc. JCT3V-E1100; ITU-T SG 16 WP 3 and ISO/IEC JTC 1/SC 29/WG 11: Vienna, Austria, 2013. [Google Scholar]
- Bjontegaard, G. Calculation of Average PSNR Differences between RD-curves; Doc. VCEG-M33; DITU-T SG 16/Q.6: Austin, TX, USA, 2001. [Google Scholar]
Figure 1.
Example of the multiview video plus depth (MVD) format including a texture image (a) and a depth map (b).
Figure 1.
Example of the multiview video plus depth (MVD) format including a texture image (a) and a depth map (b).

Figure 2.
Flowchart of the original depth intra mode decision method in 3D-HEVC.

Figure 3.
Flowchart of the fast conventional HEVC intra mode decision and adaptive depth modeling mode (DMM) search method (FHEVCI+ADMMS) for the fast depth intra mode decision.
Figure 3.
Flowchart of the fast conventional HEVC intra mode decision and adaptive depth modeling mode (DMM) search method (FHEVCI+ADMMS) for the fast depth intra mode decision.

Figure 4.
Mode decision runtime of the original and DMM-related mode decision processes in (a) Poznan_Hall2 and (b) Kendo test sequences with quantization parameters (QPs) of 34, 39, 42, and 45.
Figure 4.
Mode decision runtime of the original and DMM-related mode decision processes in (a) Poznan_Hall2 and (b) Kendo test sequences with quantization parameters (QPs) of 34, 39, 42, and 45.

Figure 5.
The probability that the optimum mode belongs to several minimum SATD (sum of the absolute transformed difference) cost modes for QPs of (a) 39 and (b) 42.
Figure 5.
The probability that the optimum mode belongs to several minimum SATD (sum of the absolute transformed difference) cost modes for QPs of (a) 39 and (b) 42.

Figure 6.
Correlation between the optimum mode and the minimum SATD cost mode for QPs of (a) 39 and (b) 42.
Figure 6.
Correlation between the optimum mode and the minimum SATD cost mode for QPs of (a) 39 and (b) 42.

Figure 7.
Flowchart of the proposed depth intra mode decision using the mode pattern table.

Figure 8.
Three-view configuration including the left, center, right views in the 3D video coding.
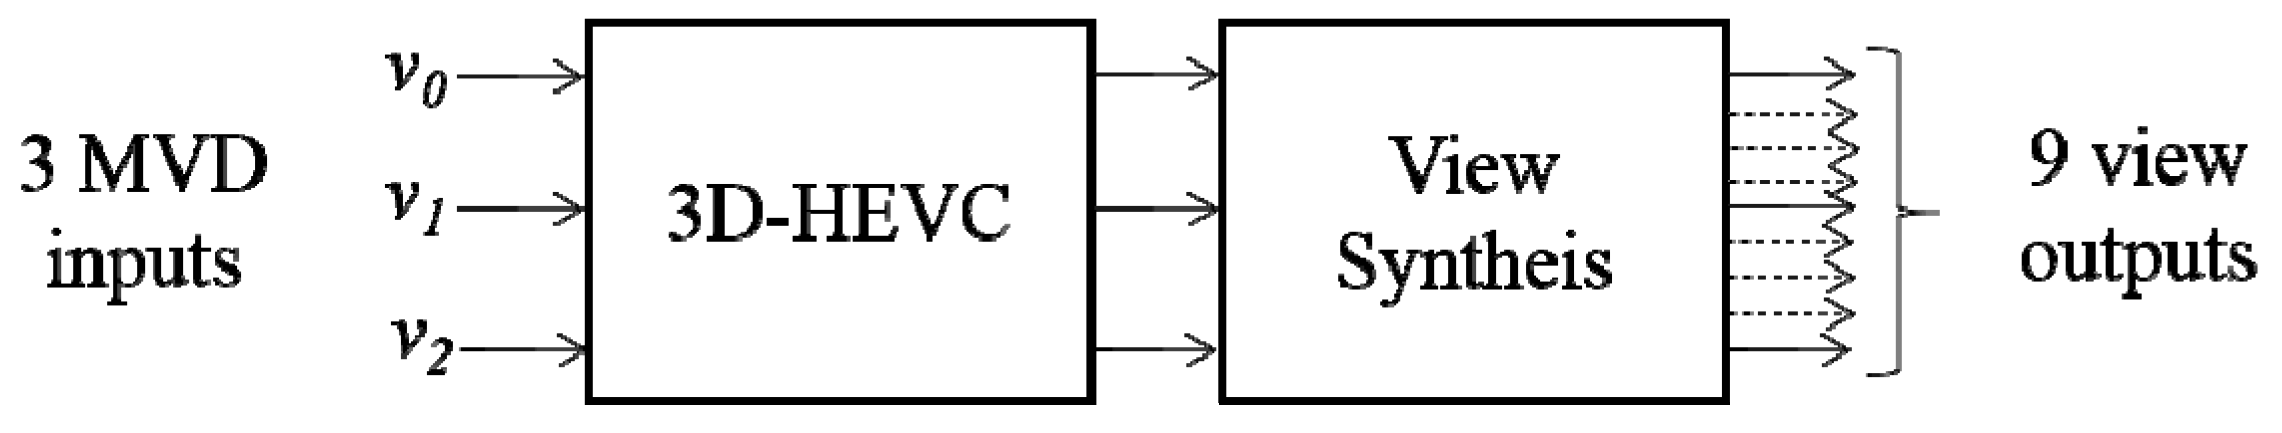
Figure 9.
Inter-view prediction structure (P-I-P) in the three-view configuration.


Table 1.
Mode pattern table to eliminate the candidate modes in the rate-distortion (RD) list.
| The First Minimum Cost Mode | Eliminated Modes |
|---|---|
| Planar | DC, Horizontal, Vertical |
| DC | Horizontal, Vertical |
| Horizontal | Vertical |
| Vertical | Horizontal |
Table 2.
Possible candidate modes in the RD list based on the mode pattern table.
| Case | The First Minimum Cost Mode | Possible Candidate Modes |
|---|---|---|
| 1 | Planar | Planar |
| 2 | DC | DC, DMM |
| 3 | DC, Planar, DMM | |
| 4 | Horizontal | Horizontal, DMM |
| 5 | Horizontal, Planar, DMM | |
| 6 | Horizontal, DC, DMM | |
| 7 | Vertical | Vertical, DMM |
| 8 | Vertical, Planar, DMM | |
| 9 | Vertical, DC, DMM |
Table 3.
Sequence information.
| Sequence | Resolution | Total Frames | Frame Rate | View Number |
|---|---|---|---|---|
| Poznan_Hall2 | 1920 × 1088 | 200 | 25 | 7-6-5 |
| Poznan_Street | 1920 × 1088 | 250 | 25 | 5-4-3 |
| Undo_Dancer | 1920 × 1088 | 250 | 25 | 1-5-9 |
| GT_Fly | 1920 × 1088 | 250 | 25 | 9-5-1 |
| Kendo | 1024 × 768 | 300 | 30 | 1-3-5 |
| Balloons | 1024 × 768 | 300 | 30 | 1-3-5 |
| Newspaper | 1024 × 768 | 300 | 30 | 2-4-6 |
| Shark | 1920 × 1088 | 300 | 30 | 1-5-9 |
Table 4.
Overall performance of (a) the FHEVCI+ADMMS method and (b) the proposed method.
| Sequence | BDBR(D) | BDBR(S) | CR(D) | CR(O) | ||||
|---|---|---|---|---|---|---|---|---|
| (a) | (b) | (a) | (b) | (a) | (b) | (a) | (b) | |
| Poznan_Hall2 | −0.06 | 0.01 | 0.76 | 0.60 | −30.64 | −41.40 | −26.37 | −35.69 |
| Poznan_Street | 0.04 | 0.06 | 0.31 | 0.44 | −24.27 | −39.93 | −21.59 | −35.55 |
| Undo_Dancer | −0.02 | 0.01 | 0.33 | 0.21 | −33.72 | −38.64 | −28.77 | −33.05 |
| GT_Fly | 0.00 | 0.03 | 0.23 | 0.25 | −26.00 | −38.26 | −22.86 | −33.54 |
| Kendo | 0.16 | 0.17 | 0.41 | 0.59 | −28.15 | −39.52 | −24.53 | −34.50 |
| Balloons | 0.25 | 0.26 | 1.15 | 1.38 | −26.72 | −38.97 | −23.51 | −34.31 |
| Newspaper | 0.14 | 0.18 | 0.96 | 1.11 | −25.17 | −38.02 | −22.58 | −34.16 |
| Shark | 0.14 | 0.12 | 0.55 | 0.52 | −24.37 | −39.44 | −21.35 | −34.59 |
| Avg. | 0.08 | 0.11 | 0.59 | 0.64 | −27.38 | −39.27 | −23.95 | −34.42 |
Table 5.
Detailed information of (a) the FHEVCI+DMMS method and (b) the proposed method.
| Sequence | QP | ΔBits | ΔPSNR | CR(D) | CR(O) | ||||
|---|---|---|---|---|---|---|---|---|---|
| (a) | (b) | (a) | (b) | (a) | (b) | (a) | (b) | ||
| Poznan_Hall2 | 34 | −0.01 | 0.01 | −0.05 | −0.03 | −31.55 | −36.58 | −26.48 | −30.72 |
| 39 | −0.02 | 0.02 | −0.04 | −0.03 | −28.63 | −37.73 | −24.67 | −32.53 | |
| 42 | −0.11 | 0.00 | −0.07 | −0.04 | −33.29 | −44.29 | −28.83 | −38.33 | |
| 45 | 0.00 | 0.04 | −0.02 | −0.03 | −29.08 | −46.99 | −25.49 | −41.16 | |
| Avg. | 0.76 | 0.60 | −0.02 | −0.02 | −30.64 | −41.40 | −26.37 | −35.69 | |
| Poznan_Street | 34 | −0.03 | 0.03 | −0.08 | −0.08 | −22.58 | −33.29 | −19.92 | −29.41 |
| 39 | 0.06 | 0.07 | −0.03 | −0.04 | −19.64 | −34.90 | −17.64 | −31.30 | |
| 42 | 0.04 | 0.05 | −0.02 | −0.03 | −29.69 | −44.58 | −26.35 | −39.63 | |
| 45 | 0.08 | 0.09 | 0.00 | −0.02 | −25.19 | −46.97 | −22.43 | −41.86 | |
| Avg. | 0.31 | 0.44 | −0.01 | −0.02 | −24.27 | −39.93 | −21.59 | −35.55 | |
| Undo_Dancer | 34 | −0.09 | −0.03 | −0.15 | −0.06 | −37.48 | −33.05 | −31.13 | −27.49 |
| 39 | −0.03 | −0.01 | −0.04 | −0.02 | −31.24 | −35.86 | −26.50 | −30.34 | |
| 42 | 0.01 | 0.03 | −0.02 | −0.02 | −35.04 | −41.19 | −30.24 | −35.46 | |
| 45 | 0.05 | 0.07 | −0.01 | −0.01 | −31.12 | −44.47 | −27.21 | −38.89 | |
| Avg. | 0.33 | 0.21 | −0.01 | −0.01 | −33.72 | −38.64 | −28.77 | −33.05 | |
| GT_Fly | 34 | −0.09 | 0.01 | −0.07 | −0.04 | −24.70 | −30.42 | −21.55 | −26.42 |
| 39 | 0.01 | 0.03 | −0.02 | −0.02 | −19.87 | −33.15 | −17.61 | −29.32 | |
| 42 | 0.03 | 0.05 | −0.01 | −0.01 | −33.50 | −42.89 | −29.48 | −37.61 | |
| 45 | 0.01 | 0.02 | −0.01 | −0.03 | −25.92 | −46.57 | −22.81 | −40.81 | |
| Avg. | 0.23 | 0.25 | −0.01 | −0.01 | −26.00 | −38.26 | −22.86 | −33.54 | |
| Kendo | 34 | 0.19 | 0.19 | −0.05 | −0.06 | −26.82 | −36.61 | −22.82 | −31.27 |
| 39 | 0.19 | 0.20 | −0.03 | −0.05 | −27.18 | −37.84 | −23.66 | −32.99 | |
| 42 | 0.15 | 0.18 | −0.03 | −0.05 | −31.08 | −41.05 | −27.24 | −35.98 | |
| 45 | 0.09 | 0.11 | −0.02 | −0.04 | −27.51 | −42.59 | −24.38 | −37.74 | |
| Avg. | 0.41 | 0.59 | −0.02 | −0.03 | −28.15 | −39.52 | −24.53 | −34.50 | |
| Balloons | 34 | 0.31 | 0.22 | −0.21 | −0.30 | −25.14 | −36.21 | −21.70 | −31.27 |
| 39 | 0.29 | 0.27 | −0.11 | −0.14 | −25.29 | −37.39 | −22.27 | −32.88 | |
| 42 | 0.22 | 0.29 | −0.11 | −0.11 | −29.61 | −40.70 | −26.13 | −36.02 | |
| 45 | 0.18 | 0.21 | −0.05 | −0.08 | −26.83 | −41.58 | −23.96 | −37.07 | |
| Avg. | 1.15 | 1.38 | −0.06 | −0.07 | −26.72 | −38.97 | −23.51 | −34.31 | |
| Newspaper | 34 | 0.08 | 0.09 | −0.23 | −0.25 | −22.83 | −34.18 | −20.11 | −30.13 |
| 39 | 0.16 | 0.19 | −0.10 | −0.11 | −22.26 | −34.94 | −19.97 | −31.41 | |
| 42 | 0.13 | 0.20 | −0.07 | −0.08 | −29.12 | −40.96 | −26.24 | −39.96 | |
| 45 | 0.16 | 0.21 | −0.03 | −0.06 | −26.46 | −42.01 | −23.98 | −38.14 | |
| Avg. | 0.96 | 1.11 | −0.05 | −0.05 | −25.17 | −38.02 | −22.58 | −34.16 | |
| Shark | 34 | 0.22 | 0.21 | −0.17 | −0.15 | −24.14 | −34.49 | −20.78 | −29.67 |
| 39 | 0.14 | 0.12 | −0.05 | −0.05 | −22.04 | −36.60 | −19.32 | −32.12 | |
| 42 | 0.11 | 0.11 | −0.02 | −0.03 | −26.99 | −42.85 | −23.78 | −37.68 | |
| 45 | 0.10 | 0.10 | −0.02 | −0.03 | −24.30 | −43.83 | −21.52 | −38.88 | |
| Avg. | 0.55 | 0.52 | −0.03 | −0.03 | −24.37 | −39.44 | −21.35 | −34.59 | |
Table 6.
Mode decision accuracy of the proposed method.
| Sequence | QP = 39 | QP = 42 |
|---|---|---|
| Poznan_Hall2 | 98.75 | 99.28 |
| Poznan_Street | 97.32 | 98.82 |
| Undo_Dancer | 97.80 | 98.86 |
| GT_Fly | 98.06 | 99.04 |
| Kendo | 96.82 | 97.97 |
| Balloons | 95.78 | 97.02 |
| Newspaper | 94.25 | 96.32 |
| Shark | 98.24 | 98.83 |
| Avg. | 97.13 | 98.27 |
© 2019 by the author. Licensee MDPI, Basel, Switzerland. This article is an open access article distributed under the terms and conditions of the Creative Commons Attribution (CC BY) license (http://creativecommons.org/licenses/by/4.0/).
Share and Cite
MDPI and ACS Style
Lee, J.Y. Fast Depth Intra Mode Decision Based on Mode Analysis in 3D Video Coding. Electronics 2019, 8, 430. https://doi.org/10.3390/electronics8040430
AMA Style
Lee JY. Fast Depth Intra Mode Decision Based on Mode Analysis in 3D Video Coding. Electronics. 2019; 8(4):430. https://doi.org/10.3390/electronics8040430
Chicago/Turabian StyleLee, Jin Young. 2019. "Fast Depth Intra Mode Decision Based on Mode Analysis in 3D Video Coding" Electronics 8, no. 4: 430. https://doi.org/10.3390/electronics8040430
Note that from the first issue of 2016, this journal uses article numbers instead of page numbers. See further details here.