Modified Echo State Network Enabled Dynamic Duty Cycle for Optimal Opportunistic Routing in EH-WSNs


1
Department of Computer Science and Engineering, Deenbandhu Chhoturam University of Science and Technology, Murthal (Sonipat), Haryana 131039, India
2
School of Engineering, Newcastle University, Newcastle upon Tyne NE1 7RU, UK
3
Department of Computing and Mathematics, Faculty of Science and Engineering, Manchester Metropolitan University, Manchester M1 5GD, UK
*
Author to whom correspondence should be addressed.
Electronics 2020, 9(1), 98; https://doi.org/10.3390/electronics9010098
Submission received: 4 September 2019
/
Revised: 19 December 2019
/
Accepted: 30 December 2019
/
Published: 3 January 2020
(This article belongs to the Special Issue Vehicular Networks and Communications)
Abstract
:Minimizing energy consumption is one of the major challenges in wireless sensor networks (WSNs) due to the limited size of batteries and the resource constrained tiny sensor nodes. Energy harvesting in wireless sensor networks (EH-WSNs) is one of the promising solutions to minimize the energy consumption in wireless sensor networks for prolonging the overall network lifetime. However, static energy harvesting in individual sensor nodes is normally limited and unbalanced among the network nodes. In this context, this paper proposes a modified echo state network (MESN) based dynamic duty cycle with optimal opportunistic routing (OOR) for EH-WSNs. The proposed model is used to act as a predictor for finding the expected energy consumption of the next slot in dynamic duty cycle. The model has adapted a whale optimization algorithm (WOA) for optimally selecting the weights of the neurons in the reservoir layer of the echo state network towards minimizing energy consumption at each node as well as at the network level. The adapted WOA enabled energy harvesting model provides stable output from the MESN relying on optimal weight selection in the reservoir layer. The dynamic duty cycle is updated based on energy consumption and optimal threshold energy for transmission and reception at bit level. The proposed OOR scheme uses multiple energy centric parameters for selecting the relay set oriented forwarding paths for each neighbor nodes. The performance analysis of the proposed model in realistic environments attests the benefits in terms of energy centric metrics such as energy consumption, network lifetime, delay, packet delivery ratio and throughput as compared to the state-of-the-art-techniques.
1. Introduction
Wireless sensor networks (WSNs) comprise a number of tiny sensor nodes for sensing and computation, transmission and reception for smart applications [1]. In WSNs, sensor nodes collect data about some targets and transmit sensed data to the sink node (or base station) via multiple hops [2]. Due to the ease of deployment, WSNs are utilized in many smart applications, such as security surveillance [3], disaster relief [4], IoT use cases [5], medical care [6], E-mobility [7], traffic management [8] and precision agriculture [9]. Enhancing the network lifetime and minimizing the packet delivery delays are some of the challenging tasks for WSNs based smart applications [10]. The size of the sensor nodes is small, and need regular power from a tiny size battery. However, it is unfeasible to recharge or alter the battery in case of hostile environments centric applications. In wireless sensor networks, we can extend the operating lifetime of nodes by energy harvesting mechanism and therefore enhancing the network lifetime [11]. Furthermore, this technology decreases the operation cost of WSNs, thus making it very essential for a sustainable “near-perpetual” WSNs operability. Therefore, energy harvesting in WSNs (EH-WSNs) is crucial for the sustainable operations of WSNs [12].
Various challenges exist in improving the environment of EH-WSNs. Further, there is a need for enhancing the performance of various applications for uplifting the ecosystem and human life by using EH-WSNs [13]. Efficient energy regulating schemes are required to make the nodes working proficiently without hurdles and thereby making the network more efficient [14]. Some mechanism is needed to address the issue of energy scarcity in EH-WSNs [15].
There are still various unresolved problems and to effectively manage the harvested energy, EH-WSNs should use a customized packet forwarding scheme. This minimizes the energy consumption and maximizes the lifetime of the network [16]. Opportunistic packet forwarding schemes (OPEH) are broadly used in WSNs, and usually yield high packet delivery ratio (PDR) and low end-to-end delay (EED). In EH-WSNs, the packet-transmission method acknowledges multistage relay set optimization mechanisms and renders an exact estimation to the cost of transmission. The relay nodes can be optimally chosen either by prioritization of the relay nodes or clustering the relay nodes in WSNs [17]. Likewise, in WSNs, nodes are generally duty-cycled to prolong the network lifetime. According to the duty cycle method, the nodes periodically switches among active and sleep mode and it is a most commonly applied scheme for energy saving. A node can transmit or receive packets while in active mode, but cannot communicate while in sleep mode. Thus, raising the duty cycle results in higher energy consumption and lower delay, while it produces the opposite effect by reducing the duty cycle.
Furthermore, sensor nodes usually work with sleep-wake up schedules to save power by using the duty cycle scheme. [18,19] discusses the duty cycle adjustment scheme that is based on residual energy aware and changing the wake-up interval as per the harvested energy.
In EH-WSNs, the concept of dynamic and heterogeneous duty cycle (DC) of nodes helps in improving the energy acquisition. This approach would make the nodes working proficiently for a longer time. The reason belongs to the fact that the energy acquisition is typically insufficient, time-shifted and uneven in static duty cycle centric EH-WSNs. The opportunistic packet forwarding methods do not acknowledge the effect of the dynamic and heterogeneous DC. Zhang et al. [20] have improved the dynamic and heterogeneous DC methods with the assistance of the energy consumption calculation and utilized ESN [21] for predicting energy acquisition for next time slot, however only the traditional ESN model was used. In conventional ESN, the weight choice methodology is time-consuming making it non-scalable for WSNs. This research article overcomes the limitations of ESN and proposes an improved echo state network which have been named modified echo state network (MESN).
Further, in MESN, the interconnection weights are optimally chosen by utilizing a whale optimization algorithm (WOA) [22]. We will describe the MESN model in Section 3. For further improvement, this article proposes the MESN based dynamic DC with optimal opportunistic routing (OOR) for EH-WSNs. This MESN model predicts the expected energy acquisition value for the next time slot. The principal goal of the proposed OOR method is to select the relay set by using multiple energy centric parameters and alter DC by using energy consumption, energy acquisition, and energy threshold.
The key contributions of this article are listed as follows:
- This article proposes the modified echo state network (MESN) which is used as a predictor for finding the expected energy acquisition of the next time slot. The proposed scheme is a novel research in this article and stops the unstable output of ESN due to the random weight selection in the reservoir layer. This model utilizes the whale optimization algorithm (WOA) for optimally selecting the weights of the neurons in the reservoir layer of the echo state network.
- In the optimal opportunistic routing (OOR) scheme, the relay set is selected using multiple parameters such as energy consumption, congestion rate and estimated duty-cycled wakeups (EDW). The relay set selection scheme selects appropriate forwarding paths for each forwarder node.
- The proposed scheme achieves an optimized style to update duty cycle since it is updated based on energy consumption, energy acquisition of the next slot and energy threshold as the optimal energy is acquired from the prediction of the next slot with the help of the MESN model.
- Finally, the comparison of the proposed technique with existing methods such as ESN, AOR, and Max-SNR in terms of performance parameters such as delay, packet delivery ratio and throughput is done. This reveals that the average percentage improvement of the proposed approach outperforms the existing techniques.
The organization of the article is as follows: Section 2 provides related work. Section 3 provides complete detail of the proposed MESN technique. Section 4 discusses the working structure of the MESN based OOR scheme. Section 5 describes the results of simulation and performance comparisons. Finally, Section 6 presents the conclusion of the paper.
2. Related Works
2.1. Duty Cycled Wake Up Concept and Global Power Management Approach for Energy Harvesting Sensor Nodes
Ghadimi et al. [23] have assessed the opportunistic routing algorithm with new measurement; this scheme discusses to form candidate relay set from the localities of the sensor nodes based on the estimated duty-cycled wakeups (EDW). This step is required to transmit packets from source to destination efficiently. Castagnetti et al. [24] propose the global power management approach for energy harvesting sensor nodes, which depend on duty-cycle optimization and transmission power control.
2.2. Estimating the Harvested Energy, Relating Duty Cycle and Traffic Load
A new topological evolution model based on energy realization for WSNs is given by Cui et al. [25]. This model considers the changing nature of nodes and links. Mothku et al. [26] have proposed the model for estimating the harvesting energy. An essential aspect of this model is that it determines the residual energy for future time slots by using estimated harvesting energy, energy expenditure, and present residual energy. Next, a coherent model is given by Galmés et al. [27], which represents the energy expenditure of nodes in duty-cycled WSNs. This model provides a typical methodology for describing the duty cycle and traffic load for duty-cycle EH-WSNs. Further, an integrated scheme has been given by Sharma et al. [28], which consists of energy allocation postulates with an adjustable duty cycle scheme to proficiently utilizing the energy and therefore enhancing node operations.
2.3. Adaptive Duty Cycle Concept and Scheme for Enhancing the Node’s Lifetime
Xiang et al. [29] have given an efficient scheme based on the adaptive duty cycle (ADC) concept. The main aim of ADC based opportunistic routing is to reduce the delay of nodes in WSN. In ADC based opportunistic routing scheme, the network delay reduces by increasing the node’s duty cycle in particularly those regions where it has remaining energy. The duty cycle scheme can effectively reduce the energy consumption in WSNs. For increasing the node’s lifetime and enhancing the node’s usability in many areas, a rational next-door neighbor detection scheme is given by Gu et al. [30], the scheme also involves the systematic investigation of various next-door neighbor detection protocols and introduces the excellent next-door neighbor detection schedule. The main aim of the next-door neighbor detection issue in WSNs is to reduce the duty cycle.
In this article, we have compared the performance of the proposed scheme with existing schemes such as ESN based scheme, AOR and Max-SNR. The ESN-based scheme utilizes an ESN to get the energy acquisition of the next slot. In AOR, the concept of area subdivision method for dynamically selecting a relay set is utilized. Two crucial factors, such as left-over energy and range from the sink node, are considered while giving priority to the relay nodes. In Max-SNR, three essential factors, such as connection superiority, left-over energy and location are used for dynamically selecting the relay nodes and giving priority to relay nodes.
3. Proposed Modified Echo State Network (MESN) Model
In EH-WSNs, nodes can consistently harvest energy from the surroundings. However, the energy acquisition in EH-WSNs is usually deficient, time varied and unstable. The dynamic and heterogeneous duty cycle (DC) of nodes can be used to improve energy acquisition and hence, would keep the nodes operational for a longer time. It is noticeable that the traditional opportunistic packet-forwarding schemes in EH-WSNs do not consider the concept of dynamic DC while building, the relay set and selecting the forwarding paths. Thus, the performance is lower than expected by using conventional OPEH in EH-WSNs when dynamic DC is not used. Zhang et al. [20] have improved dynamic and heterogeneous DC methods but used the traditional ESN model utilizing random weight selection for neurons in the reservoir layer which may produce an unstable output. Therefore, in this article, MESN is utilized for the same purpose and the method is described next.
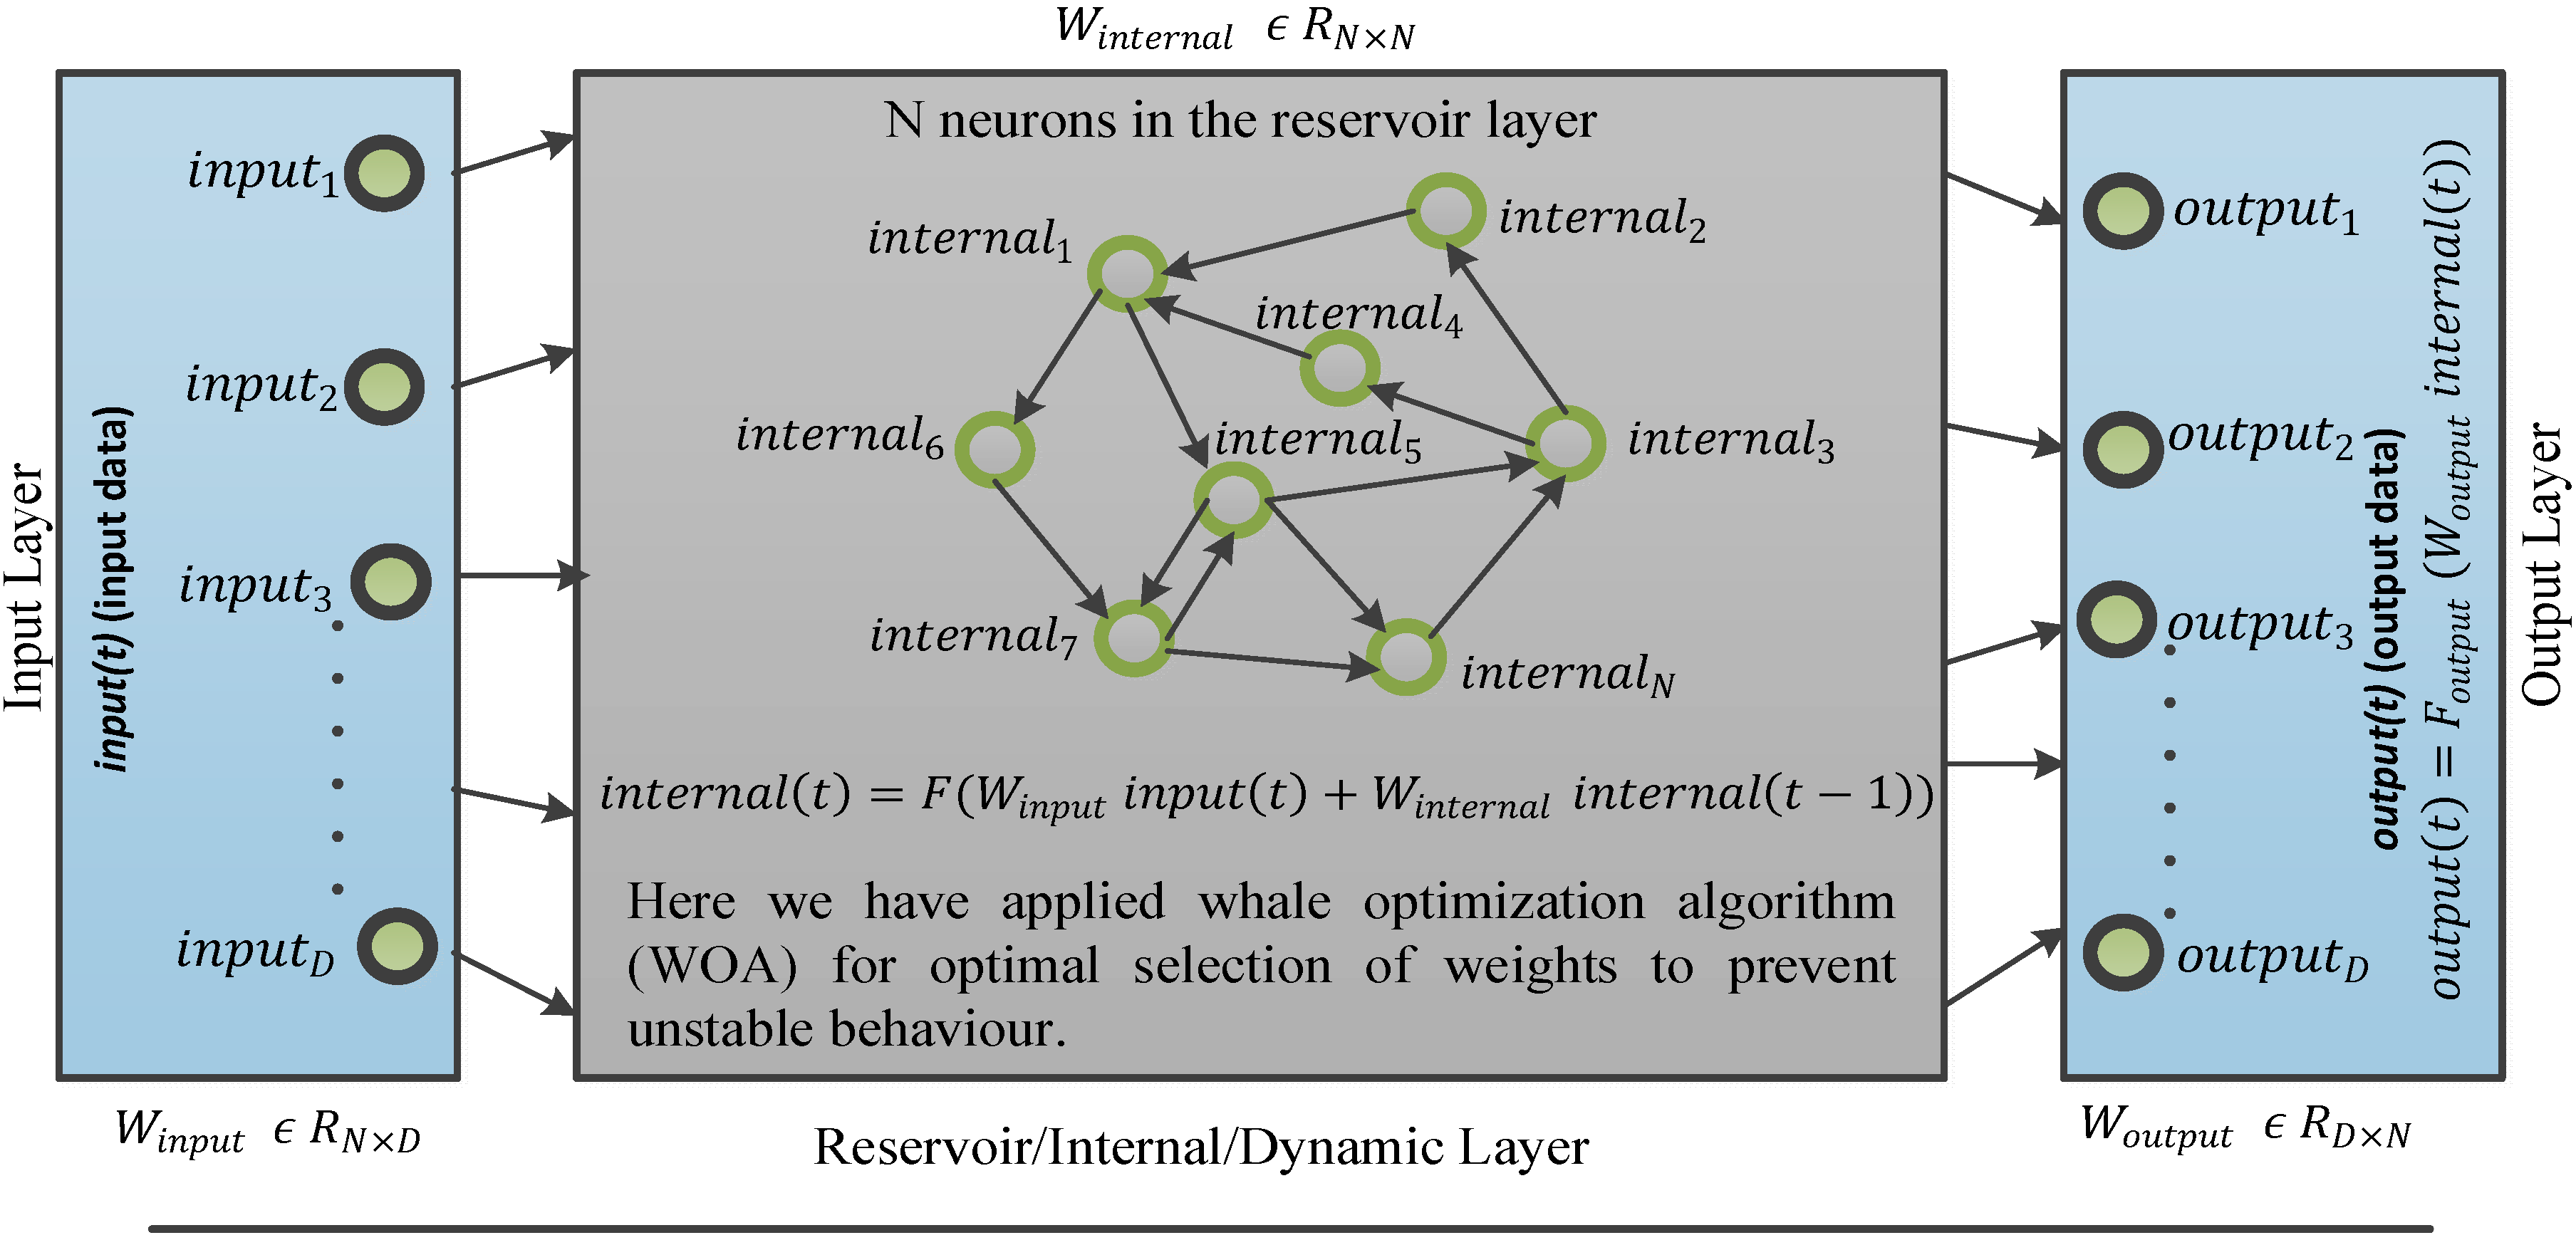
The proposed modification in ESN enhances the efficiency of predicting the expected energy acquisition precisely for enabling better duty cycle calculation. In traditional ESN, every cycle of the training phase consists of refreshing the weights of the neurons; until the error amongst output and input is within tolerance. The weights generated during the training phase will be used to test on the newer data. However, the weight selection procedure is time-consuming. This article overcomes this limitation by using WOA with ESN for optimally selecting the weights in the reservoir layer of ESN, named as MESN. MESN is an enhancement over the ESN. ESN is a neural network algorithm that has high correctness in guessing time-series data, regardless of whether the data fluctuate rapidly. Hence, ESN can be utilized to assess the time-sensitive fluctuating energy acquisition estimations of the next slot. ESN provides more accuracy in predicting expected energy acquisition compare to pure mathematical model-based algorithms, especially for a rapidly changing environment. ESN comprises three layers, namely the input layer, dynamic layer and the output layer, respectively. Also, ESN has the training and analyzing phases similar to the machine learning algorithm. During training, the weights of the neurons are refreshed in every cycle until the training error between output and input is within acceptable limits. However, the training of traditional ESN is time-consuming. We have proposed modified ESN for acquiring the optimal set of weights to be applied in the interconnection links of ESN for improving the trained prediction model. In modified ESN, the WOA is applied to choose the interconnection weights optimally. Figure 1 shows the proposed MESN and depicts the various layers.
Here, the input data is the expected active transmission cost (EATC) [20] of the active relay set, and the corresponding target is the expected energy acquisition value of the next time slot. Likewise, the training data is generated and trained with MESN. Here, input(t) represents input data, internal(t) represents neurons and output(t) represents output data. Winput represents the weight matrix for input, Winternal represents the weight matrix for neurons, and Woutput represents the weight matrix for output. During training, the training error is reduced depicted by Equation (1) below:
Until the training error is reduced, the weights of the neurons are modified to generate the prediction model. Equation (2) represents the weights update mechanism for the neurons in the dynamic layer:
where represents the activation function of the dynamic layer. Moreover, the following Equation (3) demonstrates the update in weight at the output layer:
where represents the linear activation function at the output layer.
3.1. Role of Whale Optimization Algorithm in the Modified Echo State Network (MESN) Model
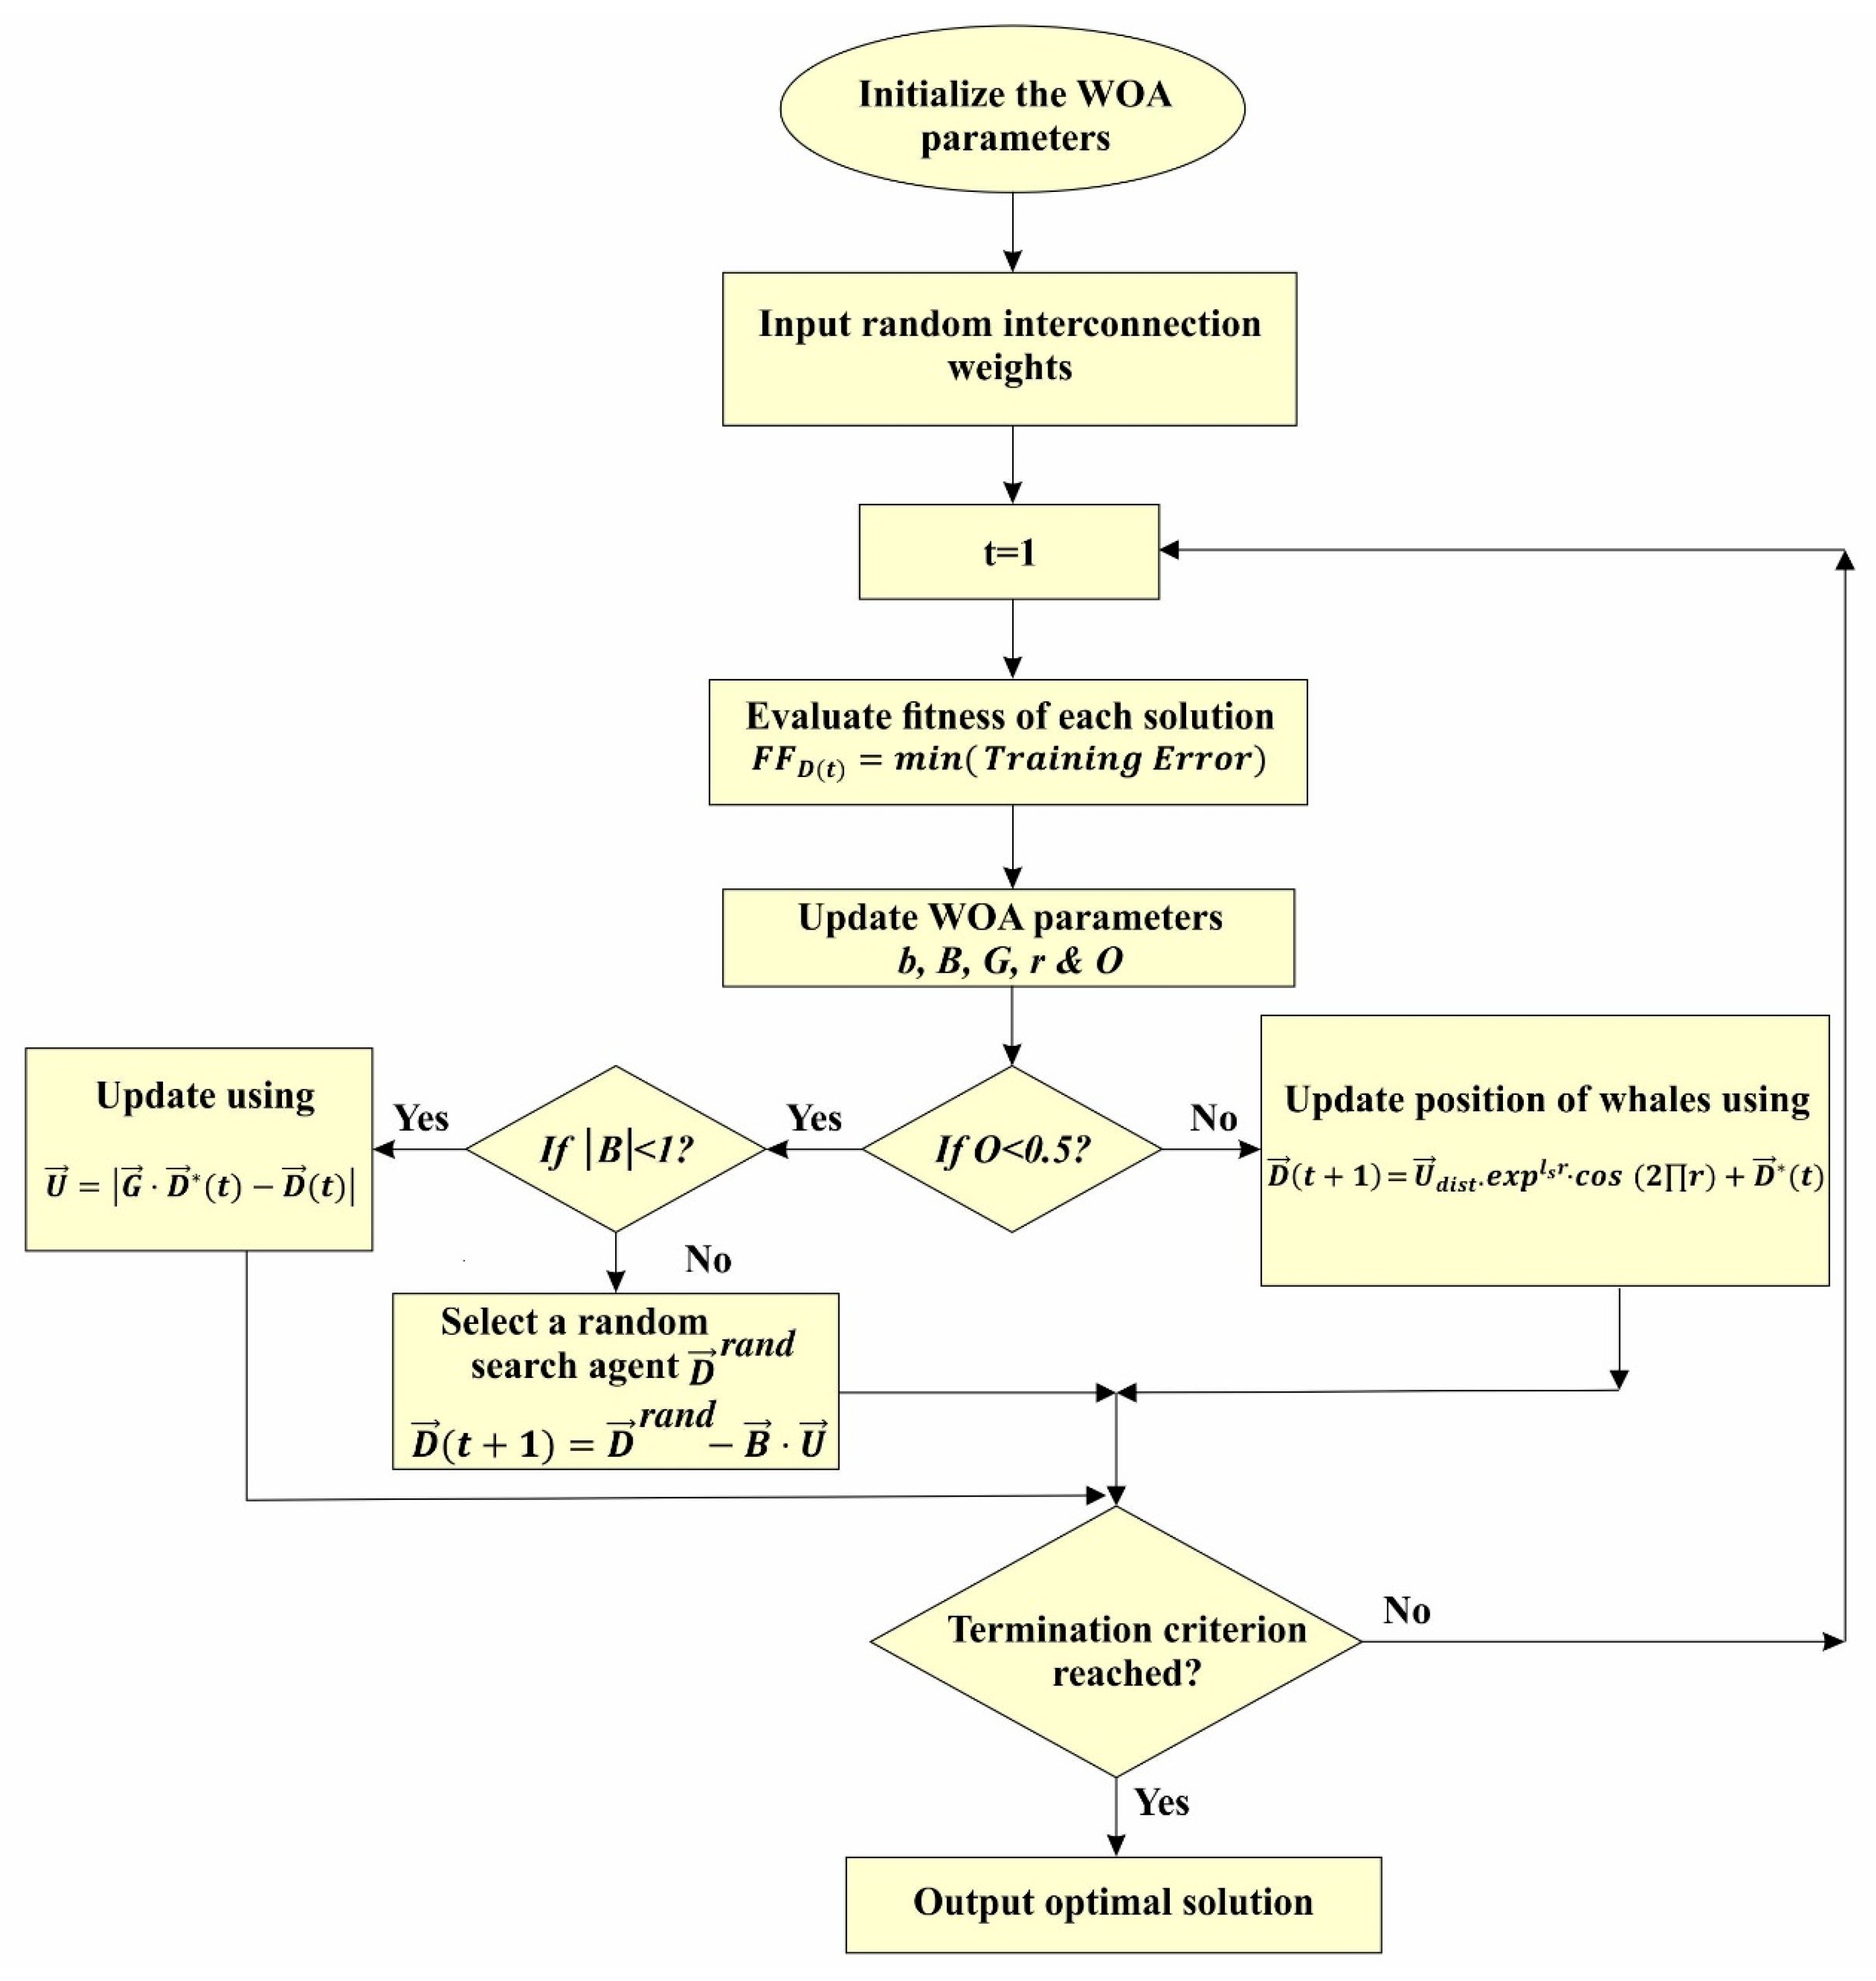
The general acts of whales influence the working of the WOA. The WOA is used to raise the speed of the training process using optimally calculating the interconnection weights and is a metaheuristic algorithm. The following section shows the various steps of the WOA.
• Initialization
The algorithm is formed by randomly developing the initial solution (i.e., the interconnection weights of the ESN). The random value in the search space is as:
where signifies the initial population of the whales at ‘’ i.e., number of interconnection links.
• Fitness Calculation
The fitness value of the solution is computed by:
The fitness value is essential for becoming the best network structure. If the training error is minimum, it means that the network has been sufficiently trained to predict the energy acquisition values of the next time slot. Later, the best solution will be one having minimum training error.
3.2. Update the Position of the Current Solution
• Encircling prey
Consider the below equations:
where ‘’ demonstrates a current iteration, represent a coefficient vector, demonstrate best solution, refers a current state. Also:
where, is reducing from 2 to 0, .
• Exploitation phase
Two mechanisms are:
1) Shrinking encircling mechanism
The Equation (8) shows this act, where the value of is reduced.
2) Spiral updating position.
The equation is as follows:
where It means the distance between the whale to the prey (which is the best set of weights attained so far), takes value from , signifies the logarithmic spiral shape. During optimization, supposing a probability of 50%. Consider the below Equation (11).
where, .
• Exploration phase
The following equation demonstrates the exploration phase:
where the current population random position vector is . Throughout every solution updating process, the fitness function is evaluated to find the best solution among them. Based on the best solution, a set of novel solutions will be generated, and the fitness is again evaluated to continue the above solution updating steps.
• Termination criteria
The termination criteria of WOA include the best interconnection weights. As a result of finding the optimal interconnection weights, the prediction model is qualified. Since the objective is to become the weights for which the training error is minimum, the prediction model, achieved for the best weights, is well qualified to predict for unknown data. When the training procedure is stable, the proposed modified ESN(MESN) can be used to predict the energy acquisition values of the next time slot, on giving the EATC values of the previous time slot. Figure 2 shows the flow diagram of the WOA algorithm.
4. The Working Structure of the Proposed Modified Echo State Network (MESN) Based Dynamic Duty Cycle (DC) with Optimal Opportunistic Routing (OOR)
In the OOR scheme, the relay set is initially selected using multiple parameters such as energy consumption, congestion rate, and estimated duty-cycled wakeups (EDW) [23]. Further, appropriate forwarding path is selected from the relay sets of each of the direct neighbor nodes. In Figure 3, a complete working structure of MESN enabled OOR is detailed.
The formation of the initial relay set Setinitial for all nodes utilizes multiple parameters such as energy consumption [31], congestion rate [32], and the EDW. In the first step, we use multiple parameters for relay selection. Therefore, we have named this approach a hybrid relay selection mechanism.
Now we are explaining the various parameters used for relay selection as follows:
The energy consumption in the data transmission mechanism consists of three parts, such as energy consumption in sending data, energy consumption in receiving data and energy consumption for the fusion of data [31]. The energy consumption in sending data can be expressed as given in Equation (14):
Here, D is the distance for sending n bits data, represents energy consumption due to the circuit loss and shows the energy consumption due to the amplification circuit loss. Similarly, the energy consumption in sending into two different transmission environments, namely, free space and multipath can be expressed as given in Equation (15):
represent energy consumption in sending unit bit data, shows energy consumption of unit bit in free space and demonstrates energy consumption of unit bit in multi-path, and . Similarly, the energy consumption in receiving n bit data can be expressed as given in Equation (16):
Similarly, the energy consumption in n bit data fusion can be expressed as given in Equation (17):
where, shows energy consumption in unit bit data fusion. The congestion rate (CR) [24] is used to evaluate the load of relay nodes. Here, each intermediate node can adaptively detect the occurrence of congestion and then notify the parent node to reduce the packet delivery rate according to the congestion level. The CR at each neighbor node can be expressed as given in Equation (18):
Here Connectivity_degree(ni) represents degree of connectivity, and Lij is the route. The relay set formation from the neighborhoods of the sensor nodes utilizes the concept of the EDW required to transmit packets from source to destination efficiently [23]. The EDW of particular node i can be expressed as given in Equation (19):
here is the expected number of duty cycle wakeups in single-hop transmission, and is the expected number of duty cycle wakeups in multi hop transmission, and weight represent the forwarding cost in terms of energy. Also, Link_Parameter (i,j) represents success probabilities and Forwarder_set(i) denotes the set of candidate forwarders.
Next, we collect the current duty cycle of relay nodes from the initial relay set Setinitial generated in step-1 (Figure 3). The relay set is updated based on the current duty cycle of relay nodes, and Setactual is the updated relay set. The step-2 (Figure 3) consists of two primary functions, namely; calculation of expected active transmission cost (EATC) and prioritization of relay nodes by using EATC. Therefore, the actual relay list Lactual is built for each node in step-2 itself. For each sender node ‘,’ the relay nodes set are generated for further steps. The EATC of single-hop data forwarding, at particular slot t is derived from the sum of transmission cost and the wait cost as given in Equation (20):
The expected time interval between receiving a packet and beginning to send that packet to other nodes is known as wait cost. EATC of multi-hop data forwarding uses EATC of the single-hop and average EATC of subsequent relay nodes. It can be expressed as given in Equation (21):
where is the size of the relay set, and is the expected active transmission cost for a single hop of receiver node in the relay node-set . Moreover, represents the average dynamic transmission cost of the relay node-set, .
Next, we are explaining the prioritization of relay nodes. The relay nodes are prioritized primarily by applying the EATC. From the previously found relay set Setactual, we construct the actual relay list Lactual for each node based on EATC. The higher priority is assigned to relay nodes which are having lower EATC value. The step-3 (Figure 3) consists of the formation of the proposed MESN model. Here, we use the WOA for optimally selecting the weights of neurons in the reservoir layer of MESN. After successful training the model, the MESN predicts the expected energy acquisition of the next slot in the dynamic duty cycle scenario. In step-4 (Figure 3), updating of the dynamic duty cycle is performed. Here, the energy utilization of time slot is nothing but the sum of the expected energy acquisition of the next time slot and the excess energy of the current time slot. It can be expressed as given in Equation (22):
where, denotes the expected energy gain of next time slot and represents the excess energy in the current time slot. Similarly, the duty cycle updating can be expressed as given in Equation (23):
where, for node k, represents the active time at slot and represents the duty cycle slot length. Also, refers to the energy utilization of time slot, represents maximum consumption of energy for a slot, and represent the energy threshold. The active-duty cycle is referred as and, represents that the node is entirely inactive for time slot.
5. Results and Discussion
In this section, the MESN based dynamic DC with OOR for EH-WSNs is analyzed using network simulator (NS2), the performance analysis uses two simulation scenarios. In the first simulation scenario, the sensor nodes vary from 100 to 500 in the network region 1000 m × 1000 m. In the second simulation scenario, the average energy harvesting rate ranges from 20, 40, 60, 80, and 100 mW with a fixed number of nodes as 500. Each sensor node is having initial energy of 0.5 J in the region. For sending a single packet of size 512 bytes per node, the transmission energy per node is , also receiving energy per node is . The transmission range of each sensor node is 150 m. Here, every node uses the AODV routing protocol for packet transmission. This scenario also uses MAC protocol 802_11. Each sensor node uses an omnidirectional antenna. Also, this scenario uses the two-ray ground radio propagation model. The simulation time is 100 s, and the transmission rate is 500 kbps. Also, this section consists of a comparison of the proposed scheme with the existing state-of-art techniques such as ESN-based, AOR and Max-SNR in terms of parameters such as delay, packet delivery ratio and throughput.
5.1. Impact of Varying the Number of Sensor Nodes
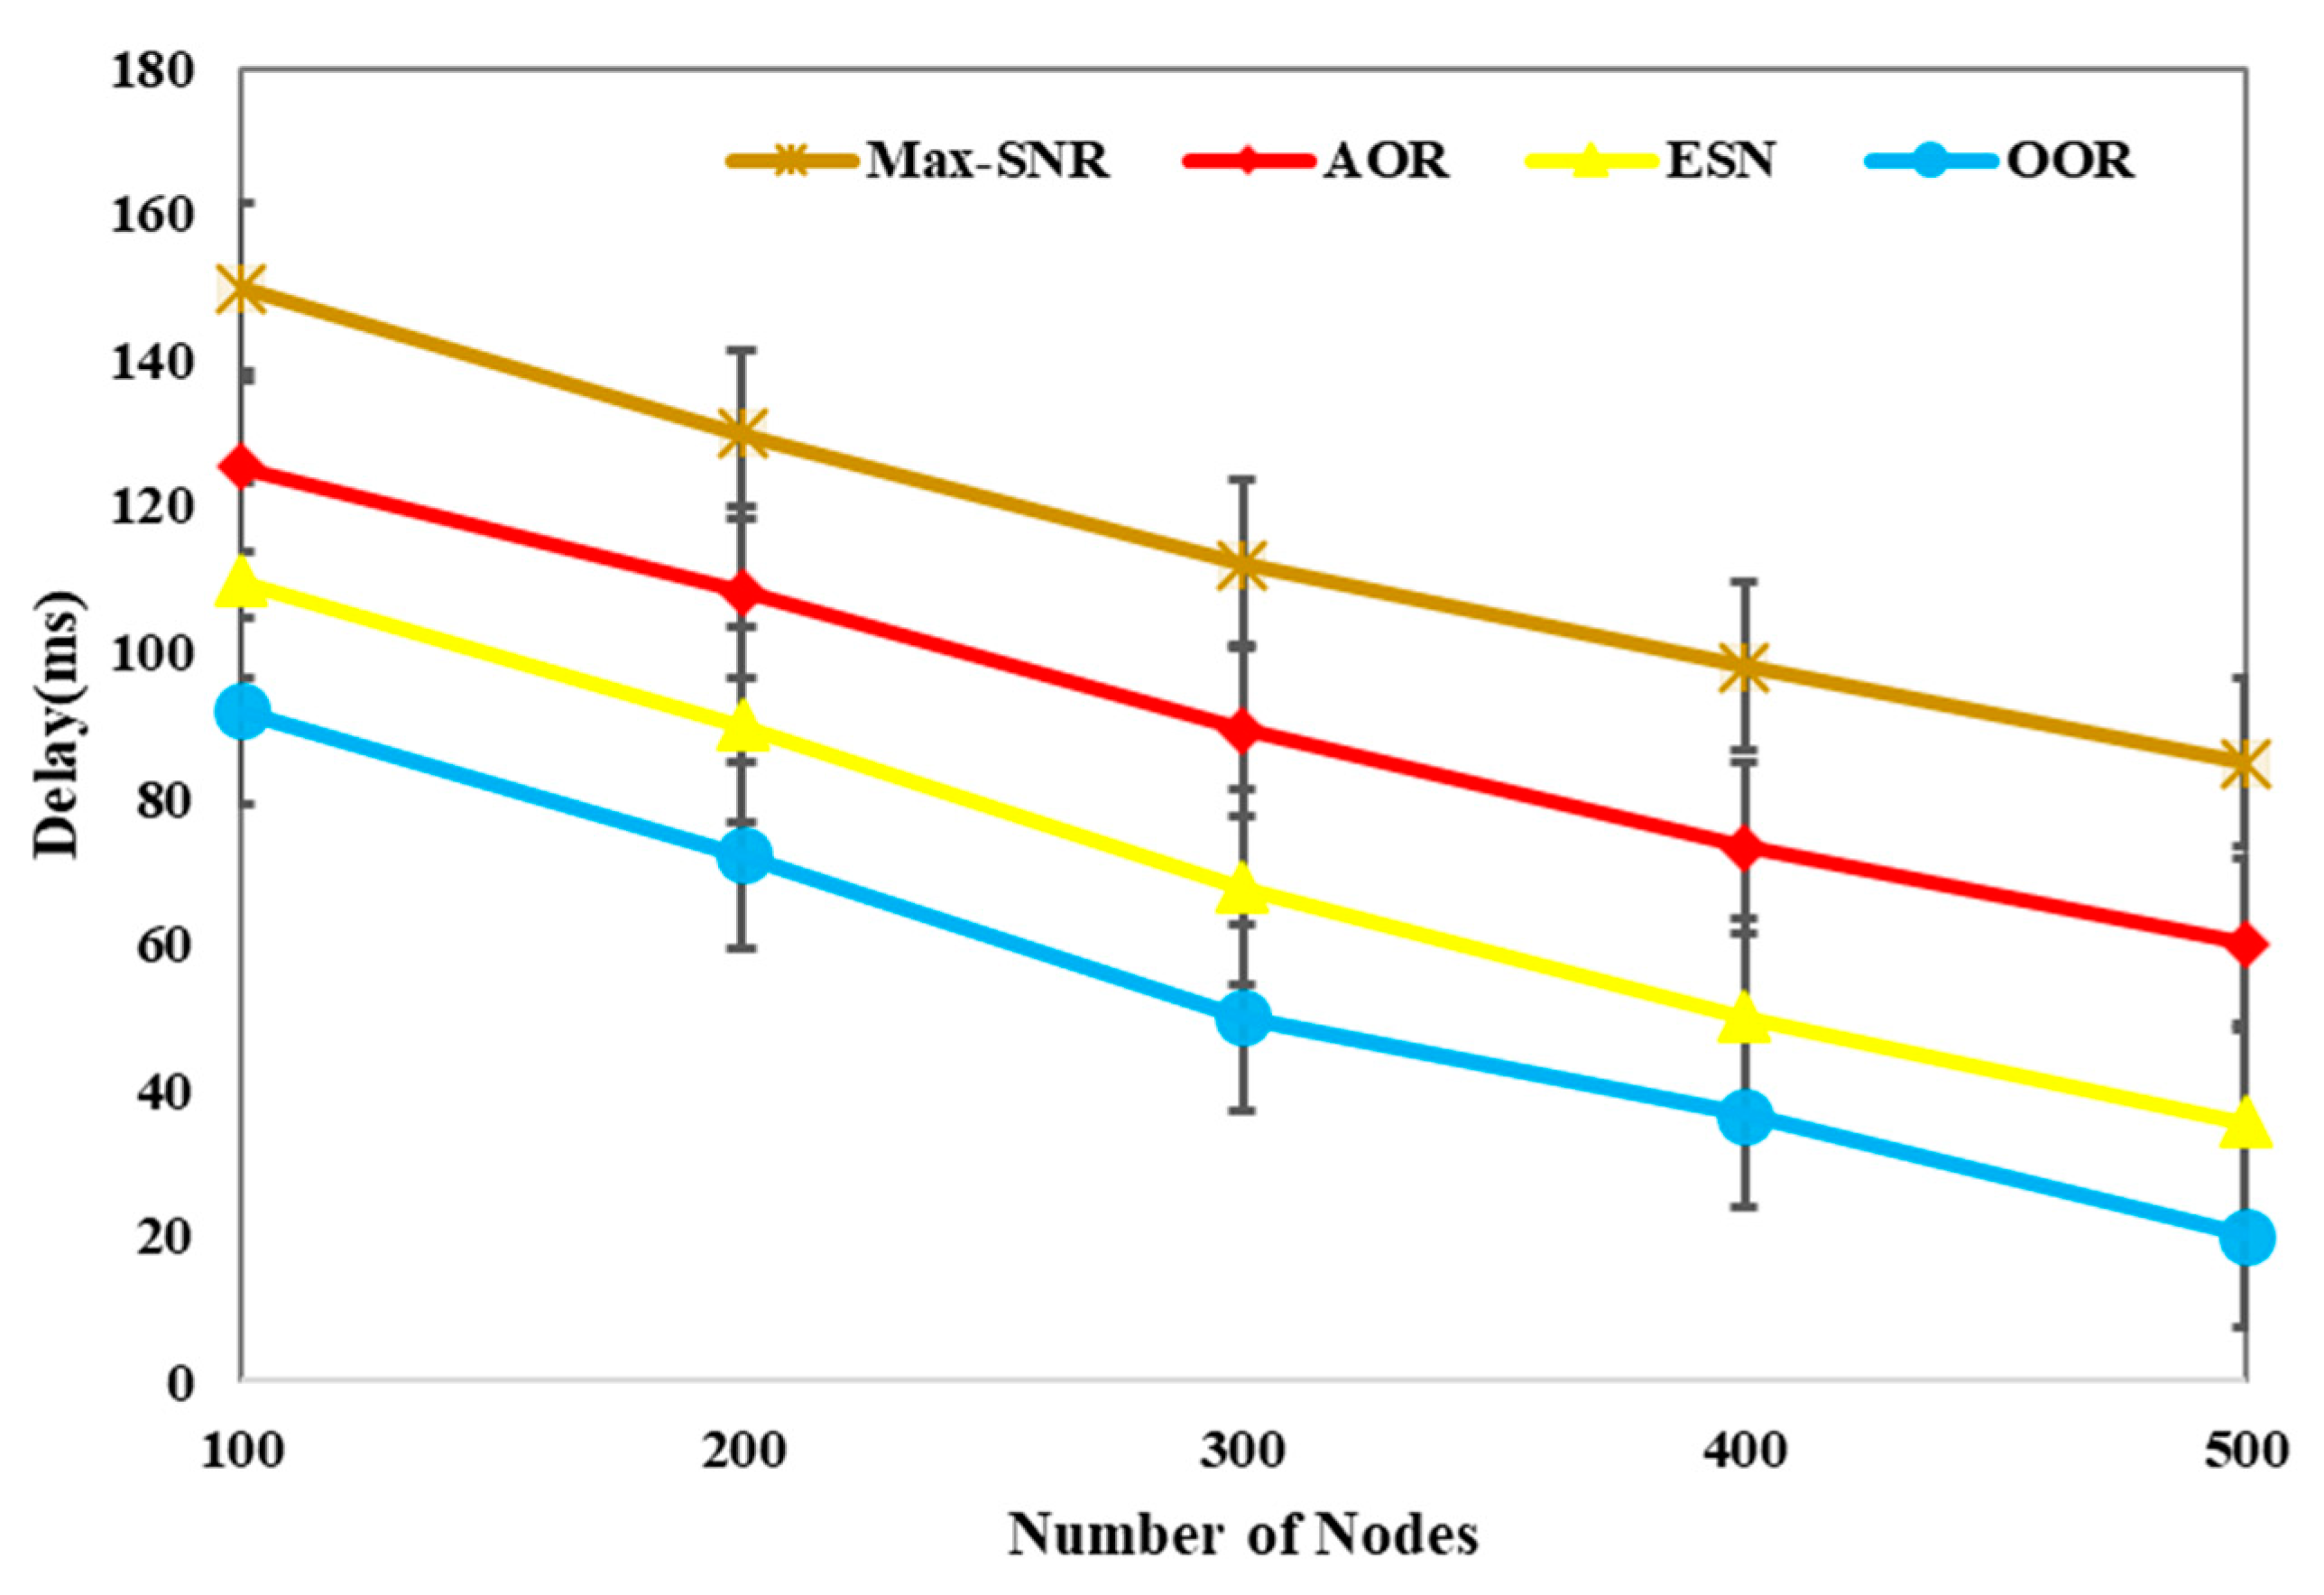
Considering this scenario, we vary the node numbers as 100, 200, 300, 400, and 500 in the experiments. Figure 4 displays the comparison of the proposed OOR scheme with the existing schemes in terms of delay. The graph demonstrates that the delay of our proposed OOR scheme is lower than the existing ESN based, AOR, and Max-SNR schemes respectively.
From the above Figure 4 it can be observed that delay reduces as the number of nodes increases. In OOR, the possibility of selecting the sleeping node as the relay node is less; therefore, the packet is transmitted from source to destination without much delay. Next, Table 1 depicts the performance measurement of the OOR scheme with variation in the number of nodes. Also, Table 1 shows the percentage improvement and average percentage improvement.
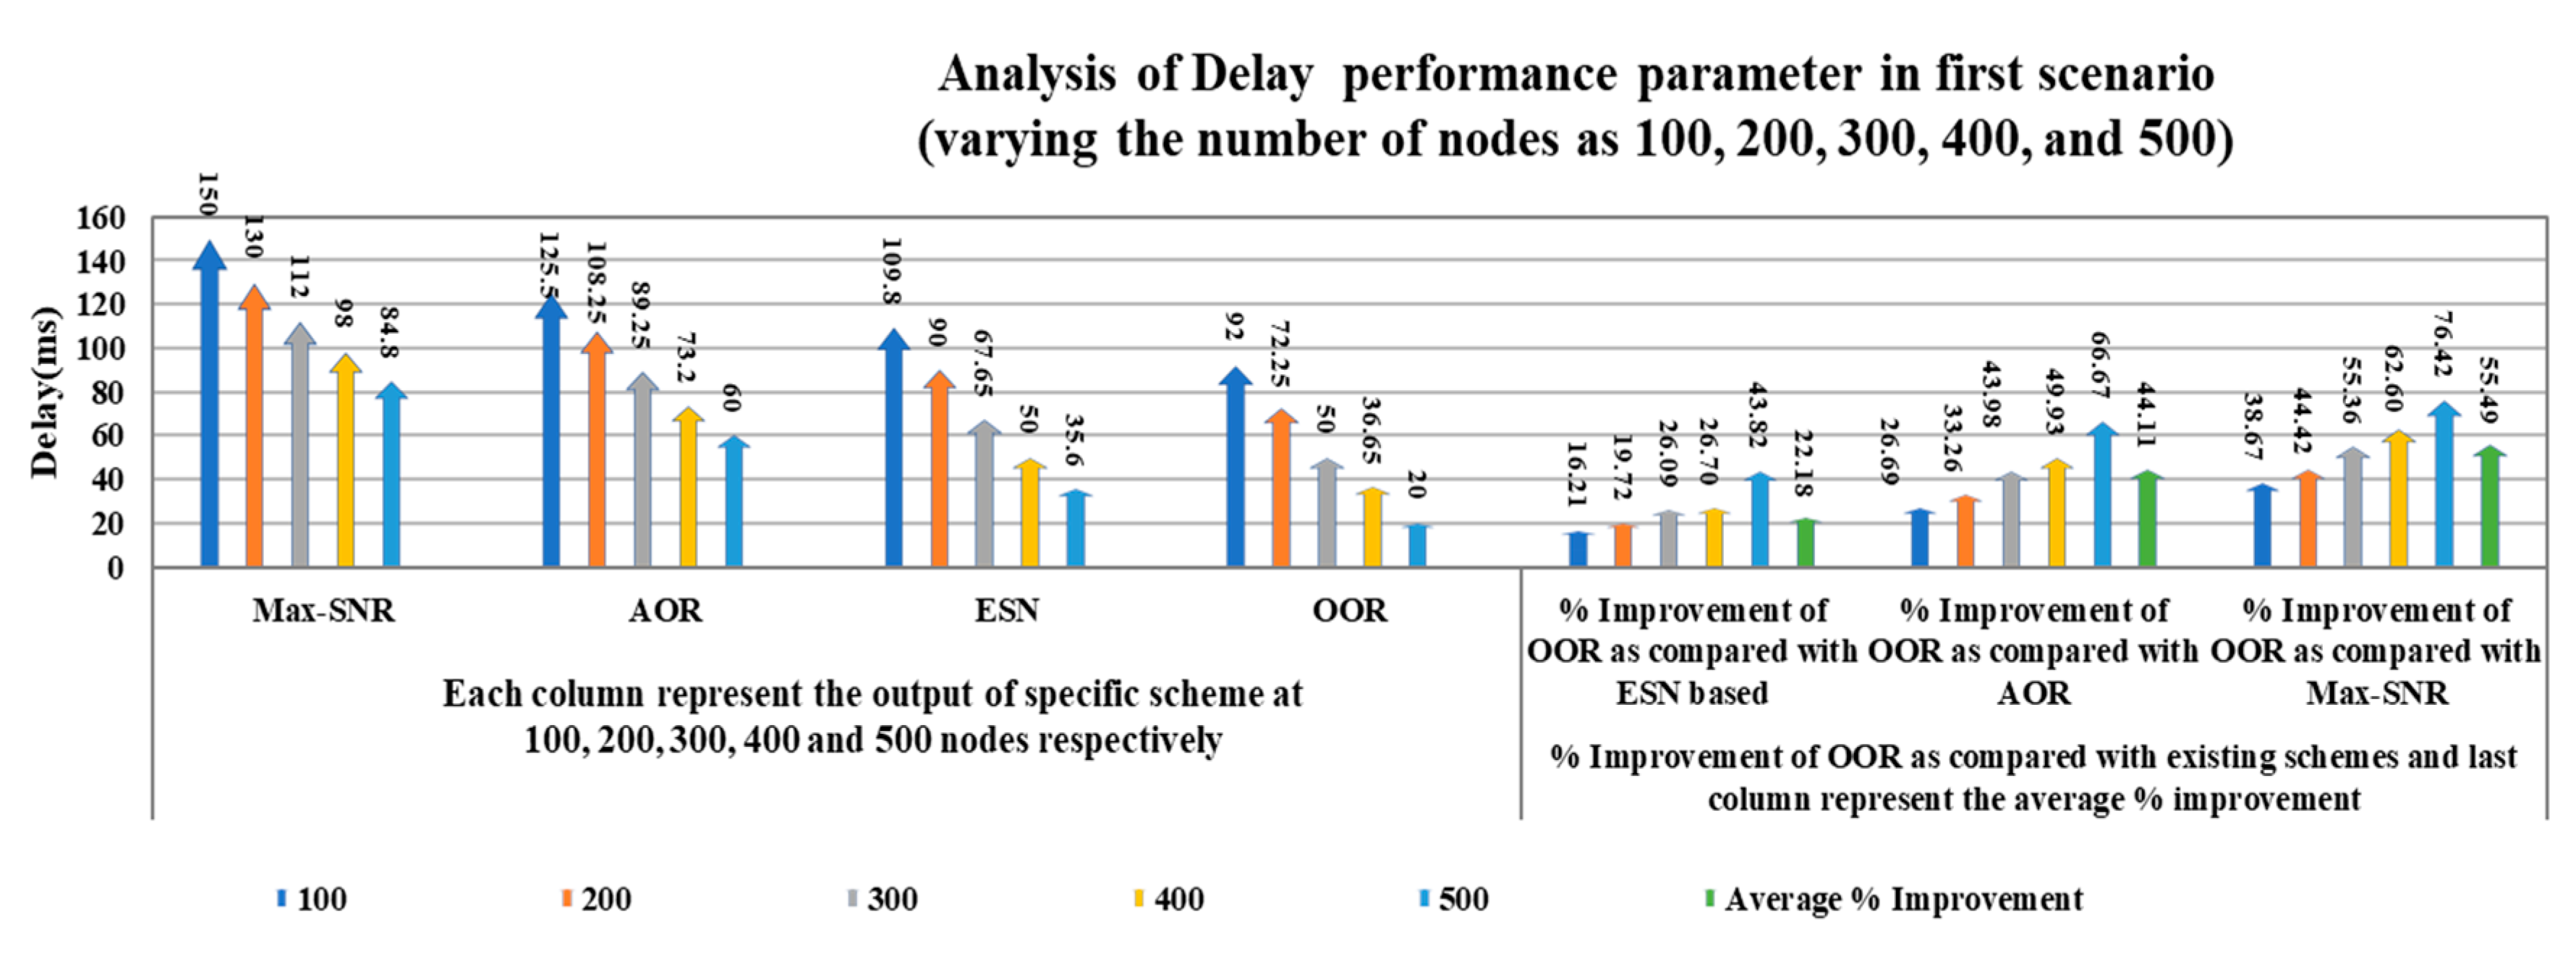
In case of delay, the average percentage improvement of OOR is 22.18, 44.11, and 55.49 as compared to ESN based, AOR, and Max-SNR, respectively. We can show the performance comparison of OOR in a more detailed way in the following Figure 5.
In Figure 5 the five different columns in the first part of the figure show the outcomes of the delay parameter with variation in the number of nodes for each scheme, respectively. For example, consider different columns of the OOR scheme in the first part of the figure; the first column represents the value of delay parameter as 92 ms at 100 nodes, whereas the fifth column depicts the value of 20 ms at 500 nodes. In the second part of the figure, the five different columns show the percentage improvement, and the sixth column represents the average percentage improvement.
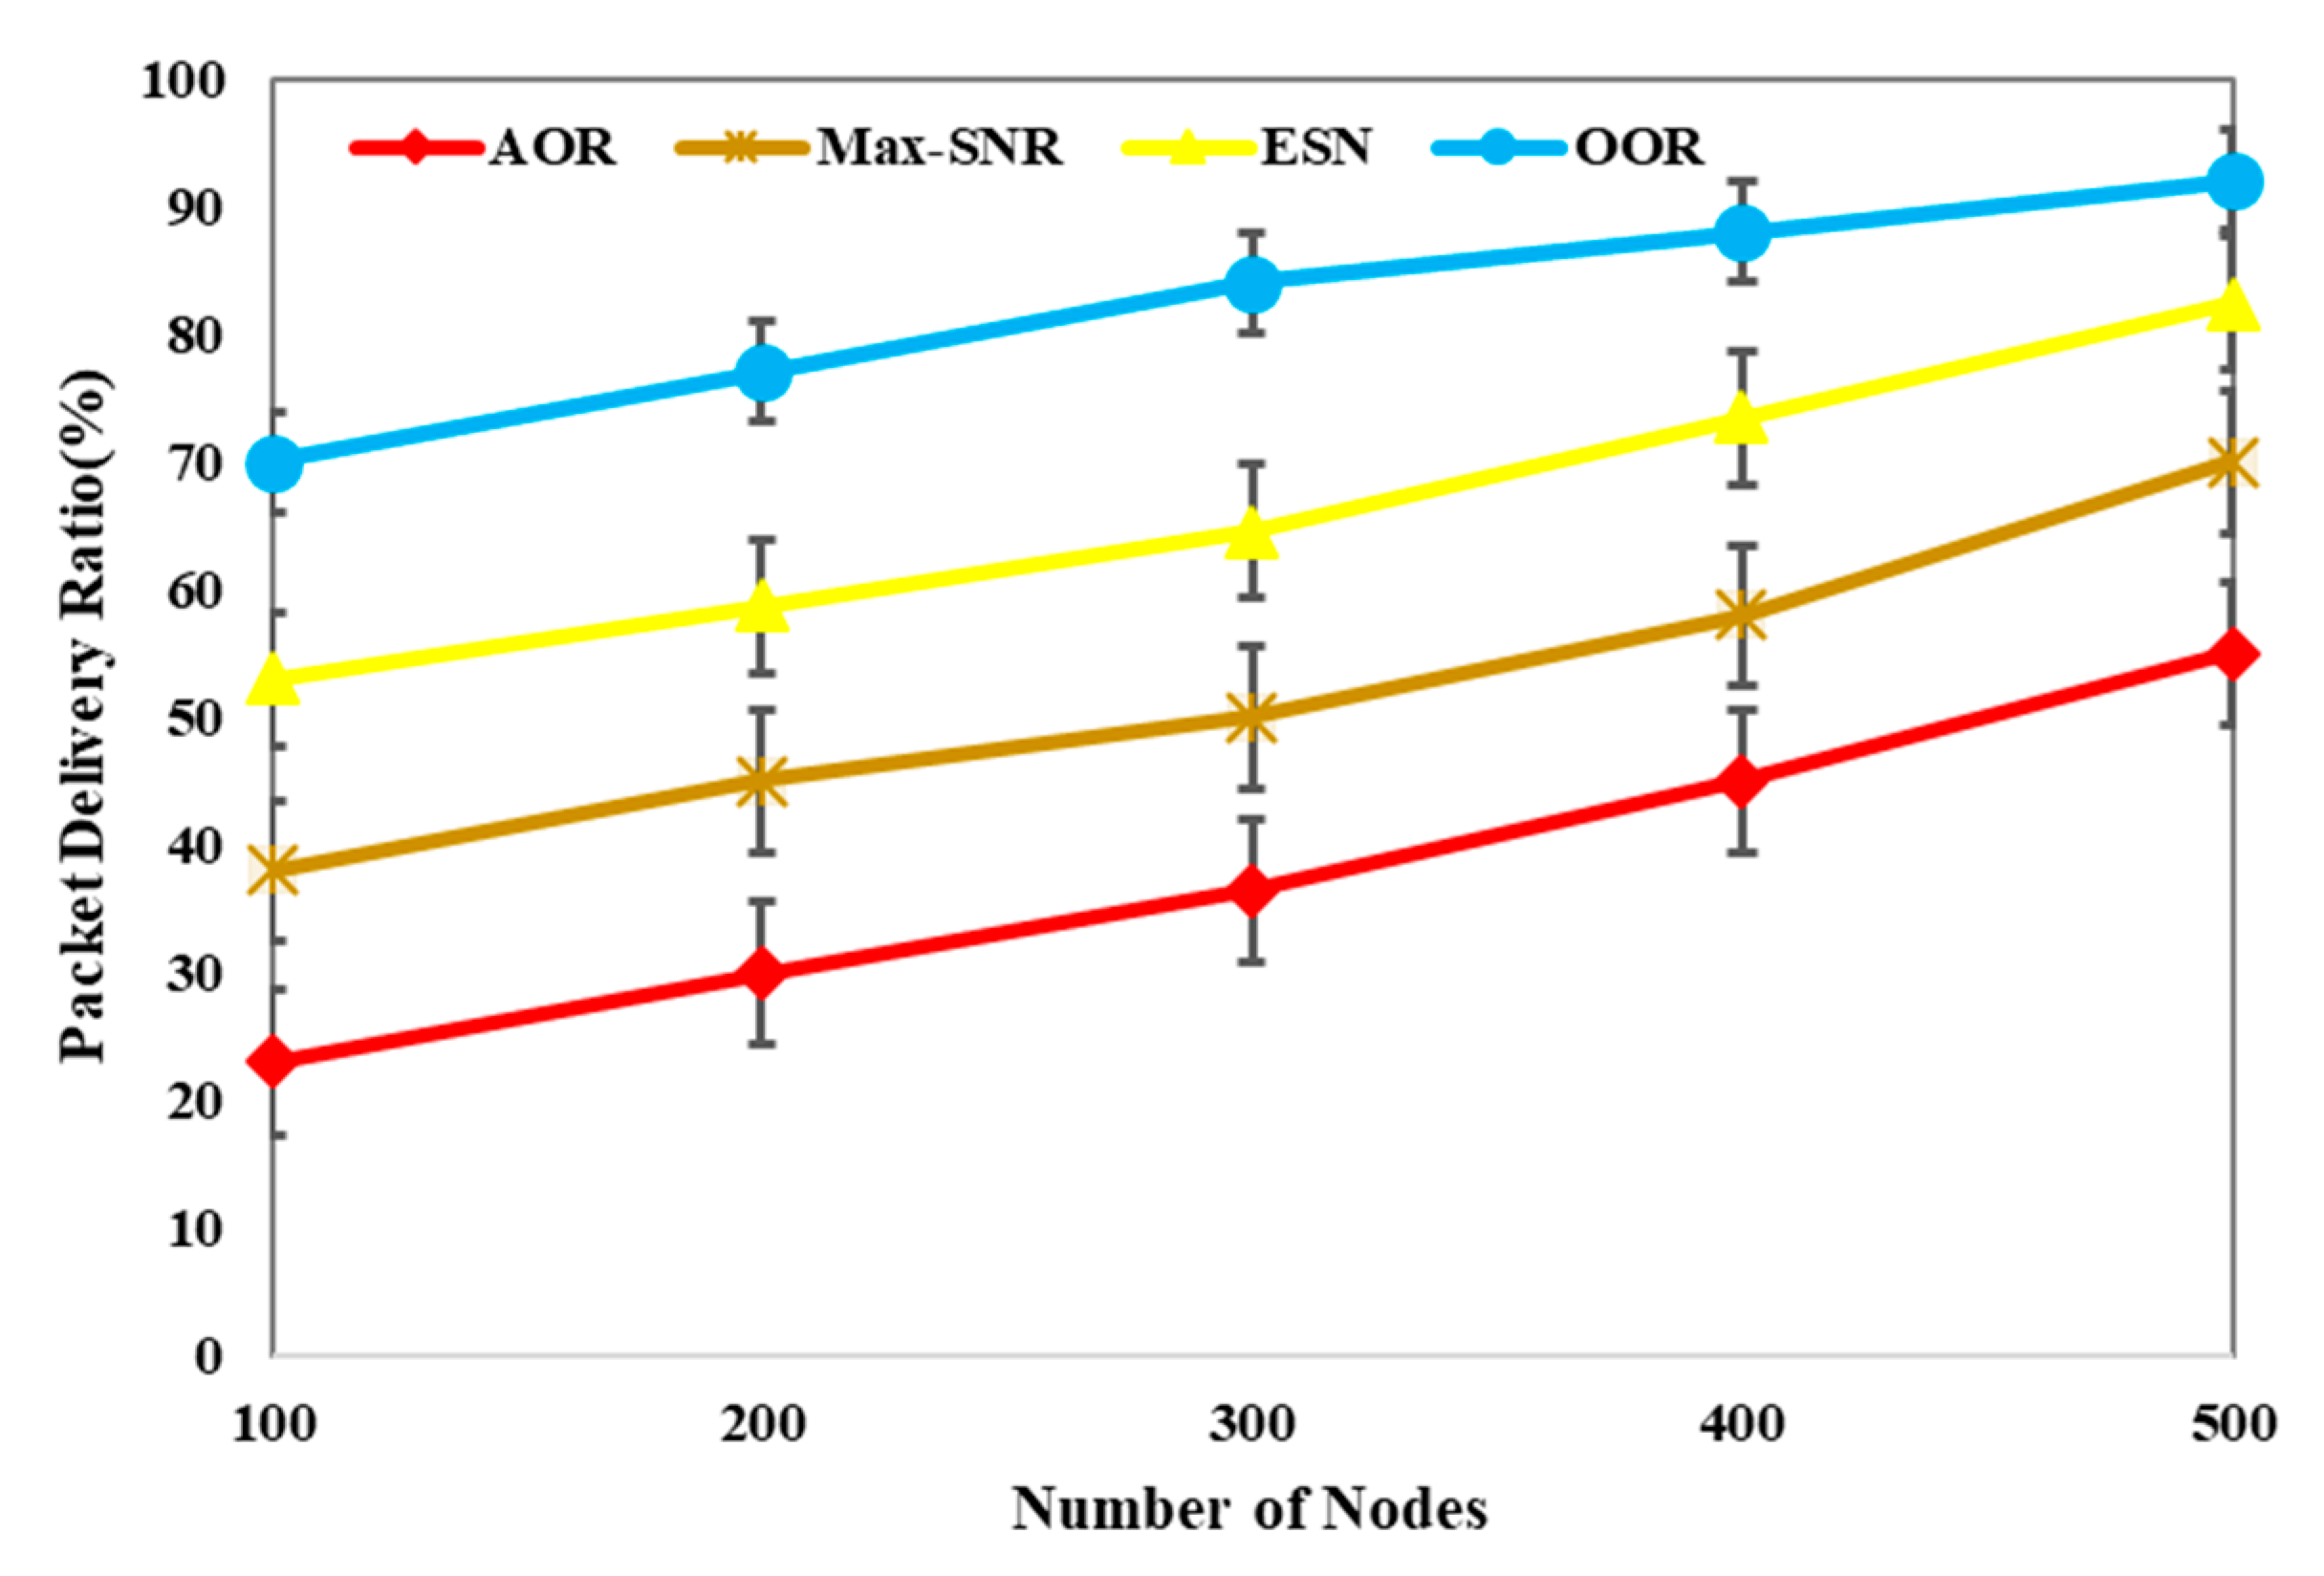
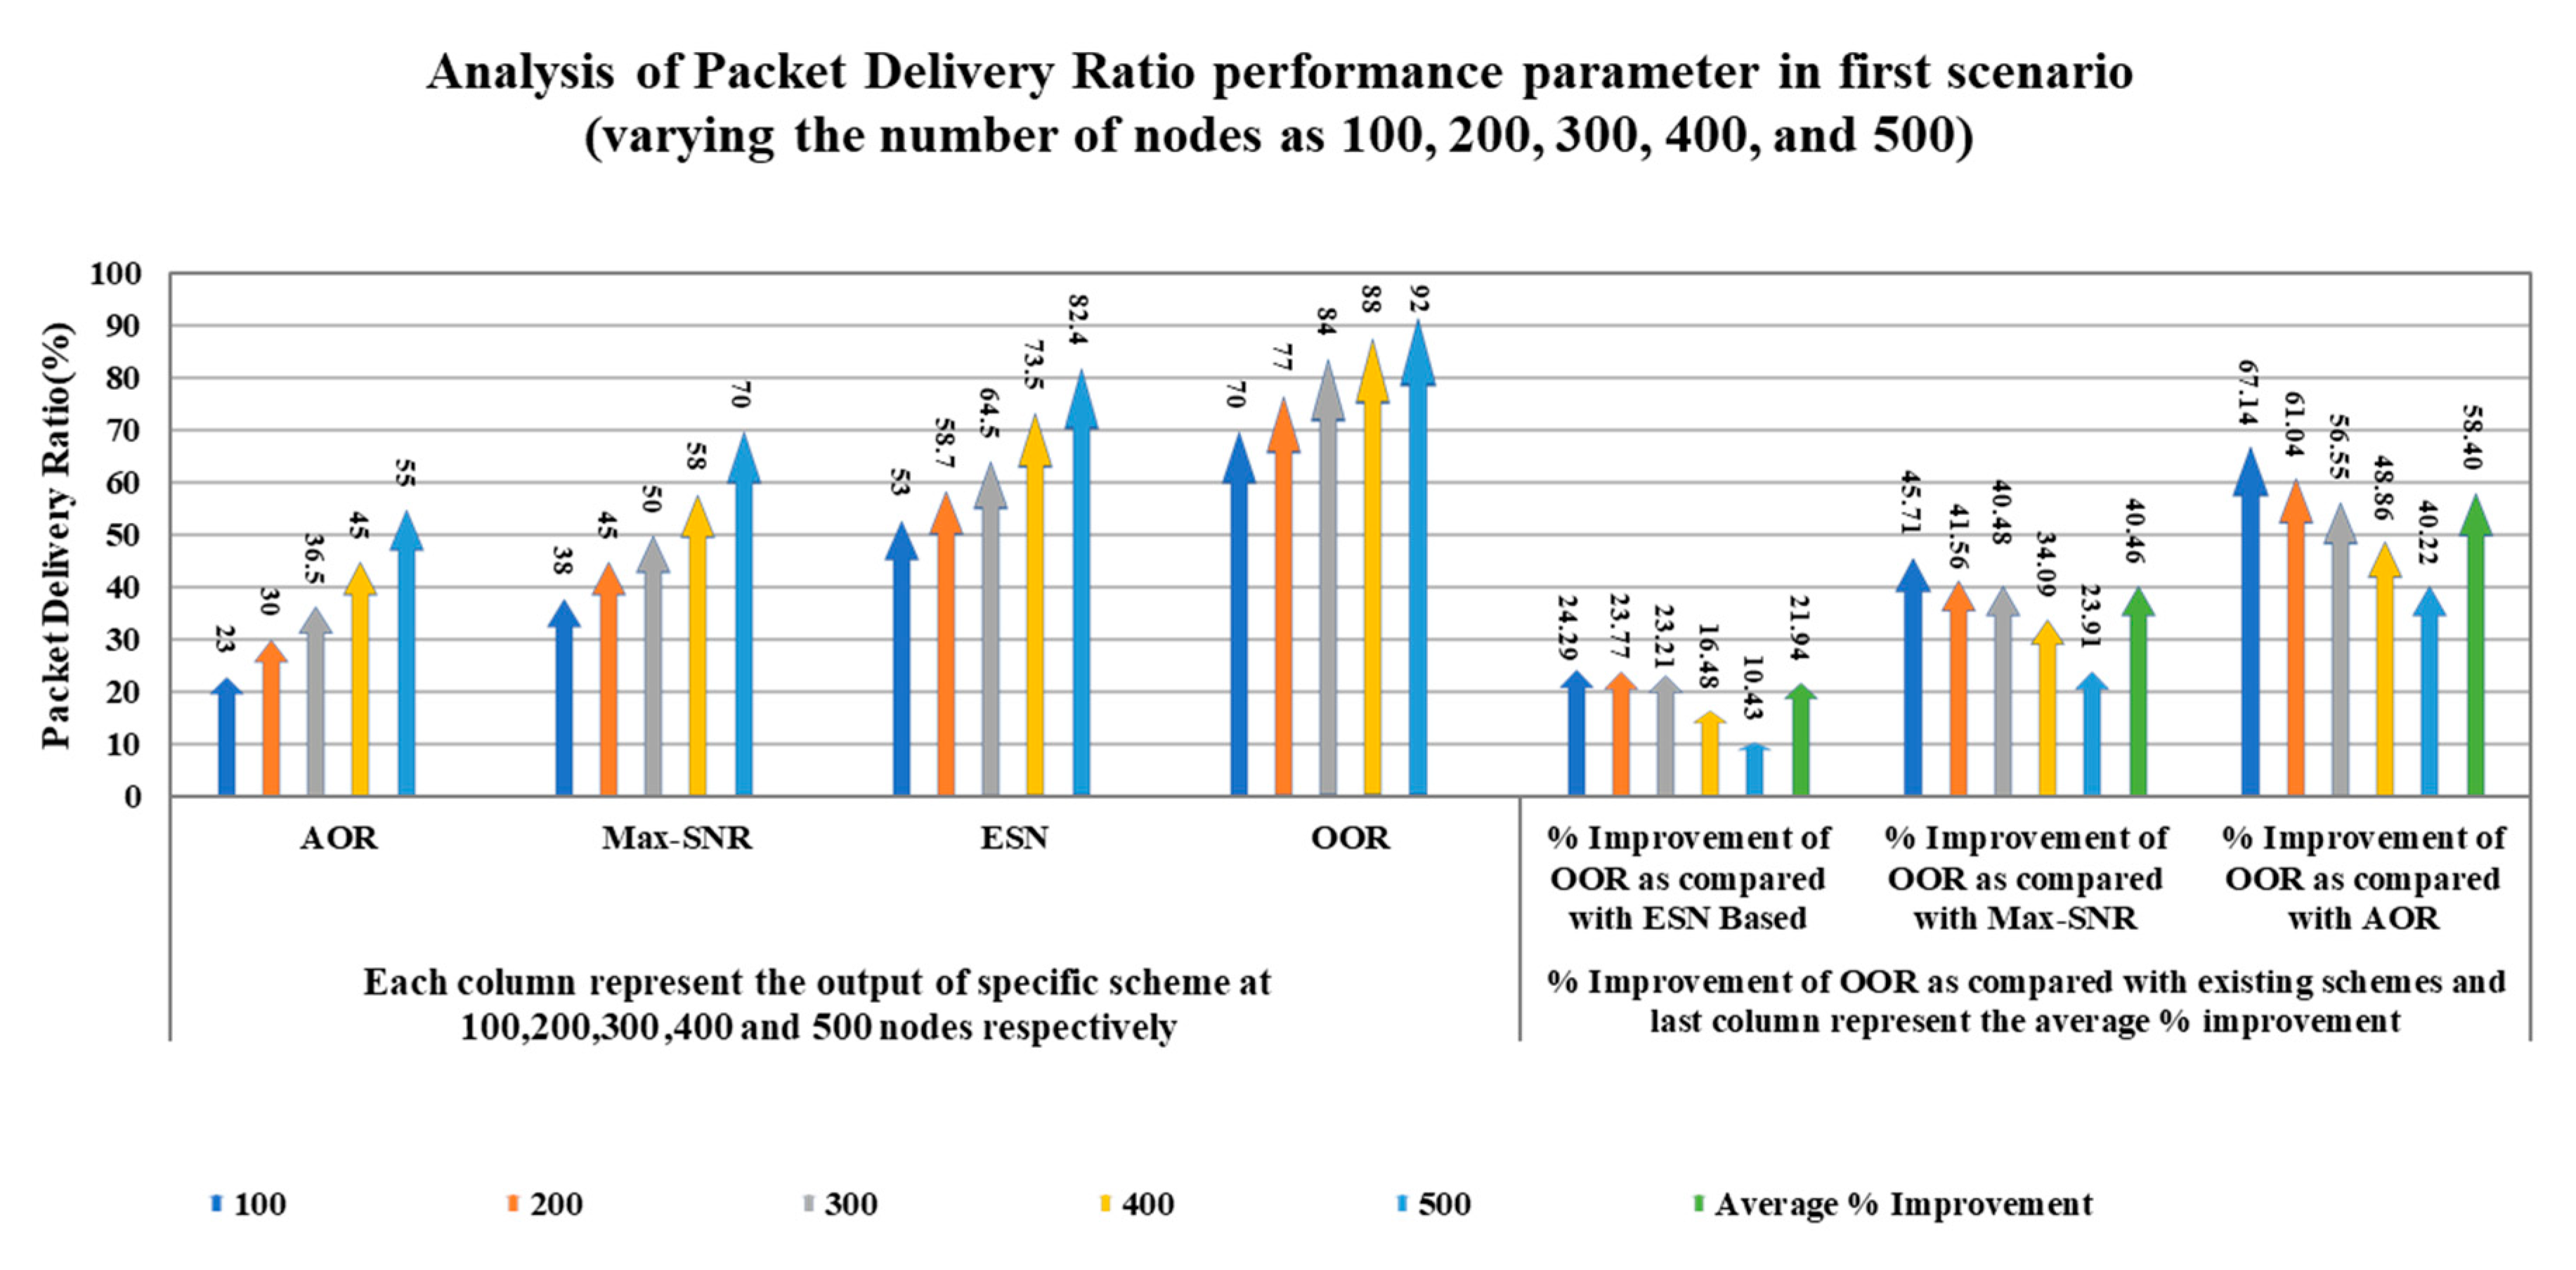
Figure 6 demonstrates the comparison of the packet delivery ratio of the proposed OOR scheme and existing schemes. The result indicates that the packet delivery ratio of the proposed OOR scheme is higher than the existing ESN based, Max-SNR, and AOR schemes, respectively.
Concerning the above graph, increasing the number of nodes, packet delivery ratio (PDR) increases; this shows the perfect agreement with the theoretical background. In our proposed scheme, the possibility of selecting the sleeping forwarder node is very less because we have applied the multistage relay set optimization mechanism, which results in a higher packet delivery ratio. Hence, we can say that the proposed OOR is the best solution out of various algorithms available in the literature. Further, Table 2 depicts the performance of the OOR scheme with variation in the number of nodes. Also, Table 2 shows the percentage improvement and average percentage improvements both.
Next for the packet delivery ratio, the average percentage improvement of OOR is 21.94, 40.46, and 58.40 as compared to ESN based, Max-SNR, and AOR, respectively.
We can show the performance comparison of OOR in a more presentable way in the following Figure 7.
In Figure 7, again, the five different columns in the first part of the figure show the outcomes of the packet delivery ratio parameter with variation in the number of nodes for each scheme, respectively. For example, consider different columns of the OOR scheme in the first part of the figure; the second column represents the value of the packet delivery ratio parameter as 77 at 200 nodes, whereas the fifth column depicts the value 92 at 500 nodes. In the second part of the figure, the five different columns show the percentage improvement, and the sixth column describes the average percentage improvement.
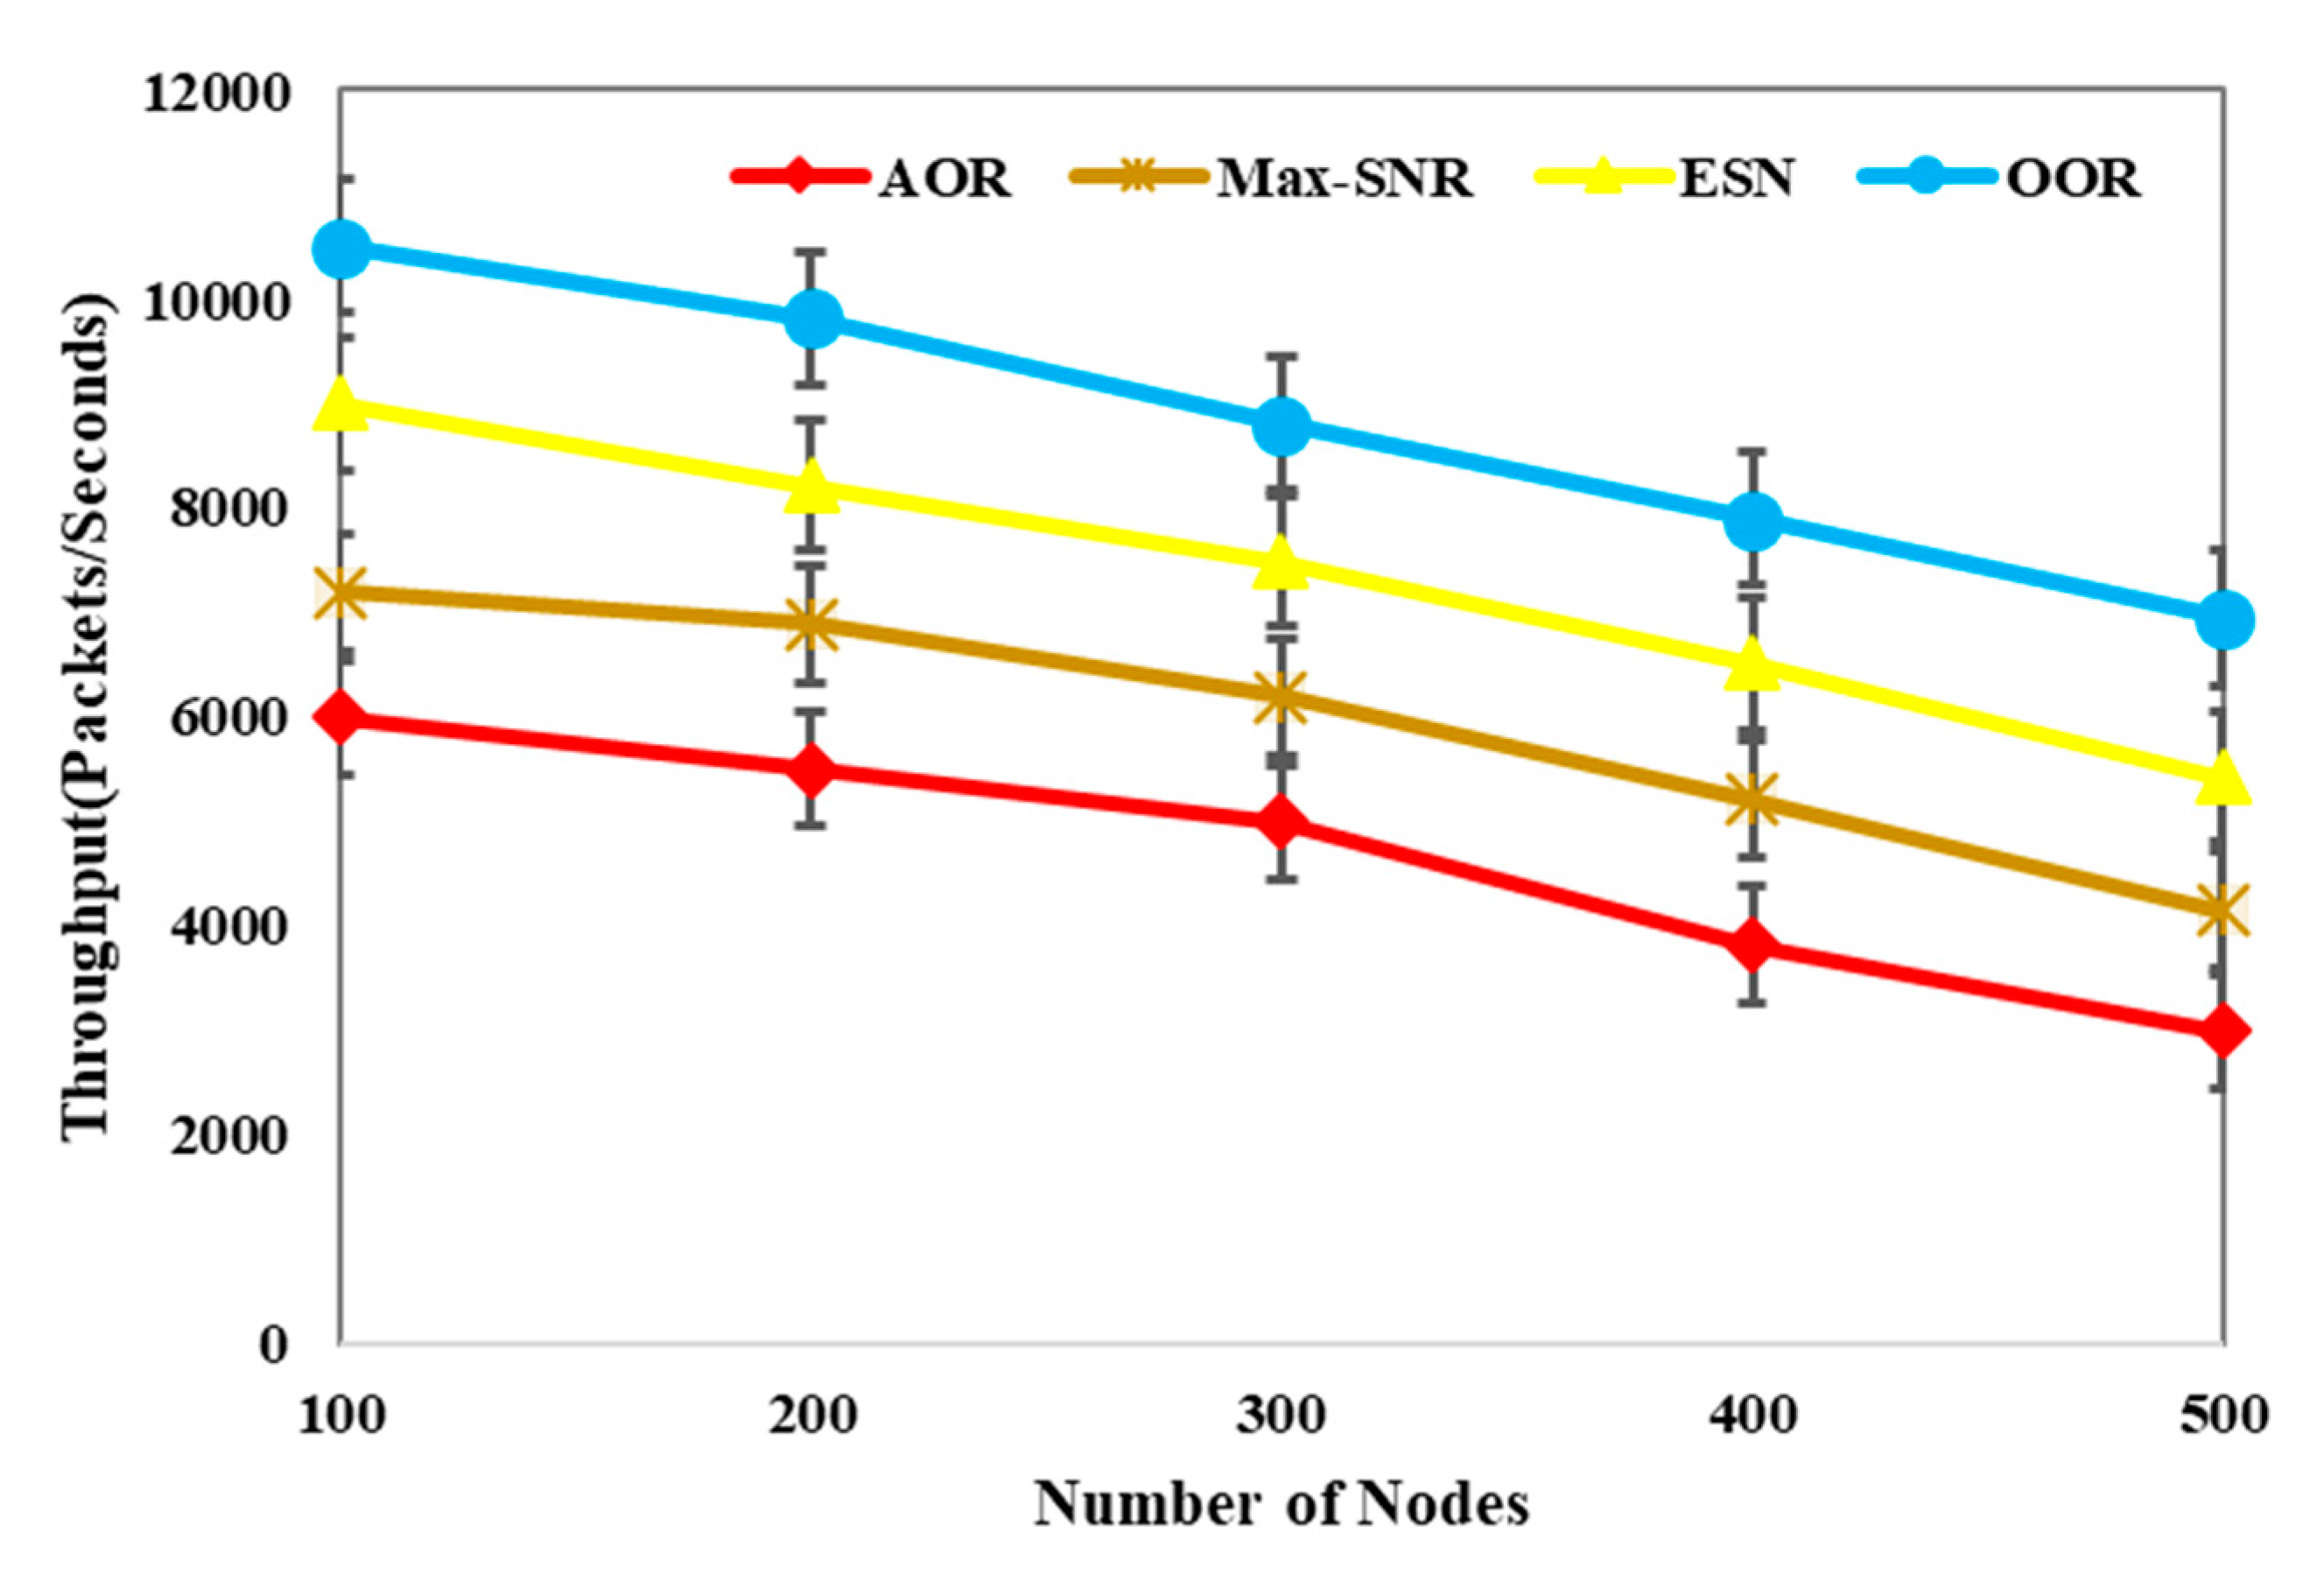
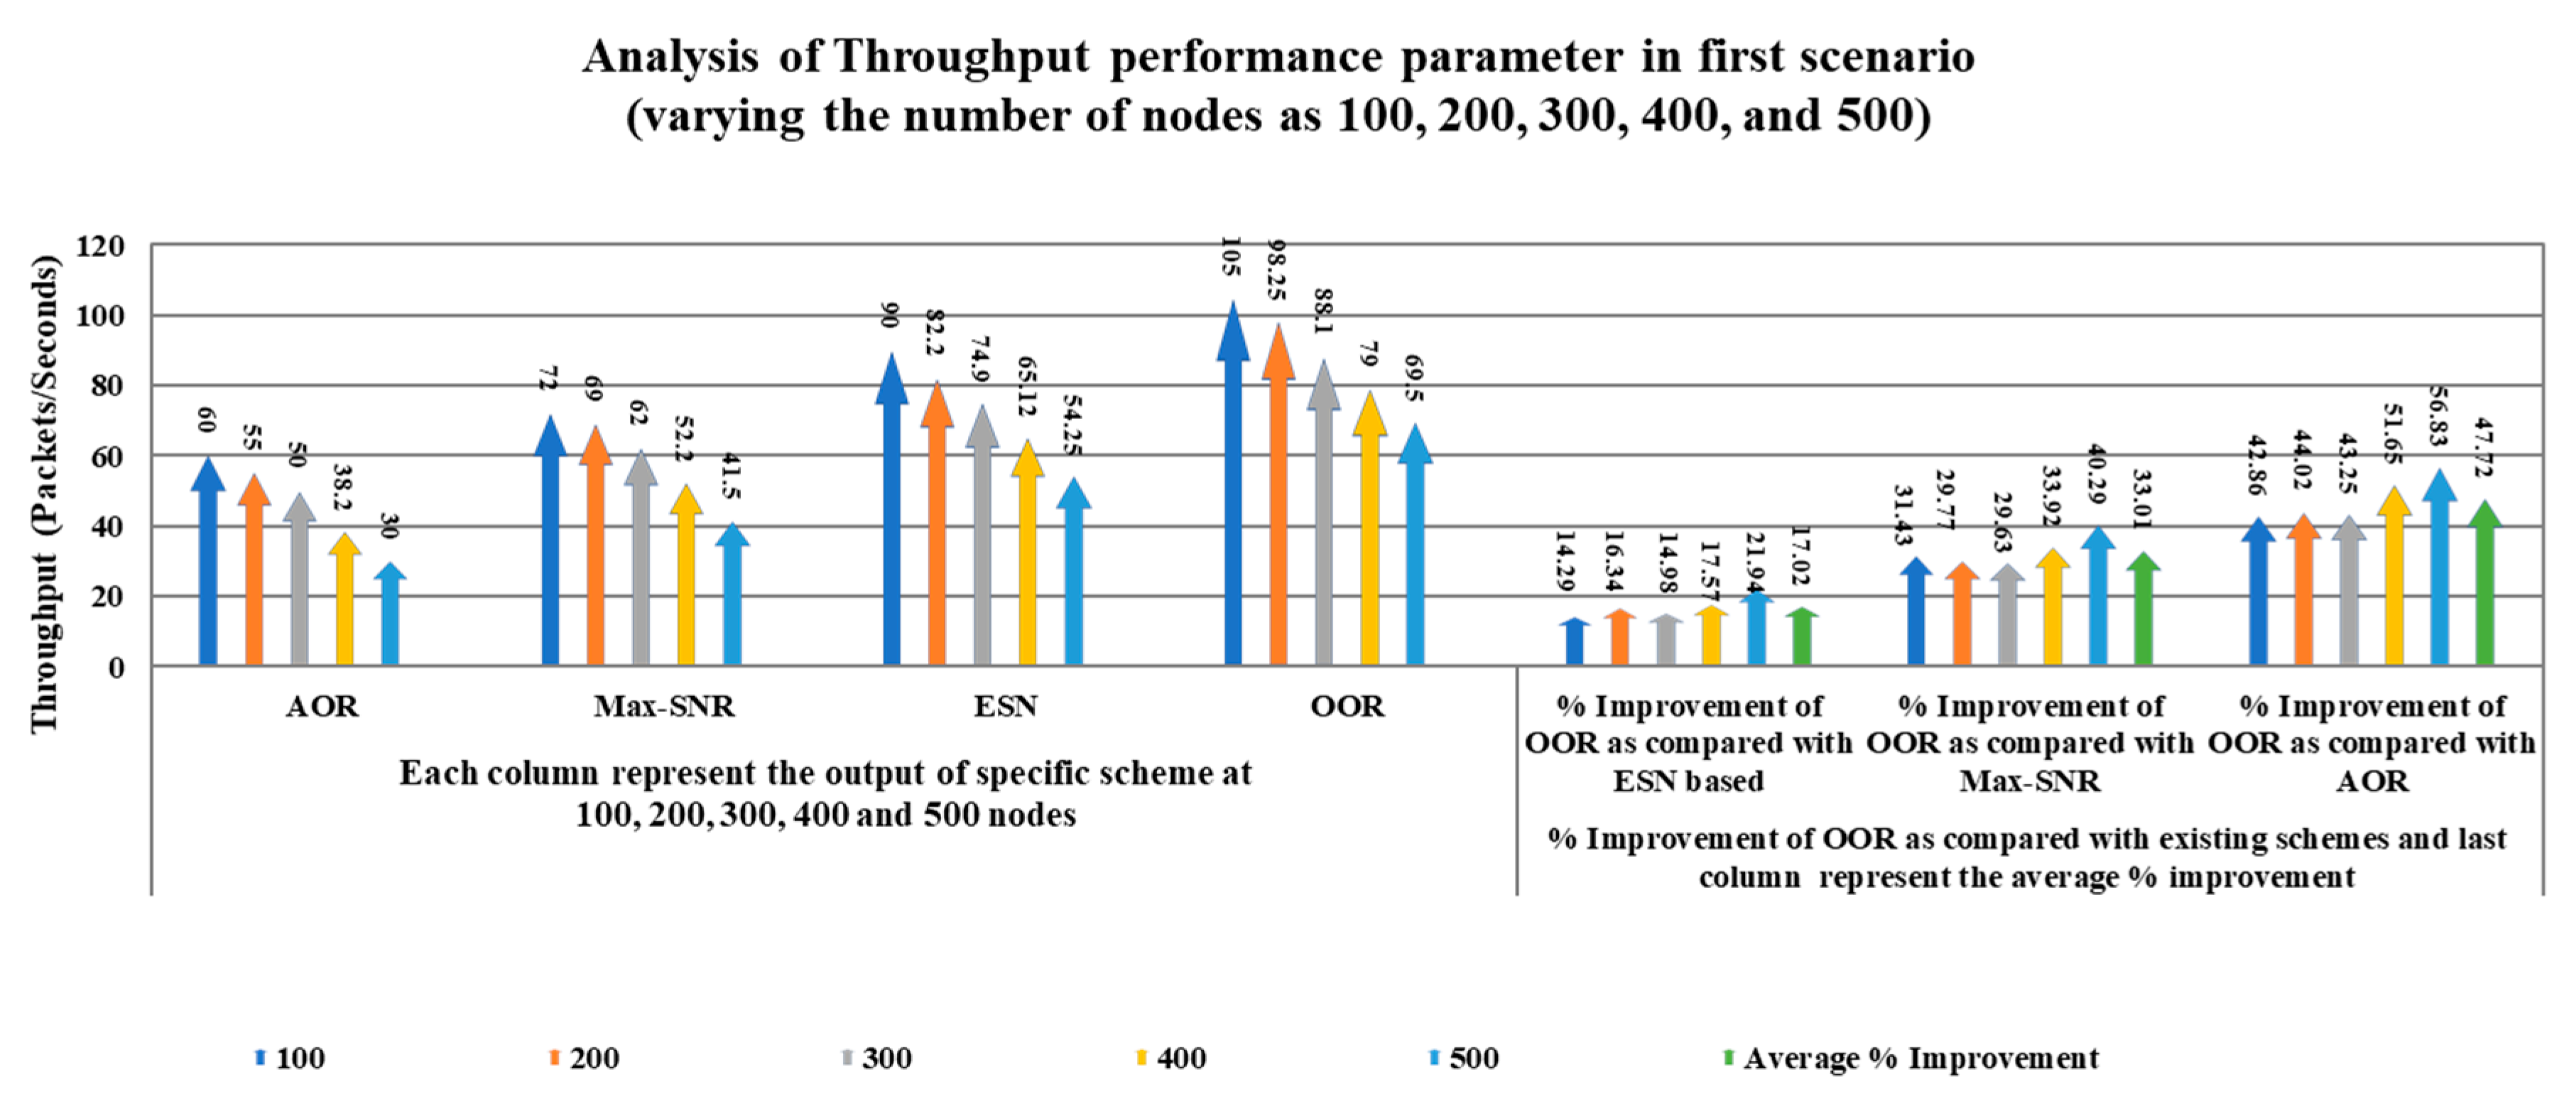
Figure 8 depicts the comparison of the proposed OOR scheme with the existing schemes in terms of throughput. The graph demonstrates that the throughput of the proposed OOR scheme is higher than the existing ESN-based, Max-SNR, and AOR schemes, respectively.
From the above Figure 8, it is noticeable that as the number of nodes increases, throughput decreases, and the reason behind it is that the probability of packet error is proportional to the number of nodes. Therefore, the number of nodes increases, the packet error also increases, results in decreasing throughput. Moreover, Table 3 depicts the performance of the OOR scheme with variation in the number of nodes. Furthermore, Table 3 shows the percentage improvement and average percentage improvements both.
From the above table, the average percentage improvement of OOR is 17.02, 33.01, and 47.72 as compared to ESN based, Max-SNR, and AOR respectively. Further, we can show the performance comparison of OOR in a more descriptive way in the following Figure 9.
In Figure 9 the five different columns in the first part of the figure show the outcomes of the throughput parameter in 100 scale with variation in the number of nodes for each scheme, respectively. For example, consider different columns of OOR scheme in the first part of the figure, the third column represents the value of throughput parameter as 88.1 (packets/s) at 300 nodes in 100 scale whereas the fifth column depicts the value of 69.5 (packets/s) at 500 nodes in 100 scale. The values can be verified in Table 3. We use the 100 scale for better representation of columns in the figure. In the second part of the figure, the five different columns show the percentage improvement, and the sixth column depicts the average percentage improvement.
5.2. Impact of Varying Average Energy Harvesting Rate
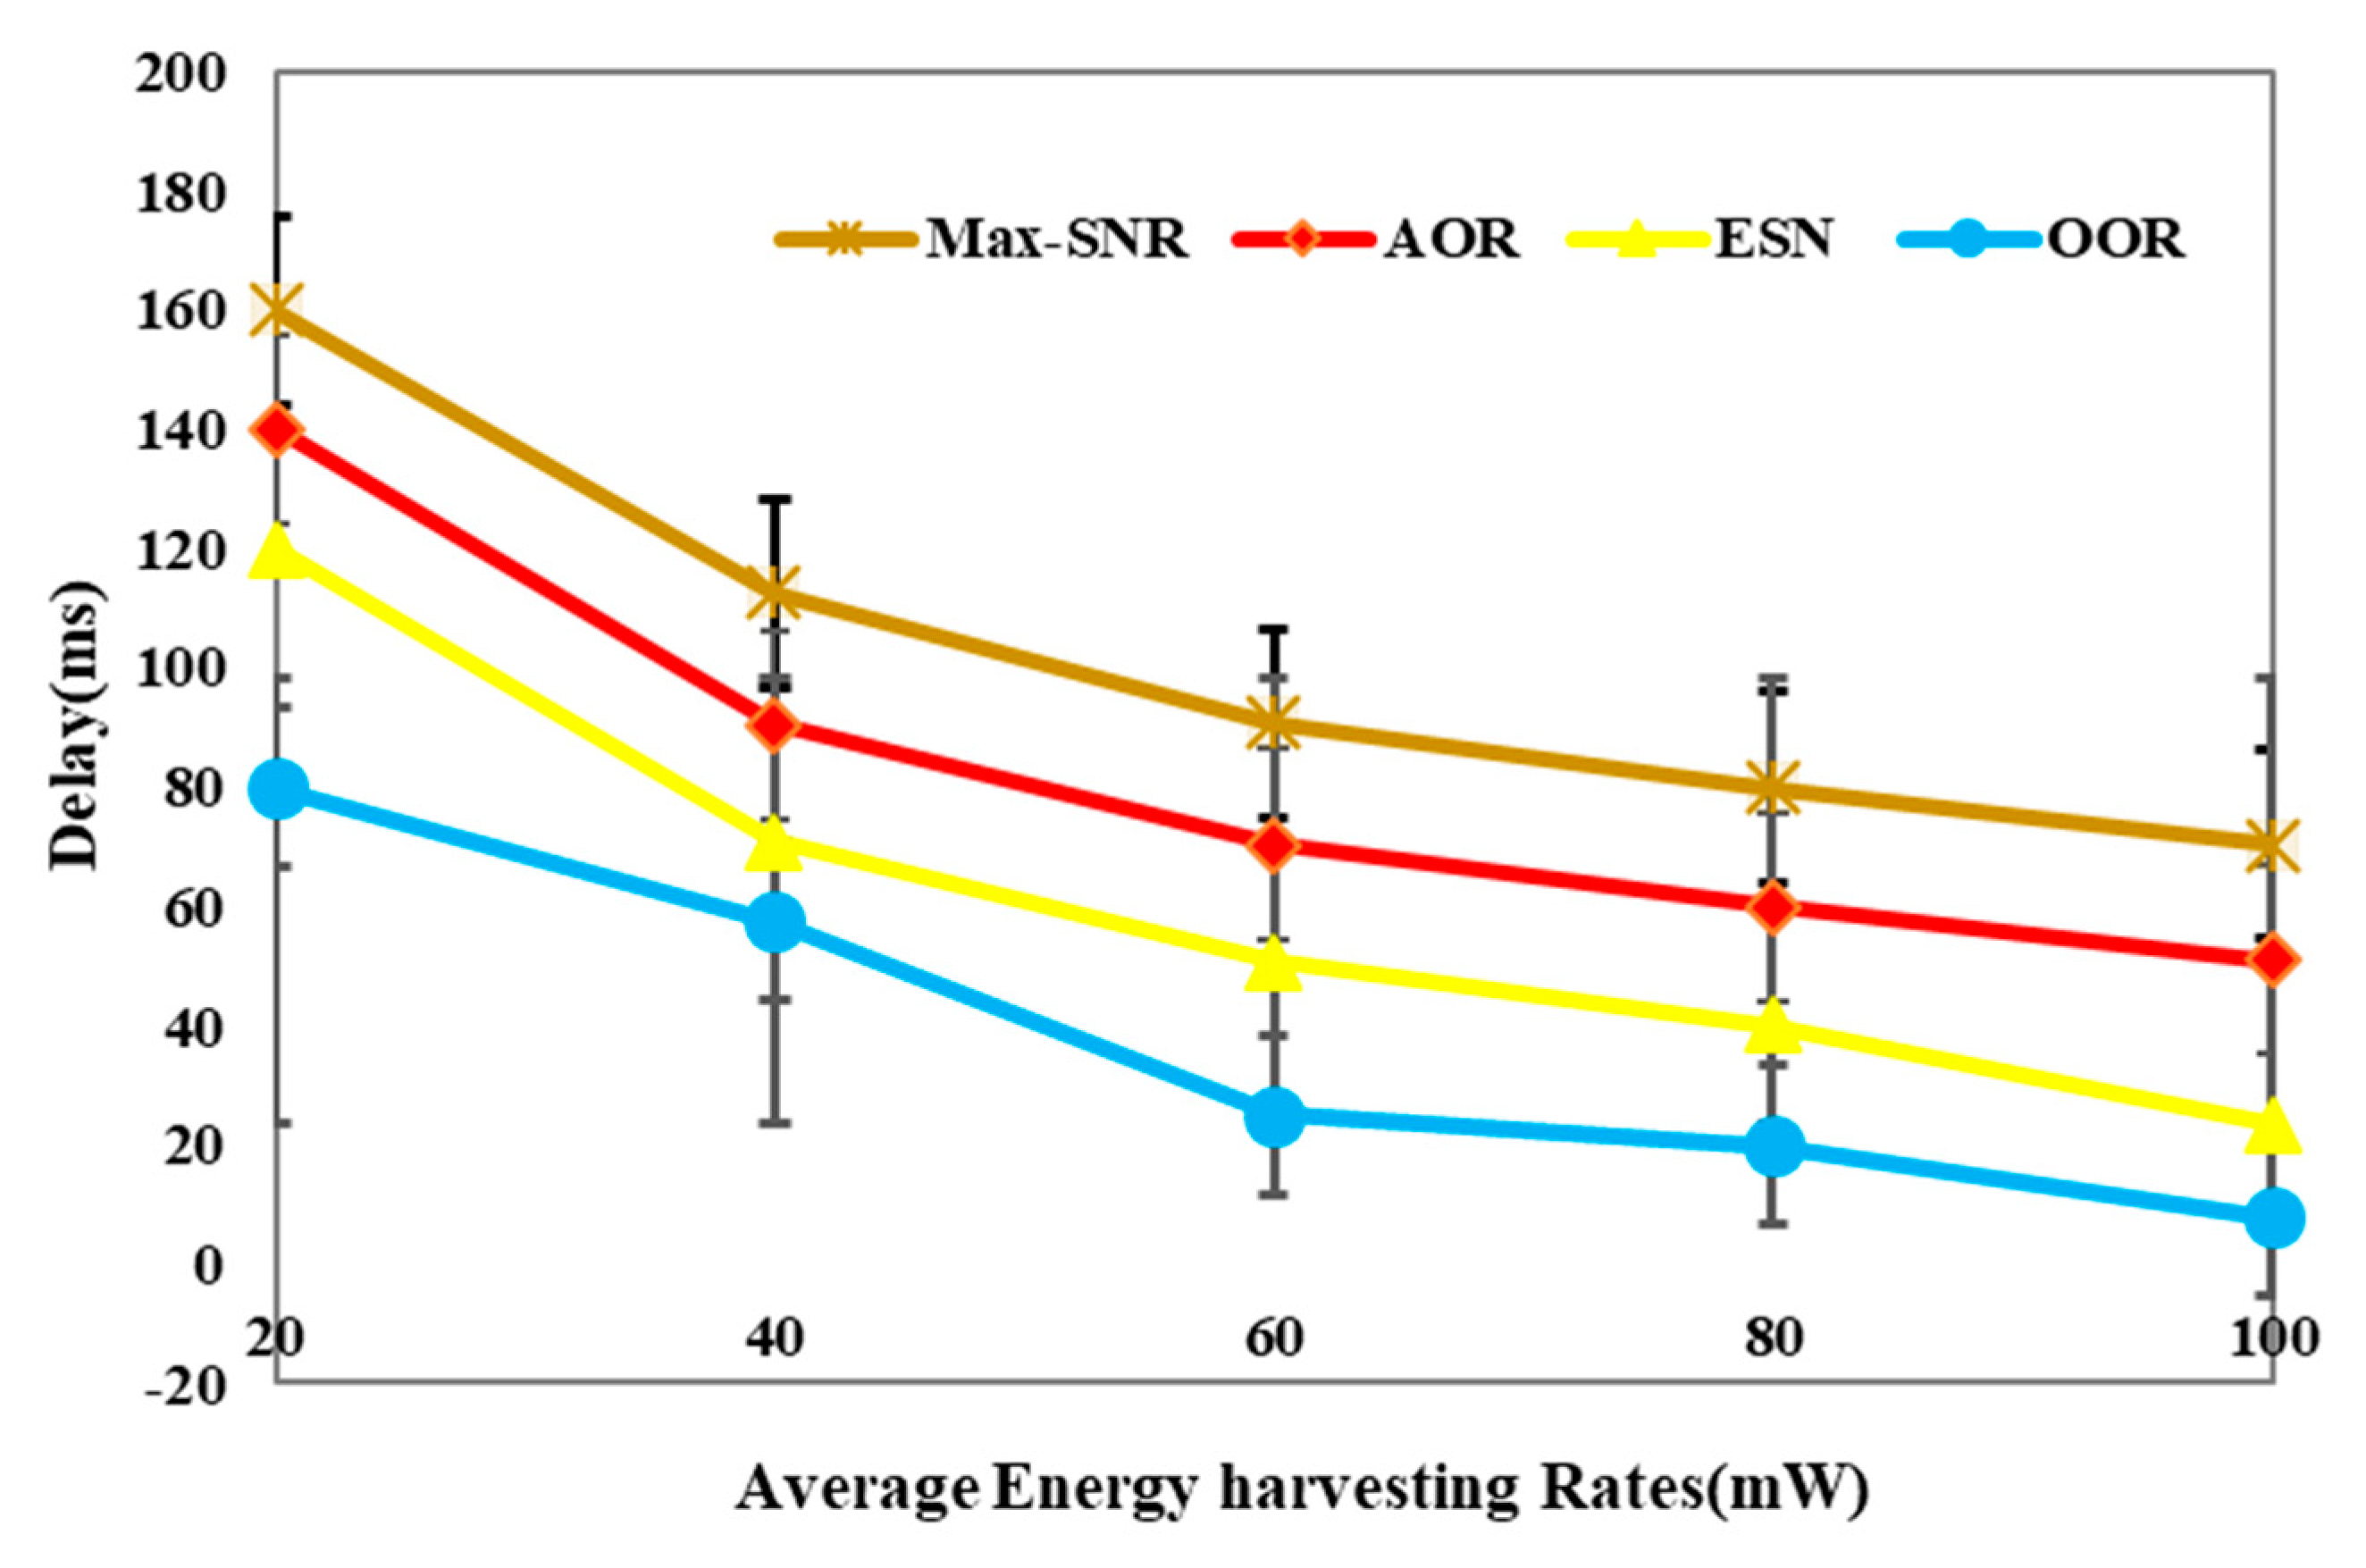
In this scenario, we vary the average energy-harvesting rate as 20, 40, 60, 80, and 100 mW with a fixed number of nodes as 500. Figure 10 demonstrates the comparison of the proposed OOR scheme with existing schemes. In terms of delay. The analysis demonstrates that the delay of the proposed OOR scheme is lower than the existing ESN-based, AOR, and Max-SNR schemes, respectively.
From the above Figure 10 it can find out that delay decreases with an increase in average energy harvesting rate, and the reason behind is that the number of nodes is 500, and the average energy harvesting rate is increasing gradually from 20, 40, 60, 80 and 100 mW. Now active relay nodes will be high as compared with sleeping relay nodes, and consequently, the delay will decrease. Next, Table 4 depicts the performance of the OOR scheme with variation in the average energy harvesting rates. Also, Table 4 shows the percentage improvement and average percentage improvements both.
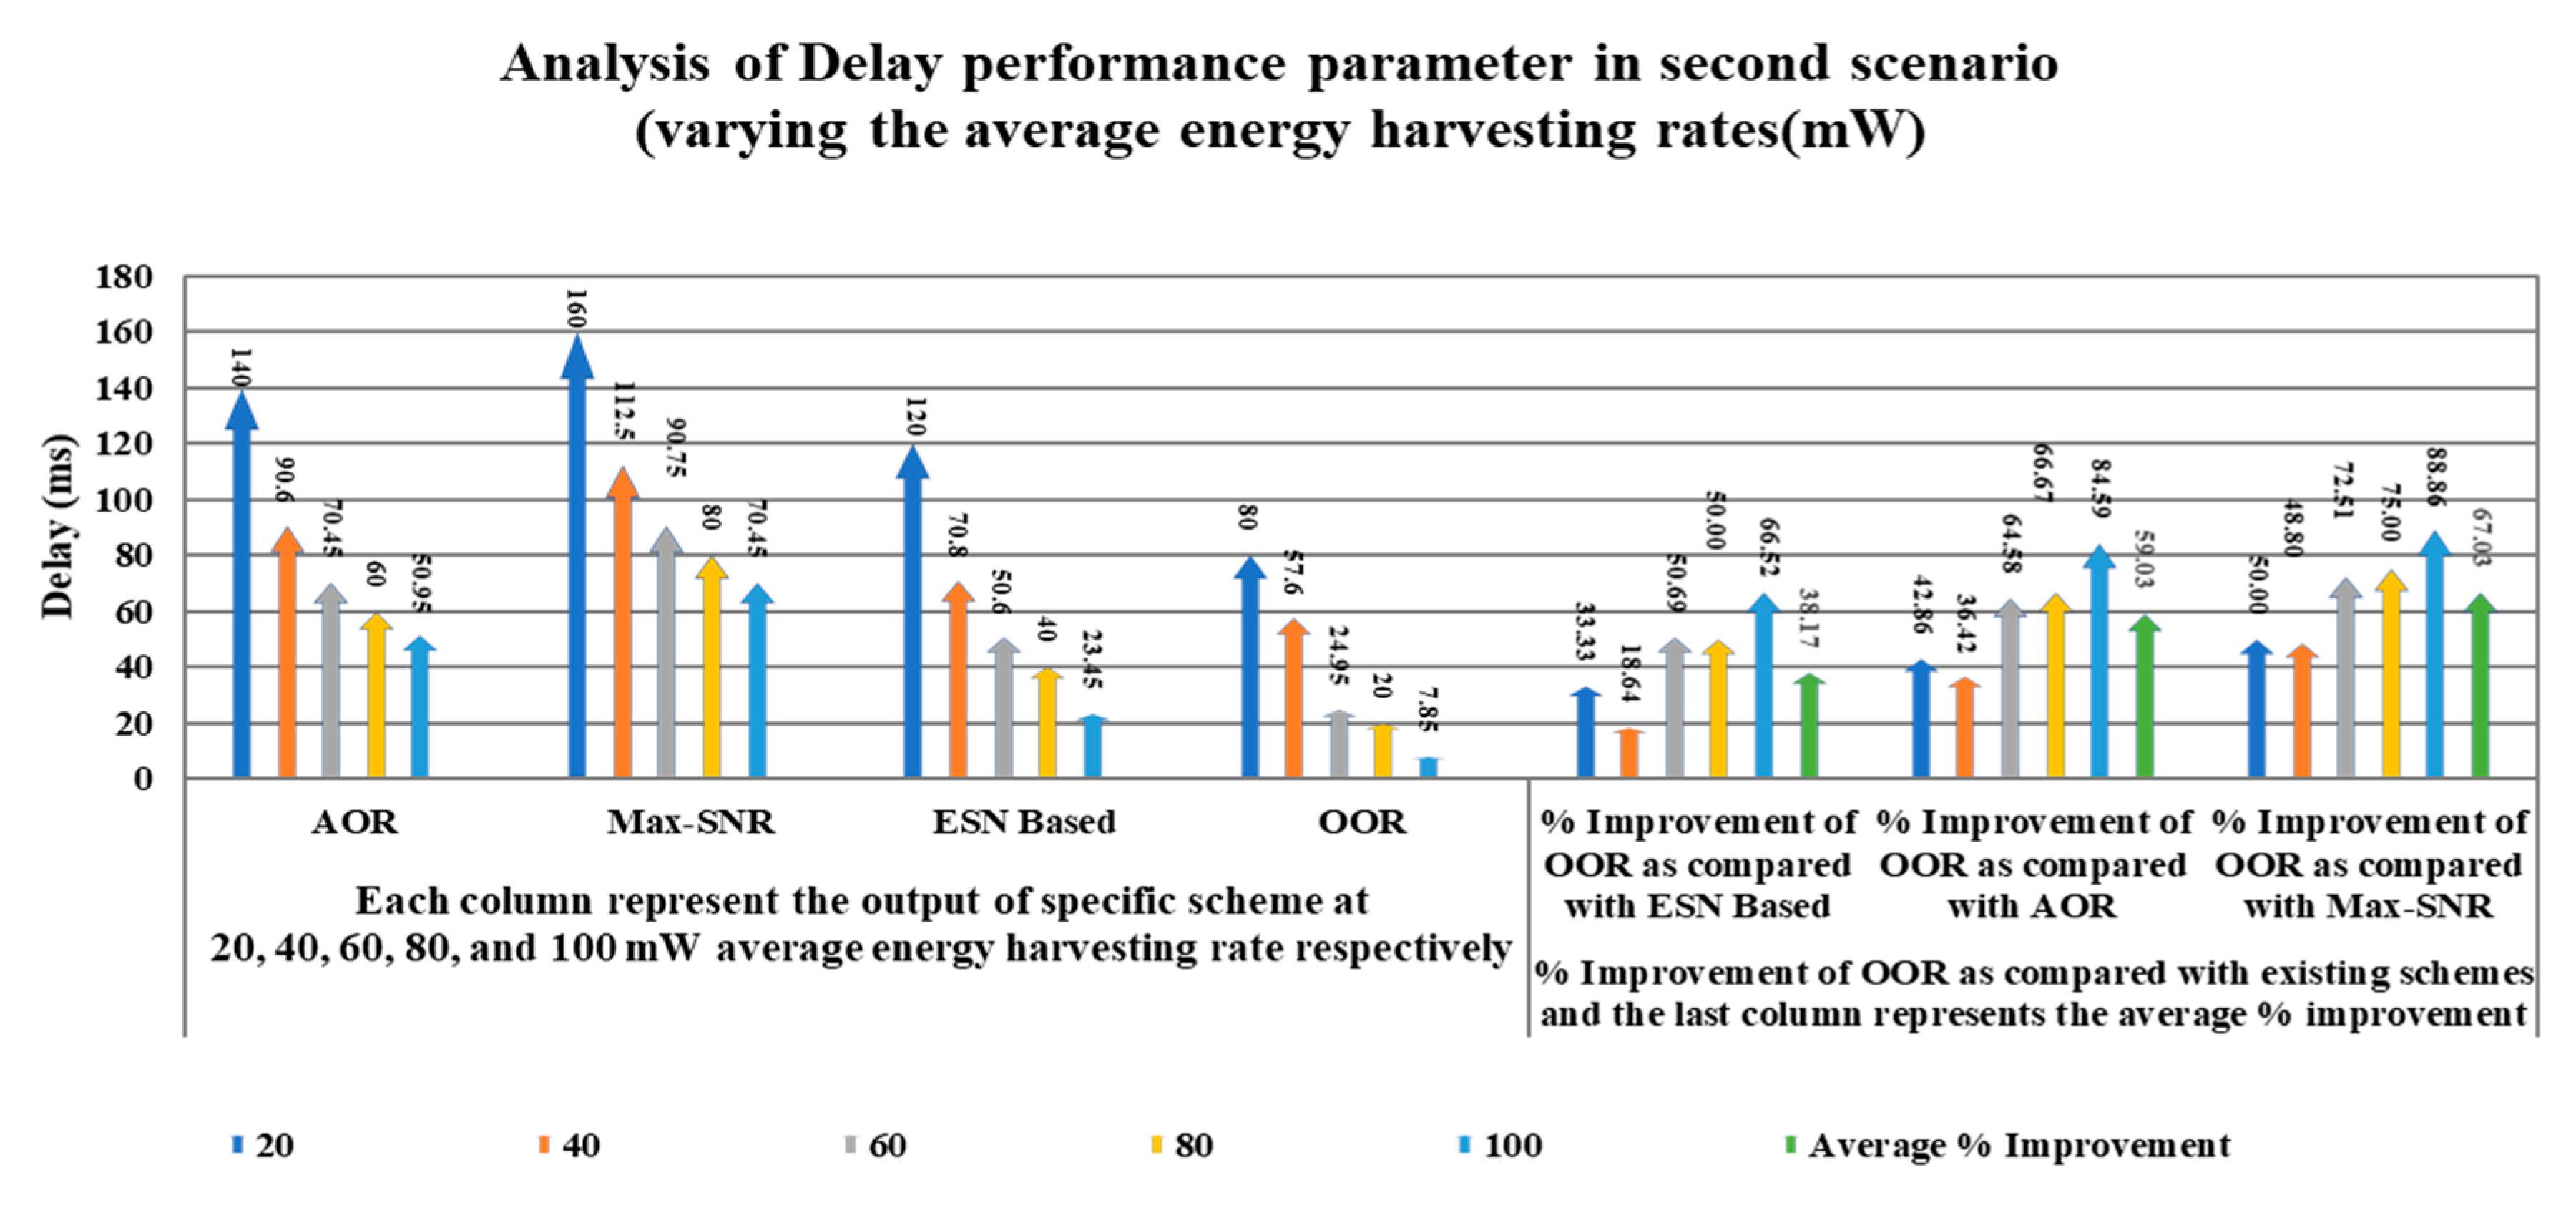
In case of delay, the average percentage improvement of OOR is 38.17, 59.03, and 67.03 as compared to ESN-based, AOR, and Max-SNR respectively. Further, we can show the performance comparison of OOR in a more illustrative way in the following Figure 11.
In Figure 11, the five different columns in the first part of the figure show the outcomes of the delay parameter with variation in average energy harvesting rates for each scheme, respectively. For example, consider different columns of the OOR scheme in the first part of the figure; the first column represents the value of delay parameter as 80 ms at 20 mW average energy harvesting rate whereas the fifth column depicts the value of 7.85 ms at 100 mW average energy harvesting rate. In the second part of the figure, the five different columns show the percentage improvement, and the sixth column depicts the average percentage improvement.
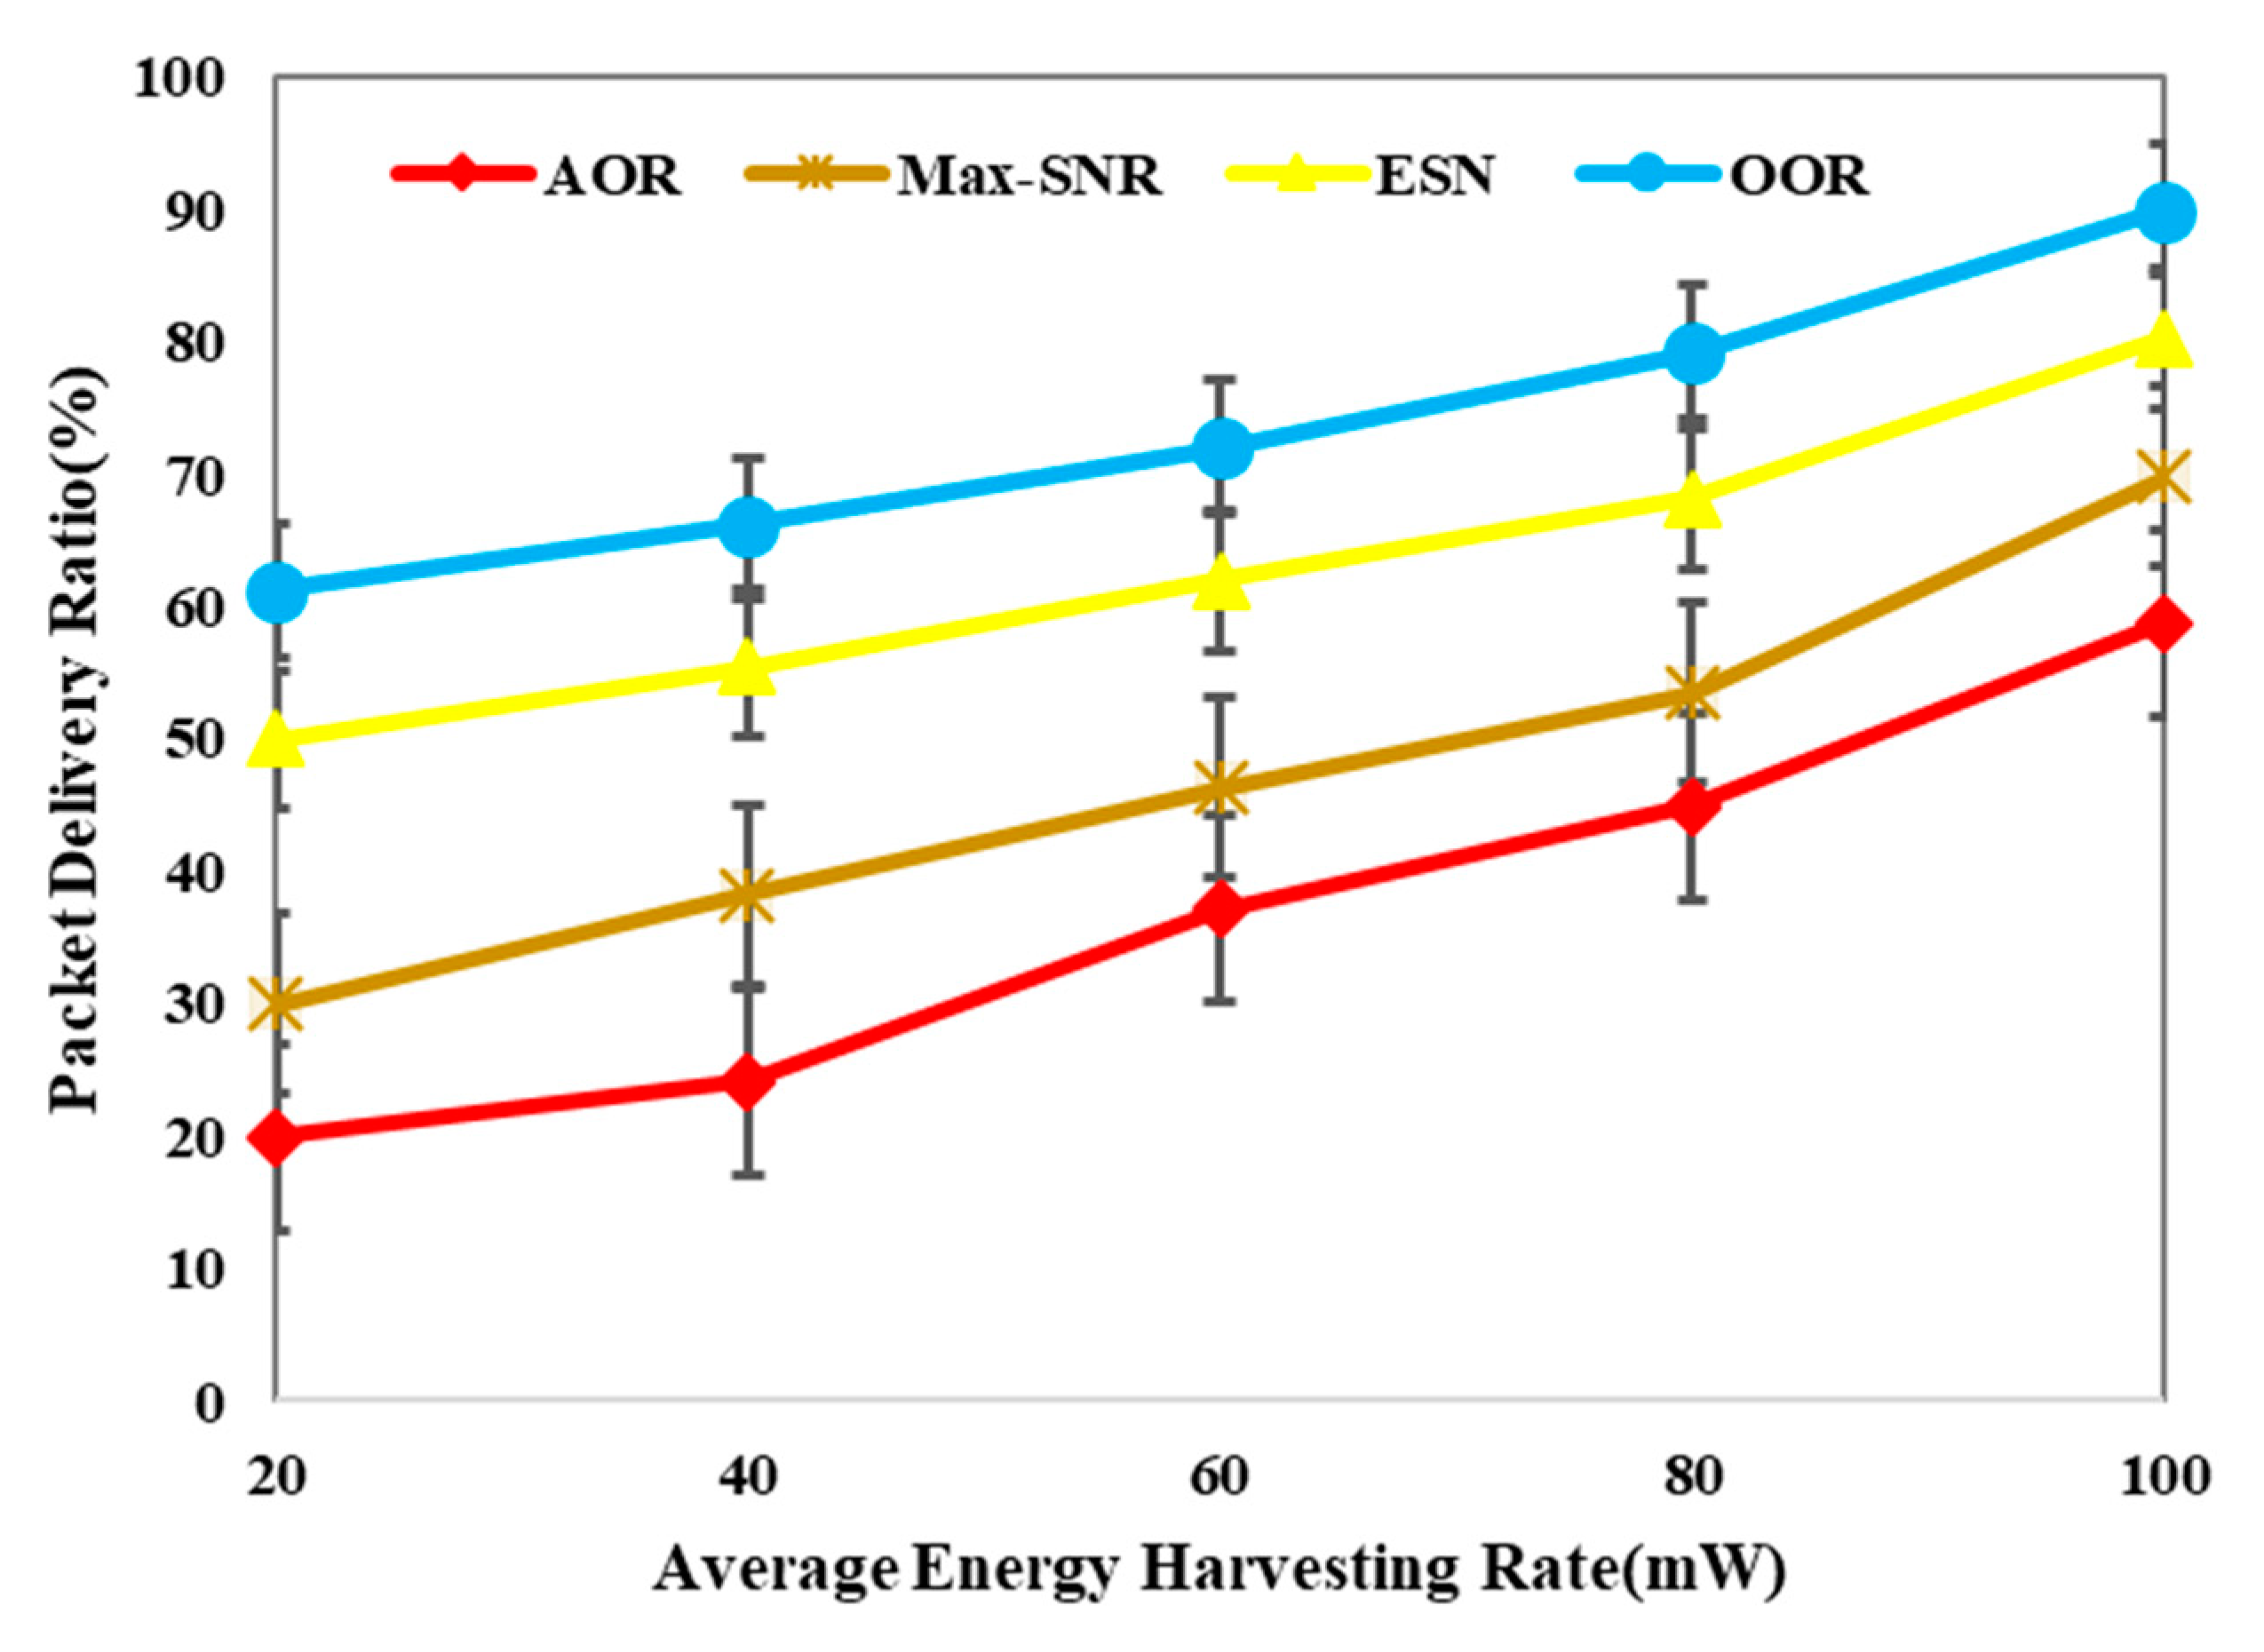
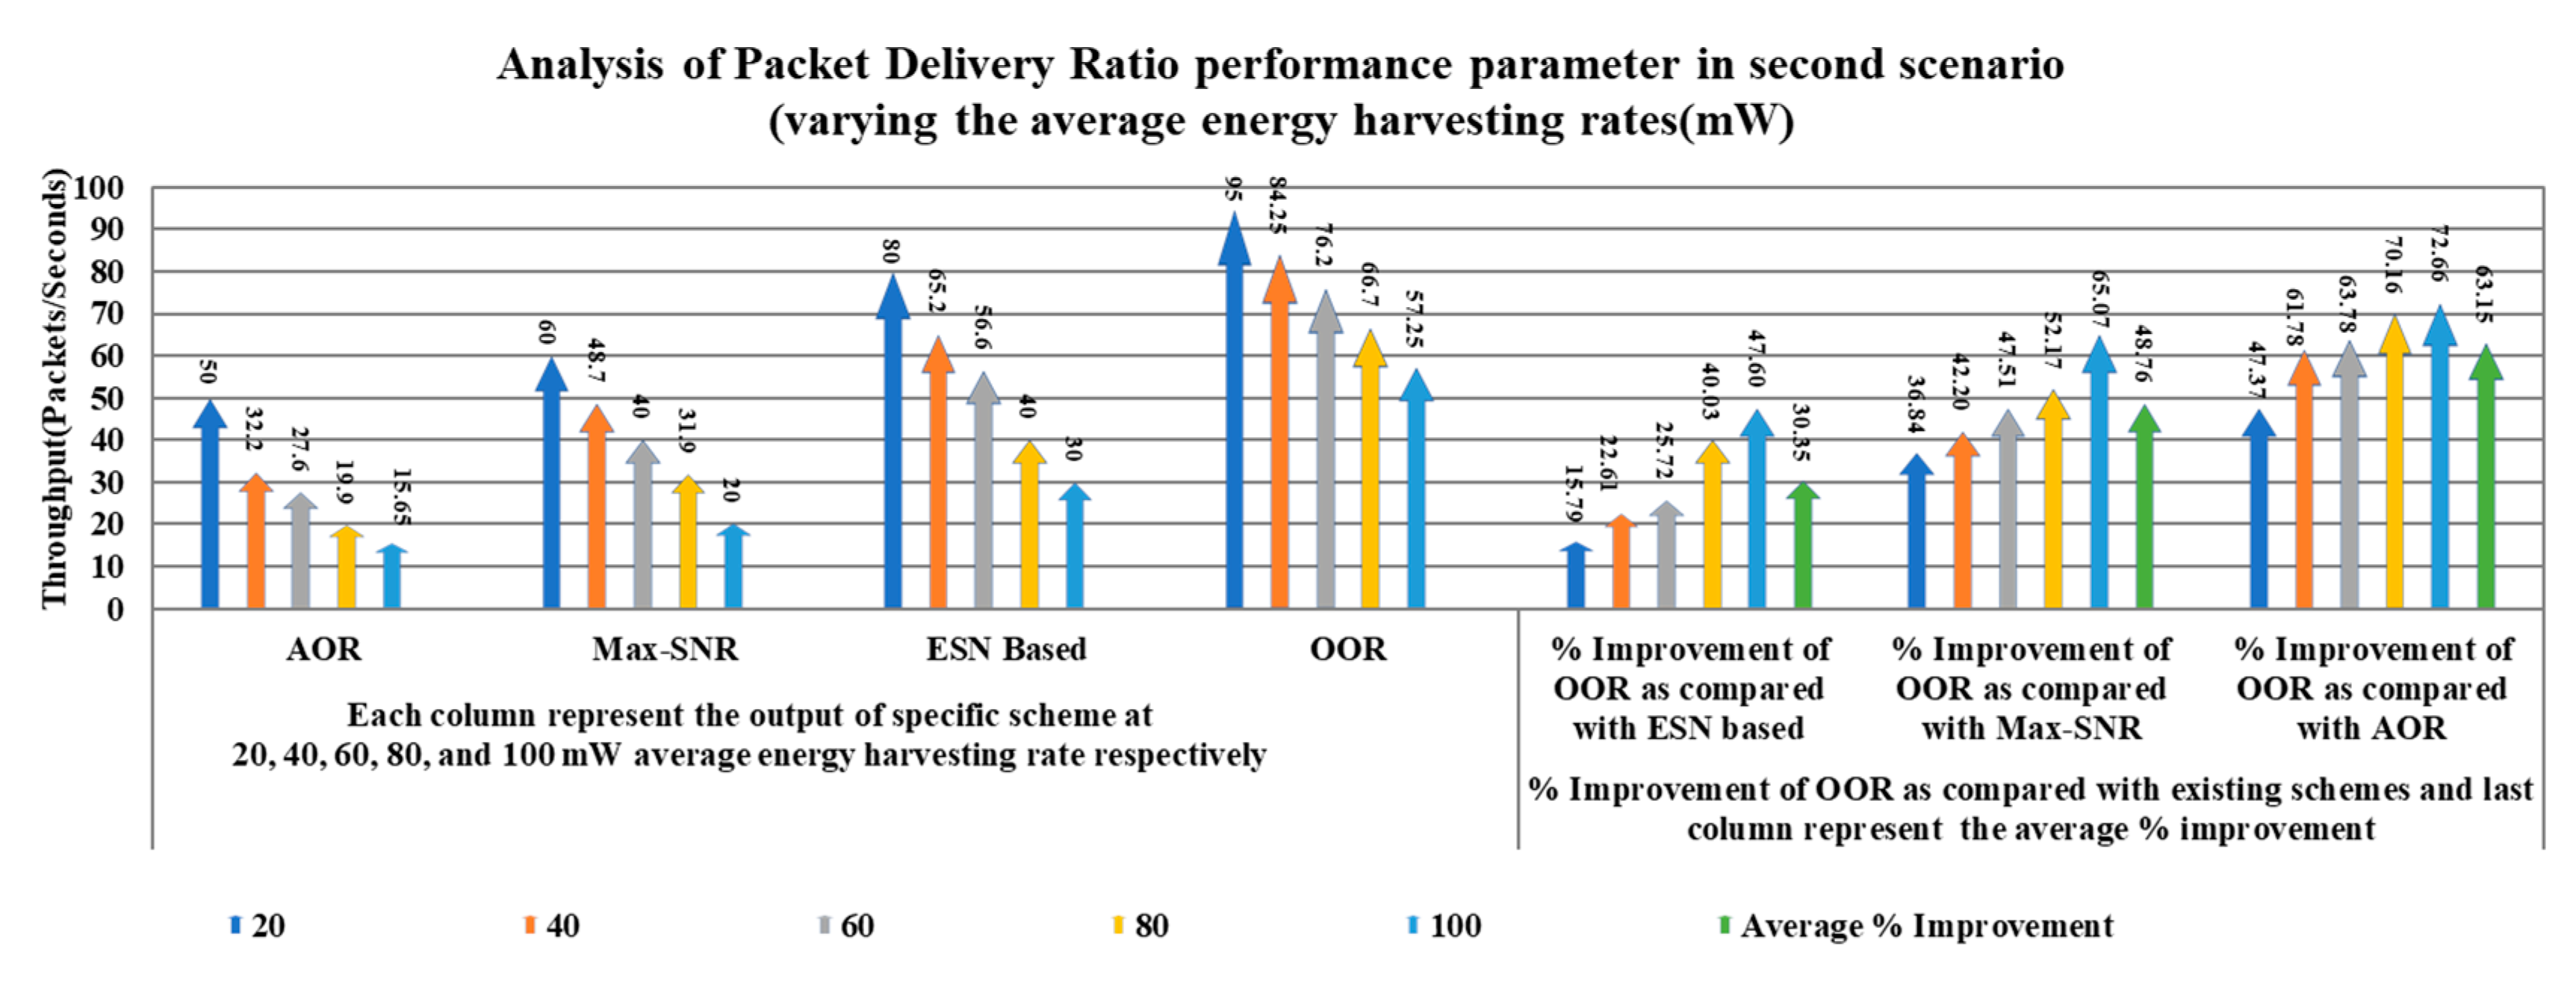
Figure 12 demonstrates the comparison of the packet delivery ratio of the proposed OOR scheme and existing schemes. The graph clearly shows that the packet delivery ratio of the proposed OOR scheme is higher than the existing ESN-based, Max-SNR, and AOR schemes, respectively.
Here also, it may be observed that increasing the average harvesting rate, packet delivery ratio (PDR) increases, in this case, we have fixed the number of nodes as 500, and the average energy-harvesting rate is increasing gradually. Due to the multistage relay set optimization mechanism, the possibility of selecting the sleeping forwarder node is very less in our approach. Next, Table 5 depicts the performance of the OOR scheme with variation in the average energy harvesting rates. Also, Table 5 shows the percentage improvement and average percentage improvements both.
Next for the packet delivery ratio, the average percentage improvement of OOR is 14.70, 36.80, and 51.43 as compared to ESN-based, Max-SNR, and AOR, respectively. Further, we can show the performance comparison of OOR in a more detailed way in the following Figure 13.
In Figure 13, the five different columns in the first part of the figure show the outcomes of the packet delivery ratio parameter with variation in average energy harvesting rates for each scheme, respectively. For example, consider different columns of the OOR scheme in the first part of the figure; the second column represents the value of the packet delivery ratio parameter as 66.25 at 40 mW average energy harvesting rate whereas the fifth column depicts the value of 90 at 100 mW average energy harvesting rate. In the second part of the figure, the five different columns show the percentage improvement, and the sixth column depicts the average percentage improvement.
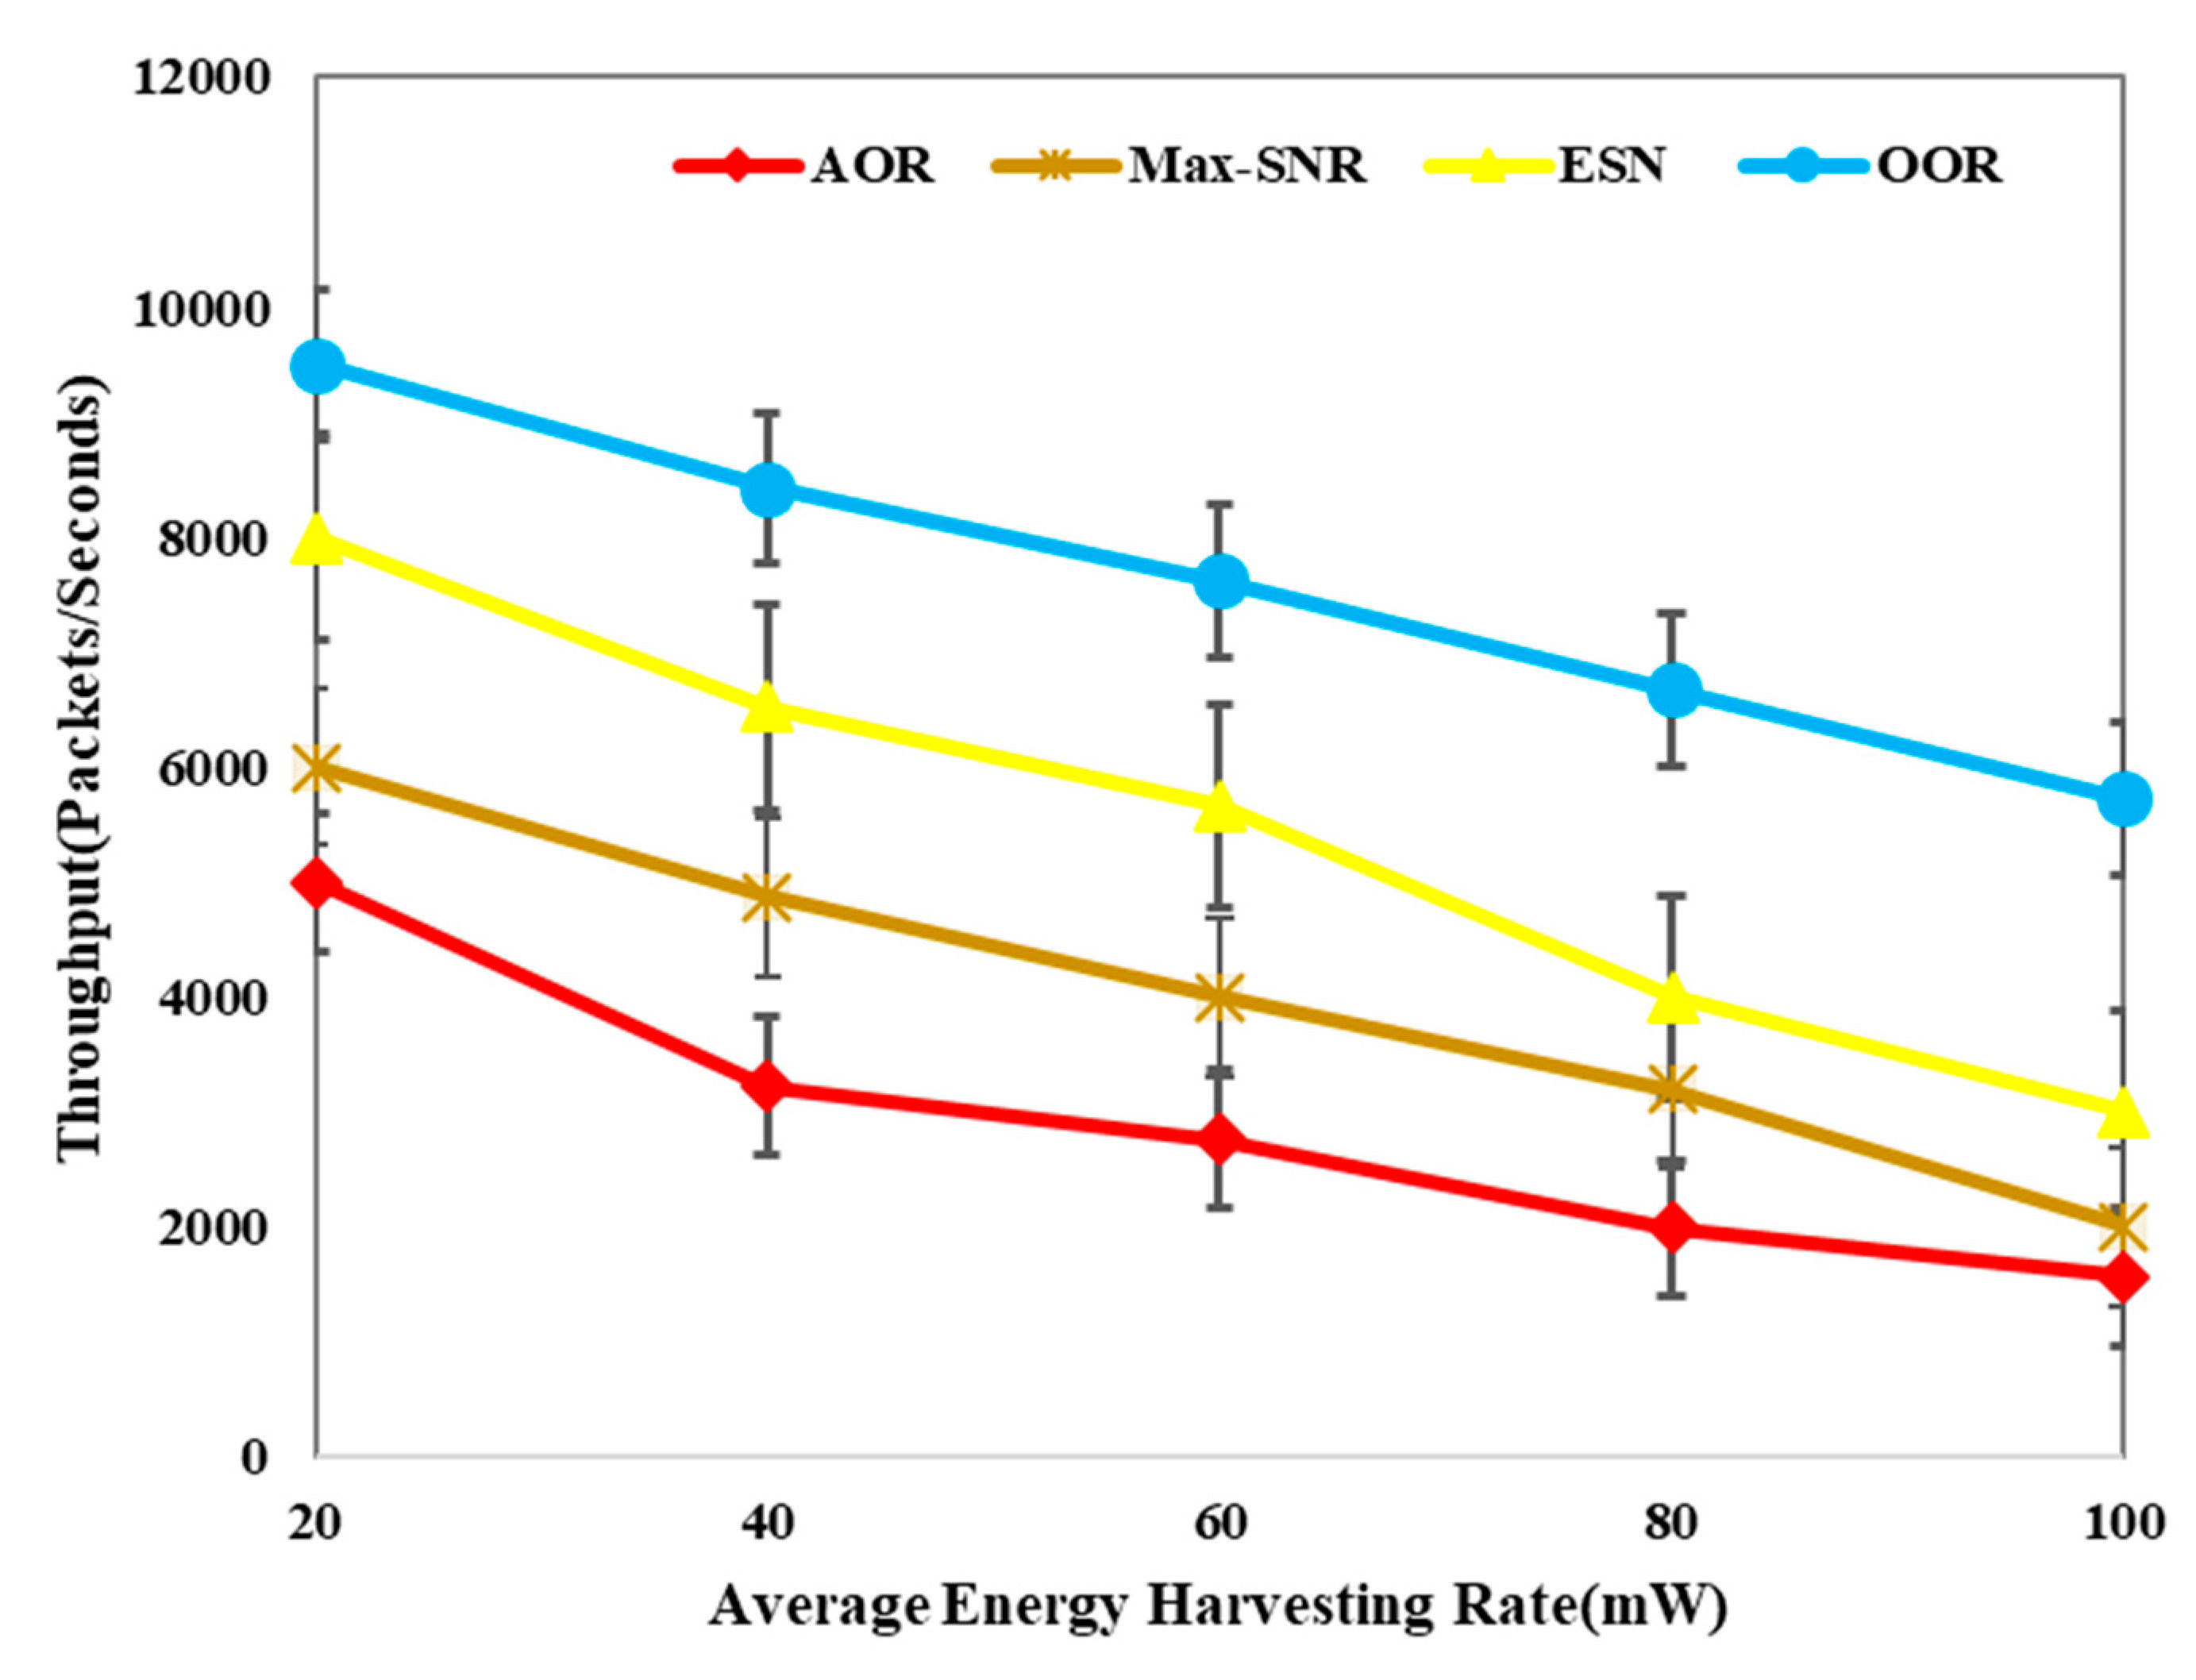
Figure 14 illustrates the comparison of throughput of the proposed OOR scheme and existing schemes. The analysis demonstrates that the throughput of the proposed OOR scheme is higher than the existing ESN-based, Max-SNR and AOR schemes respectively.
Here also from Figure 14, it is noticeable that as average energy harvesting rate increases, throughput decreases, and this is because the probability of packet error is proportional to the increase in the number of nodes. Though in this scenario, the number of nodes is fixed as 500 when 500 nodes start communication, then the probability of packet error start increasing and result in decreasing throughput. Next, Table 6 depicts the performance of the OOR scheme with variation in the average energy harvesting rates. Also, Table 6 shows the percentage improvement and average percentage improvements both.
Last for throughput, the above table reveals that the average percentage improvement of OOR is 30.35, 48.76, and 63.15 as compared to ESN-based, Max-SNR, and AOR, respectively. Further, we can show the performance comparison of OOR in a more detailed way in the following Figure 15.
In Figure 15, the five different columns in the first part of the figure show the outcomes of the throughput parameter in 100 scale with variation in average energy-harvesting rates for each scheme, respectively. For example, consider different columns of OOR scheme in first part of figure, the third column represents the value of throughput parameter as 76.2 (packets/s) at 60 mW average energy harvesting rate in 100 scale whereas the fifth column depicts the value 57.25 (packets/s) at 100 mW average energy harvesting rate in 100 scale. We use the 100 scale for better representation of columns in the figure. The values can be verified from above Table 6 In the second part of the figure, the five different columns show the percentage improvement, and the sixth column depicts the average percentage improvement.
6. Conclusions
This article proposes the MESN-based dynamic DC with OOR for EH-WSNs. The proposed MESN model is used to act as a predictor for finding the expected energy acquisition of the next slot. The proposed modified echo state network (MESN) model comprises a WOA for optimally selecting the weights of the neurons in the reservoir layer of the echo state network. The proposed scheme is the novel research in this article for stopping the unstable output of ESN due to random weight selection in the reservoir layer. It is noticeable that the proposed MESN model overcomes the shortcomings of ESN. The OOR scheme also utilized a hybrid relay selection and duty cycle optimization scheme. Relay set is optimally selected using multiple parameters such as energy consumption, congestion rate and EDW. Finally, the duty-cycle is adjusted based on energy consumption, energy acquisition, and energy threshold. The average percentage improvements of the suggested OOR scheme with existing state-of-art techniques clear that the suggested scheme performs outstands than existing schemes.
Author Contributions
Conceptualization, R.S.R.; Formal analysis, R.S.R.; Investigation, R.S.R.; Methodology, R.S.R.; Resources, R.S.R.; Supervision, S.S. & R.K.; Validation, K.A.; Writing, R.S.R.; Review & Editing, R.K. All authors have read and agreed to the published version of the manuscript.
Funding
This research was funded by Department of Computing and Mathematics, Manchester Metropolitan University, Manchester M1 5GD, UK and is also supported by Department of Computer Science and Engineering, Deenbandhu Chhoturam University of Science and Technology, Murthal (Sonipat), Haryana-131039, India.
Conflicts of Interest
The authors declare no conflict of interest.
References
- Khatri, A.; Kumar, S.; Kaiwartya, O.; Aslam, N.; Meena, N.; Abdullah, A.H. Towards green computing in wireless sensor networks: Controlled mobility–aided balanced tree approach. Int. J. Commun. Syst. 2018, 31, e3463. [Google Scholar] [CrossRef]
- Khasawneh, A.; Latiff, M.; Kaiwartya, O.; Chizari, H. Next forwarding node selection in underwater wireless sensor networks (UWSNs): Techniques and challenges. Information 2016, 8, 3. [Google Scholar] [CrossRef] [Green Version]
- Ahmed, M.N.; Abdullah, A.H.; Chizari, H.; Kaiwartya, O. F3TM: Flooding Factor based Trust Management Framework for secure data transmission in MANETs. J. King Saud Univ. Comput. Inf. Sci. 2017, 29, 269–280. [Google Scholar] [CrossRef] [Green Version]
- Khasawneh, A.; Latiff, M.S.; Kaiwartya, O.; Chizari, H. A reliable energy-efficient pressure-based routing protocol for underwater wireless sensor network. Wirel. Netw. 2018, 24, 2061–2075. [Google Scholar] [CrossRef]
- Kaiwartya, O.; Abdullah, A.H.; Cao, Y.; Lloret, J.; Kumar, S.; Shah, R.R.; Prasad, M.; Prakash, S. Virtualization in wireless sensor networks: Fault tolerant embedding for internet of things. IEEE Internet Things J. 2017, 5, 571–580. [Google Scholar] [CrossRef] [Green Version]
- Ullah, F.; Abdullah, A.H.; Kaiwartya, O.; Cao, Y. TraPy-MAC: Traffic priority aware medium access control protocol for wireless body area network. J. Med. Syst. 2017, 41, 93. [Google Scholar] [CrossRef] [Green Version]
- Kaiwartya, O.; Kumar, S. Enhanced caching for geocast routing in vehicular Ad Hoc network. In Intelligent Computing, Networking, and Informatics 2014; Springer: New Delhi, India, 2014; pp. 213–220. [Google Scholar]
- Qureshi, K.N.; Abdullah, A.H.; Kaiwartya, O.; Ullah, F.; Iqbal, S.; Altameem, A. Weighted link quality and forward progress coupled with modified RTS/CTS for beaconless packet forwarding protocol (B-PFP) in VANETs. Telecommun. Syst. 2016, 1–6. [Google Scholar] [CrossRef]
- Kaiwartya, O.; Abdullah, A.H.; Cao, Y.; Raw, R.S.; Kumar, S.; Lobiyal, D.K.; Isnin, I.F.; Liu, X.; Shah, R.R. T-MQM: Testbed-based multi-metric quality measurement of sensor deployment for precision agriculture—A case study. IEEE Sens. J. 2016, 16, 8649–8664. [Google Scholar] [CrossRef]
- Kumar, S.; Kumar, V.; Kaiwartya, O.; Dohare, U.; Kumar, N.; Lloret, J. Towards Green Communication in Wireless Sensor Network: GA Enabled Distributed Zone Approach. Ad Hoc Netw. 2019, 93, 101903. [Google Scholar] [CrossRef]
- Anisi, M.H.; Abdul-Salaam, G.; Idris, M.Y.I.; Wahab, A.W.A.; Ahmedy, I. Energy Harvesting and Battery Power Based Routing in Wireless Sensor Networks. Wirel. Netw. 2015, 23, 249–266. [Google Scholar] [CrossRef]
- Shigeta, R.; Sasaki, T.; Quan, D.; Kawahara, Y.; Vyas, R.; Tentzeris, M.; Asami, T. Ambient RF Energy Harvesting Sensor Device with Capacitor-Leakage-Aware Duty Cycle Control. IEEE Sens. J. 2013, 13, 2973–2983. [Google Scholar] [CrossRef]
- Adu-Manu, K.S.; Adam, N.; Tapparello, C.; Ayatollahi, H.; Heinzelman, W. Energy-Harvesting Wireless Sensor Networks (EH-WSNs). ACM Trans. Sens. Netw. 2018, 14, 1–50. [Google Scholar] [CrossRef]
- Engmann, F.A.; Katsriku, F.; Abdulai, J.D.; Adu-Manu, K.S.; Banaseka, F.K. Prolonging the Lifetime of Wireless Sensor Networks: A Review of Current Techniques. Wirel. Commun. Mob. Comput. 2018, 2018, 1–23. [Google Scholar] [CrossRef] [Green Version]
- Zhang, D.; Chen, Z.; Zhou, H.; Chen, L.; Shen, X.S. Energy-Balanced Cooperative Transmission Based on Relay Selection and Power Control in Energy Harvesting Wireless Sensor Network. Comput. Netw. 2016, 104, 189–197. [Google Scholar] [CrossRef]
- Wu, D.; He, J.; Wang, H.; Wang, C.; Wang, R. A Hierarchical Packet Forwarding Mechanism for Energy Harvesting Wireless Sensor Networks. IEEE Commun. Mag. 2015, 53, 92–98. [Google Scholar] [CrossRef]
- Laurindo, S.; Moraes, R.; Nassiffe, R.; Montez, C.; Vasques, F. An Optimized Relay Selection Technique to Improve the Communication Reliability in Wireless Sensor Networks. Sensors 2018, 18, 3263. [Google Scholar] [CrossRef] [Green Version]
- Le, T.N.; Pegatoquet, A.; Berder, O.; Sentieys, O. Energy-Efficient Power Manager and MAC Protocol for Multi-Hop Wireless Sensor Networks Powered by Periodic Energy Harvesting Sources. IEEE Sens. J. 2015, 15, 7208–7220. [Google Scholar] [CrossRef]
- Xie, R.; Liu, A.; Gao, J. A Residual Energy Aware Schedule Scheme for WSNs Employing Adjustable Awake/Sleep Duty Cycle. Wirel. Pers. Commun. 2016, 90, 1859–1887. [Google Scholar] [CrossRef]
- Zhang, X.; Wang, C.; Tao, L. An Opportunistic Packet Forwarding for Energy-Harvesting Wireless Sensor Networks with Dynamic and Heterogeneous Duty Cycle. IEEE Sens. Lett. 2018, 2, 1–4. [Google Scholar] [CrossRef]
- Rodan, A.; Tino, P. Minimum Complexity Echo State Network. IEEE Trans. Neural Netw. 2011, 22, 131–144. [Google Scholar] [CrossRef]
- Elazab, O.S.; Hasanien, H.M.; Elgendy, M.A.; Abdeen, A.M. Whale Optimisation Algorithm for Photovoltaic Model Identification. J. Eng. 2017, 2017, 1906–1911. [Google Scholar] [CrossRef]
- Ghadimi, E.; Landsiedel, O.; Soldati, P.; Duquennoy, S.; Johansson, M. Opportunistic Routing in Low Duty-Cycle Wireless Sensor Networks. ACM Trans. Sens. Netw. 2014, 10, 67. [Google Scholar] [CrossRef]
- Castagnetti, A.; Pegatoquet, A.; Trong Nhan Le; Auguin, M. A Joint Duty-Cycle and Transmission Power Management for Energy Harvesting WSN. IEEE Trans. Ind. Inform. 2014, 10, 928–936. [Google Scholar] [CrossRef]
- Cui, S.; Cao, Y.; Sun, G.; Bin, S. A New Energy-Aware Wireless Sensor Network Evolution Model Based on Complex Network. EURASIP J. Wirel. Commun. Netw. 2018, 2018, 218. [Google Scholar] [CrossRef]
- Mothku, S.K.; Rout, R.R. Fuzzy Logic Based Adaptive Duty Cycling for Sustainability in Energy Harvesting Sensor Actor Networks. J. King Saud Univ. Comput. Inf. Sci. 2018. [Google Scholar] [CrossRef]
- Galmés, S. Optimal Routing for Time-Driven EH-WSN Under Regular Energy Sources. Sensors 2018, 18, 4072. [Google Scholar] [CrossRef] [Green Version]
- Sharma, A.; Kakkar, A. Dynamic Programming Based Optimal Renewable Energy Allocation in Sustained Wireless Sensor Networks. J. Renew. Sustain. Energy 2018, 10, 063705. [Google Scholar] [CrossRef]
- Xiang, X.; Liu, W.; Liu, A.; Xiong, N.N.; Zeng, Z.; Cai, Z. Adaptive Duty Cycle Control–Based Opportunistic Routing Scheme to Reduce Delay in Cyber Physical Systems. Int. J. Distrib. Sens. Netw. 2019, 15, 155014771984187. [Google Scholar] [CrossRef] [Green Version]
- Gu, Z.; Wang, Y.; Shi, W.; Tian, Z.; Ren, K.; Lau, F. A Practical Neighbor Discovery Framework for Wireless Sensor Networks. Sensors 2019, 19, 1887. [Google Scholar] [CrossRef] [Green Version]
- Liu, X.; Wu, J. A Method for Energy Balance and Data Transmission Optimal Routing in Wireless Sensor Networks. Sensors 2019, 19, 3017. [Google Scholar] [CrossRef] [Green Version]
- Ganesan, S.; Ramaswamy, K.; Basha, A.R.; Hariprasath, M. NOSS (A Novel Optimal Sleep Scheduling) Scheme for Energy and Data Reliability Optimization in Mobile Cloud Assisted Wireless Sensor Networks. J. Eng. 2019. [Google Scholar] [CrossRef]
Figure 1.
Proposed modified echo state network (MESN).

Figure 2.
Flowchart of whale optimization algorithm for optimally selecting the weight of neurons in the reservoir layer.
Figure 2.
Flowchart of whale optimization algorithm for optimally selecting the weight of neurons in the reservoir layer.

Figure 3.
The working structure of the proposed modified echo state network (MESN) based dynamic duty cycle (DC) with optimal opportunistic routing (OOR).
Figure 3.
The working structure of the proposed modified echo state network (MESN) based dynamic duty cycle (DC) with optimal opportunistic routing (OOR).
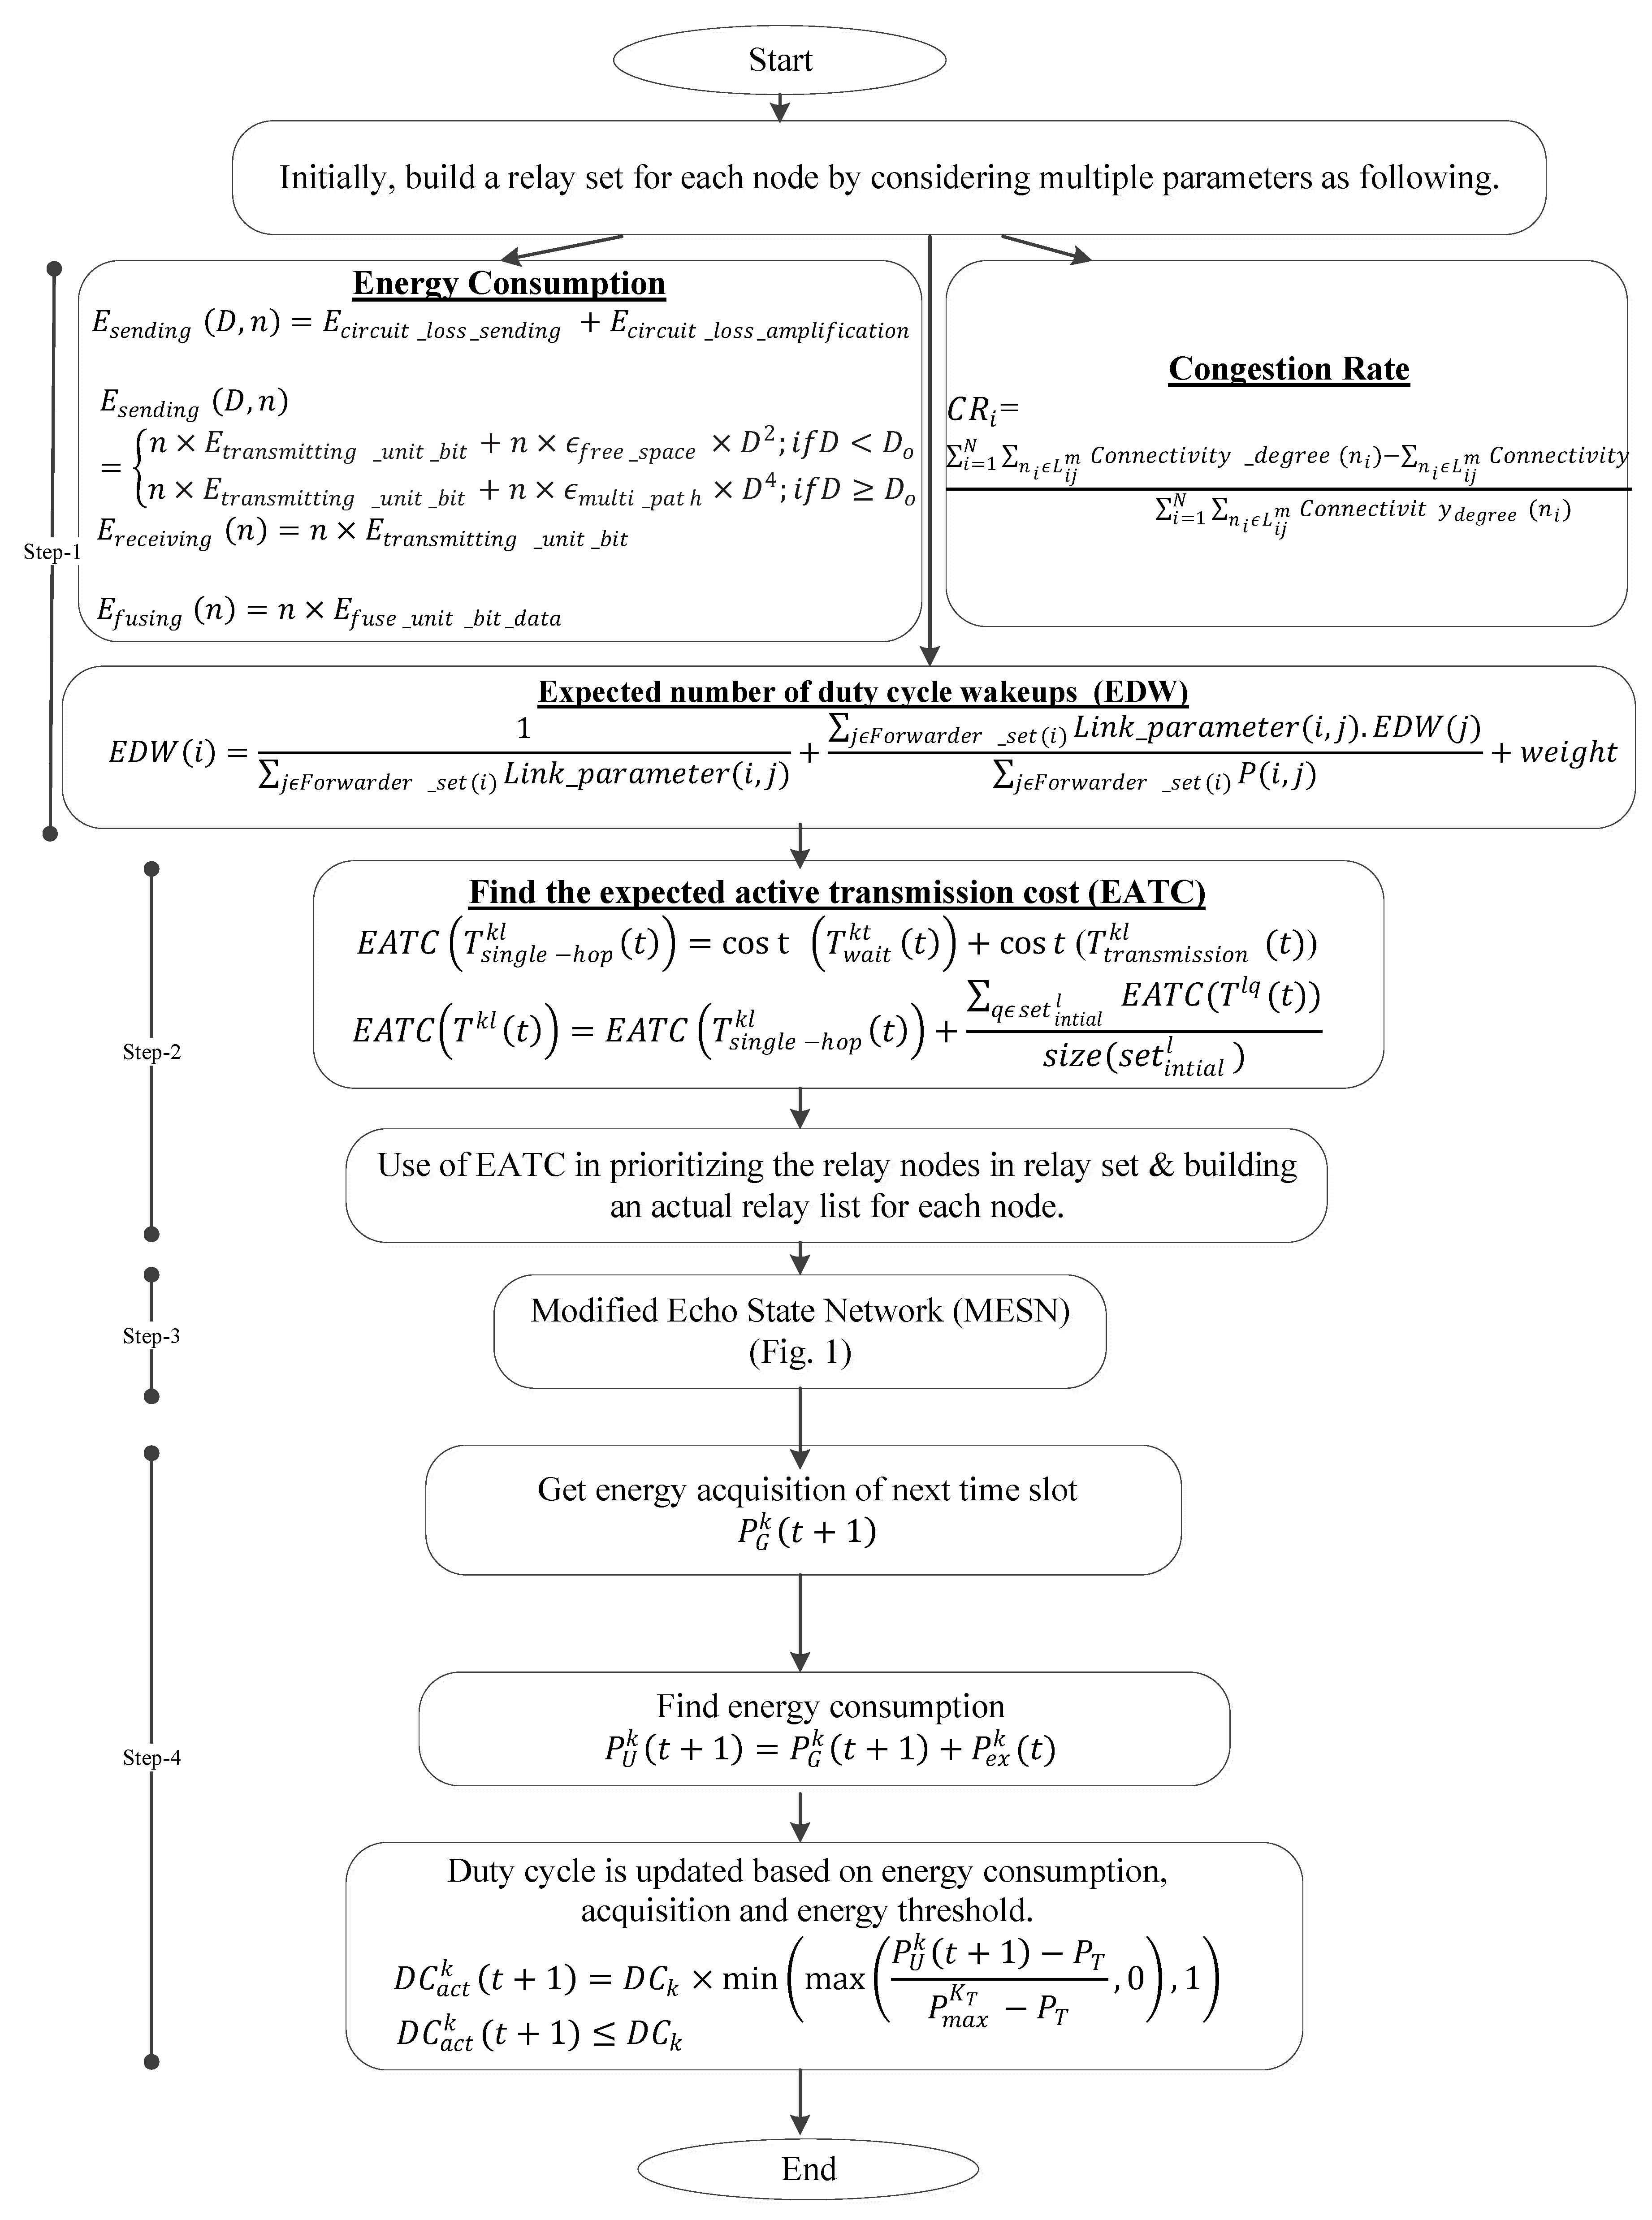
Figure 4.
Delay comparison with varying number of nodes.

Figure 5.
Detailed performance reflection of OOR with a delay parameter.
Figure 6.
Packet delivery ratio comparison with varying number of nodes.

Figure 7.
Detailed performance reflection of OOR with packet delivery ratio parameter.
Figure 8.
Throughput comparison with varying number of nodes.

Figure 9.
Detailed performance reflection of OOR with throughput parameter.

Figure 10.
Delay comparison with varying average energy harvesting rates.

Figure 11.
Detailed performance reflection of OOR with delay parameter (second scenario).

Figure 12.
Packet delivery ratio comparison with varying average energy harvesting rates.

Figure 13.
Detailed performance reflection of OOR with packet delivery ratio parameter (second scenario).
Figure 13.
Detailed performance reflection of OOR with packet delivery ratio parameter (second scenario).

Figure 14.
Throughput comparison with varying average energy harvesting rates.

Figure 15.
Detailed performance reflection of OOR with throughput parameter (second scenario).


Table 1.
Descriptive observations of OOR performance in terms of delay.
| Delay (ms) Comparison with Varying Number of Nodes | % Improvement of OOR as Compared with Existing Schemes | ||||||
|---|---|---|---|---|---|---|---|
| Nodes | AOR | Max-SNR | ESN | OOR | % Gain of OOR Compared with ESN | % Gain of OOR Compared with Max-SNR | % Improvement of OOR Compared with AOR |
| 100 | 150 | 125.5 | 109.8 | 92 | 16.21 | 26.69 | 38.67 |
| 200 | 130 | 108.25 | 90 | 72.25 | 19.72 | 33.26 | 44.42 |
| 300 | 112 | 89.25 | 67.65 | 50 | 26.09 | 43.98 | 55.36 |
| 400 | 98 | 73.2 | 50 | 36.65 | 26.70 | 49.93 | 62.60 |
| 500 | 84.8 | 60 | 35.6 | 20 | 43.82 | 66.67 | 76.42 |
| Average % Improvement → | 22.18 | 44.11 | 55.49 | ||||
Table 2.
Descriptive observations of OOR performance in terms of packet delivery ratio.
| Packet Delivery Ratio (%) Comparison with Varying Number of Nodes | % Improvement of OOR as Compared with Existing Schemes | ||||||
|---|---|---|---|---|---|---|---|
| Nodes | AOR | Max-SNR | ESN | OOR | % Gain of OOR Compared with ESN | % Gain of OOR Compared to Max-SNR | % Improvement of OOR Compared with AOR |
| 100 | 23 | 38 | 53 | 70 | 24.29 | 45.71 | 67.14 |
| 200 | 30 | 45 | 58.7 | 77 | 23.77 | 41.56 | 61.04 |
| 300 | 36.5 | 50 | 64.5 | 84 | 23.21 | 40.48 | 56.55 |
| 400 | 45 | 58 | 73.5 | 88 | 16.48 | 34.09 | 48.86 |
| 500 | 55 | 70 | 82.4 | 92 | 10.43 | 23.91 | 40.22 |
| Average % Improvement → | 21.94 | 40.46 | 58.40 | ||||
Table 3.
Descriptive observations of OOR performance in terms of throughput.
| Throughput(packets/s) Comparison with Varying Number of Nodes | % Improvement of OOR as Compared with Existing Schemes | ||||||
|---|---|---|---|---|---|---|---|
| Nodes | AOR | Max-SNR | ESN | OOR | % Gain of OOR Compared with ESN | % Gain of OOR Compared with Max-SNR | % Improvement of OOR Compared with AOR |
| 100 | 6000 | 7200 | 9000 | 10,500 | 14.29 | 31.43 | 42.86 |
| 200 | 5500 | 6900 | 8220 | 9825 | 16.34 | 29.77 | 44.02 |
| 300 | 5000 | 6200 | 7490 | 8810 | 14.98 | 29.63 | 43.25 |
| 400 | 3820 | 5220 | 6512 | 7900 | 17.57 | 33.92 | 51.65 |
| 500 | 3000 | 4150 | 5425 | 6950 | 21.94 | 40.29 | 56.83 |
| Average % Improvement→ | 17.02 | 33.01 | 47.72 | ||||
Table 4.
Descriptive observations of OOR performance in terms of delay (second scenario).
| Delay (ms) Comparison with Varying Average Energy Harvesting Rates | % Improvement of OOR as Compared with Existing Schemes | ||||||
|---|---|---|---|---|---|---|---|
| Energy Harvesting Rate (mW) | AOR | Max-SNR | ESN | OOR | % Gain of OOR Compared with ESN | % Gain of OOR Compared with Max-SNR | % Improvement of OOR Compared with AOR |
| 20 | 160 | 140 | 120 | 80 | 33.33 | 42.86 | 50.00 |
| 40 | 112.5 | 90.6 | 70.8 | 57.6 | 18.64 | 36.42 | 48.80 |
| 60 | 90.75 | 70.45 | 50.6 | 24.95 | 50.69 | 64.58 | 72.51 |
| 80 | 80 | 60 | 40 | 20 | 50.00 | 66.67 | 75.00 |
| 100 | 70.45 | 50.95 | 23.45 | 7.85 | 66.52 | 84.59 | 88.86 |
| Average % Improvement → | 38.17 | 59.03 | 67.03 | ||||
Table 5.
Descriptive observations of OOR performance in terms of packet delivery ratio (second scenario).
Table 5.
Descriptive observations of OOR performance in terms of packet delivery ratio (second scenario).
| Packet Delivery Ratio (%) Comparison with Varying Average Energy Harvesting Rates | % Improvement of OOR as Compared with Existing Schemes | ||||||
|---|---|---|---|---|---|---|---|
| Energy Harvesting Rate (mW) | AOR | Max-SNR | ESN | OOR | % Gain of OOR Compared with ESN | % Gain of OOR Compared to Max-SNR | % Improvement of OOR Compared with AOR |
| 20 | 20 | 30 | 50 | 61.25 | 18.37 | 51.02 | 67.35 |
| 40 | 24.2 | 38.25 | 55.4 | 66.25 | 16.38 | 42.26 | 63.47 |
| 60 | 37.2 | 46.25 | 61.95 | 72 | 13.96 | 35.76 | 48.33 |
| 80 | 44.9 | 53.45 | 68.15 | 79.2 | 13.95 | 32.51 | 43.31 |
| 100 | 58.8 | 69.8 | 80.25 | 90 | 10.83 | 22.44 | 34.67 |
| Average % Improvement → | 14.70 | 36.80 | 51.43 | ||||
Table 6.
Descriptive observations of OOR performance in terms of throughput (second scenario).
| Throughput (packets/s) Comparison with Varying Average Energy Harvesting Rates | % Improvement of OOR as Compared with Existing Schemes | ||||||
|---|---|---|---|---|---|---|---|
| Energy Harvesting Rate (mW) | AOR | Max-SNR | ESN | OOR | % Gain of OOR Compared with ESN | % Gain of OOR Compared to Max-SNR | % Improvement of OOR Compared with AOR |
| 20 | 5000 | 6000 | 8000 | 9500 | 15.79 | 36.84 | 47.37 |
| 40 | 3220 | 4870 | 6520 | 8425 | 22.61 | 42.20 | 61.78 |
| 60 | 2760 | 4000 | 5660 | 7620 | 25.72 | 47.51 | 63.78 |
| 80 | 1990 | 3190 | 4000 | 6670 | 40.03 | 52.17 | 70.16 |
| 100 | 1565 | 2000 | 3000 | 5725 | 47.60 | 65.07 | 72.66 |
| Average % Improvement → | 30.35 | 48.76 | 63.15 | ||||
© 2020 by the authors. Licensee MDPI, Basel, Switzerland. This article is an open access article distributed under the terms and conditions of the Creative Commons Attribution (CC BY) license (http://creativecommons.org/licenses/by/4.0/).
Share and Cite
MDPI and ACS Style
Rathore, R.S.; Sangwan, S.; Adhikari, K.; Kharel, R. Modified Echo State Network Enabled Dynamic Duty Cycle for Optimal Opportunistic Routing in EH-WSNs. Electronics 2020, 9, 98. https://doi.org/10.3390/electronics9010098
AMA Style
Rathore RS, Sangwan S, Adhikari K, Kharel R. Modified Echo State Network Enabled Dynamic Duty Cycle for Optimal Opportunistic Routing in EH-WSNs. Electronics. 2020; 9(1):98. https://doi.org/10.3390/electronics9010098
Chicago/Turabian StyleRathore, Rajkumar Singh, Suman Sangwan, Kabita Adhikari, and Rupak Kharel. 2020. "Modified Echo State Network Enabled Dynamic Duty Cycle for Optimal Opportunistic Routing in EH-WSNs" Electronics 9, no. 1: 98. https://doi.org/10.3390/electronics9010098
Note that from the first issue of 2016, this journal uses article numbers instead of page numbers. See further details here.