Article

A Low-Cost Digital Pulsed Coherent Spectrometer for Investigation of NQR in Layered Semiconductor GaSe and InSe Crystals

1
Department of Electronics and Information Technology, Lublin University of Technology, Nadbytrzycka 38D, 20-618 Lublin, Poland
2
Department of Radio Engineering and Information Security, Yuriy Fedkovych Chernivtsi National University, Kotsyubynsky 2, 58 000 Chernivtsi, Ukraine
*
Author to whom correspondence should be addressed.
Electronics 2020, 9(12), 1996; https://doi.org/10.3390/electronics9121996
Submission received: 21 October 2020 / Revised: 17 November 2020 / Accepted: 22 November 2020 / Published: 25 November 2020
(This article belongs to the Section Computer Science & Engineering)

Abstract

:
A low-cost digital pulsed nuclear quadrupole resonance (NQR) radio-spectrometer is proposed, all main modules of digital processing and synthesis of which on the field-programmable gate array (FPGA) are implemented. The input sensitivity of the device is of the order of 3 μV to 5 μV which allows conducting NQR studies in samples of relatively small dimensions. The application of the developed methods of NQR pulsed radio spectroscopy made it possible to increase spectral resolution, improve spectral shape and significantly reduce the time of research. In the case of studying InSe and GaSe crystals, spectra with signal-to-noise ratio (SNR) values of 41.9 dB were observed in samples with a volume of 0.1 cm3. As the results of the research have shown, the characteristics of the proposed spectrometer make it effective when used to observe free induction decay (FID) signals of a significant number of isotopes of elements with quadrupolar nuclei.

1. Introduction

The method of nuclear quadrupole resonance (NQR) is based on the absorption of high-frequency energy by changing the orientation of the quadrupole moments of atomic nuclei in a non-uniform electric field created by external charges relative to the nucleus. The levels of quadrupole energy in a solid substance arise when quadrupole moments interact with a non-uniform electric field at the location of the resonating nucleus, therefore the NQR spectrum reflects the distribution of electron density near a certain atom. Therein lies the uniqueness of the NQR method in the study of the fine features of the structure of chemical compounds [1].
This paper is an extension of work originally presented in TCSET-2020 [1]. Gallium and indium monoselenides (GaSe, InSe) are semiconductor compounds of the AIIIBVI group. They possess a number of interesting physical properties and a specific chemical structure which has sparked interest in them over the past half century [1,2,3,4,5,6,7]. The increased interest in these materials is caused by the possibilities of their application: in nonlinear optics, in solar energy converters, in high-sensitivity infrared optical sensors, in solid-state current sources and high-sensitivity pressure sensors. Strong anisotropy of the chemical bond allows one to change their physical properties by intercalation. Of particular interest is the possibility of creating high-quality heterocontacts based on them, in particular, both with the use of Van der Waals epitaxy and with a less labor-intensive mechanical method—direct optical contact method.
The InSe and GaSe properties allow for photodiode structures, Schottky barriers, metal-dielectric-semiconductor devices and heterojunctions to be produced on their basis. Of considerable interest are also heterojunctions based on InSe and GaSe, which are created by thermal oxidation of individual crystalline substrates at air.
NQR spectroscopy is used to study solids with the width of individual lines of the resonance spectrum, typically 1–10 kHz or more [5]. That is why this method is most suitable for the study of GaSe and InSe semiconductor compounds in which, at the width of a separate resonance lines of 1.5–2 kHz, the frequency ranges of the resonance spectra are ~70 kHz and 250–350 kHz for the 69Ga and 115In nuclei, respectively [6]. Layered compounds GaSe and InSe have inherent defectiveness of the crystal structure—polytypism [6], wherein the ordering is controllable. The presence of such defects leads to a multiplicity of NQR spectra with bandwidths of about several hundred kilohertz. In this case, the NQR excitation requires the use of short (a few microsecond) pulses [8,9,10,11,12,13].
This article describes the general design principle of a low-cost digital pulsed spectrometer for studying NQR in semiconductor crystals. In this paper, the analysis of the elements of the spectrometer input circuit is carried out and the dependence of the intensity of the high-frequency (HF) field on the transmitter power, the Q factor of the probe coil, the resonant frequency, and the probe coil volume is determined. Moreover, additional experimental studies of transient processes and amplitude characteristics of the proposed gated amplifier and experimental 69Ga, 115In NQR study of GaSe and InSe have been carried out. For the first time, a method of increasing the accuracy of the reproduction of the shape of broadband NQR spectra by suppressing up to 100 dB of the transient process in the receiving coil of the input device of the spectrometer is proposed. This, in contrast to the existing methods, provides a weakening of the influence on the receiving path of parasitic interference with the frequency of excitation pulses, which made it possible to develop a block diagram of the NQR measuring device.

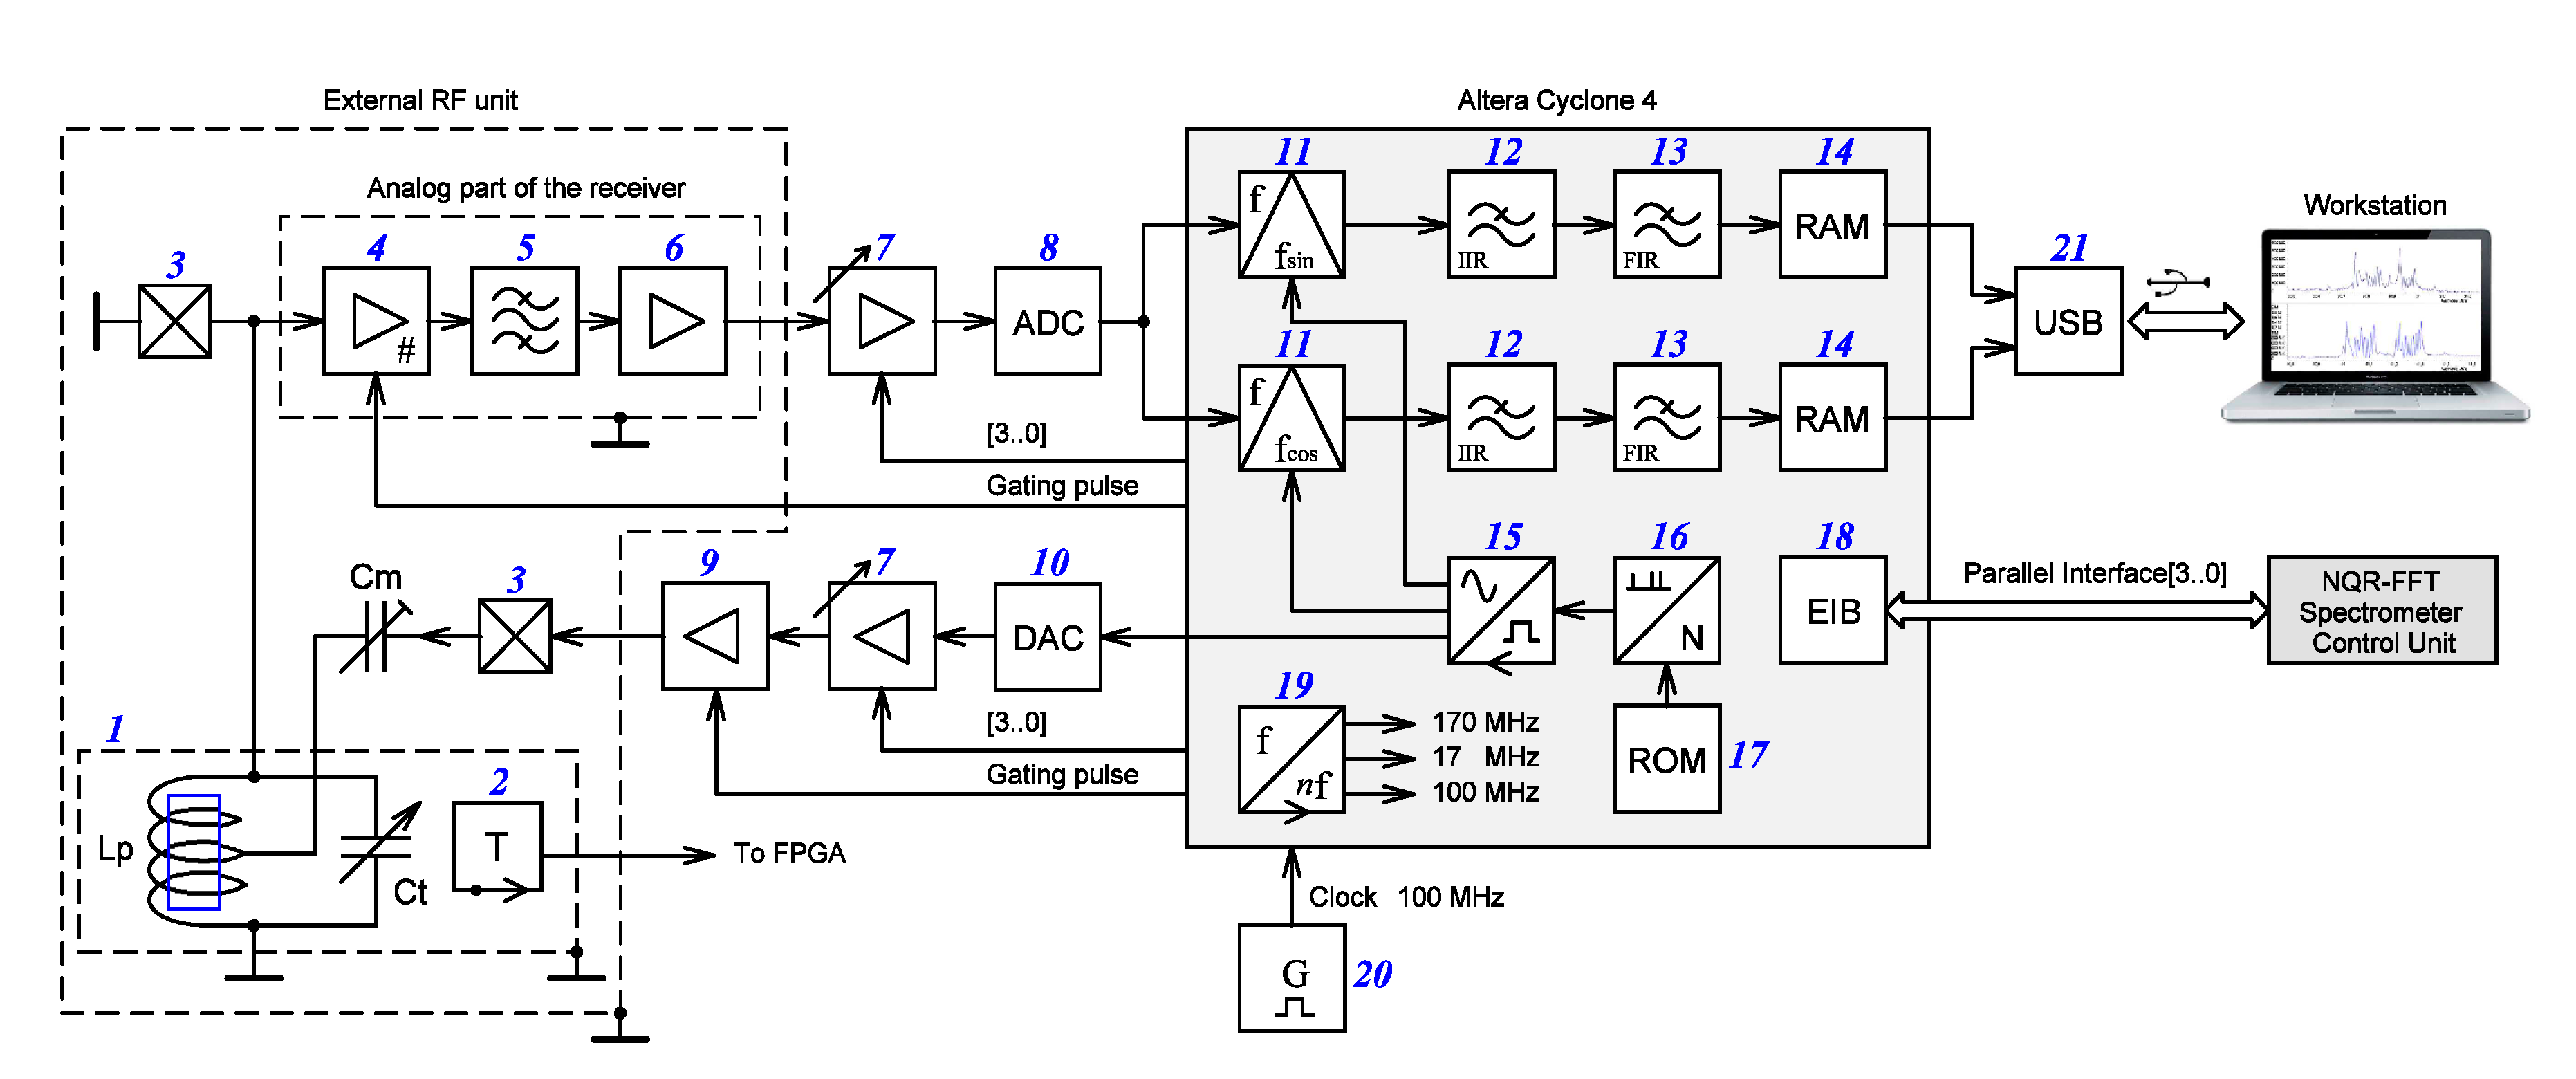
2. Measuring Setup for the Study of NQR

A block diagram of the developed device is simple, since all main modules of digital processing and synthesis on the field-programmable gate array (FPGA) are implemented (Figure 1). In more detail, this block diagram and the principle of operation are described in paper [1]. Some parts and units of the proposed device are described in detail in papers [14,15,16,17,18,19].

3. Input Stage of the Measuring Setup

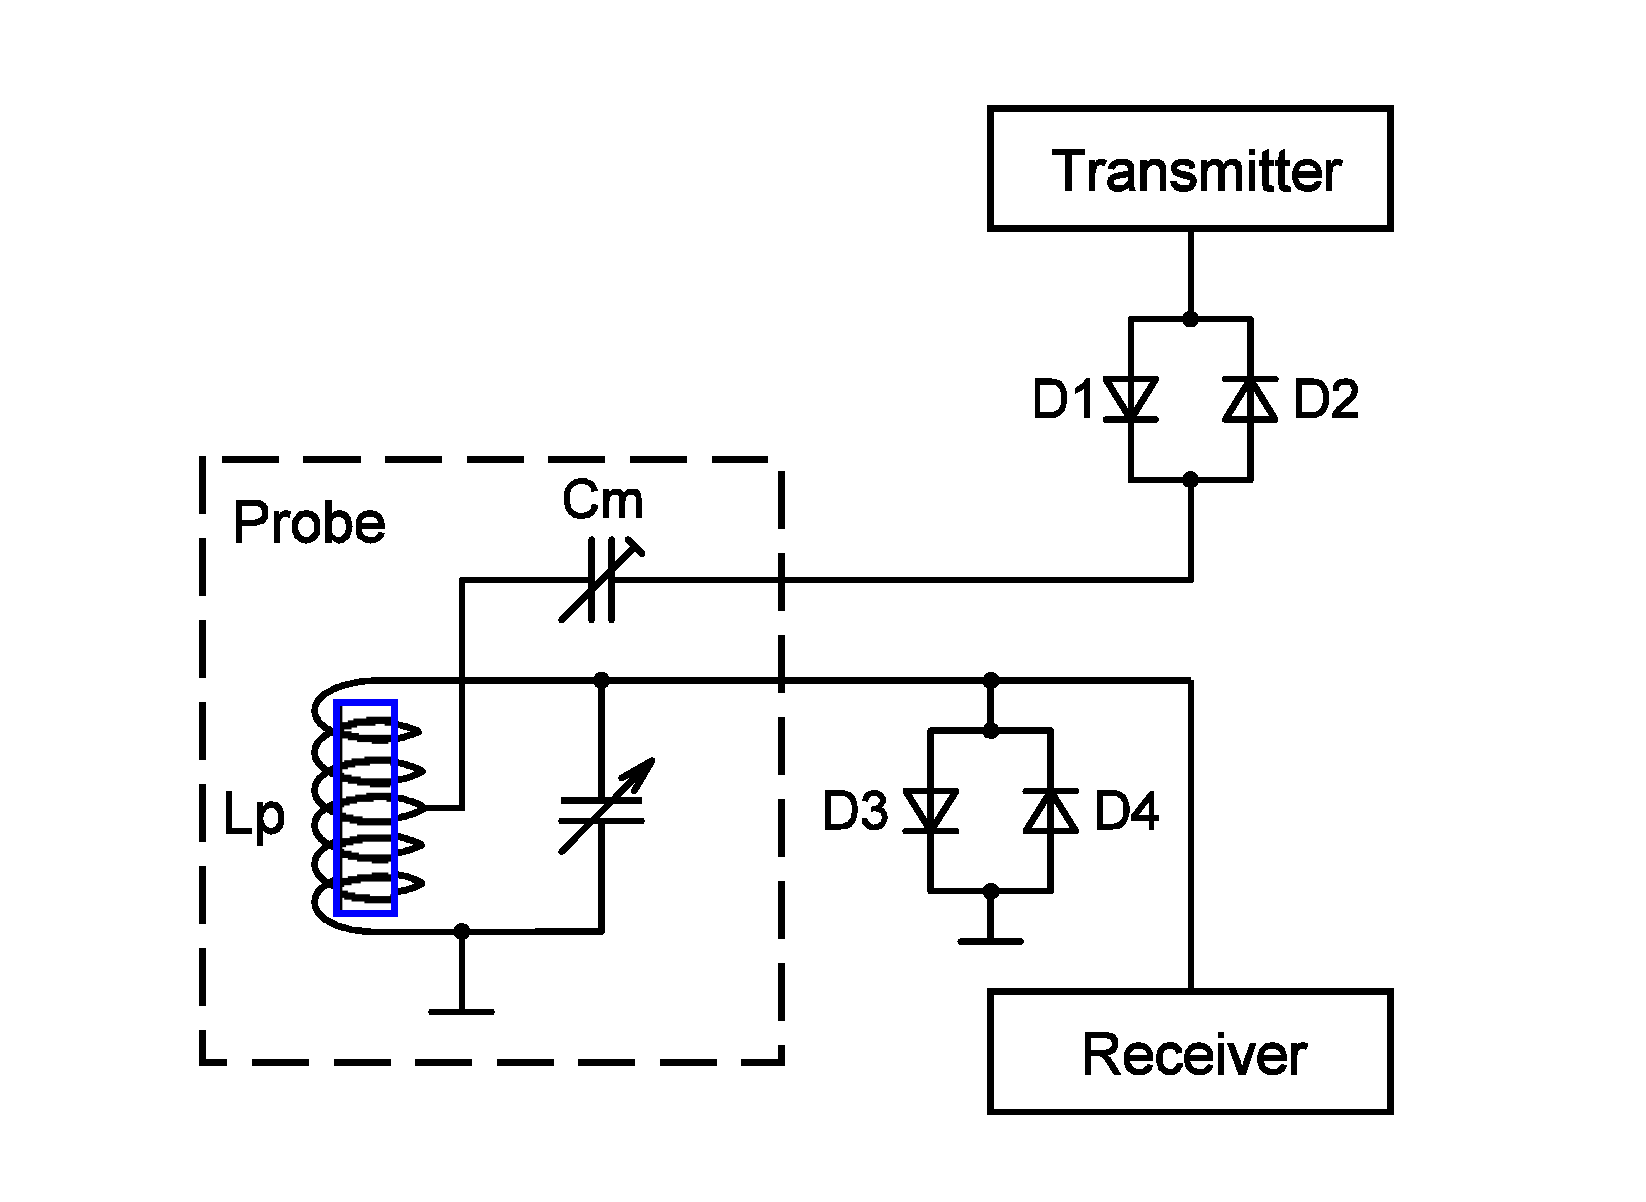
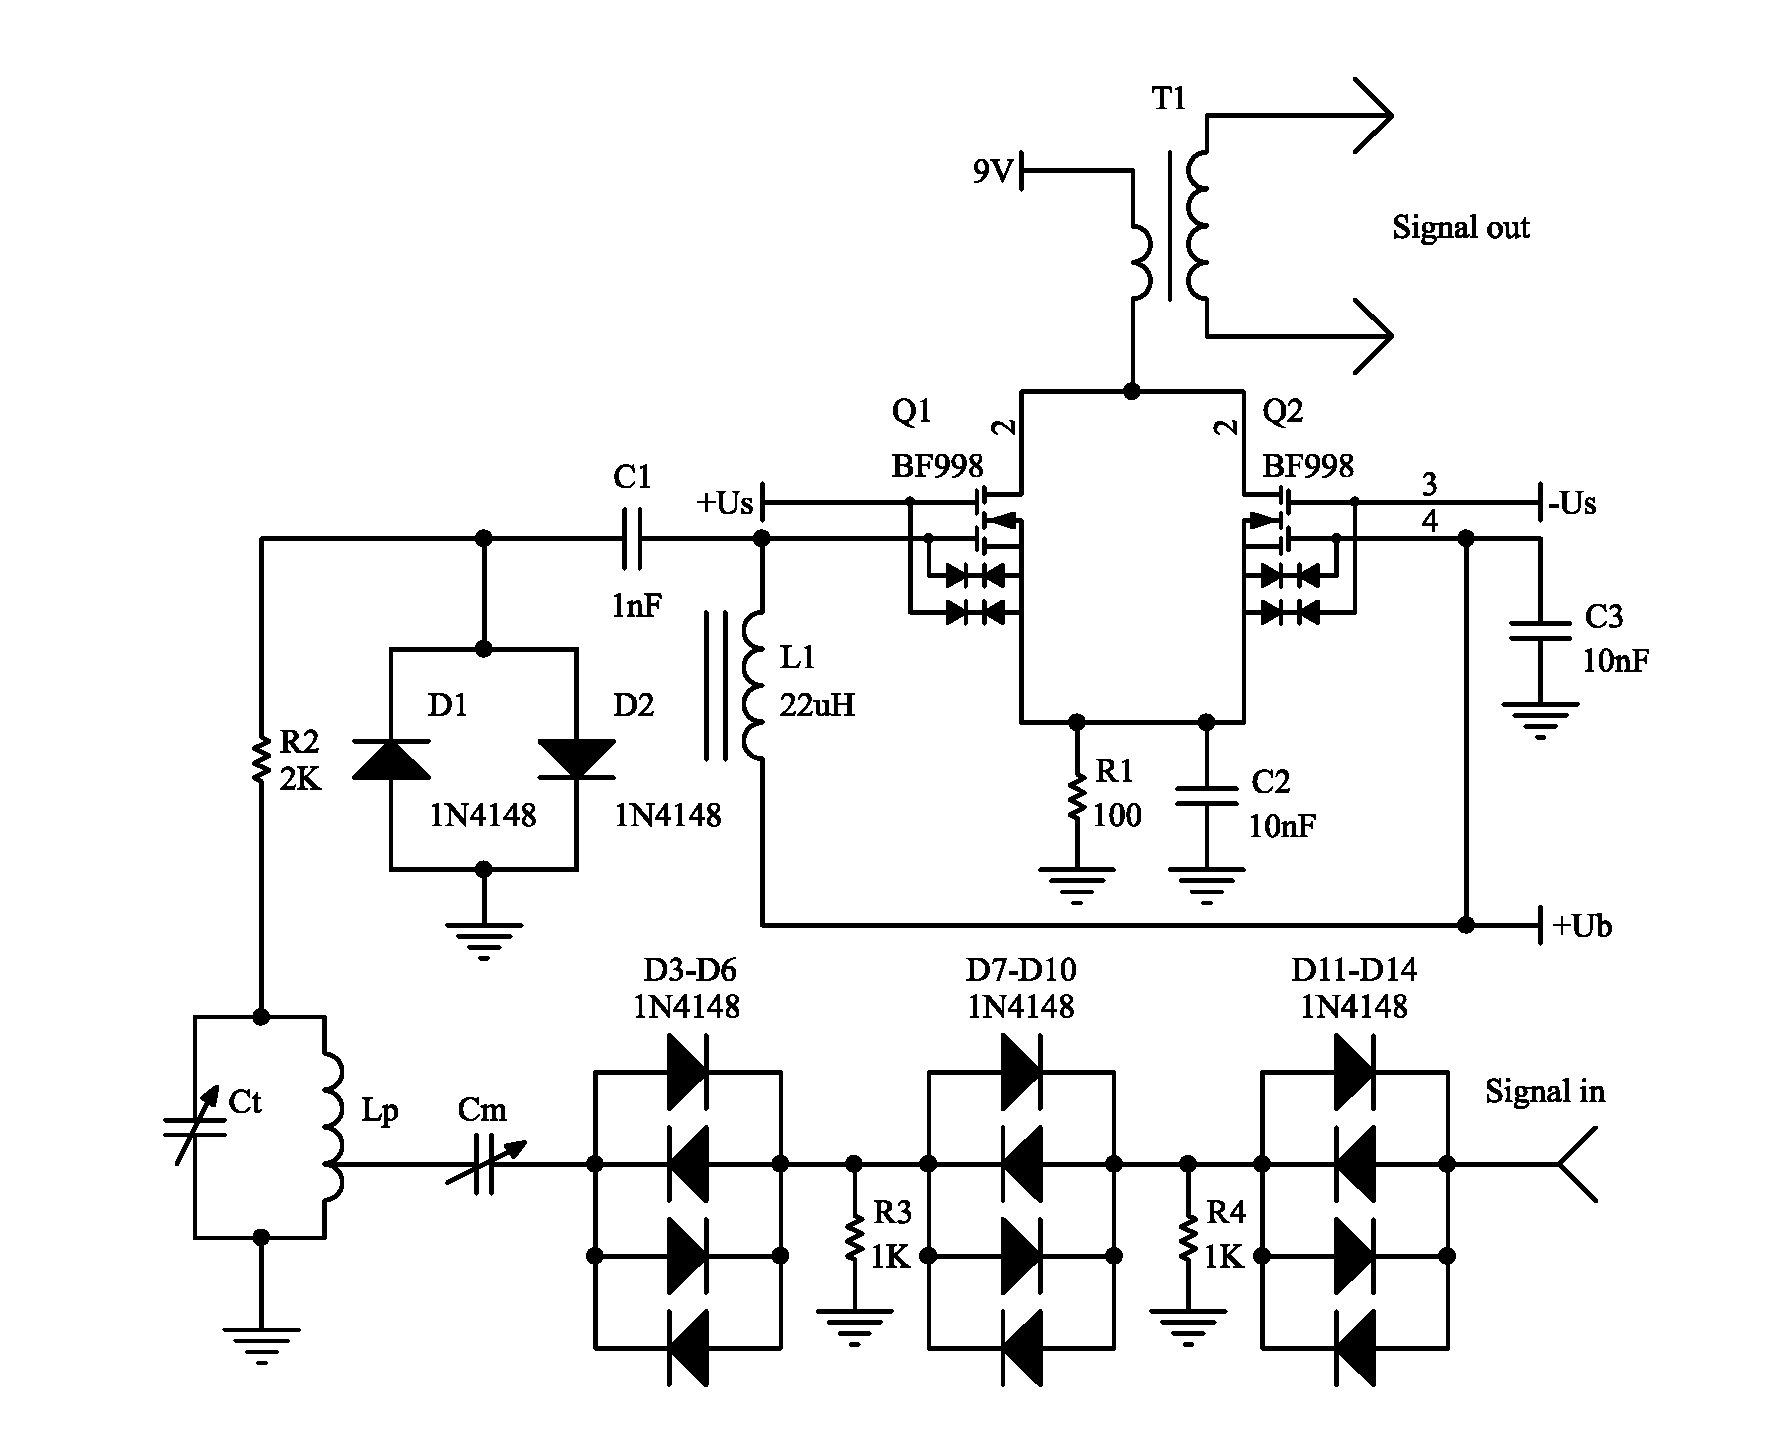
3.1. NQR Signal Sensor

The requirements for the NQR sensor are quite stringent. It should withstand HF voltages and quickly restore sensitivity after the action of a powerful excitation pulse. These requirements can be fulfilled by implementing the NQR sensor according to the principle shown in Figure 2. The test sample is placed inside the inductor Lp of the oscillating circuit, adjusted by the capacitor Ct to the resonance frequency (Larmor frequency).
The circuit is physically connected, both with the pulse transmitter, and with the receiver. The intensity of the HF field H1 in the zone of location of the test sample is expressed by the formula [20]:
H 1 3 P Q / ν 0 V ,
where P is the transmitter power in watts, ν0 is the resonance frequency in MHz, V is the probe coil volume in cubic centimeters.
The maximum value of H1 is not the only value that needs to be optimized. It is also necessary to take into account the homogeneity H1, the rise and fall times of the envelope of the RF pulse, and the sensitivity of the circuit (SNR) when the free induction decay (FID) signal passes through it.
Having considered the formula for H1, one can see that in order to obtain a strong RF field, the volume of the probe coil must be minimized, and the Q factor should be as large as possible. The Q factor of the inductor is expressed by the formula:
Q = 2 π ν 0 L / R = ω 0 L / R ,
where R is resistance in Ohms, ν0 is frequency in Hz, L is inductance in H.
Therefore, it is desirable for the probe coil by radio frequency radiation to have a high inductance and low resistance. Still, at the beginning and at the end of the pulse it would be better to have a small Q since the rise and fall times of the tank circuit are related to the Q by the ratio:
Q 1.5 ν 0 T r ,
where Tr is the free decay time constant of the tank circuit in μs.
To optimize the SNR, it is desirable to have a large volume of sample under study and a large quality factor Q of parallel oscillating circuit. There is also a limitation Q < 1.5ν0Tr. So, if we compare the large Q value required for the receiver and the small Q for the transmitter, then it is clear that when choosing the quality factor, it is necessary to satisfy conflicting requirements. Some compromise is also needed for the probe coil volume. In addition, to achieve the greatest sensitivity of the receiver, the inductance of the probe coil must be large.
Usually, to detect signals receiving the NQR response signals, either series or parallel resonance circuits are used. The proposed measurement setup used a parallel oscillating circuit (Figure 2). The capacitor Ct is tuned so that the input circuit has a resonance at the Larmor frequency, which is very important for detecting relatively weak NQR signals (about μV). The capacitor Cm changes the impedance of the circuit and is used for matching. The difficulty is that both of these tunings depend on each other. However, only with proper tuning can you achieve maximum sensitivity. For a parallel circuit, you can obtain the following expressions to determine the capacities [21]:
Cm = r r ω 2 Z 0 ( L 2 ω 2 + r 2 r Z 0 ) ;
Ct = L ω 2 Z 0 L 2 r ω 4 Z 0 r 2 ω 2 Z 0 2 + r 3 ω 2 Z 0 L 2 ω 4 Z 0 + r 2 ω 2 Z 0 ,
where L is the inductance of the probe coil, ω is the angular resonance frequency, Z0 is the input impedance of the sensor, r is the active resistance of the probe coil.
To optimally adjust the capacitors Ct and Cm, the dependence of their values on the resonance frequency was calculated taking into account expressions (4) and (5). The initial data were the following parameters: Z0 = 50 Ω, r = 0.01 Ω, L = 1.1 × 10⁻⁶ H. The calculation results are shown in Figure 3.

3.2. Gated Amplifier

In the measuring setup developed for the study of NQR, a variant of the receiving unit was proposed, a simplified diagram of which is shown in Figure 4. Gating is performed by applying opposite polar voltages +Us and −Us to the second gate of the dual gate JFETs Q1 and Q2.
For the isolation of the receiving circuit and the transmitter in the absence of an excitation pulse, quadruplicate groups of diodes D1–D14 of type 1N4148 are applied, loaded on resistors of 1 kΩ (R2, R3). Combining the pairwise connected diodes into groups is due to the need for current to flow up to ~4 A into the probe coil for the duration of the excitation pulse. The purpose of such a circuit is to weaken the leakage of the carrier frequency and noise through the diode capacities from the transmitter, as well as partially suppress the transient in an oscillating circuit.
For samples with a volume of ≤0.25 cm3, inductors (Lp) with a diameter of 7–10 mm are used. Samples with a small volume were used to study the NQR in the initial GaSe and InSe crystals prepared for the manufacture of heterojunctions by the “optical contact” method. To preserve the quality factor of the circuit and match with the low-impedance output of the RF power amplifier, the transmitter output is connected to a part of the probe coil turns. A tap to match the output impedance of the transformer with the input impedance of the oscillating circuit is carried out from 25% to 50% of the turns of the Lp and is set experimentally.
The protection of the input stage of the amplifier from the effects of radio frequency radiation is performed on the resistor R1 and high-speed bypass diodes D1, D2. The switching speed of the 1N4148 diodes is 4 ns.
Despite the presence in the schematic shown in Figure 4 of a protective circuit of the elements R1, D1, D2, at the moment of activation of the excitation pulse in the amplifying path of the receiver, a transient process occurs, overloading it. It turned out that the inclusion of a protective link of the types R1, D1, D2 at the inputs of each receiver cascade does not lead to a noticeable attenuation of this effect in the case connection between the cascades of broadband matching transformers.
Figure 5 shows the transient process at the output of the preamplifier caused by radio frequency radiation.
A key device for protecting a wideband preamplifier was proposed by Rudakov [22], but the carrier frequency suppression ratio was only 60 dB. In our case, effective gating of the device (up to 100 dB) is provided by three subsequent pairs of same-type dual gate JFETs connected in parallel with respect to the power source (Figure 6).
The circuit diagram and printed circuit board (PCB) of the analog signal chain are designed using Altium Designer software. The PCB (Figure 7a) is located in a metal case, where electromagnetic shields are between the separate stages (Figure 7b).

4. Experimental Studies of the Proposed Spectrometer and Discussion

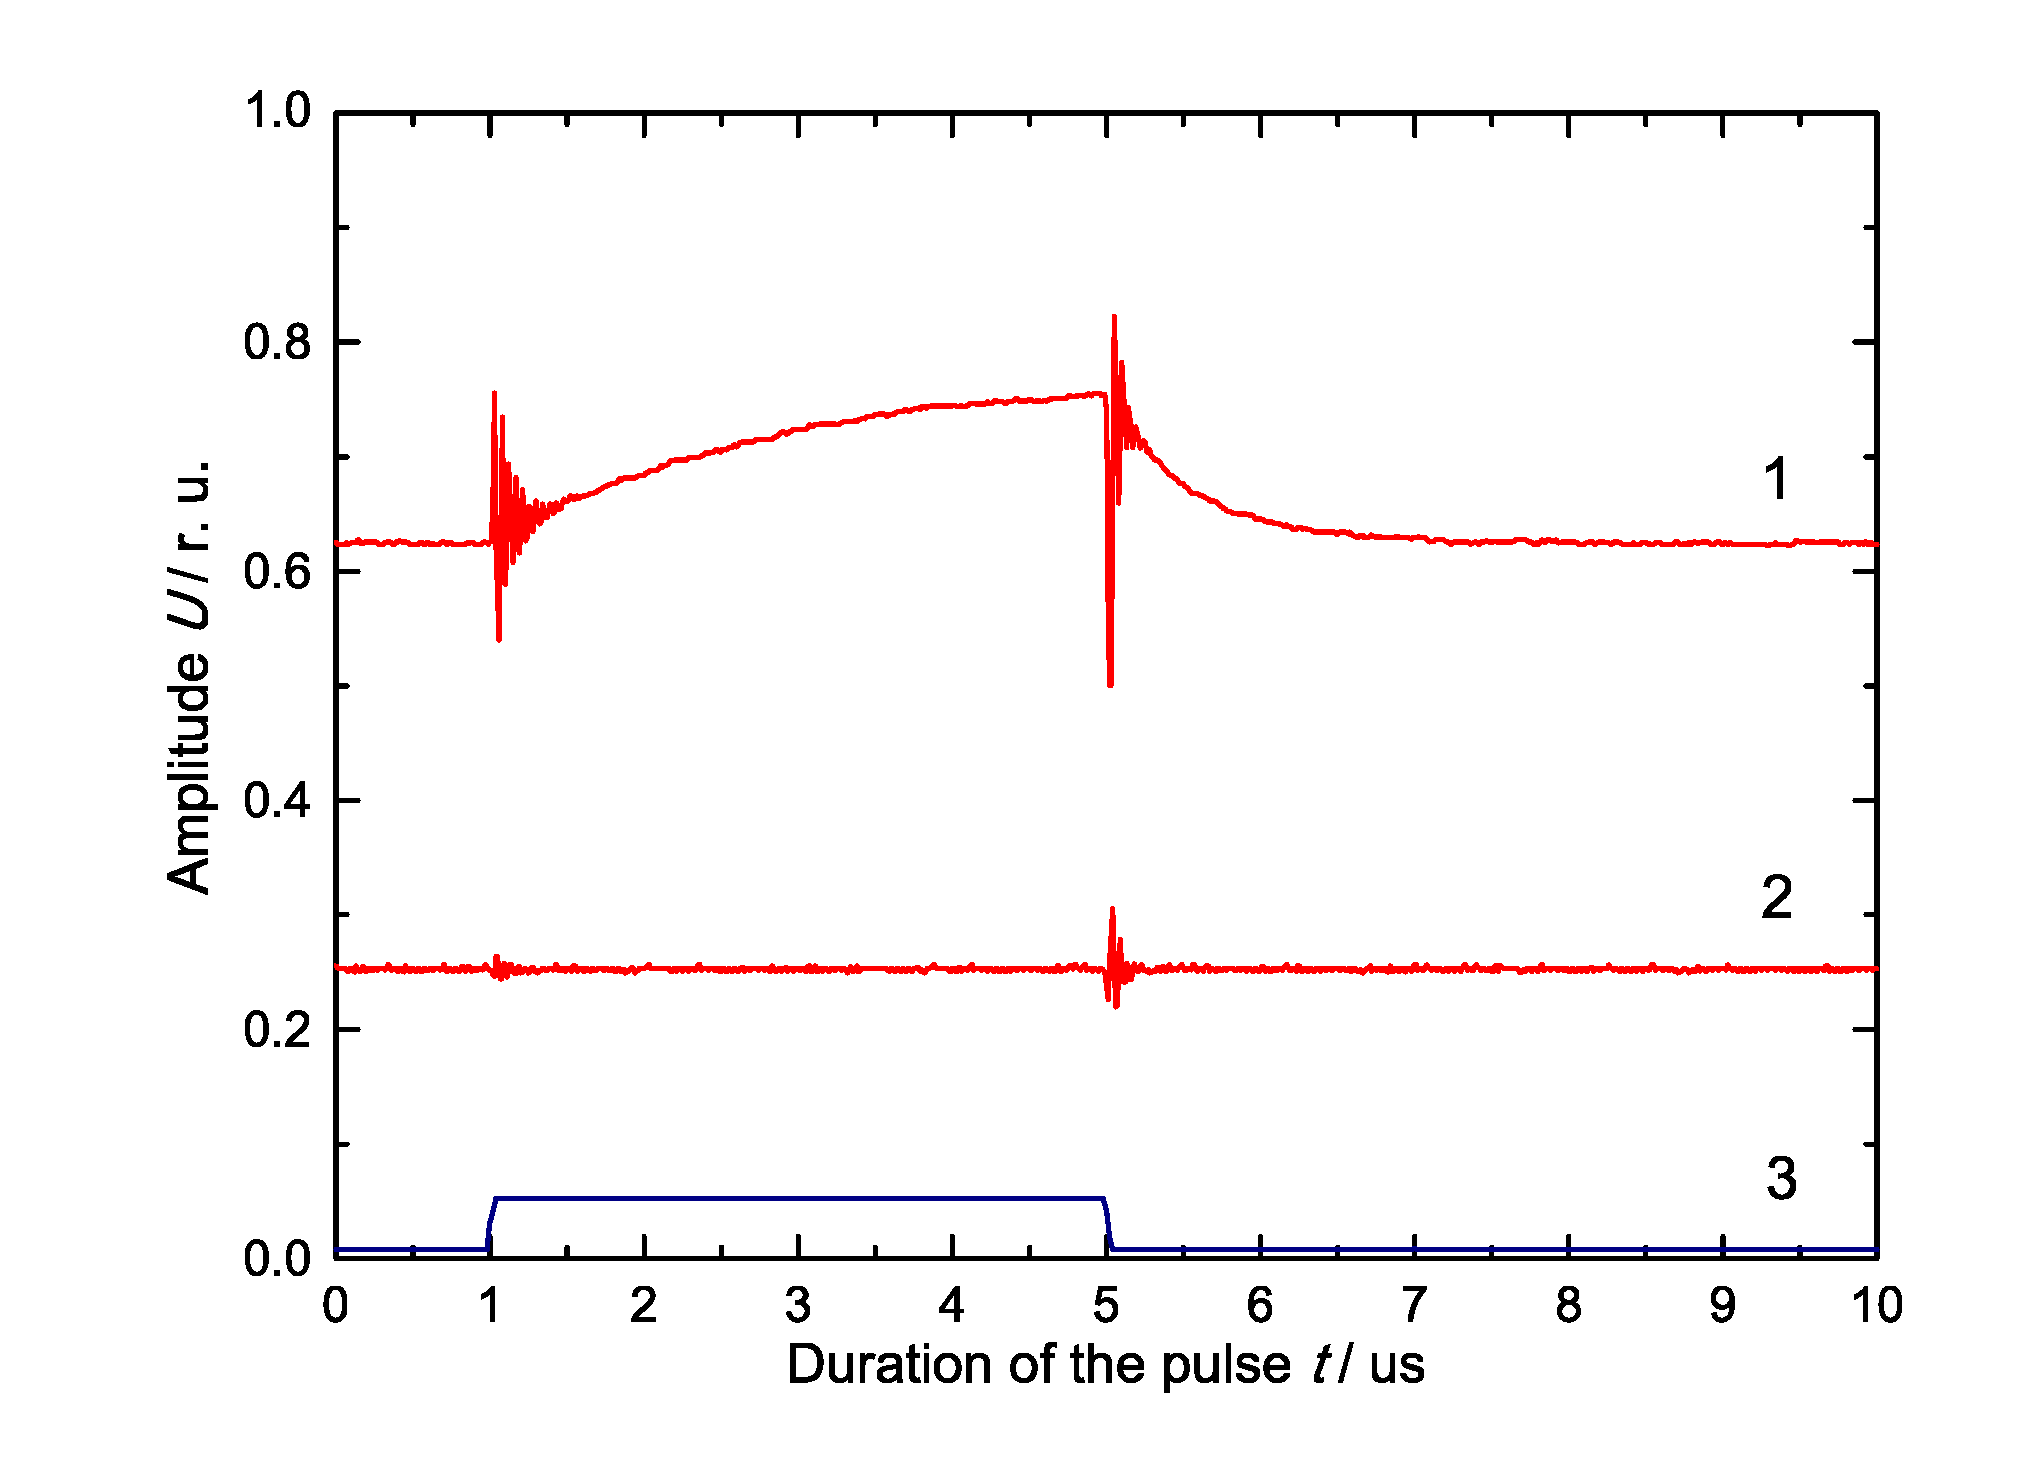
4.1. Signal Characteristics of an Analog Signal Chain

The study of the degree of suppression of the carrier oscillation and the frequency response of the analog signal chain based on the gated amplifier was carried out as follows. A test sinusoidal signal with the amplitude of 0.5 mV was fed from an OWON AG2052F signal generator to the input of the device under study. When studying the carrier oscillation suppression ratio, the amplitude of the signal from the generator assumed a maximum value of 5 V. The amplitudes of the signals at the input and output of the device under investigation were monitored using a Siglent SDS1202CNL digital oscilloscope. The carrier suppression ratio of the DUT is within 80–100 dB (Figure 8) and the noise factor is about 7 dB in the operating frequency range (Figure 9). For the proposed receiver, the noise factor is slightly higher than in commercial devices. However, the high gain is superior when there is a need to use analog-to-digital conversion for processing of weak signals. The measurement data were analyzed with a Siglent SSA3032X spectrum analyzer.
The experimental amplitude characteristics of the analog signal chain based on the gated amplifier, obtained for frequencies of 10 MHz, 20 MHz and 30 MHz are shown in Figure 10. From the dependence given, it can be seen that, for all three cases, the high linearity of the characteristics in the range of input signals with amplitudes from 10 uV to 0.5 mV is preserved. The plots use the logarithmic scale of the axes for easy visualization of the range of weak signals. At the output of the generator, a 40 dB attenuator is applied to attenuate the amplitude of the test signal to 5 uV. Minor nonlinearities of amplitude characteristics in the cut-off zone at Up-p < 20 uV (Figure 10) are due to the growth of 1/F type noise in the analog path of the measuring setup with a decrease in the operating frequency. When using a reconfigurable bandpass filter, the input sensitivity of the receiver is about 3–5 uV, which allows NQR research to be carried out in samples of comparatively small size even without the use of accumulation and averaging algorithms. The proposed device has some advantages over commercial products (Table 1).

4.2. 69Ga, 115In NQR Study of GaSe and InSe

The growth of the GaSe and InSe layered crystals from melts is most often conducted by the Bridgman technique which is technologically most implementable. Single-crystal selenides produced by the Bridgman technique are formed as cylindrical ingots, 15 mm in diameter and 70 mm in length, with a ~25 mm conical part. With a view to improve structural perfection and for ordering of polytypes, a long-term annealing with a gradual reduction of annealing temperature was used. The degree of monocrystallicity and structural perfection of samples were determined by X-ray topography methods, as well as NQR methods [23]. Samples cut from these ingots were investigated. Undoped monoselenides are distinguished by a low concentration of charge carriers (≤1013−1014 cm−3) and a relatively low mobility (800–1000 cm2 V−1 s−1 for n-InSe and 20–25 cm2 V−1 s−1 for p-GaSe) [7]. The results of experimental studies of the NQR spectra of 69Ga and 115In isotopes obtained using the developed methods of pulsed radio spectroscopy are shown in Figure 11, Figure 12, Figure 13 and Figure 14. The multiplicity of the NQR spectra results in a complicated waveform of the FID (Figure 11). The spectrum obtained after FFT of the FID. We used excitation pulses of 3 μs duration and 200 W power, the bandwidth of the bandpass filter was 25 MHz and blanking time was about 300 ns. The quadrupole resonance spectrum of 69Ga in the frequency range 19.08–19.21 MHz is shown in Figure 12. Due to the presence of polytypes of ε- and γ-modifications in the crystal, the spectrum consists of two groups of lines offset by 52.14 kHz on the frequency scale.
The complex multiple NQR spectra are located in 4 bands with central frequencies 10.25 MHz, 20.5 MHz, 30.75 MHz and 41 MHz are typical for InSe [23]. The complexity of NQR spectra can also be noticed in the waveform of the FID (Figure 13). The NQR spectrum was observed in the band with a central frequency of 20.5 MHz, which corresponds to the spin transition ±3/2 ↔ ±5/2. The quadrupole resonance spectrum of 115In in the frequency range 20.4–20.75 MHz is shown in Figure 14. The observed spectrum is inherent in the mixture of polytypes of ε- and γ-modifications in the InSe crystalline matrix.
The application of the developed methods of NQR pulsed radio spectroscopy made it possible to increase spectral resolution, improve spectral shape and significantly reduce the time of research. In the case of studying InSe and GaSe crystals, spectra with SNR values of 41.9 dB were observed in samples with a volume of 0.1 cm3 [14]. The total time of observation of each NQR spectrum and the calculation of the FFT was about 10 s. To improve the SNR, an averaging of 128 iterations was used.
The proposed spectrometer can also be effectively used in practice in combination with optical sensors based on a tilted fiber Bragg grating (TFBG) [24,25,26]. In particular, it can be used for control of mechanical deformation and changes in the crystal structure of semiconductors. Moreover, the NQR sensors perform well with TFBG sensors in medical applications. This may be the case with temperature profiling in nuclear magnetic resonance devices (NMR).

5. Conclusions

A low-cost digital pulsed NQR radio-spectrometer is proposed, all main modules of digital processing and synthesis of which are implemented on the Intel’s Cyclone IV FPGA. This significantly reduces the cost of the device and allows its operational configuration with FPGA programming. The volume of FPGA EP4CE15E22C8 hardware resources used was as follows: total logic elements—9826 (64%), total registers—2416, total pins—61 (74%), total memory bits—160,868 (31%), embedded multiplier 9-bit elements—13 (12%), total PLL—1 (25%).
The device has some advantages over commercial products:
  • Autonomy. The device will not require external units such as Spincore PulseBlaster, Spincore RadioProcessor, Redstone Transmitter et al.
  • Total preamp gain.
  • Digital receiver bandwidth.
  • Accuracy. Its high accuracy is due to the fact that the generation of the excitation signal and digital processing are provided in one chip. We used a three-channel 48-bit direct digital synthesizer. The timing resolution is 10 ns.
  • Power. We have developed a broadband energy-efficient RF transmitter with a pulse power of 1 kW. The device has smaller dimensions and weight.
  • Price. The proposed device is much cheaper than analogues.
As the results of the research have shown, the characteristics of the proposed spectrometer make it effective when used to observe FID signals of a significant number of isotopes of chemical elements with quadrupolar nuclei (14N, 35Cl, 63Cu, 69Ga, 71Ga, 113In, 115In and others) in the frequency range 1–50 MHz.

Author Contributions

Methodology, O.H. and A.S.; software, A.S.; validation, O.H. and A.S.; investigation, O.H.; writing—original draft preparation, O.H. and A.S.; writing—review and editing, O.H. and A.S.; project administration, A.S. All authors have read and agreed to the published version of the manuscript.

Funding

This research received no external funding.

Acknowledgments

The authors would like to express their sincere gratitude to O.G. Khandozhko, from the Radio Engineering and Information Security Department, Yuriy Fedkovych Chernivtsi National University, for scientific advice provided during the present research.

Conflicts of Interest

The authors declare no conflict of interest.

References

  1. Samila, A.P.; Politansky, L.F.; Hotra, O.Z. A portable digital multipulse NQR spectrometer for the study of the sensory properties, structure and defects in layered semiconductors. In Proceedings of the 2020 IEEE 15th International Conference on Advanced Trends in Radioelectronics, Telecommunications and Computer Engineering (TCSET), Lviv-Slavske, Ukraine, 25–29 February 2020. [Google Scholar]
  2. Dind Yujie, J.; Shi, W. Widely-tunable, monochromatic, and high-power terahertz sources and their applications. J. Nonlinear Opt. Phys. Mater. 2003, 12, 557–585. [Google Scholar]
  3. Kovalyuk, Z.D.; Katerynchuk, V.M.; Savchuk, A.I.; Sydor, O.M. Intrinsic conductive oxide-p-InSe solar cells. J. Mater. Sci. Eng. B 2004, 109, 252–255. [Google Scholar] [CrossRef]
  4. Kyazym-zade, A.G.; Agaeva, A.A.; Salmanov, V.M.; Mokhtari, A.G. Optical detectors on GaSe and InSe layered crystals. Tech. Phys. 2007, 52, 1611–1613. [Google Scholar] [CrossRef]
  5. Grigorchak, I.I. Fizychni Protsesy u Supramolekulyarnyh Ansamblyah ta yih Praktychne Zastosuvannya [Physical Processes in Supramolecular Ensembles and Their Practical Implementation]; Ruta: Chernivtsi, Ukraine, 2016. (In Ukrainian) [Google Scholar]
  6. Terhell, J.C.J.M. Polytypism in the III-VI layer compounds. Prog. Cryst. Growth Charact. 1983, 7, 55–110. [Google Scholar] [CrossRef]
  7. Samila, A.P.; Lastivka, G.I.; Khandozhko, V.A.; Kovalyuk, Z.D. Prompt quality monitoring of InSe and GaSe semiconductor crystals by the nuclear quadrupole resonance technique. Semiconductors 2016, 50, 1034–1037. [Google Scholar] [CrossRef]
  8. Grechishkin, V.S. Yadernye Kvadrupolnye Vzaimodeystviya v Tverdyh Telah [Nuclear Quadrupole Interactions in Solids]; Nauka: Moscow, Russia, 1973. (In Russian) [Google Scholar]
  9. Bastow, T.J.; Cambell, I.D.; Whitfeld, H.J. A 69Ga, 115In NQR study of polytypes of GaS, GaSe and InSe. Solid State Commun. 1981, 39, 307–311. [Google Scholar] [CrossRef]
  10. Samila, A. Peculiarities of using s-simulation for parametric identification of multiplet 115In NQR spectra in InSe. Measurement 2017, 106, 109–115. [Google Scholar] [CrossRef]
  11. Kovalyuk, Z.D.; Lastivka, G.I.; Khandozhko, A.G. Fine structure of NQR Spectra in GaSe. Semicond. Phys. Quantum Electron. Optoelectron. 2009, 12, 370–374. [Google Scholar] [CrossRef]
  12. Samila, A.P.; Khandozhko, V.O.; Kovalyuk, Z.D. The nuclear quadrupole resonance and sensory properties of GaSe and InSe layered semiconductors. J. Nano Electron. Phys. 2015, 7, 03024-1. [Google Scholar]
  13. Polak, A.G.; Mroczka, J.; Wysoczanski, D. Tomographic image reconstruction via estimation of sparse unidirectional gradients. Comput. Biol. Med. 2017, 81, 93–105. [Google Scholar] [CrossRef] [PubMed]
  14. Samila, A.; Khandozhko, V.; Politansky, L. Energy efficiency increase of NQR spectrometer transmitter at pulse resonance excitation with noise signals. Solid State Nucl. Magn. Reson. 2017, 87, 10–17. [Google Scholar] [CrossRef] [PubMed]
  15. Samila, A.; Lastivka, G.; Politansky, L.; Kazemirskiy, T. Waveform generation for the digital synthesis systems based on embedded hardware. In Proceedings of the 2018 14th International Conference on Advanced Trends in Radioelecrtronics, Telecommunications and Computer Engineering (TCSET), Lviv-Slavske, Ukraine, 20–24 February 2018. [Google Scholar]
  16. Samila, A.; Hotra, O.; Politansky, L.; Khrapko, S. Application of a statically configured FPGA in the digital control system of the NQR radio spectrometer. In Photonics Applications in Astronomy, Communications, Industry, and High-Energy Physics Experiments; International Society for Optics and Photonics: Bellingham, DC, USA, 2018; Volume 10808, p. 108081K. [Google Scholar]
  17. Bobalo, Y.; Hotra, Z.; Hotra, O.; Politans’kyy, L.; Samila, A. Pulse sequence shaper for radiospectroscopy and relaxation methods in NQR. Metrol. Meas. Syst. 2015, 22, 363–370. [Google Scholar] [CrossRef] [Green Version]
  18. Hotra, O.; Samila, A.; Politansky, L. Synthesis of the configuration structure of digital receiver of NQR radiospectrometer. Przegląd Elektrotechniczny 2018, 94, 58–61. [Google Scholar] [CrossRef] [Green Version]
  19. Samila, A.; Hres, O.; Rozorynov, G. Hardware and software implementation of data acquisition system for pulsed NQR spectrometer. In Proceedings of the 2018 14th International Conference on Advanced Trends in Radioelecrtronics, Telecommunications and Computer Engineering (TCSET), Lviv-Slavske, Ukraine, 20–24 February 2018. [Google Scholar]
  20. Gilbert Clark, W. Pulsed nuclear resonance apparatus. Rev. Sci. Instrum. 1964, 35, 316–333. [Google Scholar] [CrossRef]
  21. Design of Impedance Matching Networks for NMR and NQR Studies in the HF Band. Available online: http://www.phys.ufl.edu/~majewski/letters/match.pdf (accessed on 22 June 2019).
  22. Rudakov, T.N.; Shpilevoi, A.A. An Input Device for the Receiving Channel of a Nuclear Quadrupole Resonance Spectrometer. Instrum. Exp. Tech. 1997, 40, 215–216. [Google Scholar]
  23. Khandozhko, V.; Raranskii, N.; Balazjuk, V.; Samila, A.; Kovalyuk, Z. Temperature and baric dependence of nuclear quadruple resonance spectra in indium and gallium monoselenides. In Eleventh International Conference on Correlation Optics; International Society for Optics and Photonics: Bellingham, DC, USA, 2013; Volume 9066, p. 90661G. [Google Scholar]
  24. Kisała, P.; Skorupski, K.; Cieszczyk, S.; Panas, P.; Klimek, J. Rotation and twist measurement using tilted fibre Bragg gratings. Metrol. Meas. Syst. 2018, 25, 429–440. [Google Scholar]
  25. Kisała, P.; Harasim, D.; Mroczka, J. Temperature-insensitive simultaneous rotation and displacement (bending) sensor based on tilted fiber Bragg grating. Opt. Express 2016, 24, 29922–29929. [Google Scholar] [CrossRef] [PubMed]
  26. Kisała, P.; Mroczka, J.; Cieszczyk, S.; Skorupski, K.; Panas, P. Twisted tilted fiber Bragg gratings: New structures and polarization properties. Opt. Lett. 2018, 43, 4445–4448. [Google Scholar] [CrossRef] [PubMed]
Figure 1. Block diagram of the measuring setup for the study of nuclear quadrupole resonance (NQR): (1) NQR sensor unit; (2) digital thermometer; (3) diode limiters; (4) gated RF amplifier; (5) bandpass filter; (6) matching amplifier; (7) variable gain amplifiers; (8) analog to digital converter; (9) RF transmitter; (10) digital to analog converter; (11) double balanced mixers; (12) integrator-comb filters; (13) compensating filters; (14) random access memory; (15) direct digital synthesizer; (16) multi-pulse generator; (17) read only memory; (18) control module driver; (19) phase-locked loop; (20) crystal oscillator; (21) universal serial bus.
Electronics 09 01996 g001
Figure 2. Basic structure of the NQR sensor.
Electronics 09 01996 g002
Figure 3. Dependence of nominal values of capacities Ct and Cm on resonance frequency.
Electronics 09 01996 g003
Figure 4. Circuit diagram of the input stage of the NQR spectrometer.
Electronics 09 01996 g004
Figure 5. Transient process in the spin signal amplifier: (1) Without a suppression circuit; (2) With the application of the proposed transient suppression circuit; (3) Gating pulse.
Electronics 09 01996 g005
Figure 6. The circuit diagram of the proposed gated amplifier.
Electronics 09 01996 g006
Figure 7. The design of the analog signal chain based on the gated amplifier: (a) printed circuit board; (b) Device photo.
Electronics 09 01996 g007
Figure 8. Carrier suppression ratio of the analog signal chain based on the gated amplifier.
Electronics 09 01996 g008
Figure 9. Gain and noise figure of the analog signal chain based on the gated amplifier.
Electronics 09 01996 g009
Figure 10. Experimental amplitude characteristics of the analog signal chain based on the gated amplifier.
Electronics 09 01996 g010
Figure 11. Modulation of the carrier frequency by the free induction decay (FID) signal in GaSe after pulse excitation (duration τ = 3 us, power P = 200 W, bandpass filter bandwidth ΔF = 25 MHz, blanking time τBL~300 ns).
Electronics 09 01996 g011
Figure 12. NQR spectrum for 69Ga isotope in GaSe: intensity of resonance lines on the scale of resonance frequencies.
Electronics 09 01996 g012
Figure 13. Modulation of the carrier frequency by the FID signal in InSe after pulse excitation (duration τ = 3 us, power P = 200 W, bandpass filter bandwidth ΔF = 25 MHz, blanking time τBL~300 ns).
Electronics 09 01996 g013
Figure 14. NQR spectrum for 115In isotope in InSe for spin transition at a frequency of 20.5 MHz.
Electronics 09 01996 g014
Table 1. Comparison of spectrometer parameters with the parameters of other commercial spectrometers.
ParameterProposed SpectrometerMagritek KeaTecmag Redstone
ApplicationsNQRNuclear magnetic resonance (NMR)NMR, NQR or Magnetic resonance imaging (MRI)
Operating frequency range1–50 MHz0–50 MHz1–500 MHz
Total preamp gainto 50 dB30–40 dBto 30 dB
Preamp noise figure5 dB<1.5 dB<1.2 dB
Transmitter output powerup to 1 kW at 20 ms100 W500 W at 20 ms
Minimum pulse width100 ns100 ns10 ns
Timing resolution10 ns100 ns10 ns
Digital receiver bandwidth15 MHz-12.5 MHz
Digital receiver dynamic range12-bits16-bits24-bits
InterfaceUSB 2.0USB 2.0USB 2.0
Publisher’s Note: MDPI stays neutral with regard to jurisdictional claims in published maps and institutional affiliations.

