A Telespirometer for the Developing World

Department of Aerospace, Mechanical and Mechatronic Engineering (AMME), University of Sydney, Sydney, NSW 2006, Australia
Electronics 2020, 9(2), 275; https://doi.org/10.3390/electronics9020275
Submission received: 20 December 2019
/
Revised: 25 January 2020
/
Accepted: 2 February 2020
/
Published: 6 February 2020
(This article belongs to the Special Issue Smart Sensor Networks)
Abstract
:There are numerous examples in which the introduction of expensive medical equipment into the developing world fail for lack of a basic understanding of the device operation, lack of spare parts and poor maintenance. This paper describes the development of a Fleisch pneumotachograph and cellphone based telespirometer that can easily be built from “junk box” medical and electronic components available in the developing world. This approach should introduce a sense of local ownership to the project as well as encouraging participation by the local electronics repair industry. Experimental results confirm that the forced expiratory flow data are reliably modulated onto an audio signal and transmitted by cellphone to a base station for examination by a district nurse or doctor. Flow measurement and data transmission accuracies are sufficiently good for remote diagnoses of chronic obstructive pulmonary disease.
1. Introduction
Telemedicine is becoming the only effective means of providing healthcare to remote and resource constrained environments in the developing world [1]. The primary reasons for this are the shortage of available medical professionals and poor transport infrastructure in conjunction with the rapid proliferation of cellphone use in these areas [2].
In quantifiable terms, according to the World Health Organization (WHO), the African region has 24% of the global disease burden with 3% of the health workers commanding less than 1% of the world health expenditure, compared to the American region which has 10% of the burden, 37% of the world’s health workers and 50% of the budget. The WHO recommends a minimum of 20 doctors per 100,000 population, whereas 13 countries in sub-Saharan Africa have fewer than 5 per 100,000 [3].
Possible solutions in developing countries involve improving education for workers and building workforce capacity [4]. In his paper, Hersh also presents a framework for how assessments should be made as to the site, scope and training levels of the workforce that will ultimately be required in these countries.
In contrast to the shortage of doctors, according to the International Telecommunication Union, among all UN-defined developing nations, cellphone penetration has grown from about 8% to 79% in the last decade, as shown in Figure 1 [5].
1.1. Using the Cellphone Network
To make the best use of this communications network, it should be possible to take diagnostic medicine to the most rural and isolated regions, provided that simple but robust sensors could be developed to measure the appropriate physiological functions. Delivering healthcare to populations with limited access to care is one of the most advantageous aspects of telemedicine [6]. To achieve this, raw physiological data captured by staff with little or no medical training could be transmitted back to clinics for processing, allowing fast diagnosis by the district nurse or doctor there. This can save potential patients the lost productivity and expense of a long and often debilitating walk to the nearest clinic.
Sensor equipped smartphones are already being used in a wide range of applications, and these are expected to grow significantly in the future as more applications are developed [7]. Much of the current work in the field involves the development of ubiquitous portable devices that monitor patient status second by second [8,9]. A review paper by Wei et al. in regard to the uses of text messaging also showed a wide variety of clinical uses of the technology and generally improved outcomes compared to more conventional approaches [10].
More specifically, a study of 4581 patients to ascertain the effectiveness of continuing intervention and feedback based on forced spirometry (FS) measurements concluded that tele-collaboration between primary care staff and lung function specialists has a positive effect on the quality assurance of FS performed by non-experts [11].
A number of institutions are working on simple phone-powered oximeters, stethoscopes and blood pressure monitors for these purposes [12,13,14], and though these devices are fairly low-cost they are generally manufactured elsewhere and distributed along with other medical supplies if they are earmarked for the developing world.
The recent development and proliferation of smart watches is also changing the way in which medical data is obtained, as they generate large amounts of it, albeit with limited accuracy. An analysis of 73 studies conducted between 2014 and 2016 showed that watches focused on activity and heart rate monitoring, speech therapy adherence, diabetes self-management, and detection of seizures, tremors, scratching, eating and medication-taking behaviours. The paper concluded that more studies are required to really evaluate the efficacy of smart watches [15]. This requirement may be addressed in part by a National Institute of Health (NIH) survey into precision medicine earmarked to start later in 2020 [16].
An excellent illustration of the rapid progress being made in the telemedicine field concerns a software package called Reacts (Remote Education, Augmented Communication, Training and Supervision). This is an integrated collaborative platform incorporating a number of interactive tools to facilitate collaboration. It was created by a Quebec based company, Innovative Imaging Technologies Inc. (IIT) in 2014 and is now being used across the world for uses ranging from secure messaging, remote wound care, teleconsulting and tele-ultrasound to interactive tele-surgical assistance and procedural supervision. In 2018, Reacts was integrated with the new Philips Lumify portable ultrasound system to provide first responders with a reliable high bandwidth bidirectional link back to a specialist [17].
In regard to telespirometry in particular, a number of alternatives exist. A group at Oxford University are developing a whistle, the frequency of which is proportional to airflow, while researchers at the University of Washington have developed a device called SpiroSmart that relies on processing data from a smartphone microphone [18]. Another smartphone based device developed to meet the accuracy requirements published by the American Thoracic Society and European Respiratory Society uses a Lilly pneumotachograph, a precision differential pressure transducer, a Bluetooth link with a processor and display app [19]. In contrast to these examples, our objective was to develop a similarly sensitive pneumotachograph that could be easily manufactured by hand for less than $1 in the developing country, with few resources, but could still be interfaced to any cellphone. The reason for this approach is to encourage ownership and facilitate maintenance of the device, and even possibly its further development by local stakeholders [1,20].
1.2. Recognizing Chronic Obstructive Pulmonary Disease
One of the most debilitating and yet underdiagnosed diseases of the developing world is chronic obstructive pulmonary disease (COPD) [21]. This disease is characterized by obstruction of the airways leading to a chronic cough and shortness of breath. COPD differs from other lung diseases because it cannot be treated and the symptoms get progressively worse over time. For this reason, it is important to obtain a diagnosis as early as possible. The leading causes of COPD are cigarette smoking and indoor air pollution from the use of wood or dung fires for cooking [22].
Remote spirometric monitoring of lung function has been available for at least fifteen years, with systems having been developed primarily for the developed world, and being based on commercially available spirometers, microprocessors and acoustic modems [23,24]. A comprehensive literature review of the use of telemedicine for COPD management concluded that this method provided similar or better than usual care for quality of life and patient satisfaction outcomes [25].
The effectiveness of using spirometry to diagnose COPD has been examined in a study of the medical records of more than one thousand patients in Sweden. The results showed that 30% of patients had their diagnosis confirmed using spirometry, with the main problems being smoking, high body mass index and too short exhalation times [26]. In contrast to this, a study conducted in Greece at about the same time concluded that a primary care spirometry program may identify a large proportion of undiagnosed COPD patients, especially in the early stages of the disease [27].
A review by Barnes [28] describes a number of precautions that should be taken to ensure that spirometry is effective in diagnosing COPD. These include the following from the American Association for Respiratory Care:
- Use a COPD questionnaire to identify those at risk.
- Use an electronic device to detect those likely to have a low peak flow.
- Only perform spirometry on those at higher risk of COPD (smoking, biomass fuel exposure).
- Take the time to perform good spirometry.
It has been shown by Mukherjee that it is possible to perform reliable spirometry measurements in a rural setting. Tests conducted on 315 patients showed that about two thirds of the patients were correctly assessed using this technique [29].
It can be concluded that a low cost easy to manufacture spirometer with a simple cellphone interface would be used widely and effectively in the developing world to provide an accurate early diagnosis of COPD, so long as the operator has the appropriate training. This would allow sufferers to make some lifestyle changes, such as giving up smoking and minimizing the inhalation of wood smoke, before the symptoms became too debilitating.
1.3. Aim and Structure
The aim of this research is to develop the mechanical components, the electronics and the relevant cellphone interfaces that could be used to provide a blueprint for a tele-connected Fleisch pneumotachograph to allow its manufacture in the developing world for as little as $1.
Section 2 starts with a description of the development of a simple Fleisch cell made from syringe needles. Subsequent analysis suggests that the flow regime would remain below the critical Reynolds number for flows in excess of 10 L/s allowing for accurate flow rates to be measured. The method of using two radio frequency oscillators to generate an acoustic signal with a frequency proportional to flow rate using a simple manometer is then described.
Section 3 describes the calibration process using a simple-to-make spirometer and a sensitive differential pressure transducer. This section confirms that the measured performance of the Fleisch pneumotachograph is within a factor of two of that derived theoretically. It goes on to examine the expiratory flow data with the objective of identifying COPD. The complete system including the low-cost pressure transducer and acoustic link are shown to generate waveform data identical to those generated by the expensive differential pressure transducer.
Section 4 concludes that it is possible to design and manufacture a telespirometer from “junk box” medical and electronic components that are easily available in the developing world.
2. Materials and Methods
2.1. Fleisch Pneumotachograph
There are a number of common methods that can be used to measure airflow. These include pressure differential methods used by Fleisch and Lilly (screen) pneumotachographs [30], turbines [31] and hot wire/thermistor anemometers [32,33]. A number of these were considered as possible candidates, but it was decided that the turbine option was mechanically too complex, suffered from spin-up inertia and was sensitive to dust in its bearings, while the electronics required by the hot wire method would be too difficult to calibrate. This left the Fleisch or Lilly devices as the obvious choice.
As illustrated in Figure 2, a Fleisch pneumotachograph consists of a tightly packed cluster of capillaries placed within a larger diameter breathing tube. Its operation relies on a relationship discovered by Poiseuille which is that “under capillary conditions, in a straight rigid tube, delivery is proportional to pressure loss per unit of length” [34]. In other words, the pressure drop through the capillaries, measured using a differential pressure transducer, is directly proportional to the velocity of the air flowing through them.
The Fleisch tube developed for this application needed to be made from precision capillaries easily available in a clinical environment. The obvious choice was used syringe needles that had been cleaned and sterilised. To make the prototype device, a total of N = 289 needles were stripped of their plastic attachments and tightly packed into a circular cross section with a diameter of 25 mm shown in Figure 3.
Low cost fittings, which would be available in a developing country where then used to build up the complete pneumotachograph. The Fleisch cell was mounted within a short section of PVC tubing with an ID of 25 mm, and the pressure ports that sample the air at the centre of the tube were made from modified bicycle valves to produce the assembly shown in Figure 4.
2.2. Theoretical Analysis of the Pneumotachograph
Of the total cross sectional area of 500 × 10−6 m2 of the Fleisch cell, A1 = 160 × 10−6 m2 is made up of the hollow cores of the needles (OD 1.27 mm and ID 0.838 mm) and the effective space between the needles, A2 = 133 × 10−6 m2, is calculated by subtracting the area of the cores and the walls of the needles from the total area. This makes the total capillary cross-section through which air can flow equal to A = A1 + A2 = 293 × 10−6 m2.
For a maximum flow rate of Q = 10 L/s (0.01 m3/s), the average air velocity through the capillaries can be calculated using Equation (1) to be v = 34 m/s.
For air with a density ρ = 1.2 kg/m3 and a viscosity η = 1.78 × 10⁻⁵ Ns/m2 travelling at this velocity through the needle with a diameter d = 8.38 × 10⁻⁴ m, the Reynolds number [35] Re = 1921 as calculated using Equation (2).
It can be shown that for tight packing there are about twice as many gaps as needles, so the average cross sectional area of each of the gaps is 133 × 10−6/578 = 2.3 × 10⁻⁷ m2. This makes the “effective” diameter of each 0.541 mm. Using the same formula, but the smaller effective diameter of the gaps, gives a Reynolds number of 1240.
In both cases these values are smaller than the critical Reynolds number of 2300 that defines the transition between laminar and turbulent flow in air. Therefore, the flow will remain laminar up to, and beyond, a flow rate of 10 L/s and the Poiseuille relationship can be applied.
For a single capillary tube, the Poiseuille relationship [36] can be written as
where ΔP (Pa) is the pressure drop, Q (m3/s) is the flow rate, η (Ns/m2) is the fluid viscosity, l (m) is the length of the capillary and r (m) is its inside radius.
For the two types of capillaries in parallel, of which there are N with radius r (m) and 2N with radius g (m), the pressure drop is reduced in proportion to the total number of each type
For the length of the needles, l = 0.044 m, and the values for the remaining variables as defined previously, Equation (4) reduces to
where ΔP (Pa) is the pressure drop across the Fleisch cell and Q (m3/s) is the flow rate.
2.3. Performance Assessment
To verify the linear relationship described by Equation (5), it is necessary to use a precision pressure transducer which produces a voltage output proportional to the differential pressure. For a maximum flow rate Q = 0.01 m3/s the maximum differential pressure, calculated using Equation (5) is expected to be about 1700 Pa (6.8 inH2O). However, during calibration, the differential pressure would only be a fraction of this maximum, so a more sensitive transducer with a smaller full-scale range was considered more appropriate.
The most cost effective pressure transducer available was the Omega PX163-2.5BD5V with a full scale range of +/−2.5 inH2O, a linearity of better than 1% and a response time of 1 ms. It is powered by a fixed voltage between 6 and 12 V at 20 mA, and it produces an output between 1 V and 6 V with a zero balance of 3.5 +/−0.1 V DC and a nominal sensitivity of 1 V per inH2O [37].
Rather than using one of the conventional calibration methods such as a calibrated syringe [38,39] or a Pulmonary Waveform Generator [19], a technique that could easily be used in the developing world was applied. This involved measuring the total flow volume and comparing that to the volume obtained by integrating the flow rate (from the Fleisch cell) during the same period. To measure the volume, a simple spirometer [40] was constructed using a cylindrical container, some sections of solid PVC pipe and the graduated base of a soft-drink bottle as shown in Figure 5.
The overall accuracy of the device will be affected somewhat by changes in temperature and the resulting condensation in the Fleisch cell. However, as these effects are proportional to the differential temperature between that of the expelled air and the ambient, operation in the tropics where the differential is smaller than it would be in a more temperate climate reduces the error. Measurements conducted by Miller [41] show an over-reading of 5% at an ambient temperature of 14 °C reducing to 3% at 26 °C. By extrapolation, the error will have reduced to an acceptable 2% for an ambient temperature of 32 °C.
2.4. Interfacing to a Cell Phone
The obvious method of conveying information over a conventional cell phone link is to modulate it onto the transmitted audio. Old fashioned acoustic modems designed for phone use transmit at 300 baud using frequency shift keying (FSK), and up to 2400 baud using phase shift keying (PSK). This allows them to transmit a maximum of 240 eight-bit words per second using RS232 serial.
Investigations have shown that most phones are capable of transmitting the full range of frequencies between 300 Hz and 3.4 kHz [42]. Therefore, any audio signal generated by the sensor must remain within that band, so it should be practical to transmit a continuous linear FM signal where the frequency is directly proportional to the differential pressure across the Fleisch.
This could be achieved by converting this changing differential pressure level into changes in frequency using a voltage controlled oscillator (VCO). However, differential pressure transducers with the required sensitivity and accuracy such as the PX163 described earlier in this paper, cost in excess of $200. They are also fairly fragile and easily damaged by over-pressure, so would be impractical to maintain for the proposed application.
A simple mechanical method of measuring differential pressure is to use a U-tube containing water as a manometer. It measures pressure differential, ΔP (Pa), by balancing it against the difference in height, Δh (m), of the two water columns,
where ρ = 1000 kg/m3 is the density of water and g = 9.81 m/s2 is the acceleration due to gravity.
Because the differential pressure is already measured in terms of inH2O, it is not necessary to redo this calculation. The maximum height difference between the two columns would be +/-64 mm (2.5 in) and would decrease linearly as the flow rate was reduced. A reversal in the direction of flow would just reverse the levels in the two columns.
All that is required is therefore a method to convert this changing level into a changing audio signal that can be transmitted by the cellphone. Various methods based on changes in optical properties or the conductivity of the water have been considered. However, these have been rejected as the fluid will be open to the air and hence subject to contamination, with associated changes in opacity and conductivity.
An alternative that relies on the relative permeability and permittivity of water (which are relatively insensitive to contamination [43]) would be to configure each of the arms of the manometer as the “inductive” component of a pair of transistor-based radio frequency oscillators, as shown in Figure 6. In theory, as the water level at the core of each coil changes, the permeability will change slightly, which will increase the frequency of one oscillator and decrease the frequency of the other. The beat frequency, produced by mixing the two radio frequency (RF) signals is maintained within the audio range [44] and will be indicative of the differential pressure.
From an accuracy perspective, there is an advantage to reproducing this audio signal using a loudspeaker before sending it. The forced vital capacity (FVC) measurement relies on the expulsion of lungs full of air as hard and fast as possible, therefore the patient can be asked to maximize the change in pitch of the signal output by the sensor. This audible feedback to the patient ensures that the most accurate measure possible is obtained. It also allows the operator to gauge the effectiveness of the measurement process without needing any other physical readout.
An empirical formula [45] that relates the number of turns, N, the length l (cm) and the radius a (cm) of a coil to its inductance, L (µH) is
The relative permeability of air is µr = 1.00000037 and that of pure water is hardly different at 0.999992, therefore the change in inductance when the air in the coil is replaced by water is very small. For example, a coil with a radius a = 0.4 cm, length l = 3 cm and N = 50 turns has an inductance in air of about L = 4.6 µH, and will decrease by a factor of 0.0004% when the air in the coil is replaced by water.
To achieve a relative frequency shift of 3 kHz that can be accommodated by the cell phone link would require the oscillators to operate at a nominal frequency of 375 MHz (remembering that as the frequency of the one oscillator decreases, the frequency of the other increases simultaneously). This is impractical to achieve with “junk box” components.
Fortunately a second effect also comes into play as the water level changes, and that is a change in self-capacitance, CL (F), of the coils due to the change in permittivity of the coil core [46]. This phenomenon is far more complicated to quantify, and is dependent on the direction of the electric field vector which is a function of the ratio of the coil radius, a (cm), and its length, l (cm),
where kc is determined from the ratio of the coil radius to its length
For εo = 8.854 × 10⁻¹² F/m, εair = 1 and εH2O = 80, the self-capacitance of the coil increases from 0.44 pF for an air core to 4.5 pF when it is filled with water.
As a good approximation, this capacitance can be added in parallel with the tank capacitance to determine the oscillation frequency, f (Hz)
where L (H) is the inductance of the coil, CC (F) is the capacitance of the tank capacitor, and CL (F) is the self-capacitance of the coil [45].
To achieve the same frequency shift of 3 kHz in this case requires that the oscillators operate at only 1.5 MHz which is much easier to achieve. For this calculated inductance, it can be obtained using a tank capacitor of about 2.2 nF.
It is simple to construct single transistor oscillators to operate at this low frequency using common components that are easily available in the developing world [47]. An advantage of this analogue approach is that almost any DC power source from 3 V to 12 V could be used, so the unit can be operated from a couple of torch batteries, a car battery or the cell phone USB port (if it has one). The circuit diagram for a suitable Hartley oscillator [48] is shown in Figure 7.
The combined outputs from the two RF oscillators are mixed and filtered to produce the beat frequency before being amplified using a single transistor to generate an output suitable to drive an audio amplifier or the phone, as shown in Figure 8.
In this prototype, shown in Figure 9, the manometer is made from two ballpoint pens connected by a short length of flexible tube, fifty-turn coils are wound onto each of the arms and all of the electronics are built onto a piece of Vero board. A trimmer capacitor is included as part of one of the oscillators to allow the base beat frequency to be adjusted to the correct centre frequency for transmission by the cell phone.
Initial measurements showed a much lower than expected change in frequency with change in water level, indicating a possible over estimation by the empirical Equations (8) and (9). To accommodate this, the oscillator frequency was increased to 2.3 MHz by decreasing the tank capacitors to 1 nF.
3. Results
3.1. Calibration of the Fleisch Tube
The initial evaluation and calibration of the Fleisch tube used the expensive Omega PX163 pressure transducer rather than the low cost VCO method. However once the characteristics of the pneumotachograph have been determined, it will not be necessary to run any calibration if the construction of the device remains mostly unchanged.
The analogue data output by the pressure transducer were sampled at 300 Hz and digitized using the LabJack U12 USB and the associated LJStream software running on a laptop with Windows 7. An example of the raw data provided using a bellows based inflatable-mattress pump is shown in Figure 10. In this figure, the first 1.9 s provides a zero flow reference. The following 3.1 s represents a total of 1400 mL of air flowing through the pneumotachograph and into the spirometer. Finally, during the last 1.7 s, air slowly leaks back through the pneumotachograph as the inverted soft-drink bottle starts to sink.
The raw data are filtered using a 3rd order Butterworth low-pass filter with a 10 Hz cutoff frequency. The start and end points are selected, and the filtered data are numerically integrated during that period. The filtered flow data and the integrated volume are shown in Figure 11.
The calibration constant K = 3110 mL/sec per volt can now be determined by dividing the measured volume (1400 mL) by the integrated volume (0.4502 Vs).
Calibration involved conducting 49 individual measurements using different sources of air with different flow rates, and calculating the calibration constant, K (mL/s per volt) in each case using the method described above. Care was taken to ensure that the sources of air flow were quiet and could be sustained for sufficient time to generate a reasonable volume of air. These included a bellows based inflatable-matrass pump, plunger and plunger-free pumps as well as normal breath. It was found that the plunger and plunger-free pumps could be operated over the widest flow rates extending up to 2.5 L/s while normal breathing and the matrass inflator pump could only provide continuous airflows below 0.75 L/s for the required measurement period. The results of these measurements are summarized in Figure 12.
It can be seen that there is a linear trend towards a slightly lower K for higher flow rates. This will have the effect of compressing the measured differential pressure slightly as the flow rate increases.
For the nominal differential pressure transducer scale value of 1 V per inH2O, the measured relationship between pressure and flow is obtained by dividing K by 249 Pa per inH2O, scaling for Q in m3/s and changing the subject to give
where ΔP (Pa) is the pressure drop and Q (m3/s) is the flow rate.
This value is different by a factor of only 2.1 from the theoretical result described by Equation (5), and the difference gets much smaller as K decreases at higher flow rates. It is considered to be a good match considering all of the possible sources of error in both the calculated and the measured results.
It should be noted that the overall accuracy of the calibration is not important because a ratiometric method is used to determine the likelihood of COPD, as discussed in the next section.
3.2. Comparison with a Lilly Based Spirometer
It is interesting to compare the calibration results in this paper with those obtained using a precision smart-phone based spirometer [19]. Conceptually, the two systems are similar with Zhou et al. selecting to use a commercial Lilly screen with a flow restrictor (R = 3.3 × 10⁴ Pa per m3/s) matched to the differential pressure sensor dynamic range of 0 to 500 Pa, to cater for flow rates up to 15 L/s. Whereas in this paper the Fleisch cell provided a fixed pressure drop (R = 8.01 × 10⁴ Pa per m3/s) with a differential pressure sensor +/− 2.5 inH2O (+/− 622 Pa) to cater for flow rates up to a maximum of 7.7 L/s. Both of the differential pressure transducers provided analogue outputs that could be digitized to the required precision.
The Zhou et al. system measured the analogue output with a precision of 1 mV corresponding to a pressure differential of 0.133 Pa or a flow rate of 4 mL/s, whereas our system uses the Labjack 12 bit ADC over a range of +/−5 V, corresponding to a precision of 2.4 mV (0.6 Pa) and hence a flow rate of 7.4 mL/s.
The Lilly based system provided a measured linear response for flow rates from 1 L/s up to 15 L/s whereas the Fleisch was only measured for flow rate between 0.1 and 2.5 L/s due to so a comparison is not possible.
3.3. Identifying COPD
A number of methods exist for identifying COPD [49,50]. The simplest is to plot the forced expiratory volume (FEV) as a function of time and to note the ratio of the FEV after one second to the forced vital capacity (FVC). If the ratio is less than 0.7 then the patient is probably suffering from COPD. Alternatively, changes in lung volume against flow rate, as shown in Figure 13 can be plotted and compared to the graph produced by a healthy individual [51].
Measured data generated using the Fleisch are consistent with this theoretical data as shown in Figure 14 and Figure 15. It can be seen in the first Figure that the FVC is about 5.5 litres and that the ratio FEV1/FVC varies between 0.72 and 0.78 which is on the threshold of COPD. The shape of the graph in Figure 15 confirms this diagnosis by following the shape of the COPD graph shown in Figure 13. However, the peak flow rate during expiration of between 8 and 10 L/s is almost double that of a typical COPD sufferer.
3.4. Measured Performance of the Manometer Based Pressure Transducer
The manometer is filled until the water level in both arms reaches half way up the coils. The relative levels are then adjusted by changing the air pressure in one arm using a syringe, while measuring the frequency using the FFT function on a Tektronix TDS3054 oscilloscope. The results of this measurement are shown in Figure 16.
It can be seen from Figure 16 that, because of the way the beat frequency is generated using one oscillator with an increasing frequency, and the other decreasing, there is a linear relationship between the measured frequency and differential water level over the full extent of the coil height.
3.5. The Base Station
It is likely that the base station at the clinic can afford to be a little more sophisticated than the individual pneumotachograph nodes. However, in keeping with the overall objectives of the project, it should also be simple to manufacture and be as robust as possible.
If a smartphone was available, the audio file could be saved for later processing (along with identification messages from the participants) using a call recording app such as CallRec by Qmobilsoft. An Android app. such as Radonsoft’s SpectralPro Analyzer [52] could then be used to generate a spectrogram. However, if this capability is not available then an alternative method of storing the data and producing a graphical output is required.
3.6. Measured System Performance
The link performance is obtained by integrating all of the components of the complete telespirometer, as shown in Figure 17, and transmitting the signal containing a sequence of forced expiratory breaths.
The proposed operational procedure is as follows:
- The liquid in the manometer is topped up (or ideally replaced) so that the levels are half way up the coils.
- A phone conversation is initiated between the remote monitor and the base station, where it is recorded.
- The patient is identified by name and village/district.
- The unit is turned on and calibrated by tipping it forward until the generated tone reaches a maximum, and then backward until it reaches a minimum.
- The unit is then clamped in a level position to ensure that changes in water level are only caused by airflow.
- The patient takes a deep breath and then expels it through the pneumotachograph mouthpiece.
- This is repeated a number of times until the monitor is satisfied that good data have been produced.
- The phone conversation is ended.
- The mouthpiece is sterilized to be ready for the next patient.
To demonstrate the proof of principle, the smartphone (or laptop in this case) software application initially processes the stored audio signal through a filter with a pass band between 500 and 1500 Hz, to remove low frequency noise and harmonics. The signal spectrum is then obtained using the MATLAB function to generate a spectrogram, a portion of which is shown in Figure 18.
A row by row search finds and generates a vector of all of the peaks within the spectrogram. These are filtered using a 3rd order Butterworth filter with a cutoff frequency of 15 Hz to produce an estimate of the signal frequency as a function of time, as shown in Figure 19. It can be seen that the base frequency is about 730 Hz and increases to about 1.2 kHz during forced exhalation. On inhalation it reduces to just below 700 Hz.
Metrics, based on the expected flow rates for normal and COPD sufferers, identify waveforms within the sequence with the appropriate profiles, and these are earmarked for further processing.
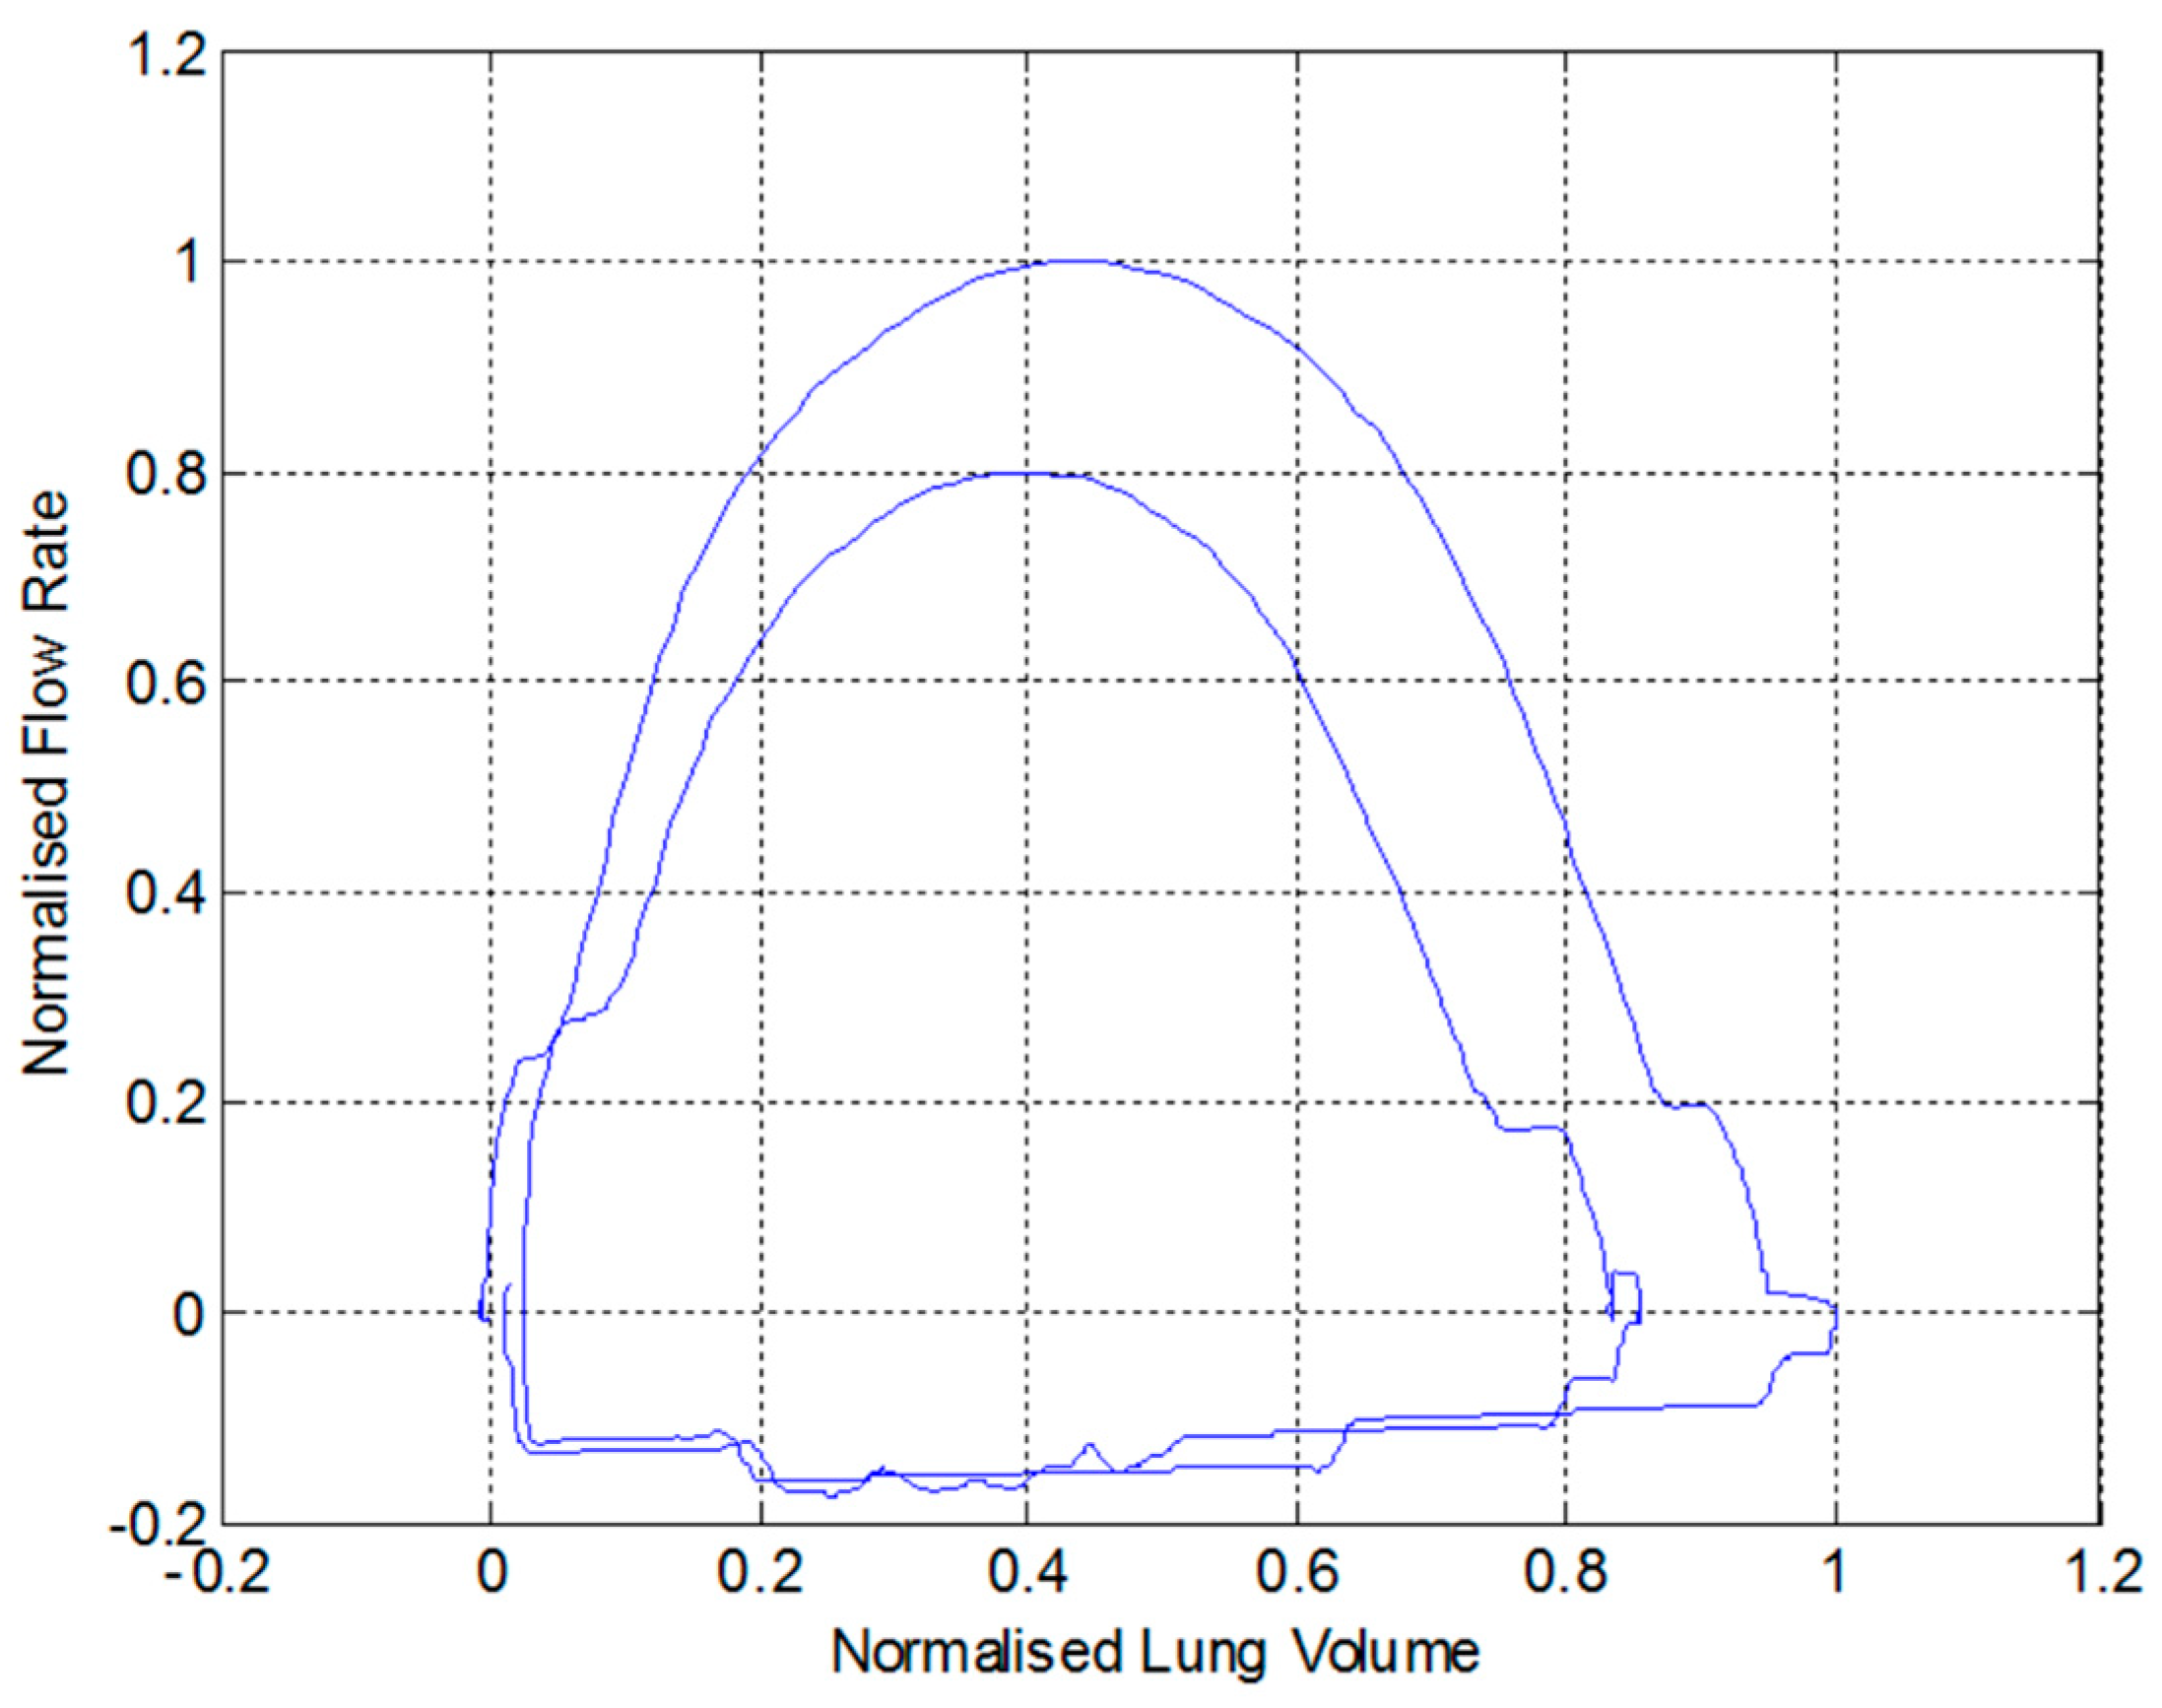
Finally, the earmarked portion of the signal is calibrated and integrated as a function of time to produce an estimate of the forced expiratory volume, as shown in Figure 20, and a measure of flow rate as a function of volume, as shown in Figure 21. These outputs are then used by the nurse or doctor to perform a diagnosis regarding whether the patient is suffering from COPD, or any other respiratory problem such as asthma.
The quality of these outputs produced from the recorded audio generated by the low-cost sensor should be compared to the graphs in Figure 14 and Figure 15 which show similar data measured using the expensive Omega PX163 differential pressure transducer and logged with the expensive Labjack digitizer.
4. Conclusions
This paper has shown that it is possible to design and manufacture a telespirometer from medical and electronic components that are easily available in the developing world. The Fleisch pneumotachograph is assembled from syringe needles, and a very sensitive pressure-to-frequency converter has been made using “junk box” electronic components, some insulated wire, bits of pipe and a couple of ballpoint pens.
Calibration of the Fleisch cell using a precision differential pressure transducer produced measured results accurate to within a factor of 2.1 of those determined by the theoretical analysis which is considered to be extremely good given all of the approximations made in the analysis.
Experimental results confirm that expiratory flow data produced by the sensor is converted to a frequency modulated audio signal which can be reliably transmitted via cellphone to a base station where a simple smartphone or laptop application can be used to reconstruct the data in a graphical form for medical diagnosis of COPD.
It is felt that this approach of providing a “blueprint” rather than a device would encourage ownership, and hopefully facilitate further development of the device by local stakeholders.
Funding
This research received no external funding.
Acknowledgments
I would like to acknowledge the work done by Chris Larkin who, as an undergrad student, built the Fleisch-cell and the spirometer and ran the calibrations.
Conflicts of Interest
The author declares no conflict of interest.
References
- Wootton, R.; Bonnardot, L. In what circumstances is telemedicine appropriate in the developing world? J. R. Soc. Med. (JSRM) 2010, 1, 37. [Google Scholar] [CrossRef] [PubMed]
- Bristol, N. Are Cell Phones Leading the mHealth Revolution? Global Health. 2009. Available online: http://globalmd.org/c/journal_articles/view_article_content?articleId=225&version=1.0 (accessed on 5 February 2020).
- Wootton, R. (Ed.) Telehealth in the Developing World; Royal Society of Medicine Press Ltd. & International Development Research Centre: London, UK, 2009. [Google Scholar]
- Hersh, W.; Margolis, A.; Quiros, F.; Otero, P. Building a Health Informatics Workforce in Developing Countrires. Health Aff. 2010, 29, 274–277. [Google Scholar] [CrossRef] [PubMed]
- ITU. 2011. Available online: https://www.itu.int/en/ITU-D/Statistics/Pages/stat/default.aspx (accessed on 5 February 2020).
- Hernandez, C.; Mallow, J.; Narsavage, G. Delivering telemedicineinterventions in chronicrespiratory disease. Breathe 2014, 10, 199–212. [Google Scholar] [CrossRef] [Green Version]
- Lane, N.D.; Miluzzo, E.; Hong, L.; Peebles, D.; Choudhury, T.; Campbell, A.T. A survey of mobile phone sensing. IEEE Commun. Mag. 2010, 48, 140–150. [Google Scholar] [CrossRef]
- Crilly, P.; Muthukkumarasamy, V. Using smart phones and body sensors to deliver pervasive mobile personal healthcare. In Proceedings of the 2010 Sixth International Conference on Intelligent Sensors, Sensor Networks and Information Processing, Brisbane, Australia, 7–10 December 2010; pp. 291–296. [Google Scholar]
- Pantelopoulos, A.; Bourbakis, N.G. A Survey on Wearable Sensor-Based Systems for Health Monitoring and Prognosis. IEEE Trans. Syst. Man Cybern. Part C Appl. Rev. 2010, 40, 1–12. [Google Scholar] [CrossRef] [Green Version]
- Wei, J.; Hollin, I.; Kachnowski, S. A review of the use of mobile phone text messaging in clinical and healthy behaviour interventions. J. Telemed. Telecare 2010, 17, 41–48. [Google Scholar] [CrossRef] [PubMed]
- Burgos, F.; Disdier, C.; deSantamaria, E.; Galdiz, B.; Roger, N.; Rivera, M.; Hervàs, R.; Durán-Tauleria, E.; Garcia-Aymerich, J.; Roca, J.; et al. Telemedicine enhances quality of forced spirometry in primary care. Eur. Respir. J. 2012, 39, 1313–1318. [Google Scholar] [CrossRef] [Green Version]
- Brennan, T. Integrating Low-Cost Sensors with Mobile Phones for Remote Monitoring of Long-Term Condition in Resource Constrained Environments. In Proceedings of the International Biomedical and Bioelectronics Workshop, Sydney, Australia, 22–24 August 2011. [Google Scholar]
- Benlamri, R.; Docksteader, L. MORF: A Mobile Health-Monitoring Platform. IT Prof. 2010, 12, 18–25. [Google Scholar] [CrossRef]
- Tzu-Hao, Y.; Hsing-Fang, T.; Sih-Yin, L.; Ching-Shuen, C.; Shih-Tsang, T.; Jiun-Hung, L. Portable oximeter for acute mountain sickness. In Proceedings of the 2010 International Conference on Electronics and Information Engineering (ICEIE), Kyoto, Japan, 1–3 August 2010. [Google Scholar]
- Reeder, B.; David, A. Health at hand: A systematic review of smart watch uses for health and wellness. J. Biomed. Inform. 2016, 63, 269–276. [Google Scholar] [CrossRef]
- Ong, J. Medical Detection and Diagnosis with Smartwatches. Smartwatch News. 2019. Available online: https://www.smartwatches4u.com/medical-detection-and-diagnosis/ (accessed on 20 December 2019).
- Nosta, J. A Smart Device, Ultrasound, and Telemedicine Combine to Drive a New Level of Collaboration and Care. Forbes. 26 March 2018. Available online: https://www.forbes.com/sites/johnnosta/2018/03/26/a-smart-device-ultrasound-and-telemedicine-combine-to-drive-a-new-level-of-collaboration-and-care/#7d2772f83a2c (accessed on 20 December 2019).
- Larson, E.; Goel, M.; Redfield, M.; Boriello, G.; Rosenfeld, M.; Patel, S. Tracking Lung Function on any Phone. In Proceedings of the DEV’13, Bangalore, India, 11–12 January 2013. [Google Scholar]
- Zhou, P.; Yang, L.; Huang, Y.-X. A Smart Phone Based Handheld Wireless Spirometer with Functions and Precision Comparable to Laboratory Spirometers. Sensors 2019, 19, 2487. [Google Scholar] [CrossRef] [Green Version]
- Wootton, R. Telemedicine support for the developing world. J. Telemed. Telecare 2008, 2008, 109–114. [Google Scholar] [CrossRef] [PubMed]
- Shak, H.; Nordyke, B. 2004 COPD: Consequences of an Underrecognised Disease. Managed Healthcare Executive. Available online: http://managedhealthcareexecutive.modernmedicine.com (accessed on 20 December 2019).
- vanGemert, F.; vanderMolen, T.; Jones, R.; Chavannes, N. The impact of asthma and COPD in sub-Saharan Africa. Prim. Care Respir. J. 2011, 20, 240–248. [Google Scholar] [CrossRef] [PubMed]
- Bruderman, I.; Abboud, S. Telespirometry: Novel System for Home Monitoring of Asthmatic Patients. Telemed. J. 1997, 3, 127–133. [Google Scholar] [CrossRef] [PubMed]
- Jannett, T.C.; Prashanth, S.; Mishra, S.; Ved, V.; Mangalvedhekar, A.; Deshpande, J. An intelligent telemedicine system for remote spirometric monitoring. In Proceedings of the Thirty-Fourth Southeastern Symposium on System Theory (Cat. No.02EX540), Huntsville, AL, USA, 19 March 2002; pp. 53–56. [Google Scholar]
- Polisena, J.; Tran, K.; Cimon, K.; Hutton, B.; McGill, S.; Palmer, K.; Scott, R.E. Home telehealth for chronic obstructive pulmonary disease: A systematic review and meta-analysis. J. Telemed. Telecare 2010, 16, 120–127. [Google Scholar] [CrossRef]
- Arne, M.; Lisspers, K.; Stallberg, B.; Boman, G.; Hedenstrom, H.; Janson, C.; Emtner, M. How often is diagnosis of COPD confirmed with spirometry? Respir. Med. 2010, 104, 550–556. [Google Scholar] [CrossRef] [Green Version]
- Minas, M.; Hatzoglou, C.; Karetsi, E.; Papaooannou, A.; Tanou, K.; Tsaroucha, R.; Gogou, E.; Gourgoulianis, K.I.; Kostikas, K. COPD prevalence and the differences between newly and previously diagnosed COPD patients in a spirometry program. Prim. Care Respir. J. 2010, 19, 363–370. [Google Scholar] [CrossRef]
- Barnes, T.; Fromer, L. Spirometry use: Detection of chronic obstructive pulmonary disease in the primary care setting. Clin. Interv. Aging 2011, 6, 47–52. [Google Scholar] [CrossRef] [Green Version]
- Mukherjee, R.; Moore, V.; Purkait, S.; Goon, P.; Warburton, C.; Chakrabarti, B.; Calverley, P.M.A. Feasibility of performing valid spirometry in rural India: Preliminary results from a population study assessing the prevalence of COPD. Thorax 2010, 65. [Google Scholar] [CrossRef] [Green Version]
- Keller, J. Viscous flow through a grating or lattice of cylinders. J. Fluid Mech. 1963, 18, 94–96. [Google Scholar] [CrossRef]
- Malmberg, L.; Hedman, J.; Sovijarvi, A. Accuracy and repeatability of a pocket turbine spirometer: Comparison with a rolling seal flow-volume spirometer. Clin. Physiol. 1993, 13, 89–98. [Google Scholar] [CrossRef]
- Hughes, T. Hot Thermistor Spirometry for the Artificial Ventilation of Students. Ph.D. Thesis, University of Cape Town, Cape Town, South Africa, 1981. [Google Scholar]
- Araujo, G.A.L.; Freire, R.C.S.; Silva, J.F.; Oliveira, A.; Jaguaribe, E.F. Breathing flow measurement with constant temperature hot-wire anemometer for forced oscillations technique. In Proceedings of the 21st IEEE Instrumentation and Measurement Technology Conference (IEEE Cat. No.04CH37510), Como, Italy, 18–20 May 2004; pp. 730–733. [Google Scholar]
- Sutera, S.; Skalak, R. The History of Poiseuille’s Law. Annu. Rev. Fluid Mech. 1993, 25, 1–19. [Google Scholar] [CrossRef]
- Reynolds, O. An experimental investigation of the circumstances which determine whether the motion of water shall be direct or sinuous, and the law of resistance in parallel channels. Philos. Trans. R. Soc. 1883, 174, 935–982. [Google Scholar]
- Pfitzner, J. Poiseuille and his law. Anaesthesia 1976, 31, 273–275. [Google Scholar] [CrossRef] [PubMed]
- Omega. Differential Pressure Transducers. 2011. Available online: https://www.omega.nl/pressure/pdf/PX160.pdf (accessed on 20 December 2019).
- Tang, Y.; Turner, M.; Yem, J.; Baker, B. Calibration of pneumotachographs using a calibrated syringe. J. Appl. Physiol. 2003, 95, 571–576. [Google Scholar] [CrossRef] [Green Version]
- Johns, D.; Pierce, R. McGraw-Hill’s Pocket Guide to Spirometry; McGraw-Hill: Tokyo, Japan, 2003. [Google Scholar]
- Miller, M. Chronic obstructive pulmonary disease and ‘150 years of blowing’. Hosp. Med. 1998, 59, 719–722. [Google Scholar]
- Miller, M.; Sigsgaard, T. Prevention of thermal and condensation errors in pheumatachographic recordings of the maximal forced expiratory manoeuvre. Eur. Respir. J. 1994, 7, 198–201. [Google Scholar] [CrossRef]
- Rohde&Schwarz. Application Note: Acoustic Measurements on GSM Mobile Phones with Audio Analyzer UPL and Digital Radiocommunication Tester CMD. 2010. Available online: http://www2.rohde-schwarz.com/file_1158/1ga39_0e.pdf (accessed on 20 December 2019).
- Schultz, S. Calibration of Permittivity Sensors to Measure Contaminants in Water and Biodiesel Fuel. Ph.D. Thesis, Department of Biological and Agricultural Engineering, Kansas State University, Manhattan, KS, USA, 2009. [Google Scholar]
- Oliver, B.; Cage, J. Electronic Measurements and Instrumentation; McGraw-Hill Kogakusha, Ltd.: Tokyo, Japan, 1971; pp. 340–342. [Google Scholar]
- Woodward, G. (Ed.) The Radio Amateur’s Handbook; American Radio Relay League: Newington, CT, USA, 1982. [Google Scholar]
- Knight, D. The Self-Resonance and Self-Capacitance of Solenoid Coils. 2010. Available online: http://www.g3ynh.info/zdocs/magnetics/appendix/self-res.html (accessed on 20 December 2019).
- Millman, J.; Halkias, C. Integrated Electronics; McGraw-Hill Kogakusha, Ltd.: Tokyo, Japan, 1972; pp. 490–492. [Google Scholar]
- Hartley, R. Oscillation Generator. U.S. Patent 3,147,615, 1 June 1915. [Google Scholar]
- Nathell, L.; Nathell, M.; Malmberg, P.; Larsson, K. COPD diagnosis related to different guidelines and spirometry techniques. Respir. Res. 2007, 8, 1–7. [Google Scholar] [CrossRef] [Green Version]
- Hamid, Q.; Shannon, J.; Martin, J. Physiologic Basis of Respiratory Disease; BC Becker Inc.: Hamilton, ON, Canada, 2005. [Google Scholar]
- Bellamy, D.; Booker, R. Chronic Obstructive Pulmonary Disease in Primary Care, 3rd ed.; Class Publishing: London, UK, 2004. [Google Scholar]
- RadonSoft. Spectral Pro Analyzer. Available online: https://play.google.com/store/apps/details?id=radonsoft.net.spectralviewpro&hl=en (accessed on 20 December 2019).
Figure 1.
Cellular penetration showing the dramatic increase in developing countries over the last decade, adapted from [5].
Figure 1.
Cellular penetration showing the dramatic increase in developing countries over the last decade, adapted from [5].
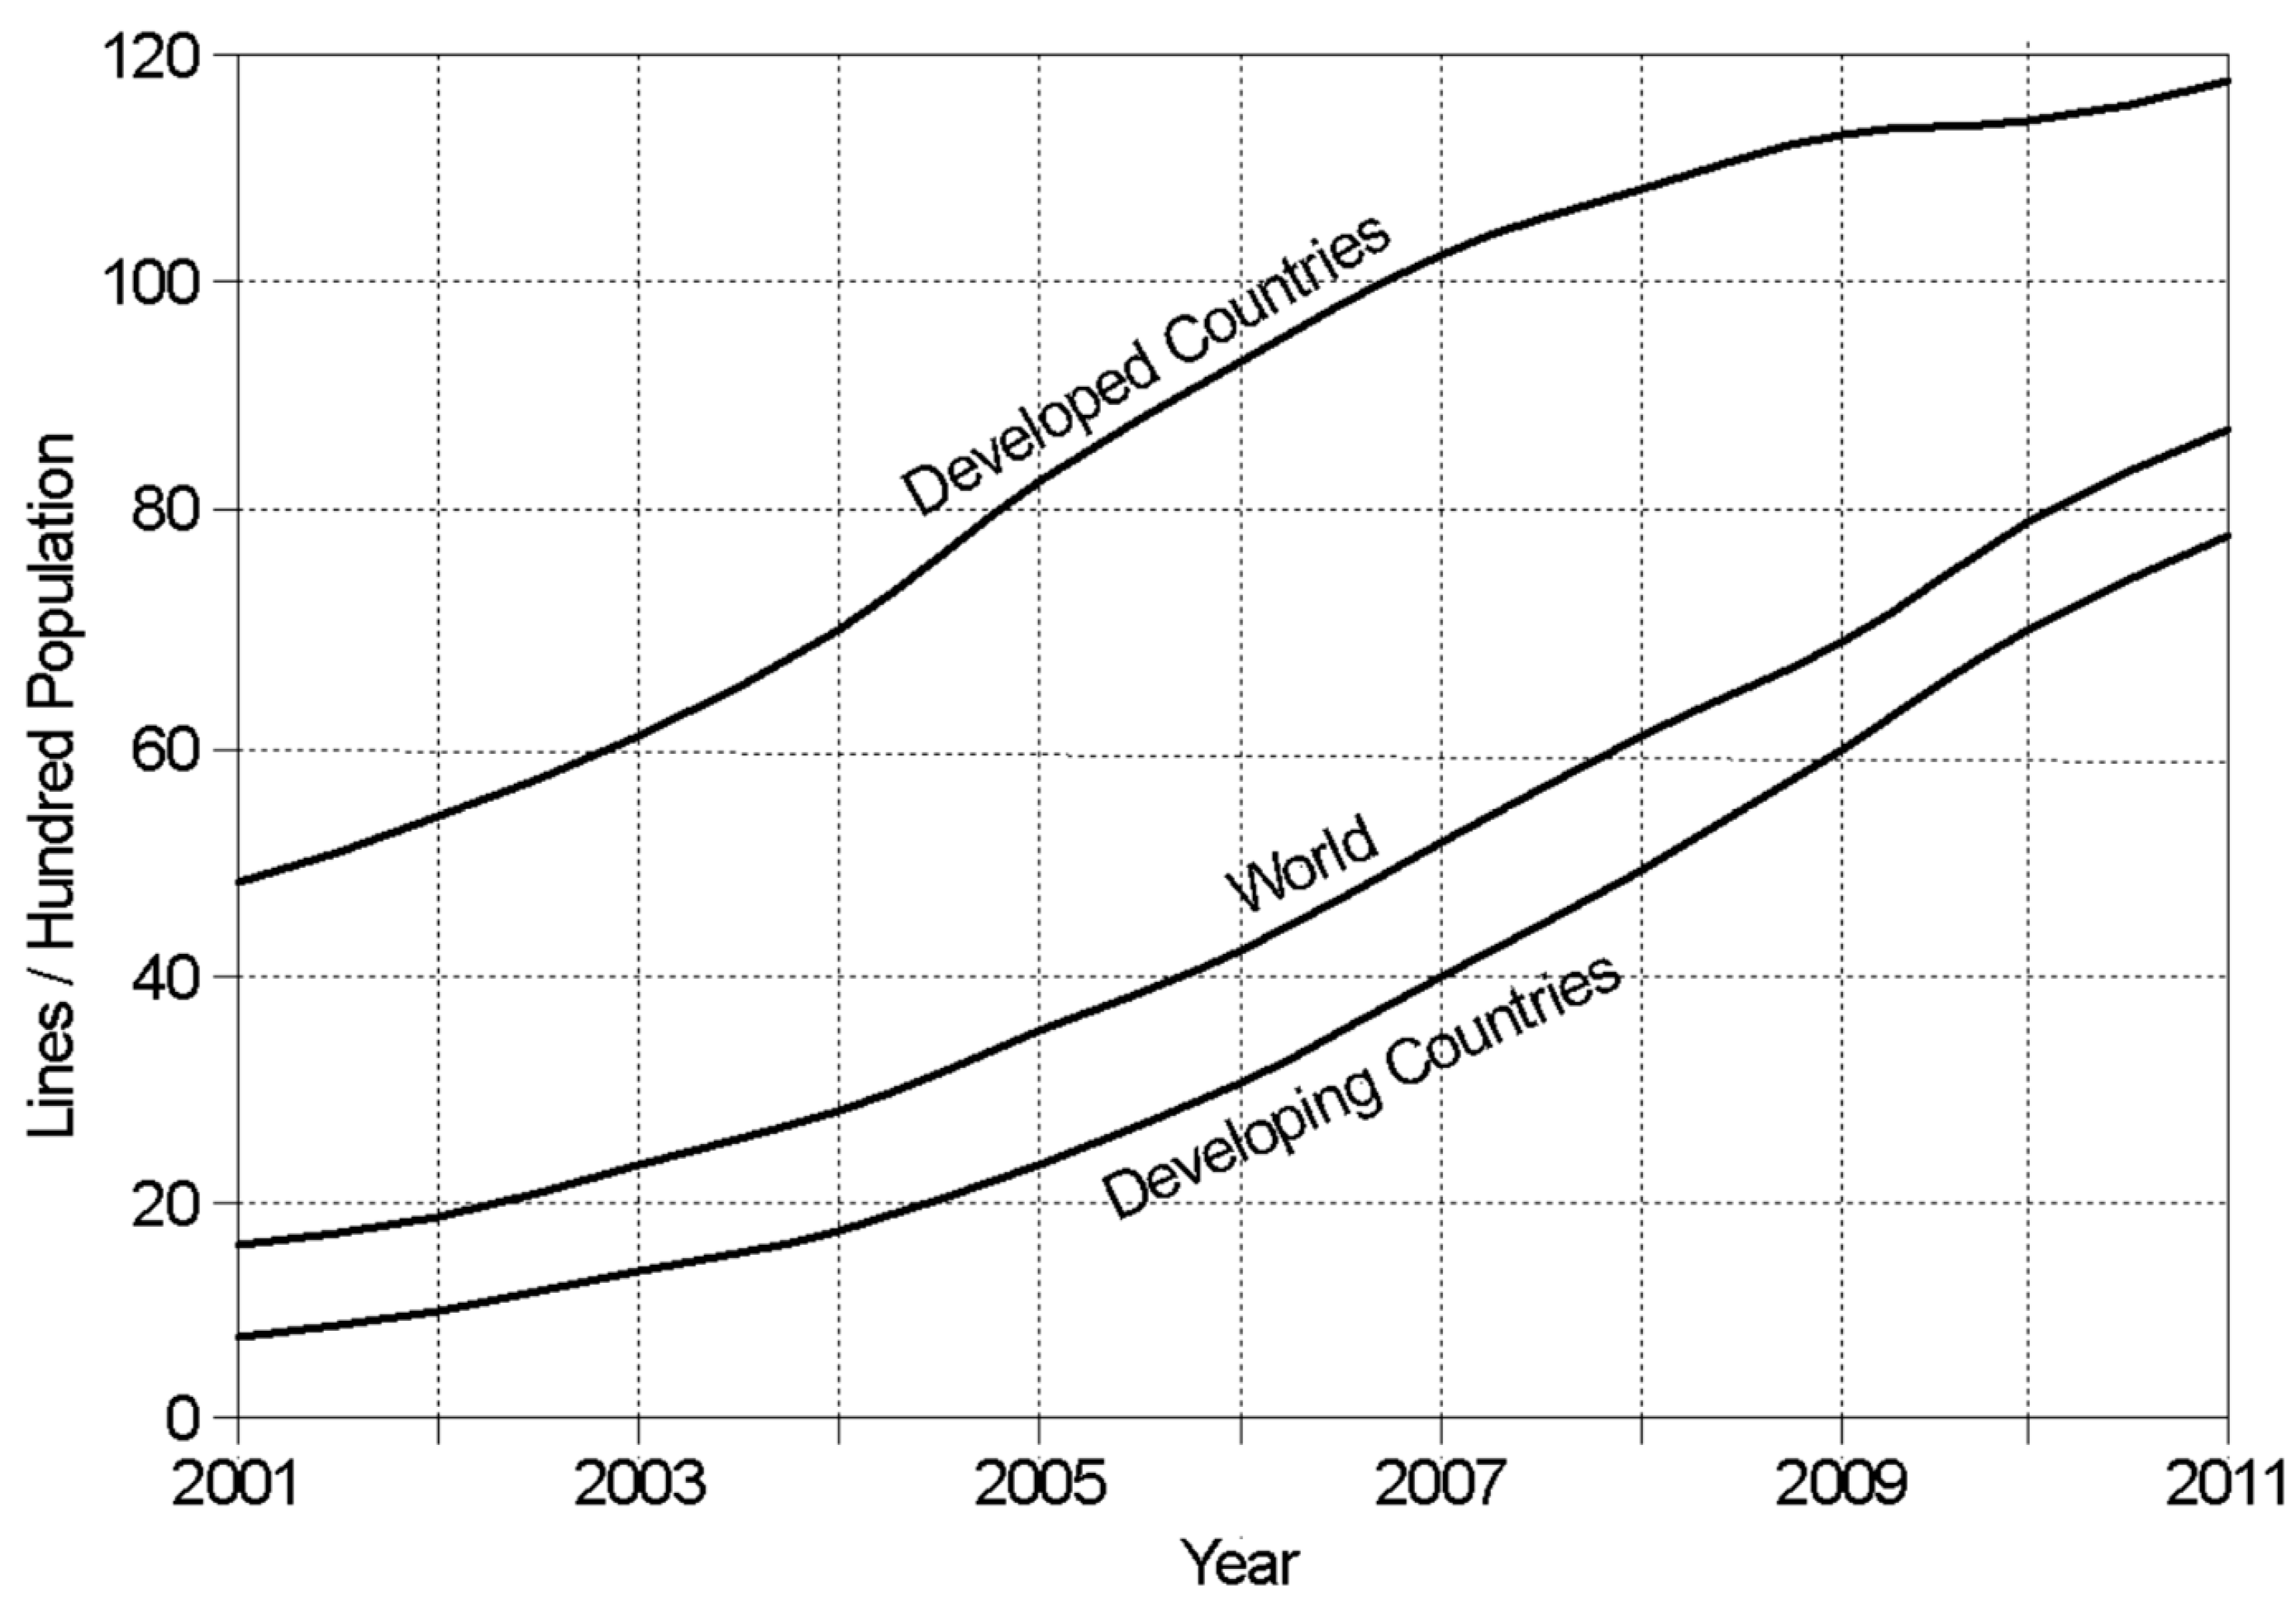
Figure 2.
Drawing of a Fleisch pneumotachograph showing the individual components.
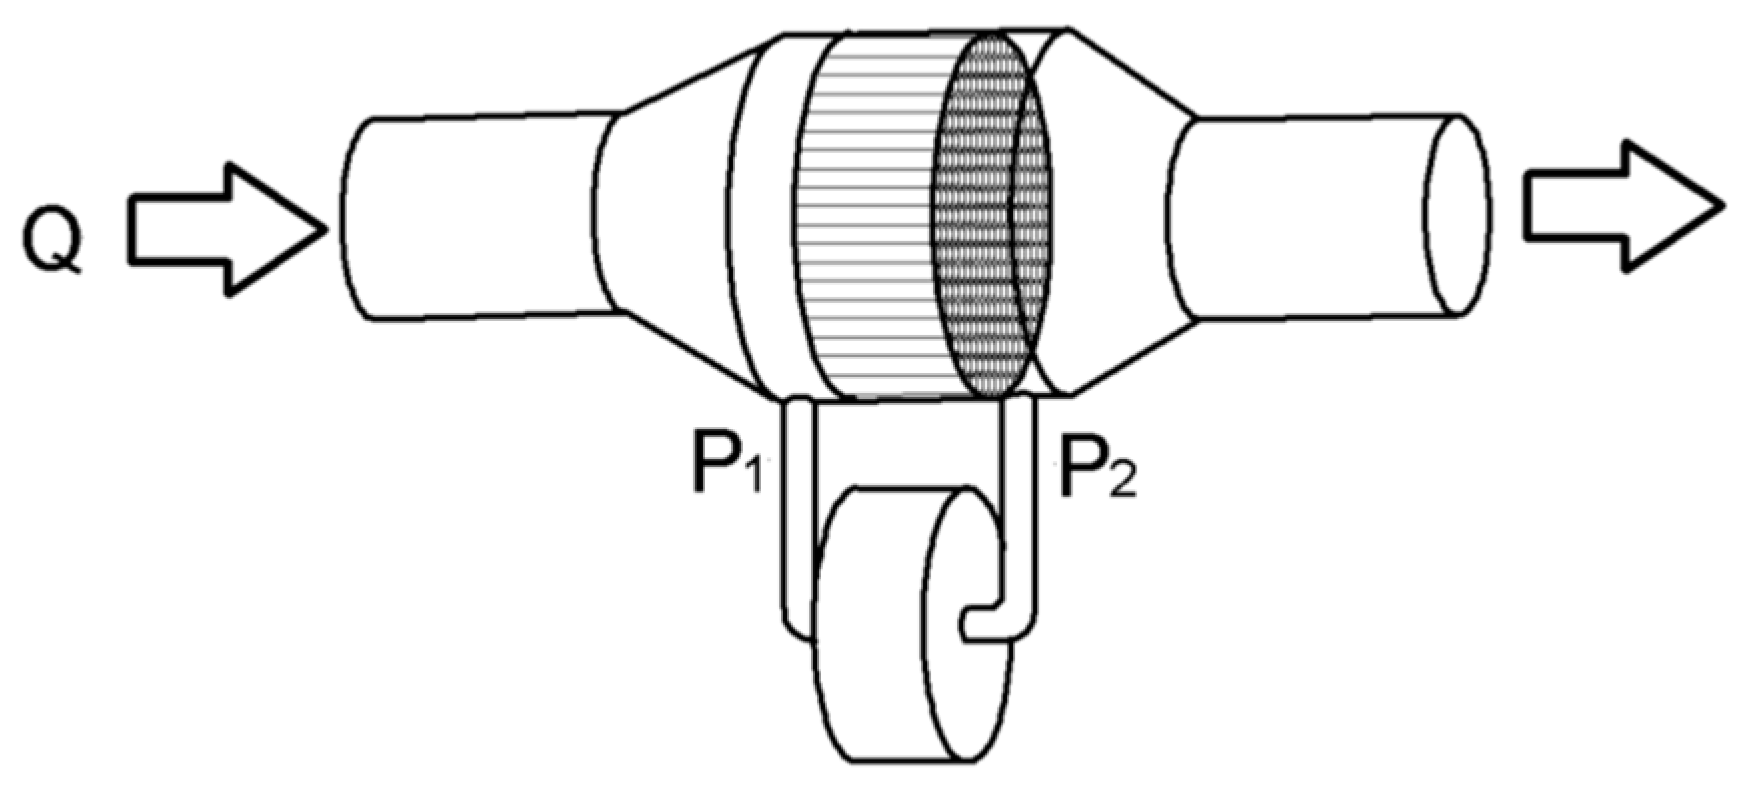
Figure 3.
Photograph showing 289 syringe needles packed into a circular tube.
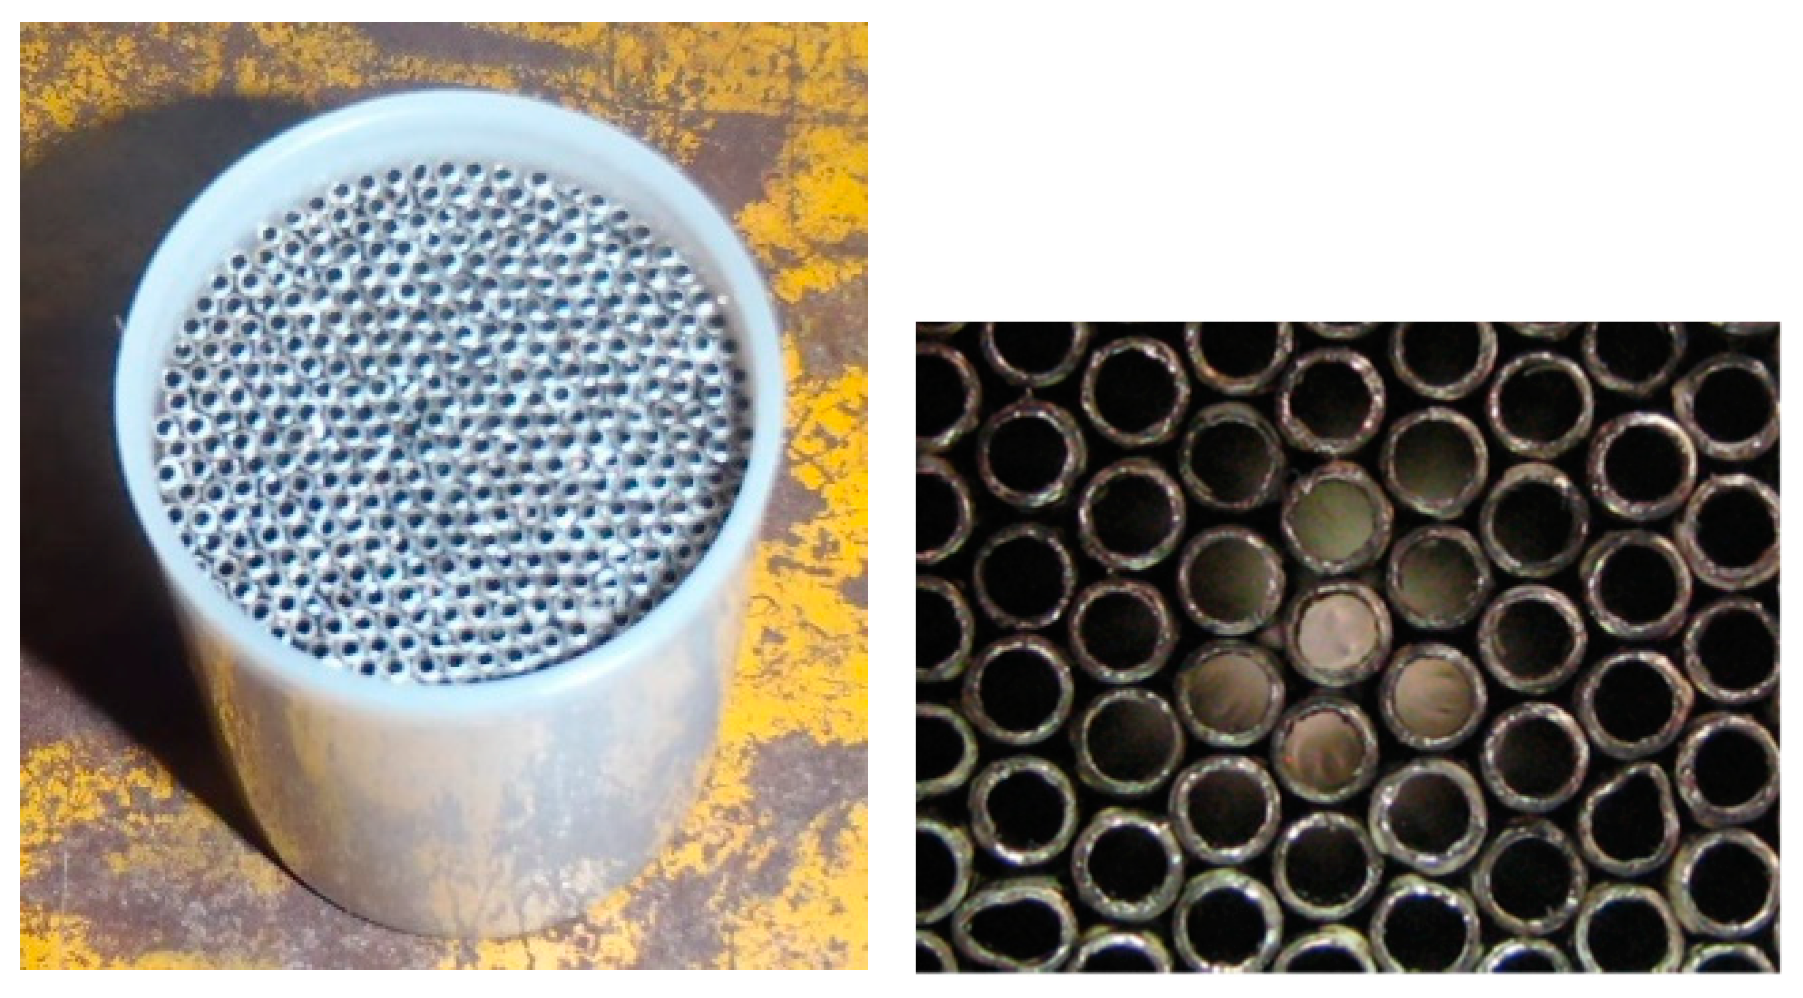
Figure 4.
Photograph showing the complete Fleisch pneumotachograph.

Figure 5.
Photograph showing the easy-to-construct spirometer.
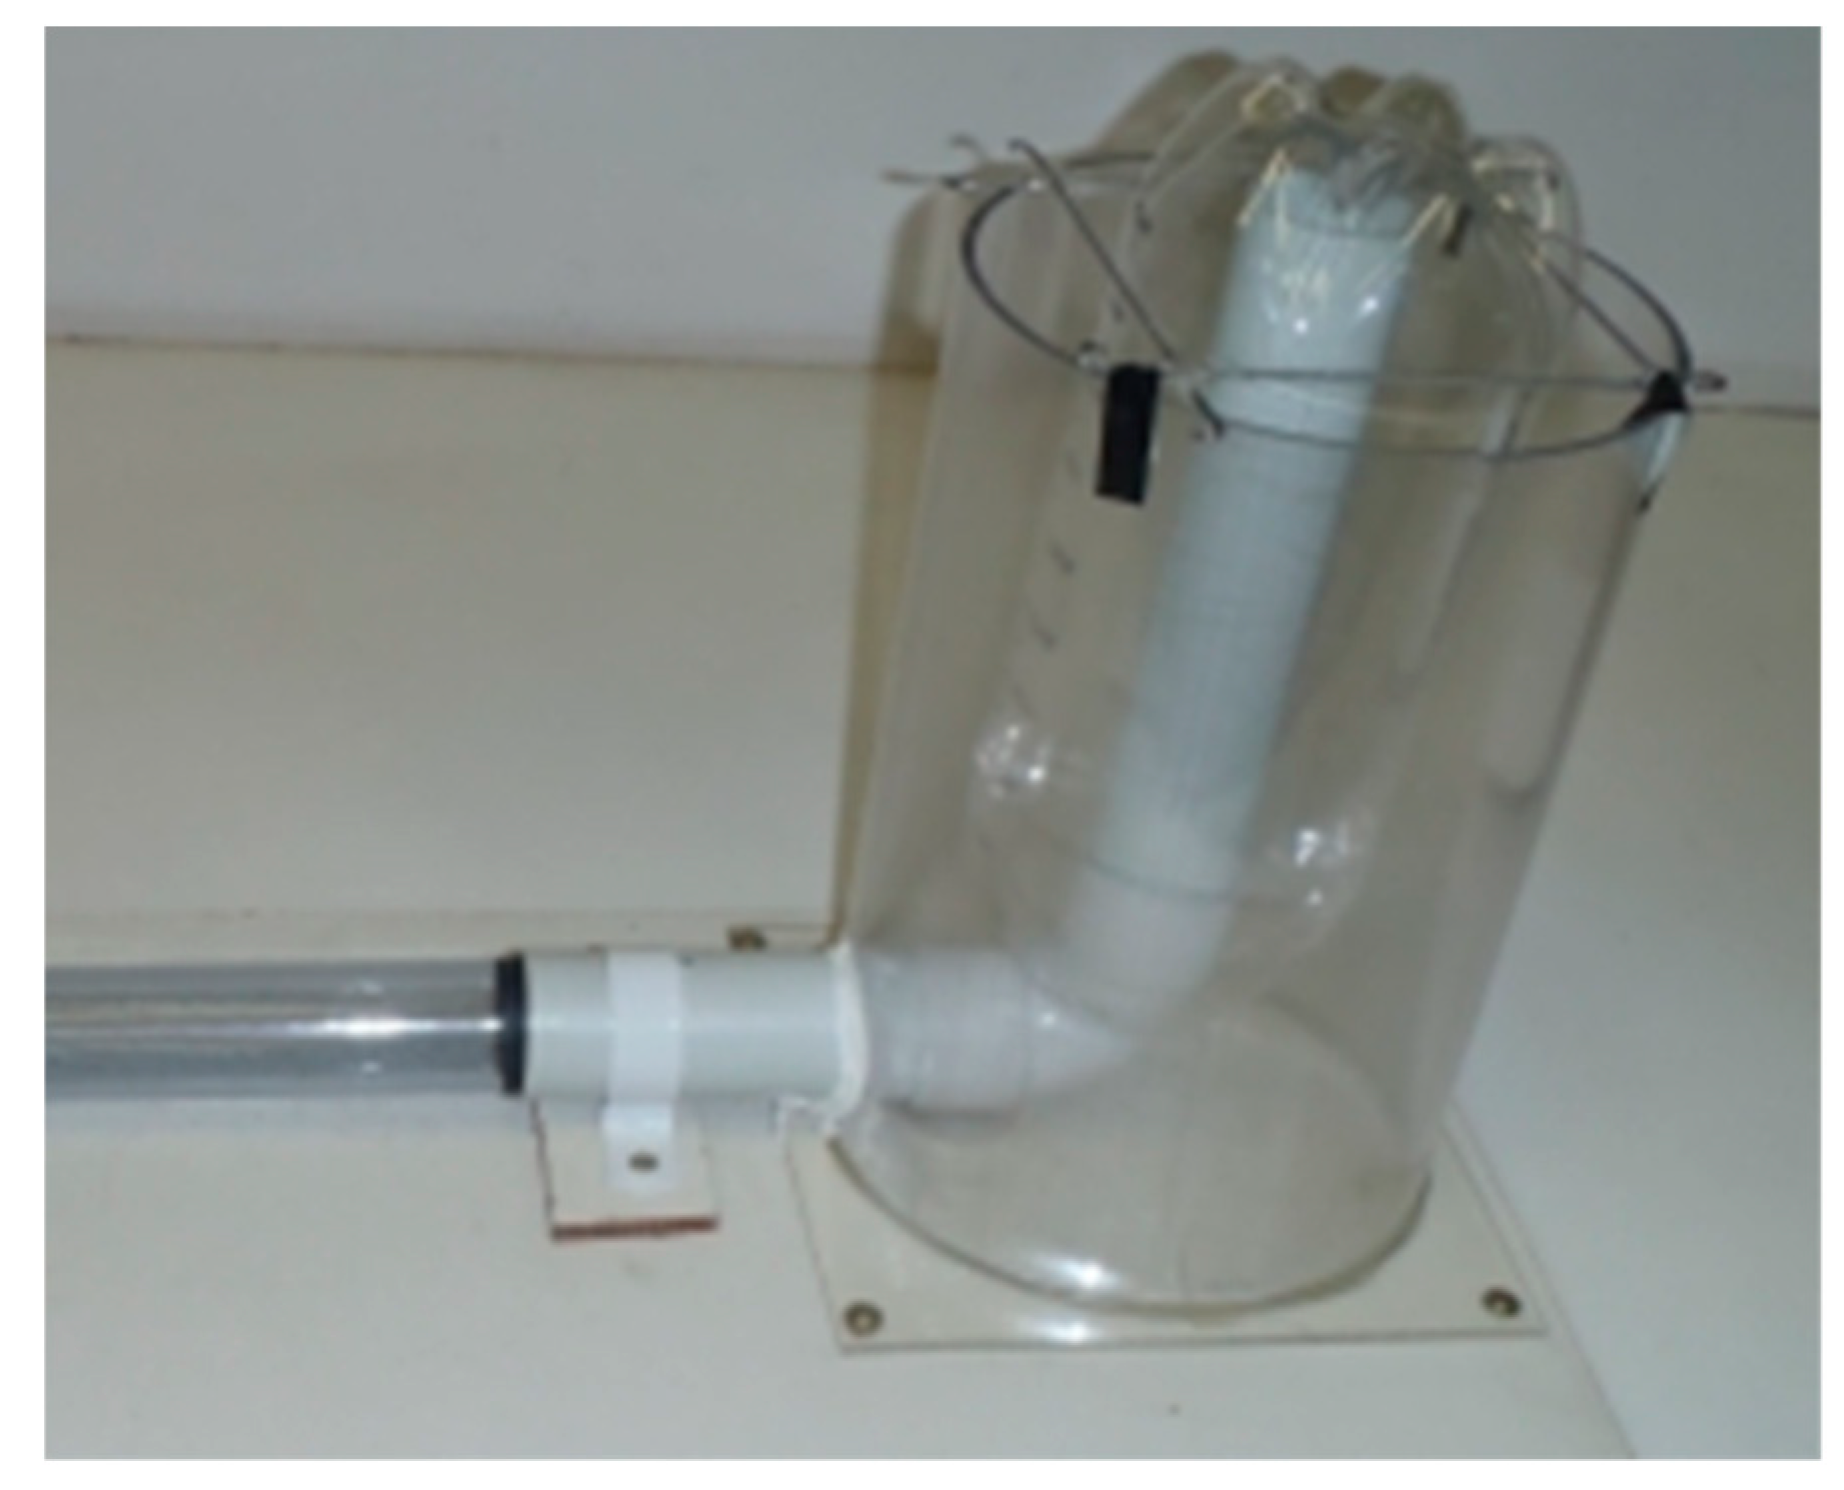
Figure 6.
Conceptual diagram of a beat frequency oscillator based audio generator.
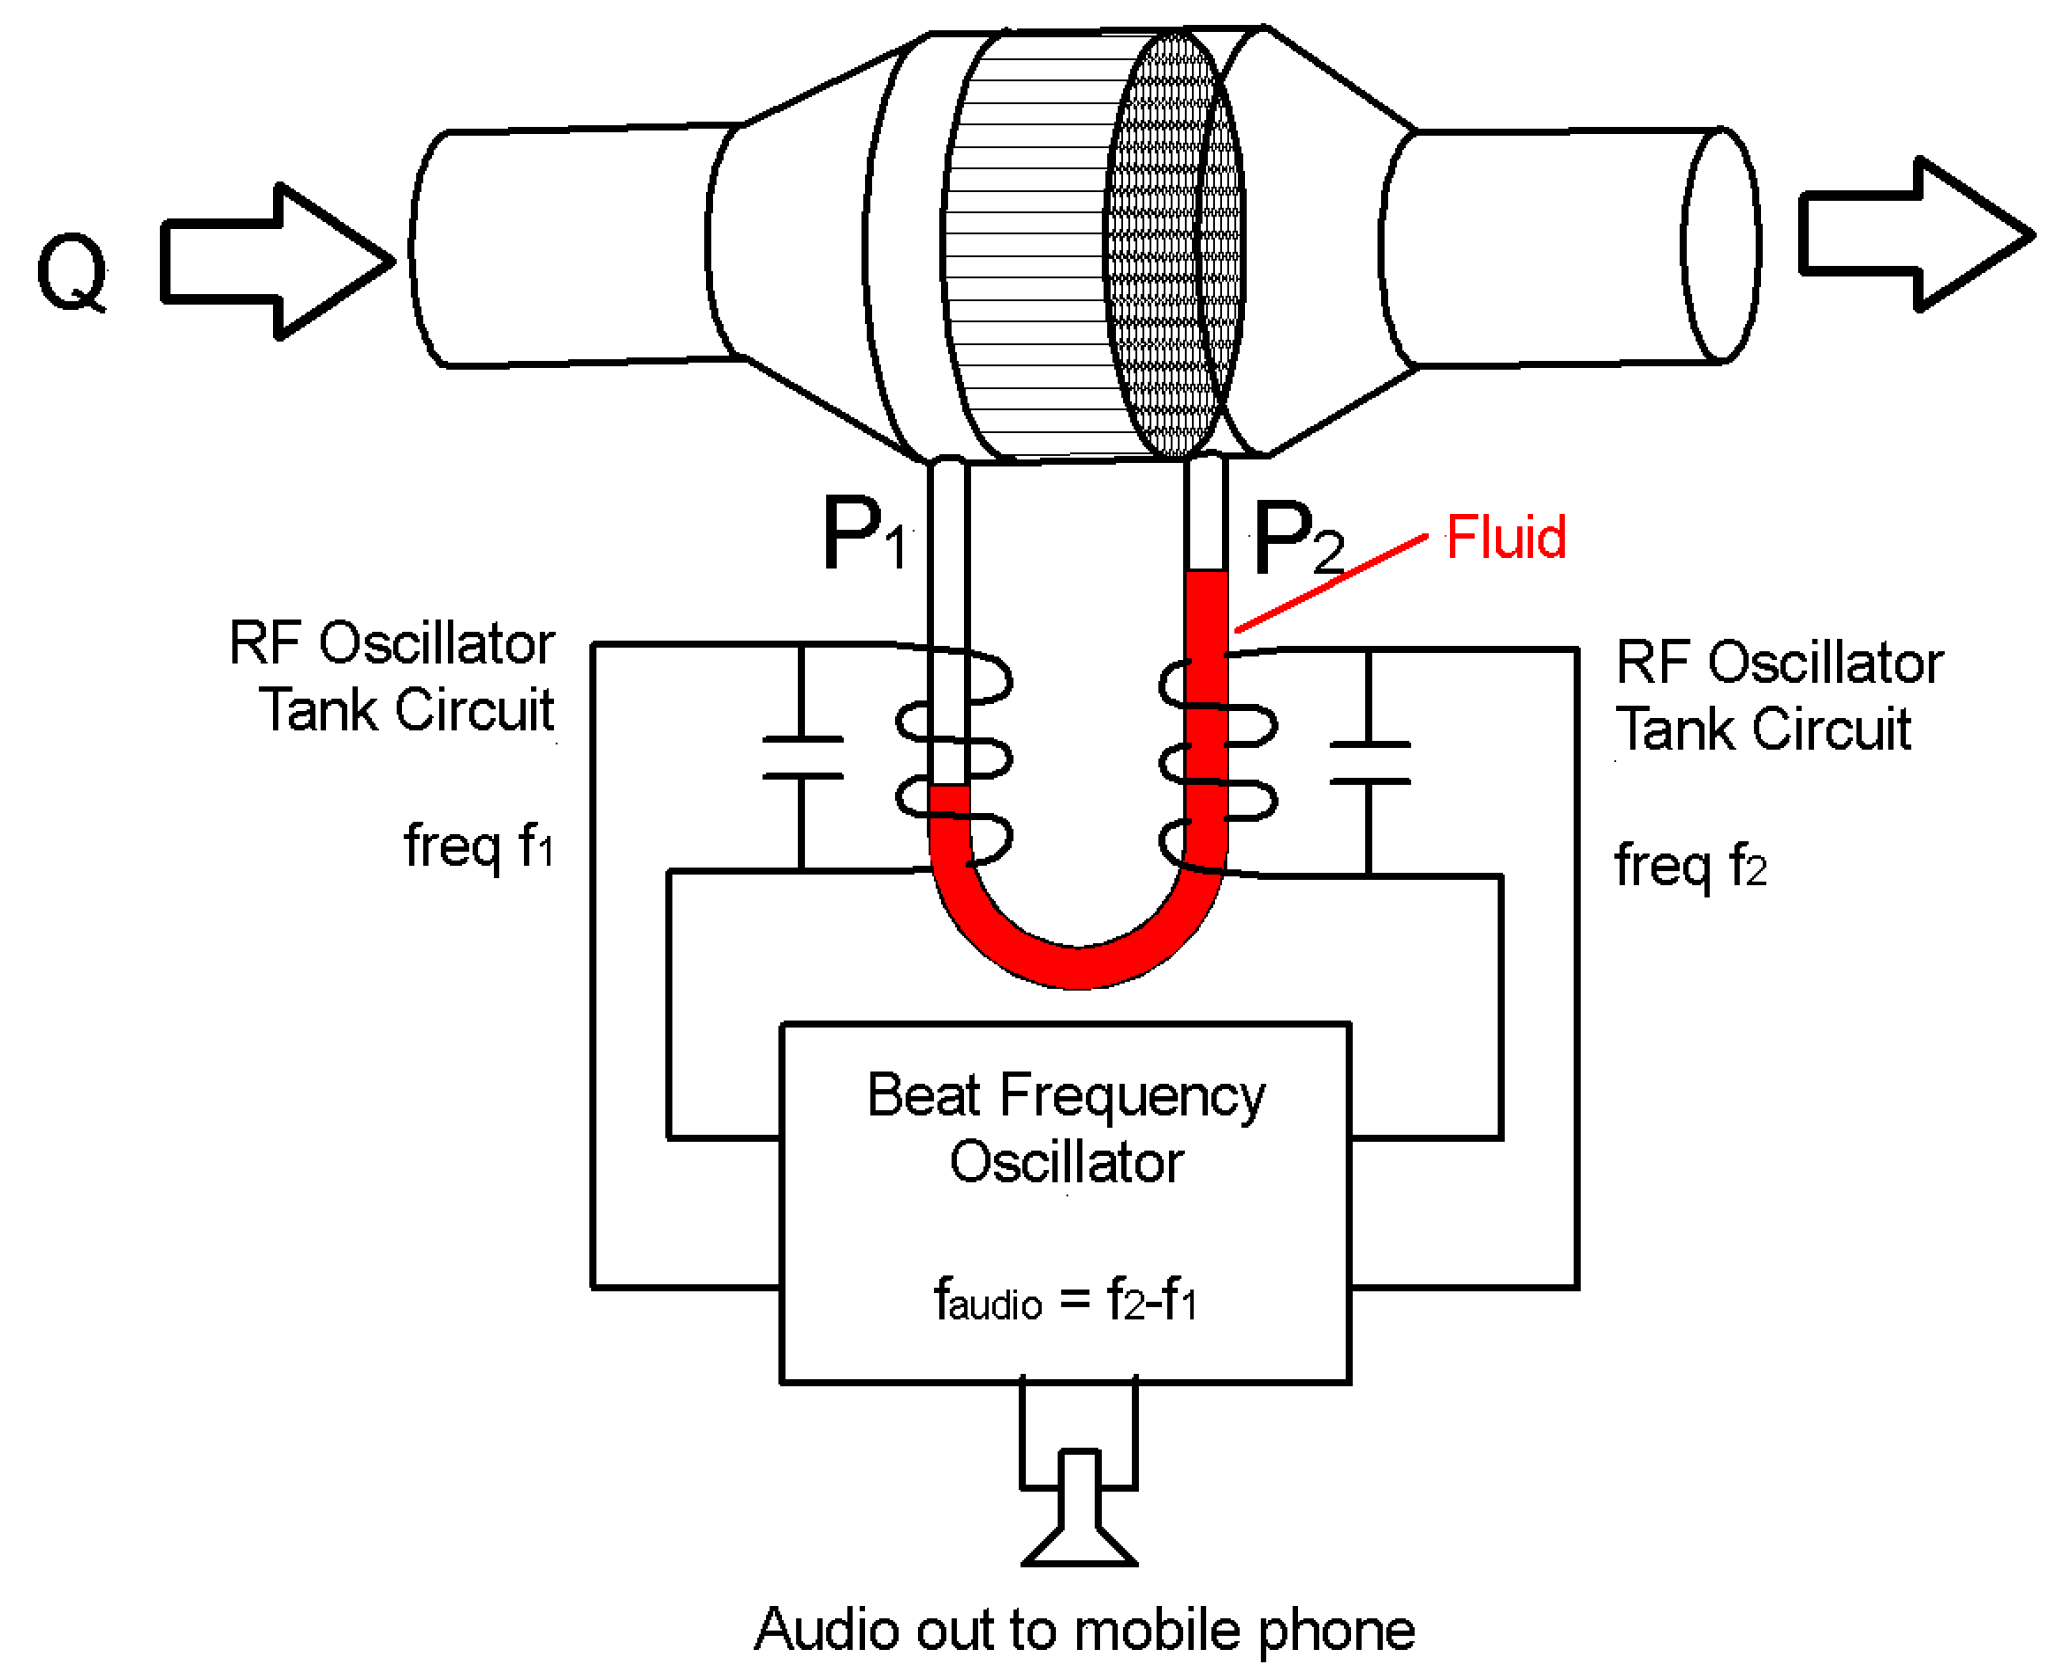
Figure 7.
Hartley radio frequency (RF) oscillator circuit diagram.

Figure 8.
Mixer, filter and buffer circuit diagram.
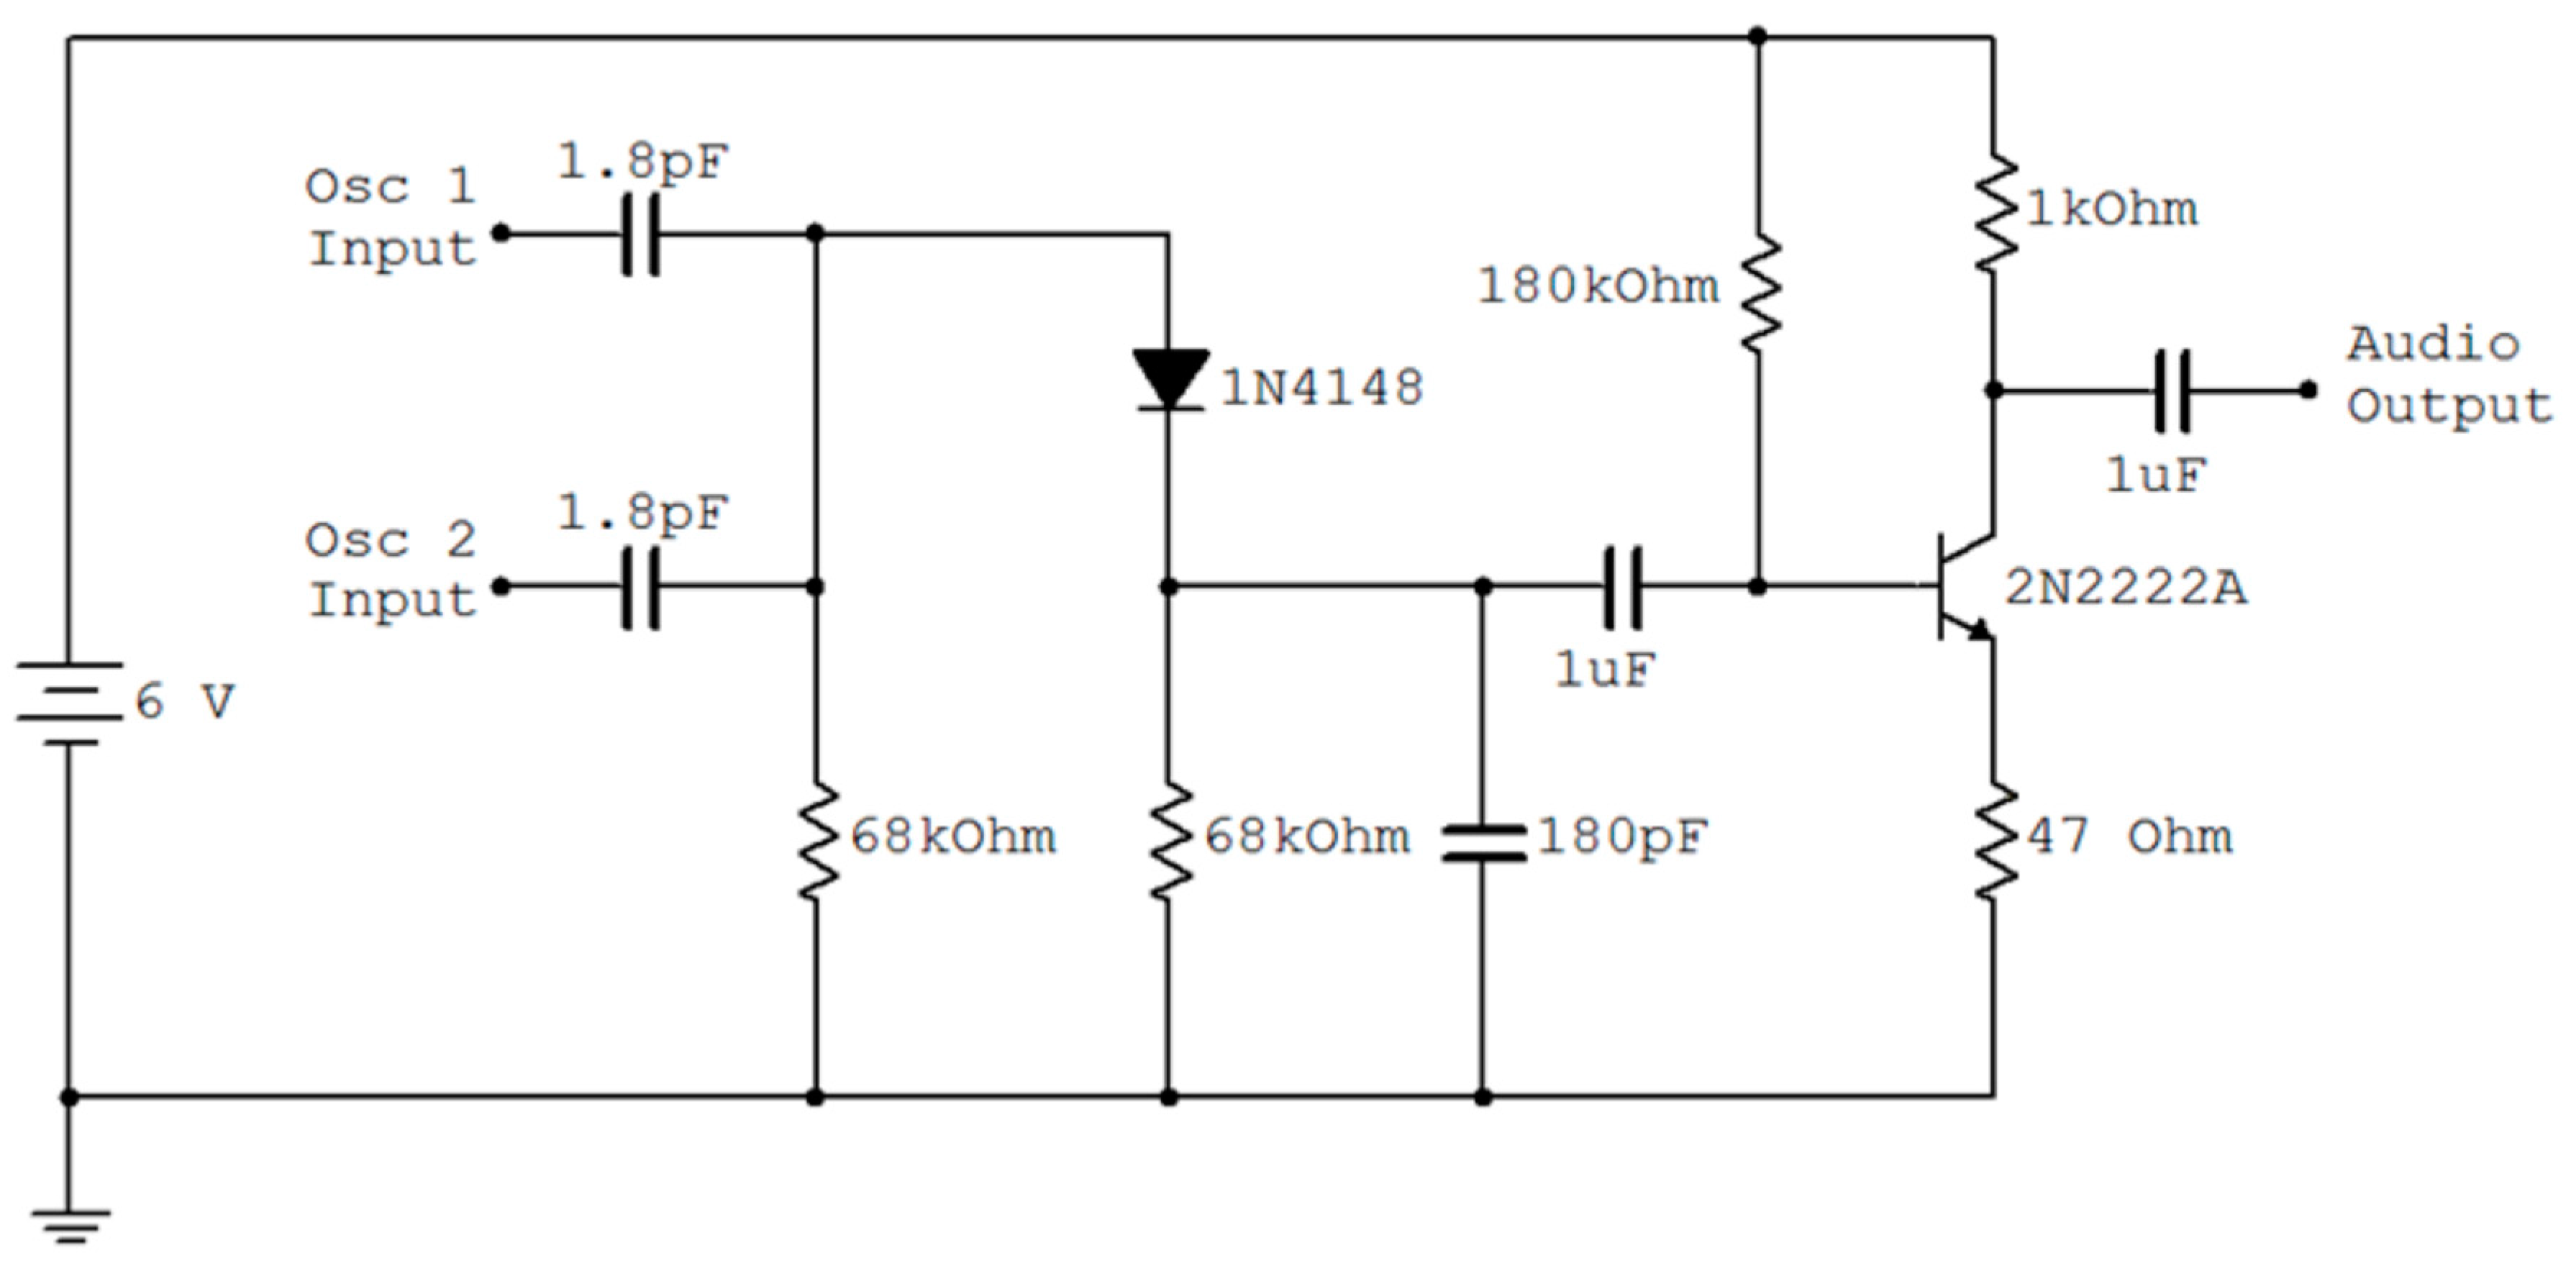
Figure 9.
Photograph of the prototype showing, the manometer and beat frequency oscillator.

Figure 10.
Raw data output by the differential pressure transducer using an inflatable-matrass pump to provide the air flow.
Figure 10.
Raw data output by the differential pressure transducer using an inflatable-matrass pump to provide the air flow.
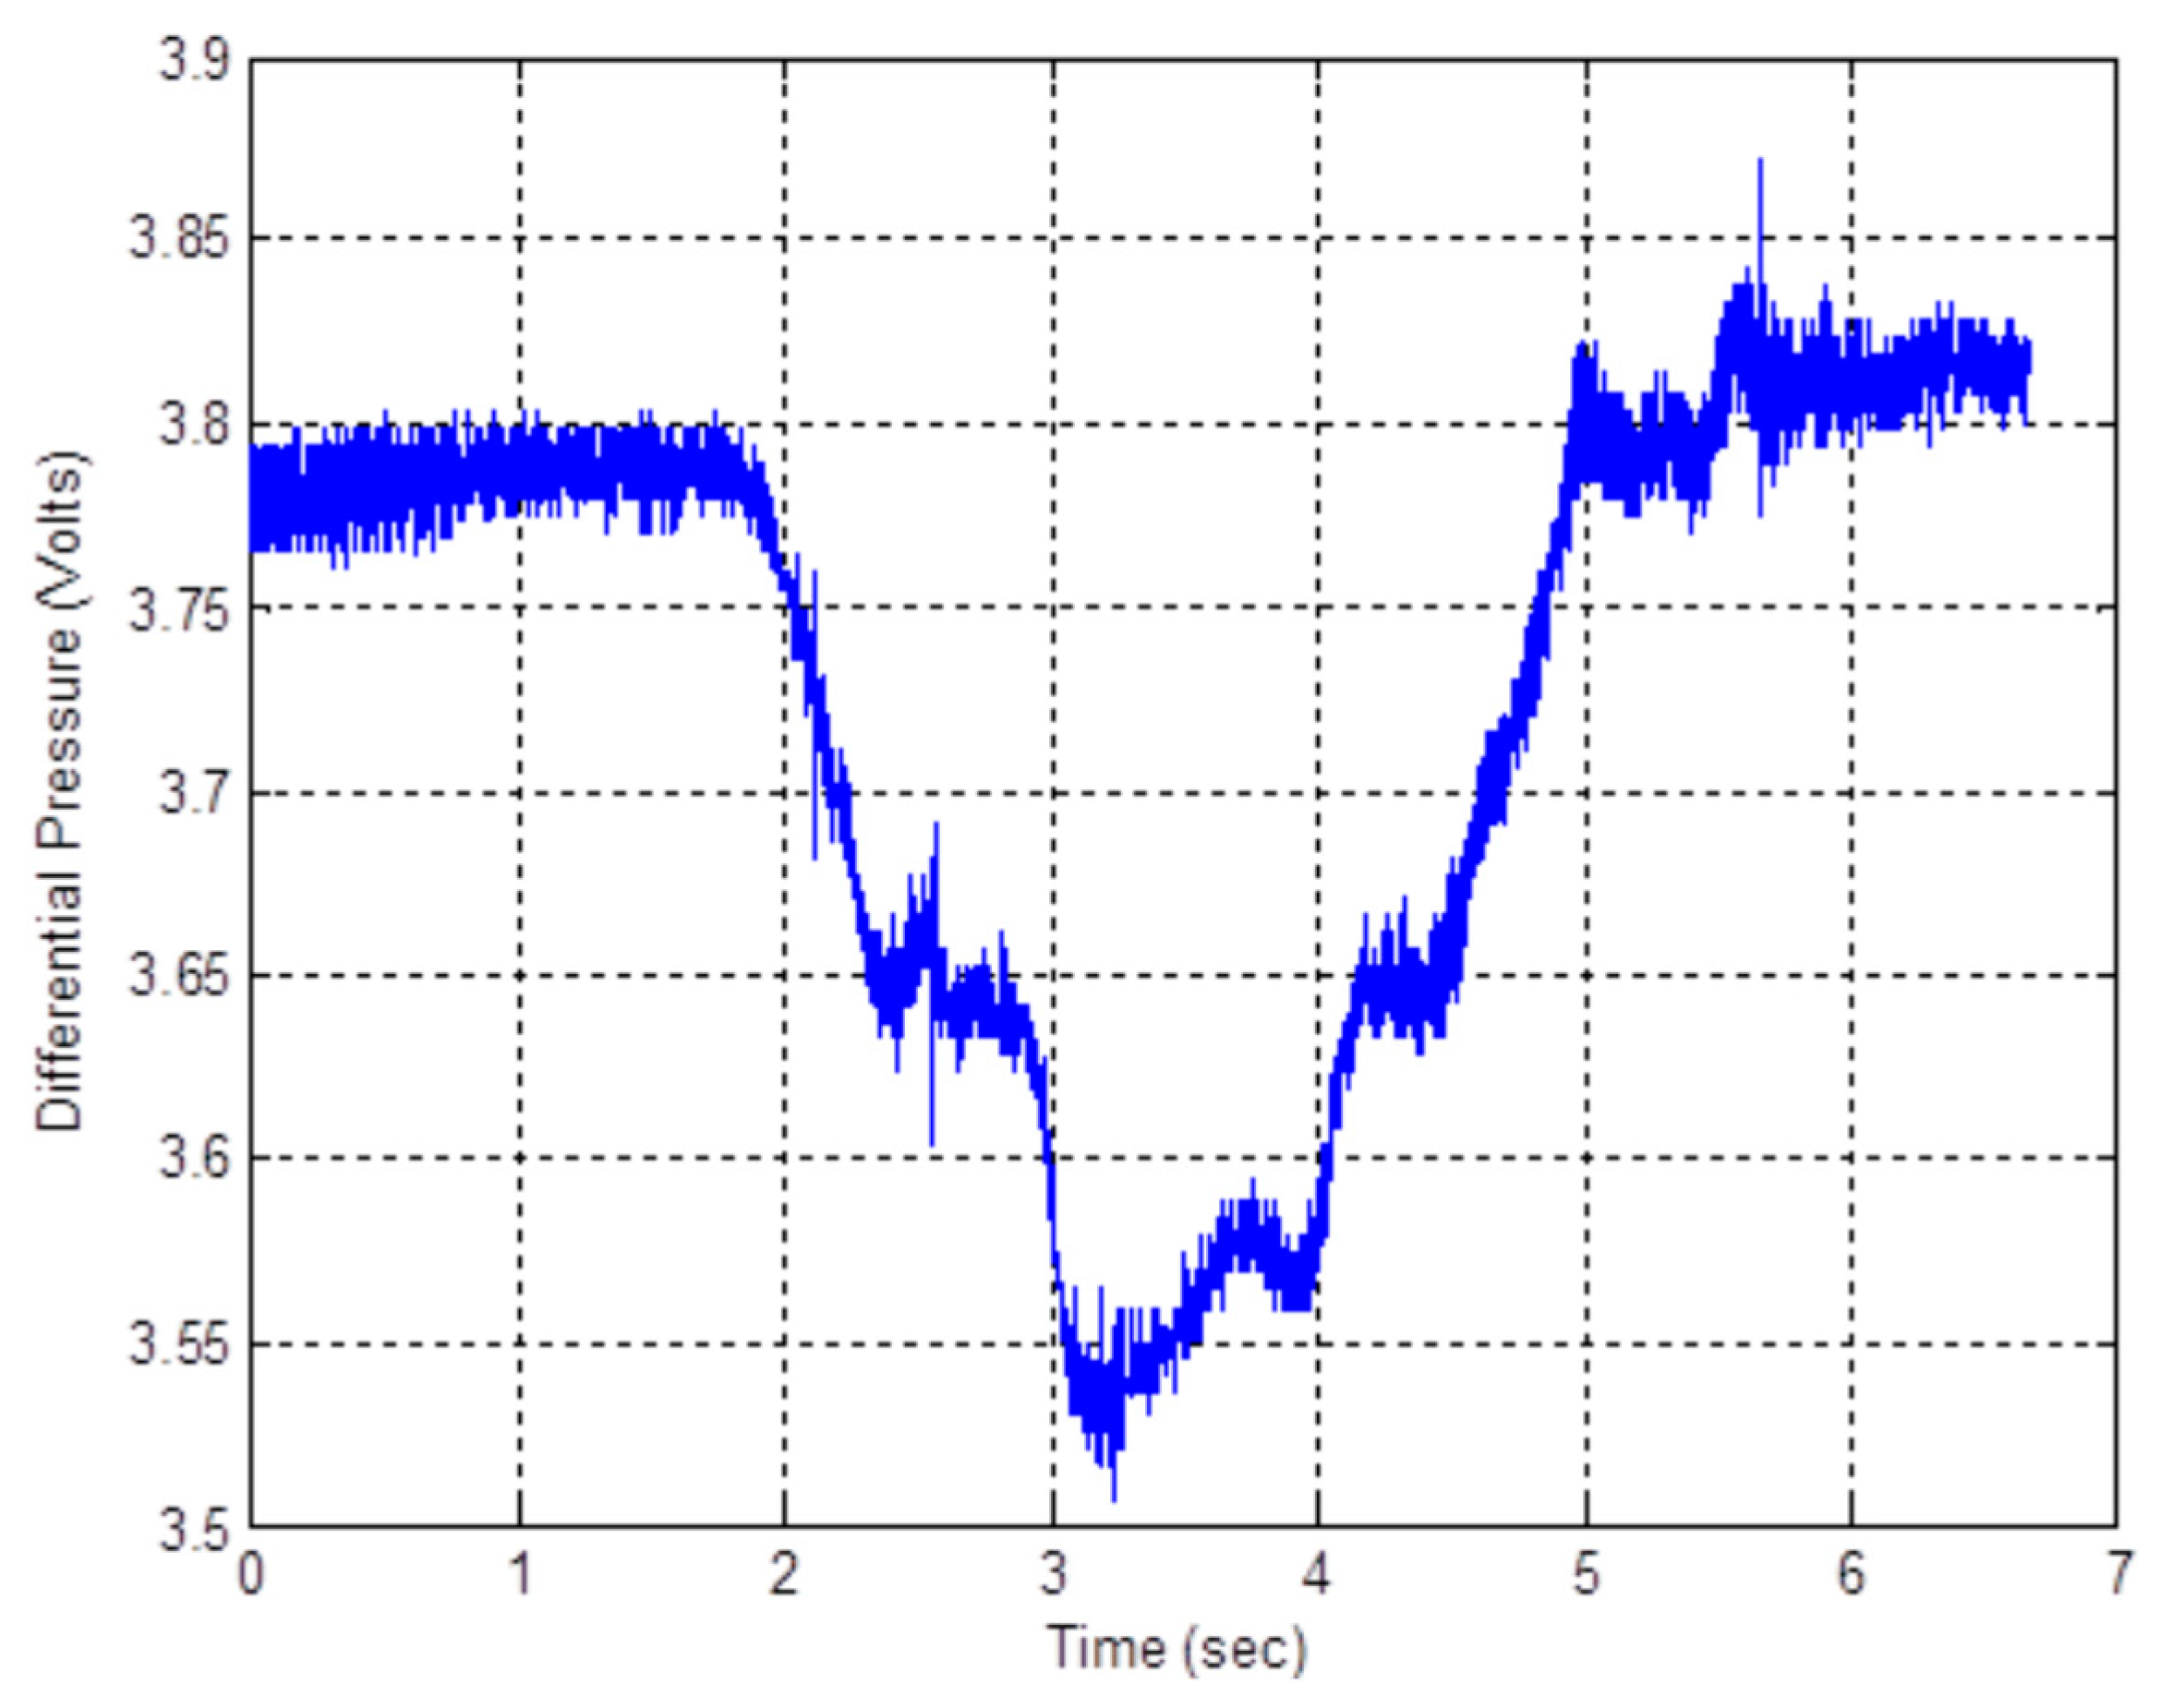
Figure 11.
Filtered flow rate and integrated volume in measurement units after digital processing.
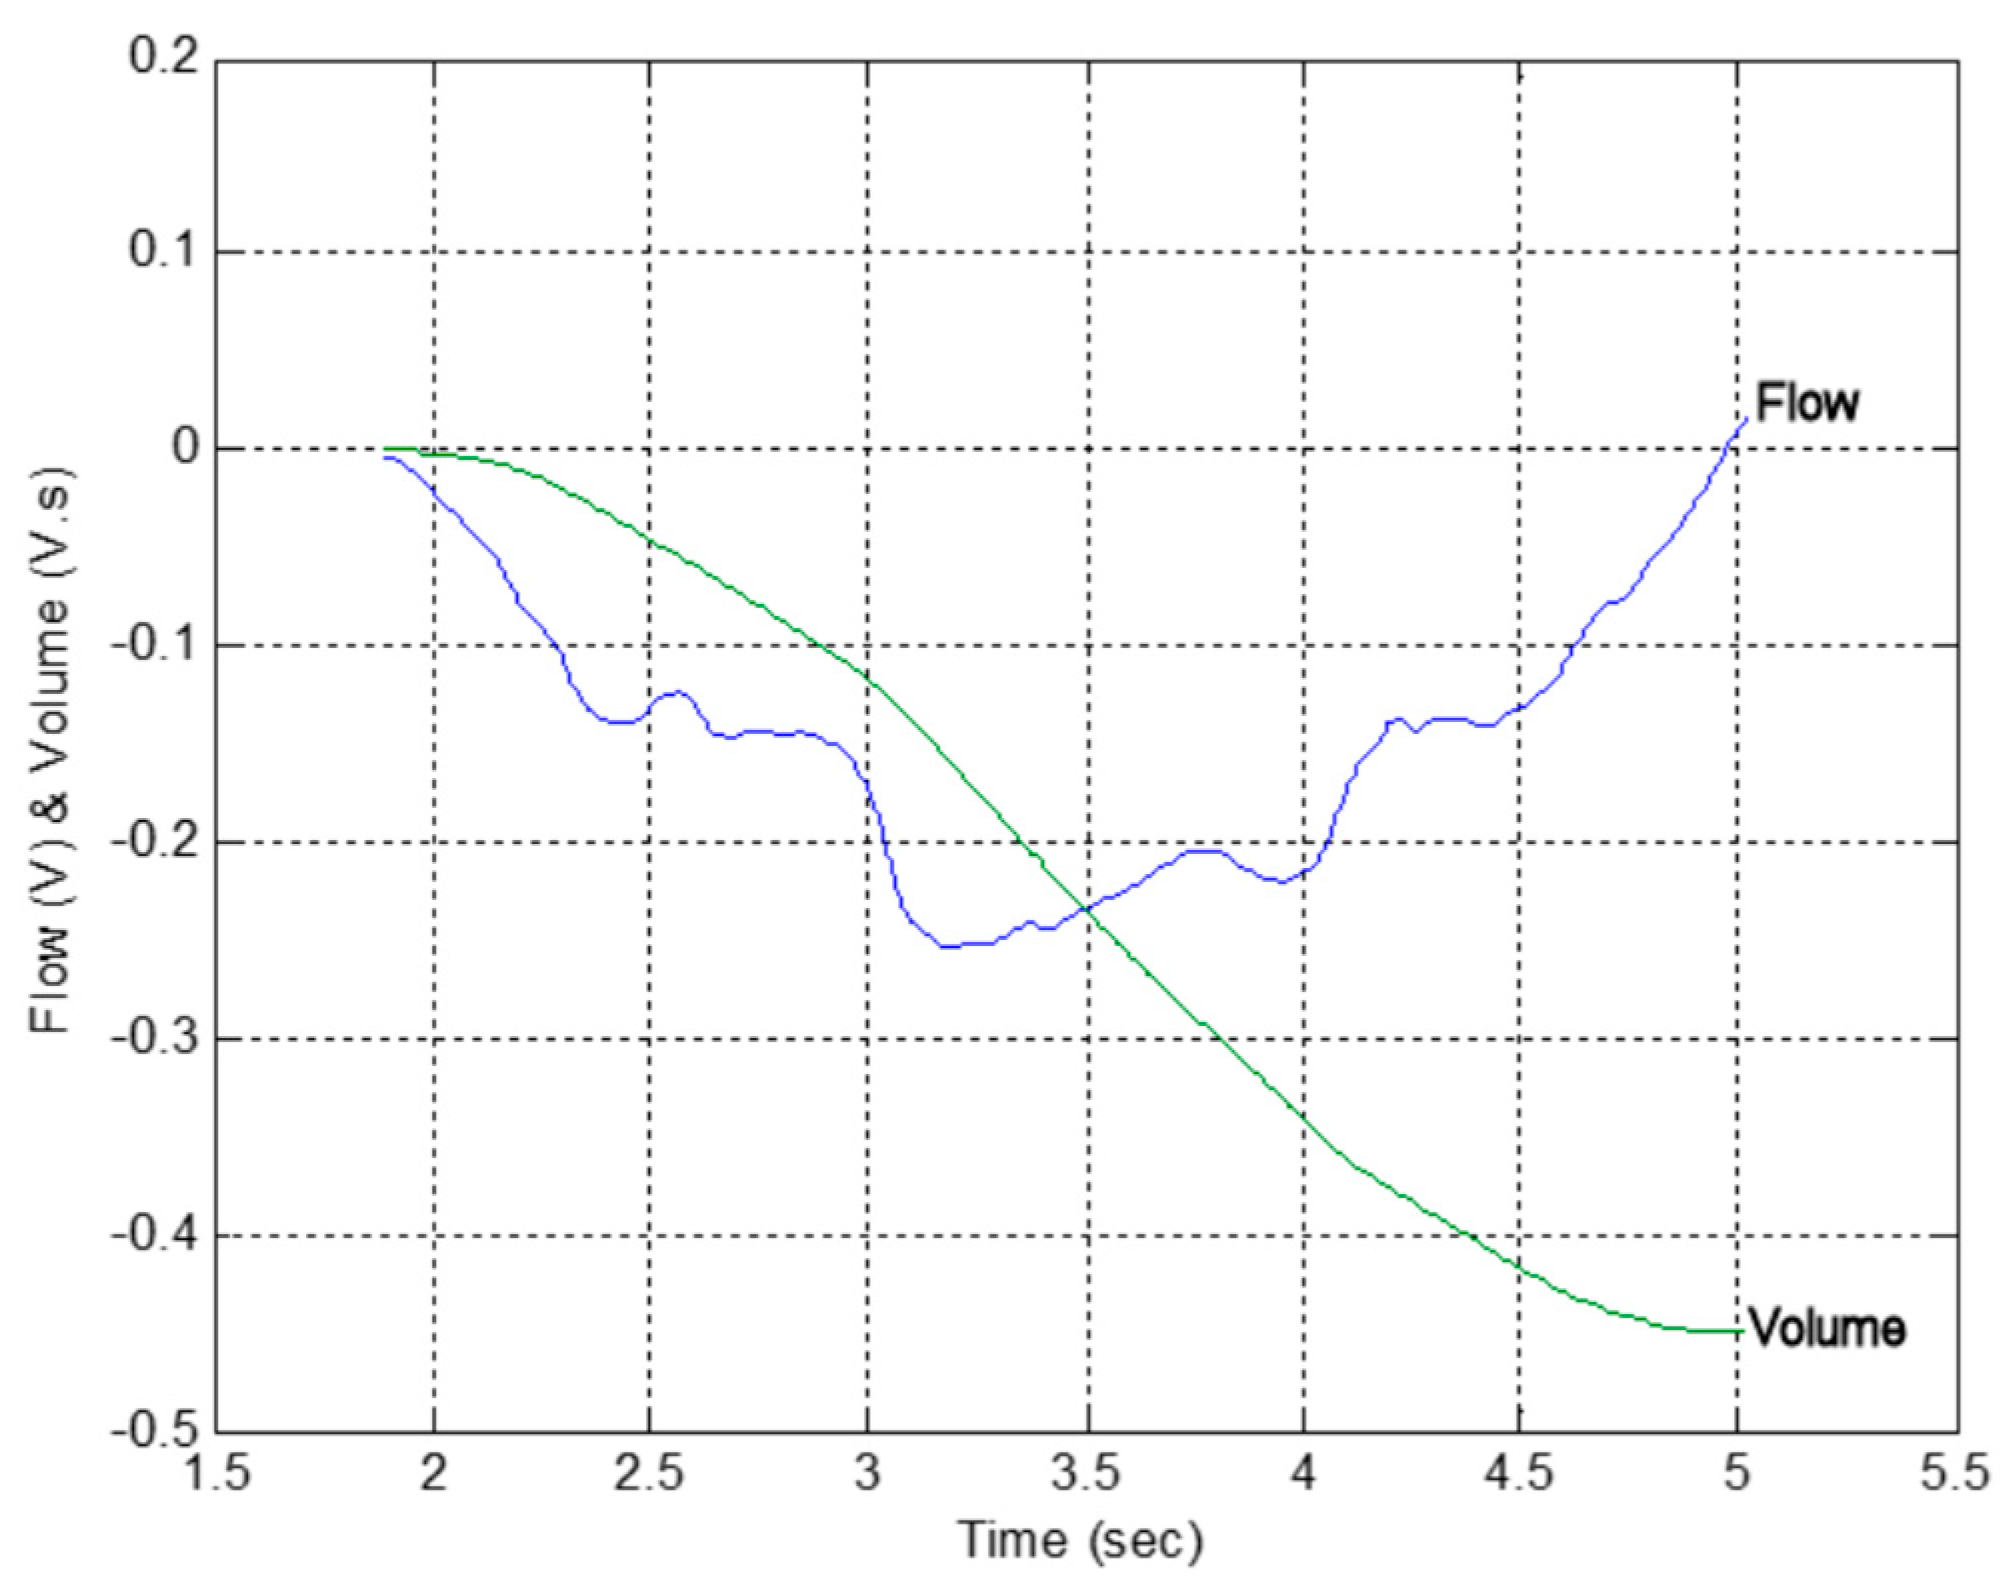
Figure 12.
Summary of the measured flow rate (mL/s) as a function of calibration constant, K (mL/s per volt), for a number of different sources of air flow.
Figure 12.
Summary of the measured flow rate (mL/s) as a function of calibration constant, K (mL/s per volt), for a number of different sources of air flow.
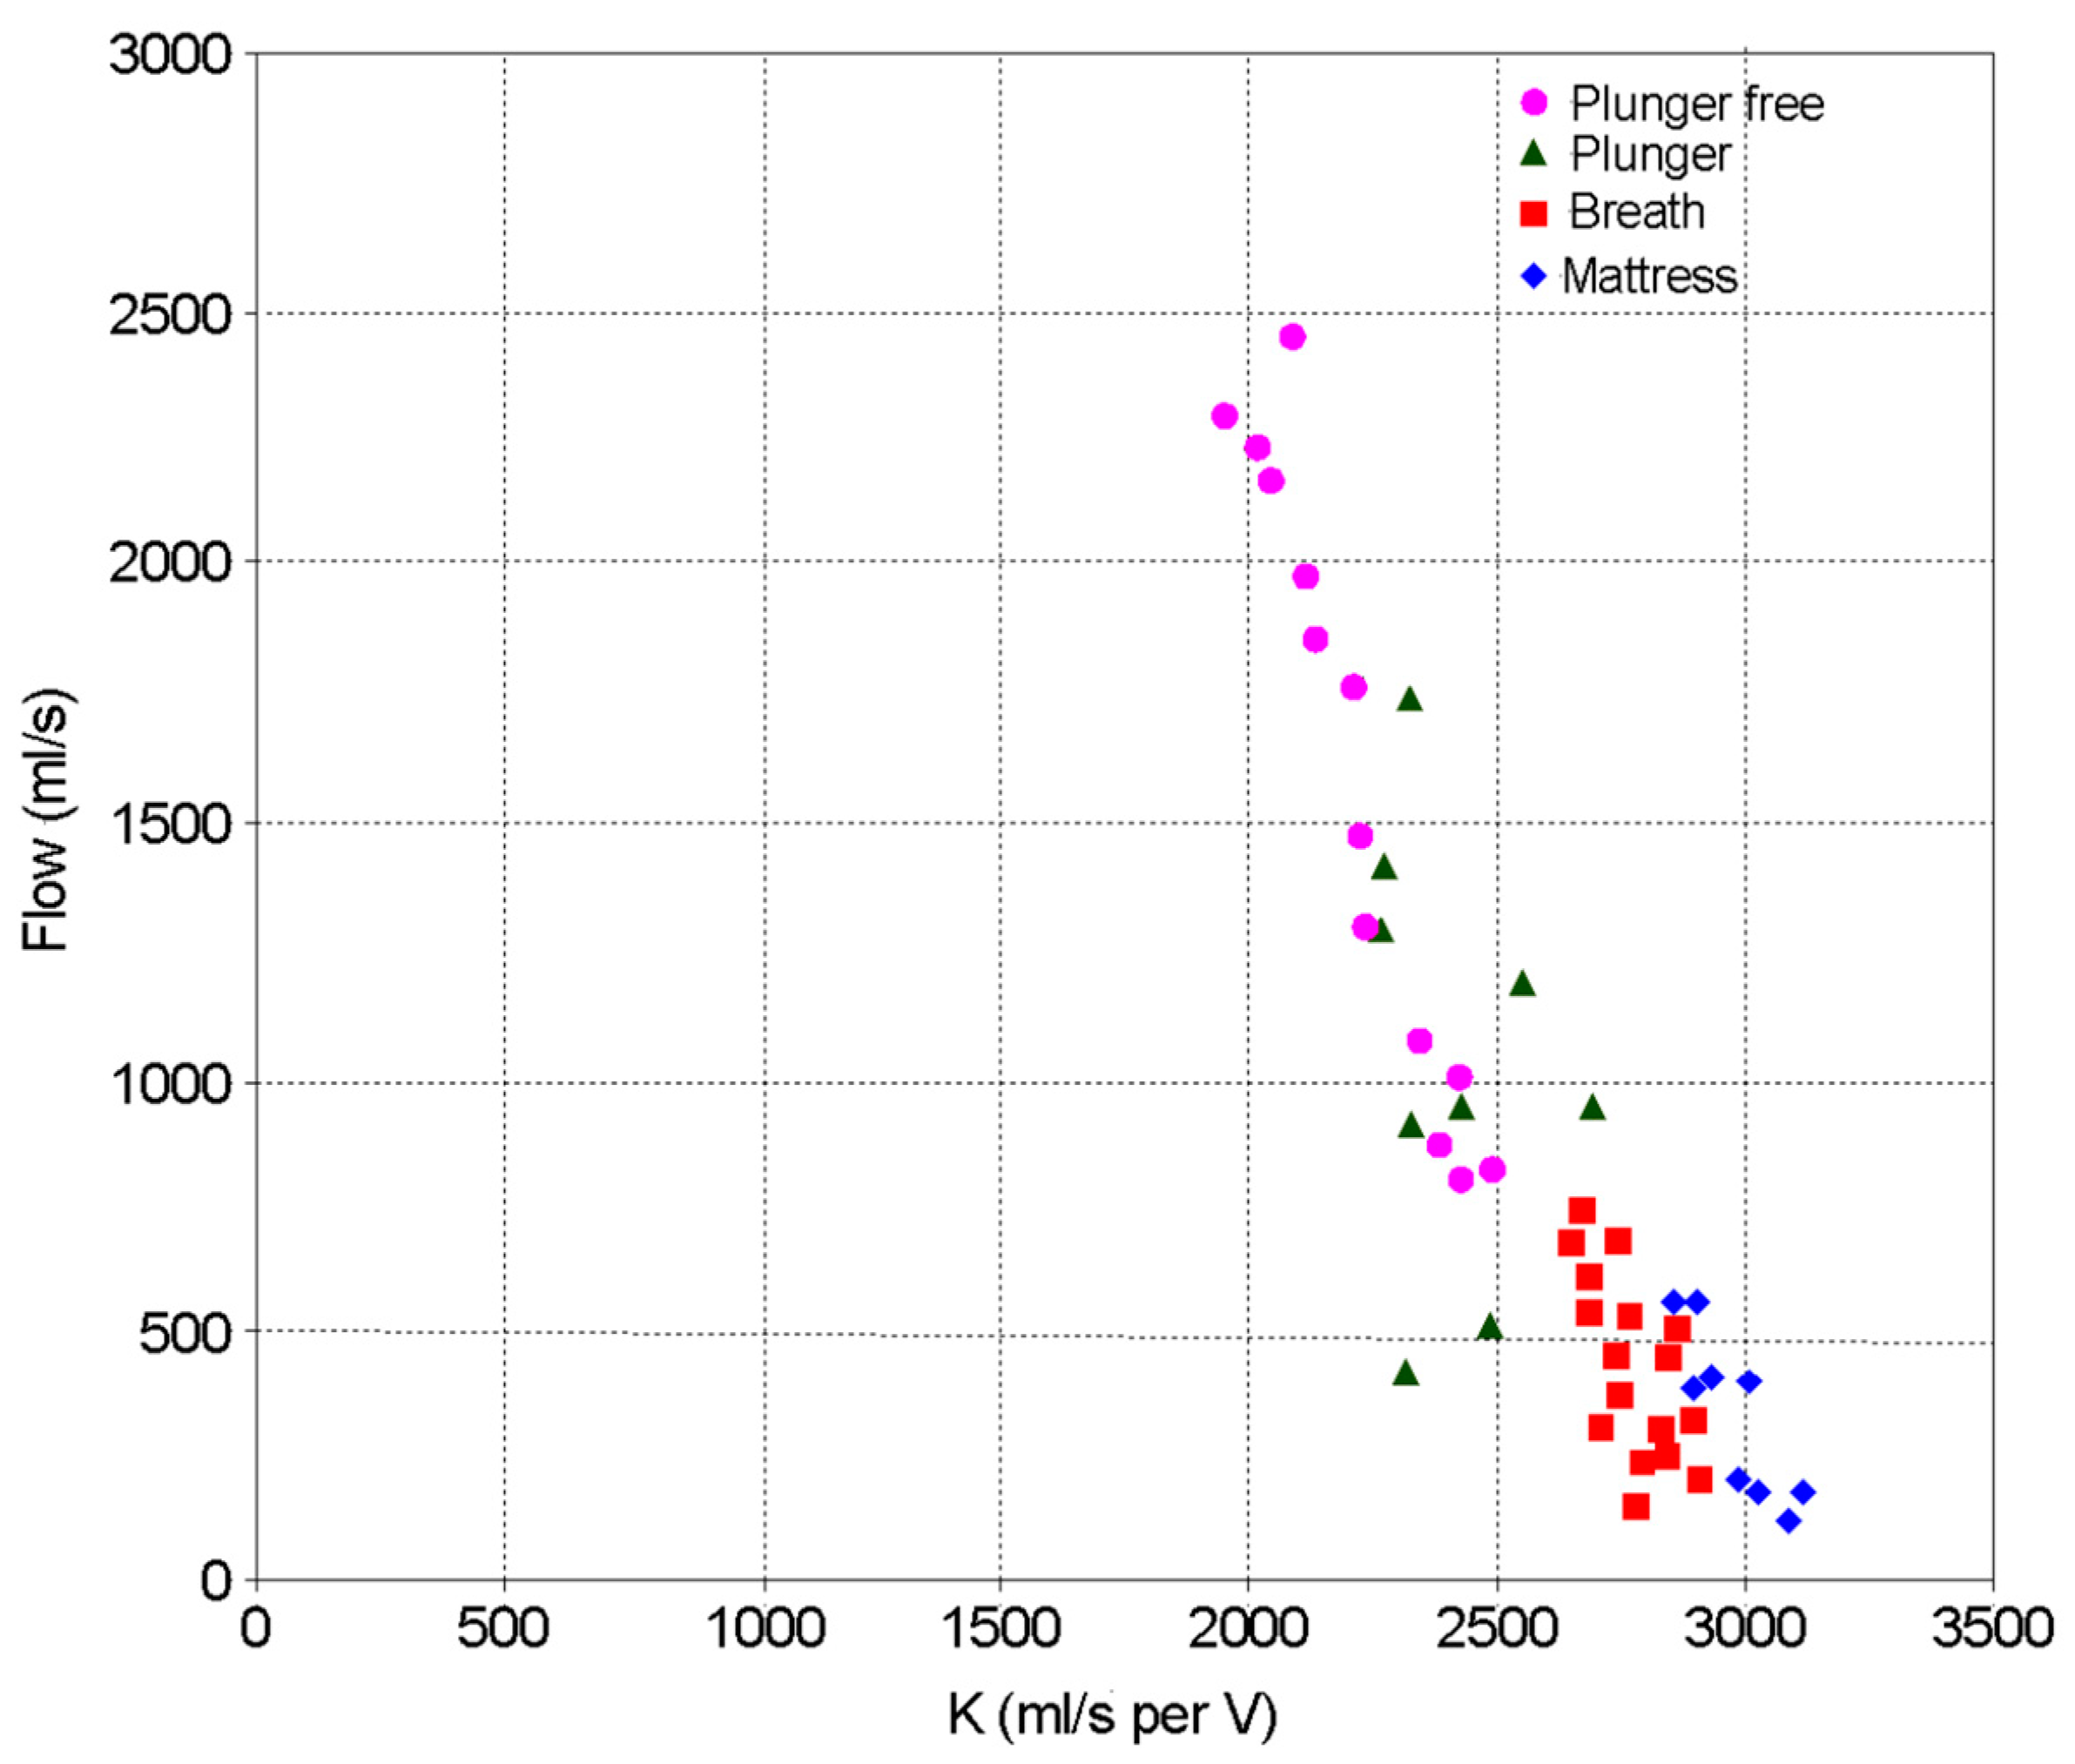
Figure 13.
Identifying chronic obstructive pulmonary disease (COPD) from flow rate and volume data produced during a forced expiratory volume (FEV) test.
Figure 13.
Identifying chronic obstructive pulmonary disease (COPD) from flow rate and volume data produced during a forced expiratory volume (FEV) test.
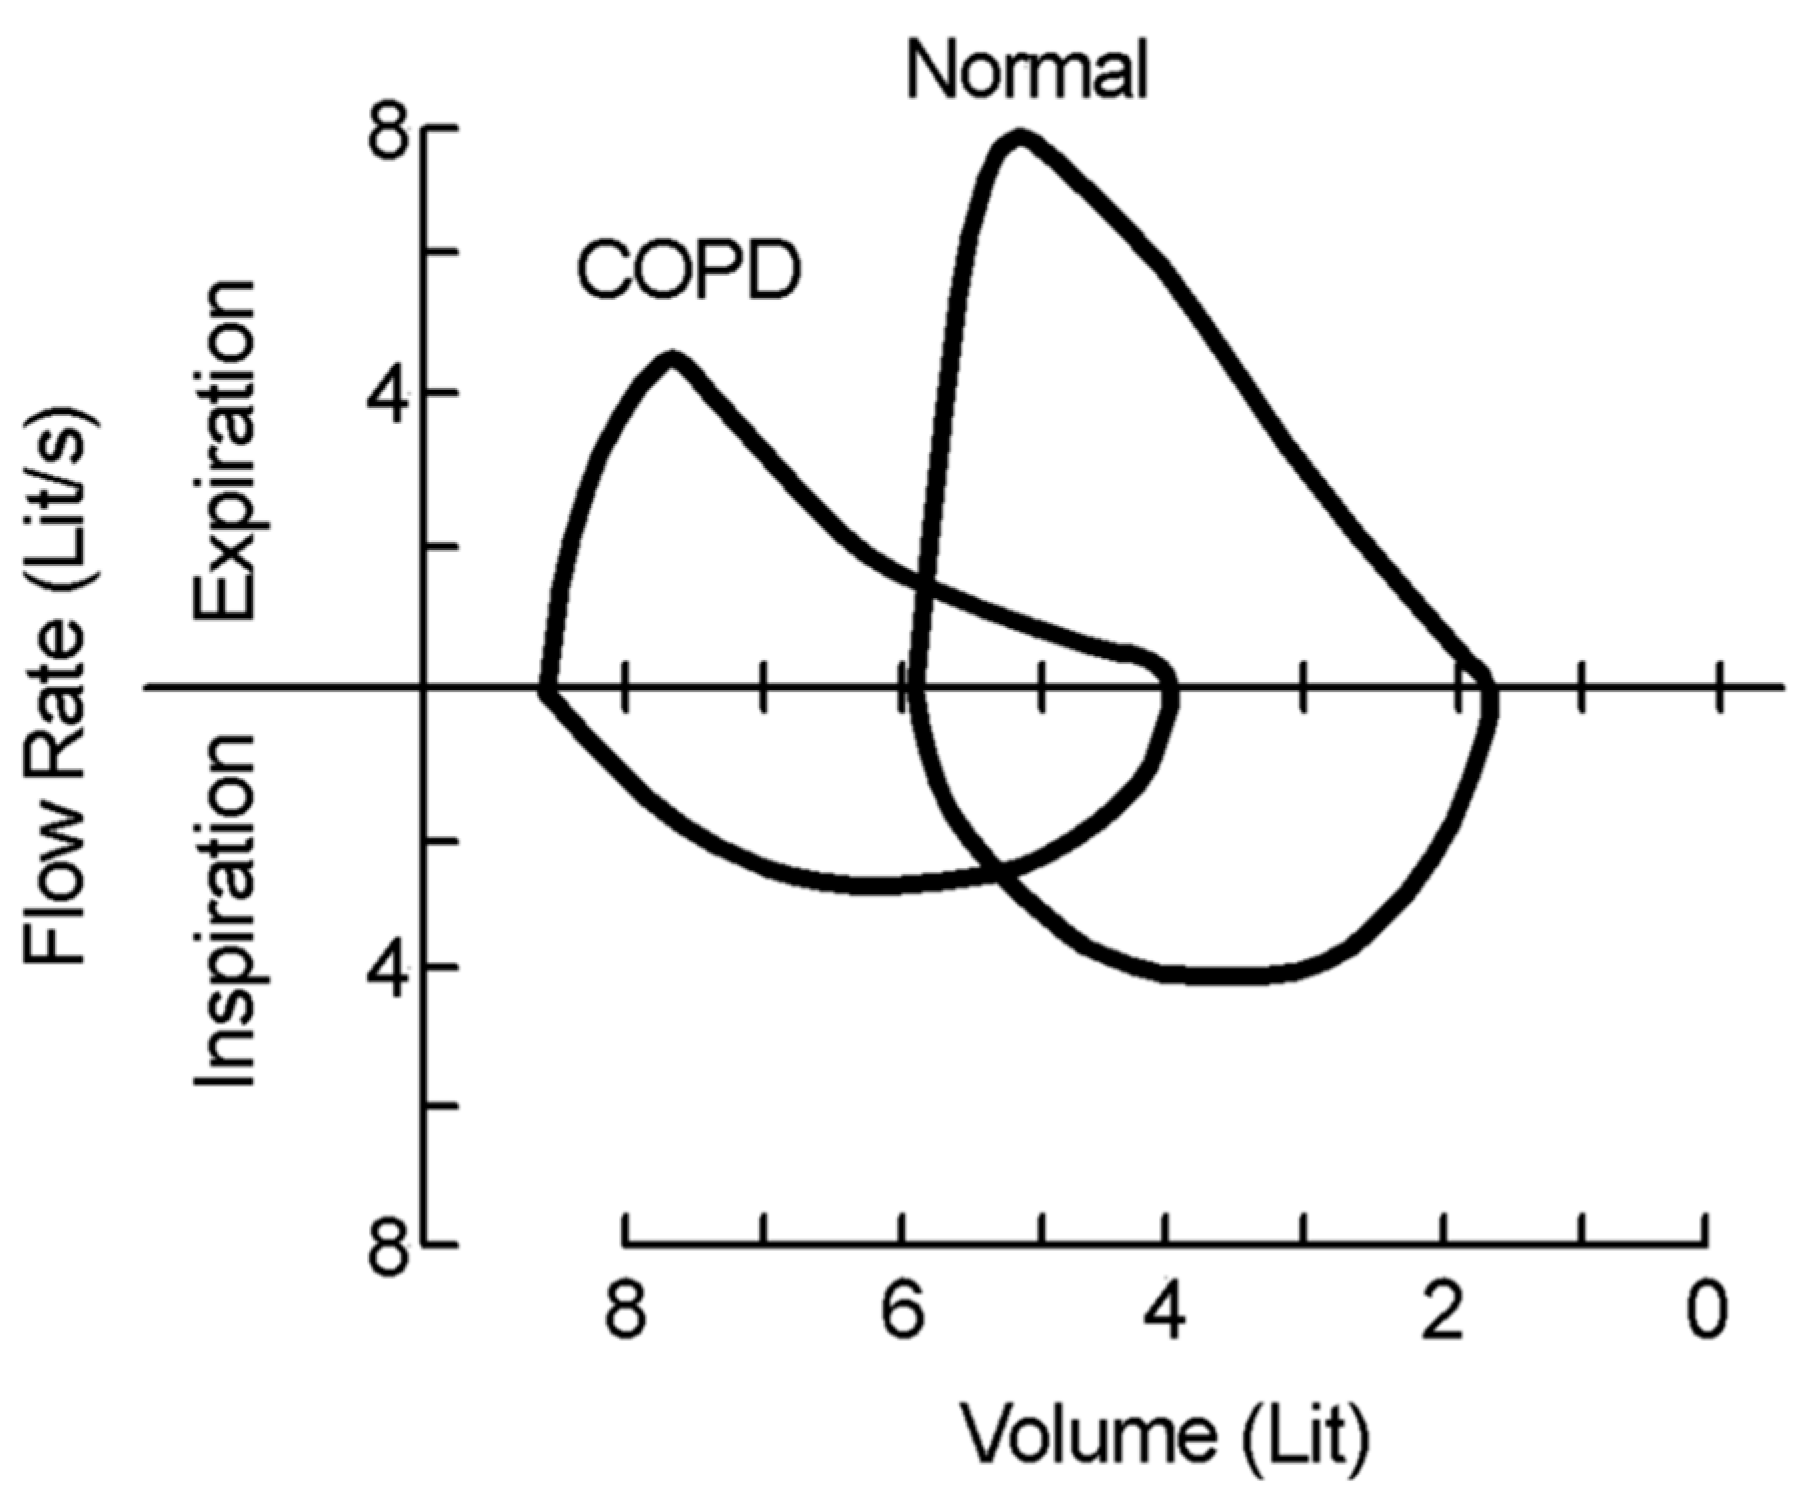
Figure 14.
Measured flow rate and calculated volume for two breaths during an FEV test, with FEV1 and forced vital capacity (FVC) marked for a single breath.
Figure 14.
Measured flow rate and calculated volume for two breaths during an FEV test, with FEV1 and forced vital capacity (FVC) marked for a single breath.
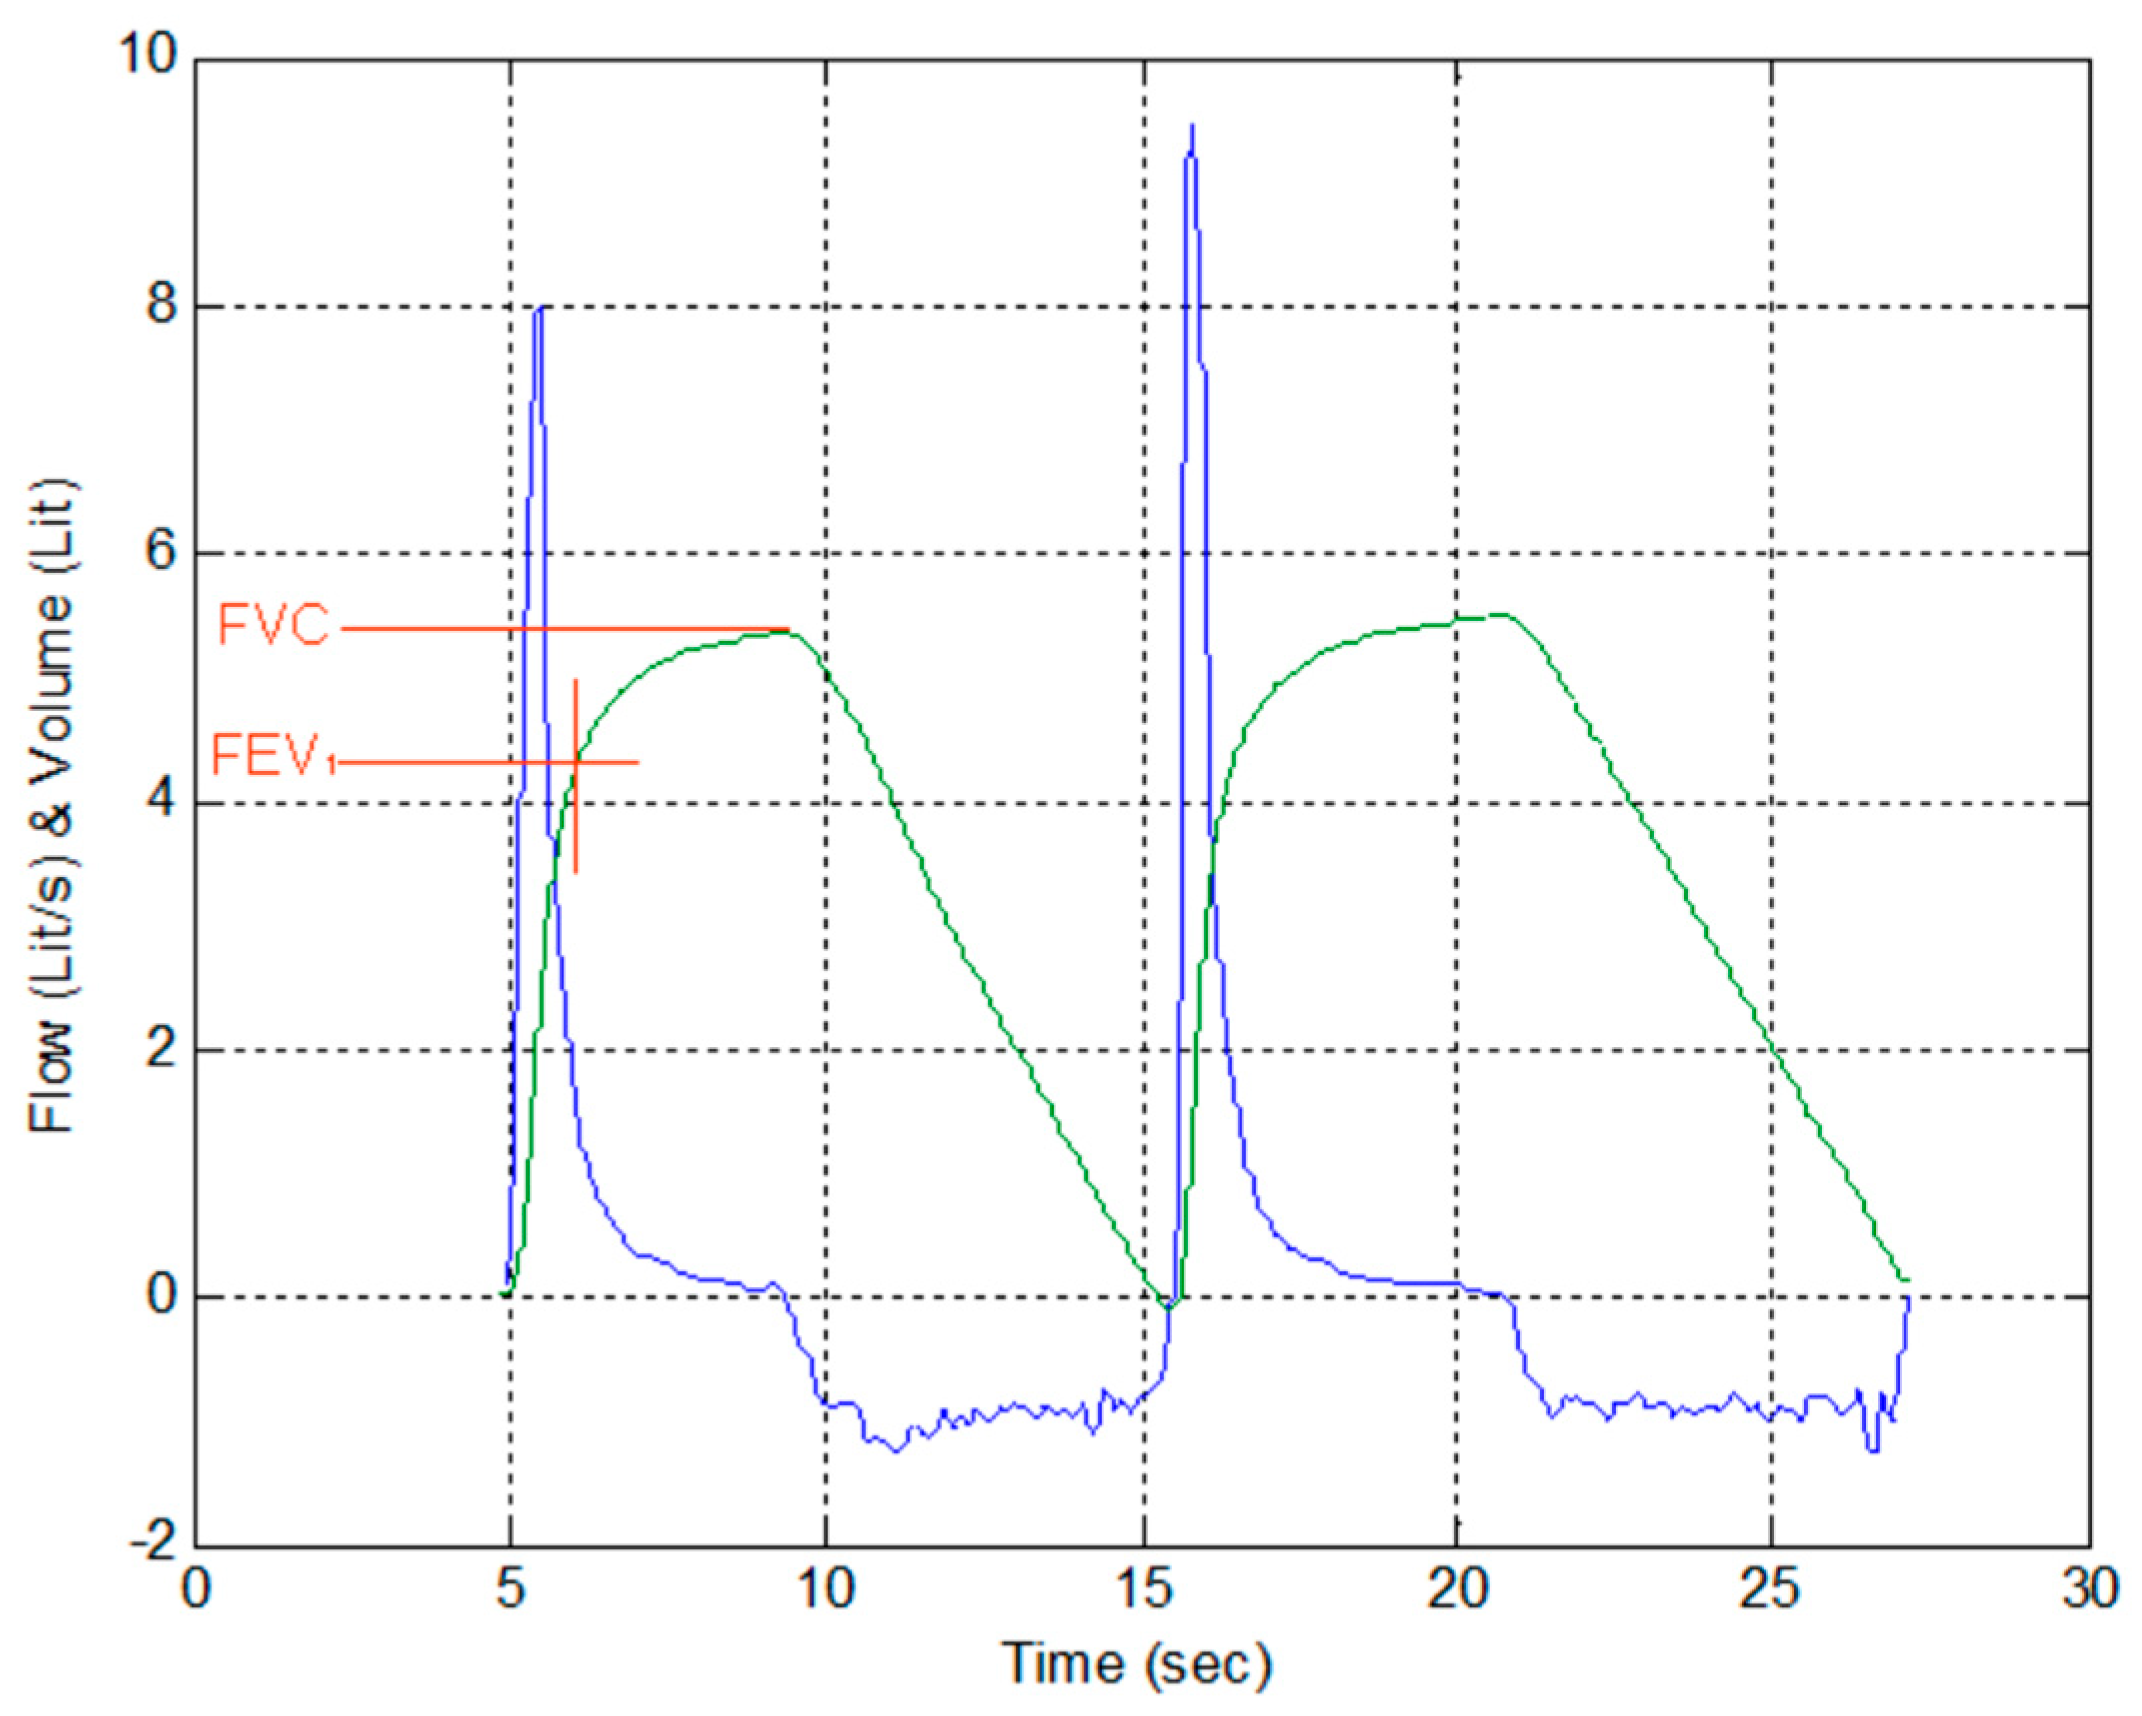
Figure 15.
Plot of flow rate vs. volume for two breaths during an FEV test.
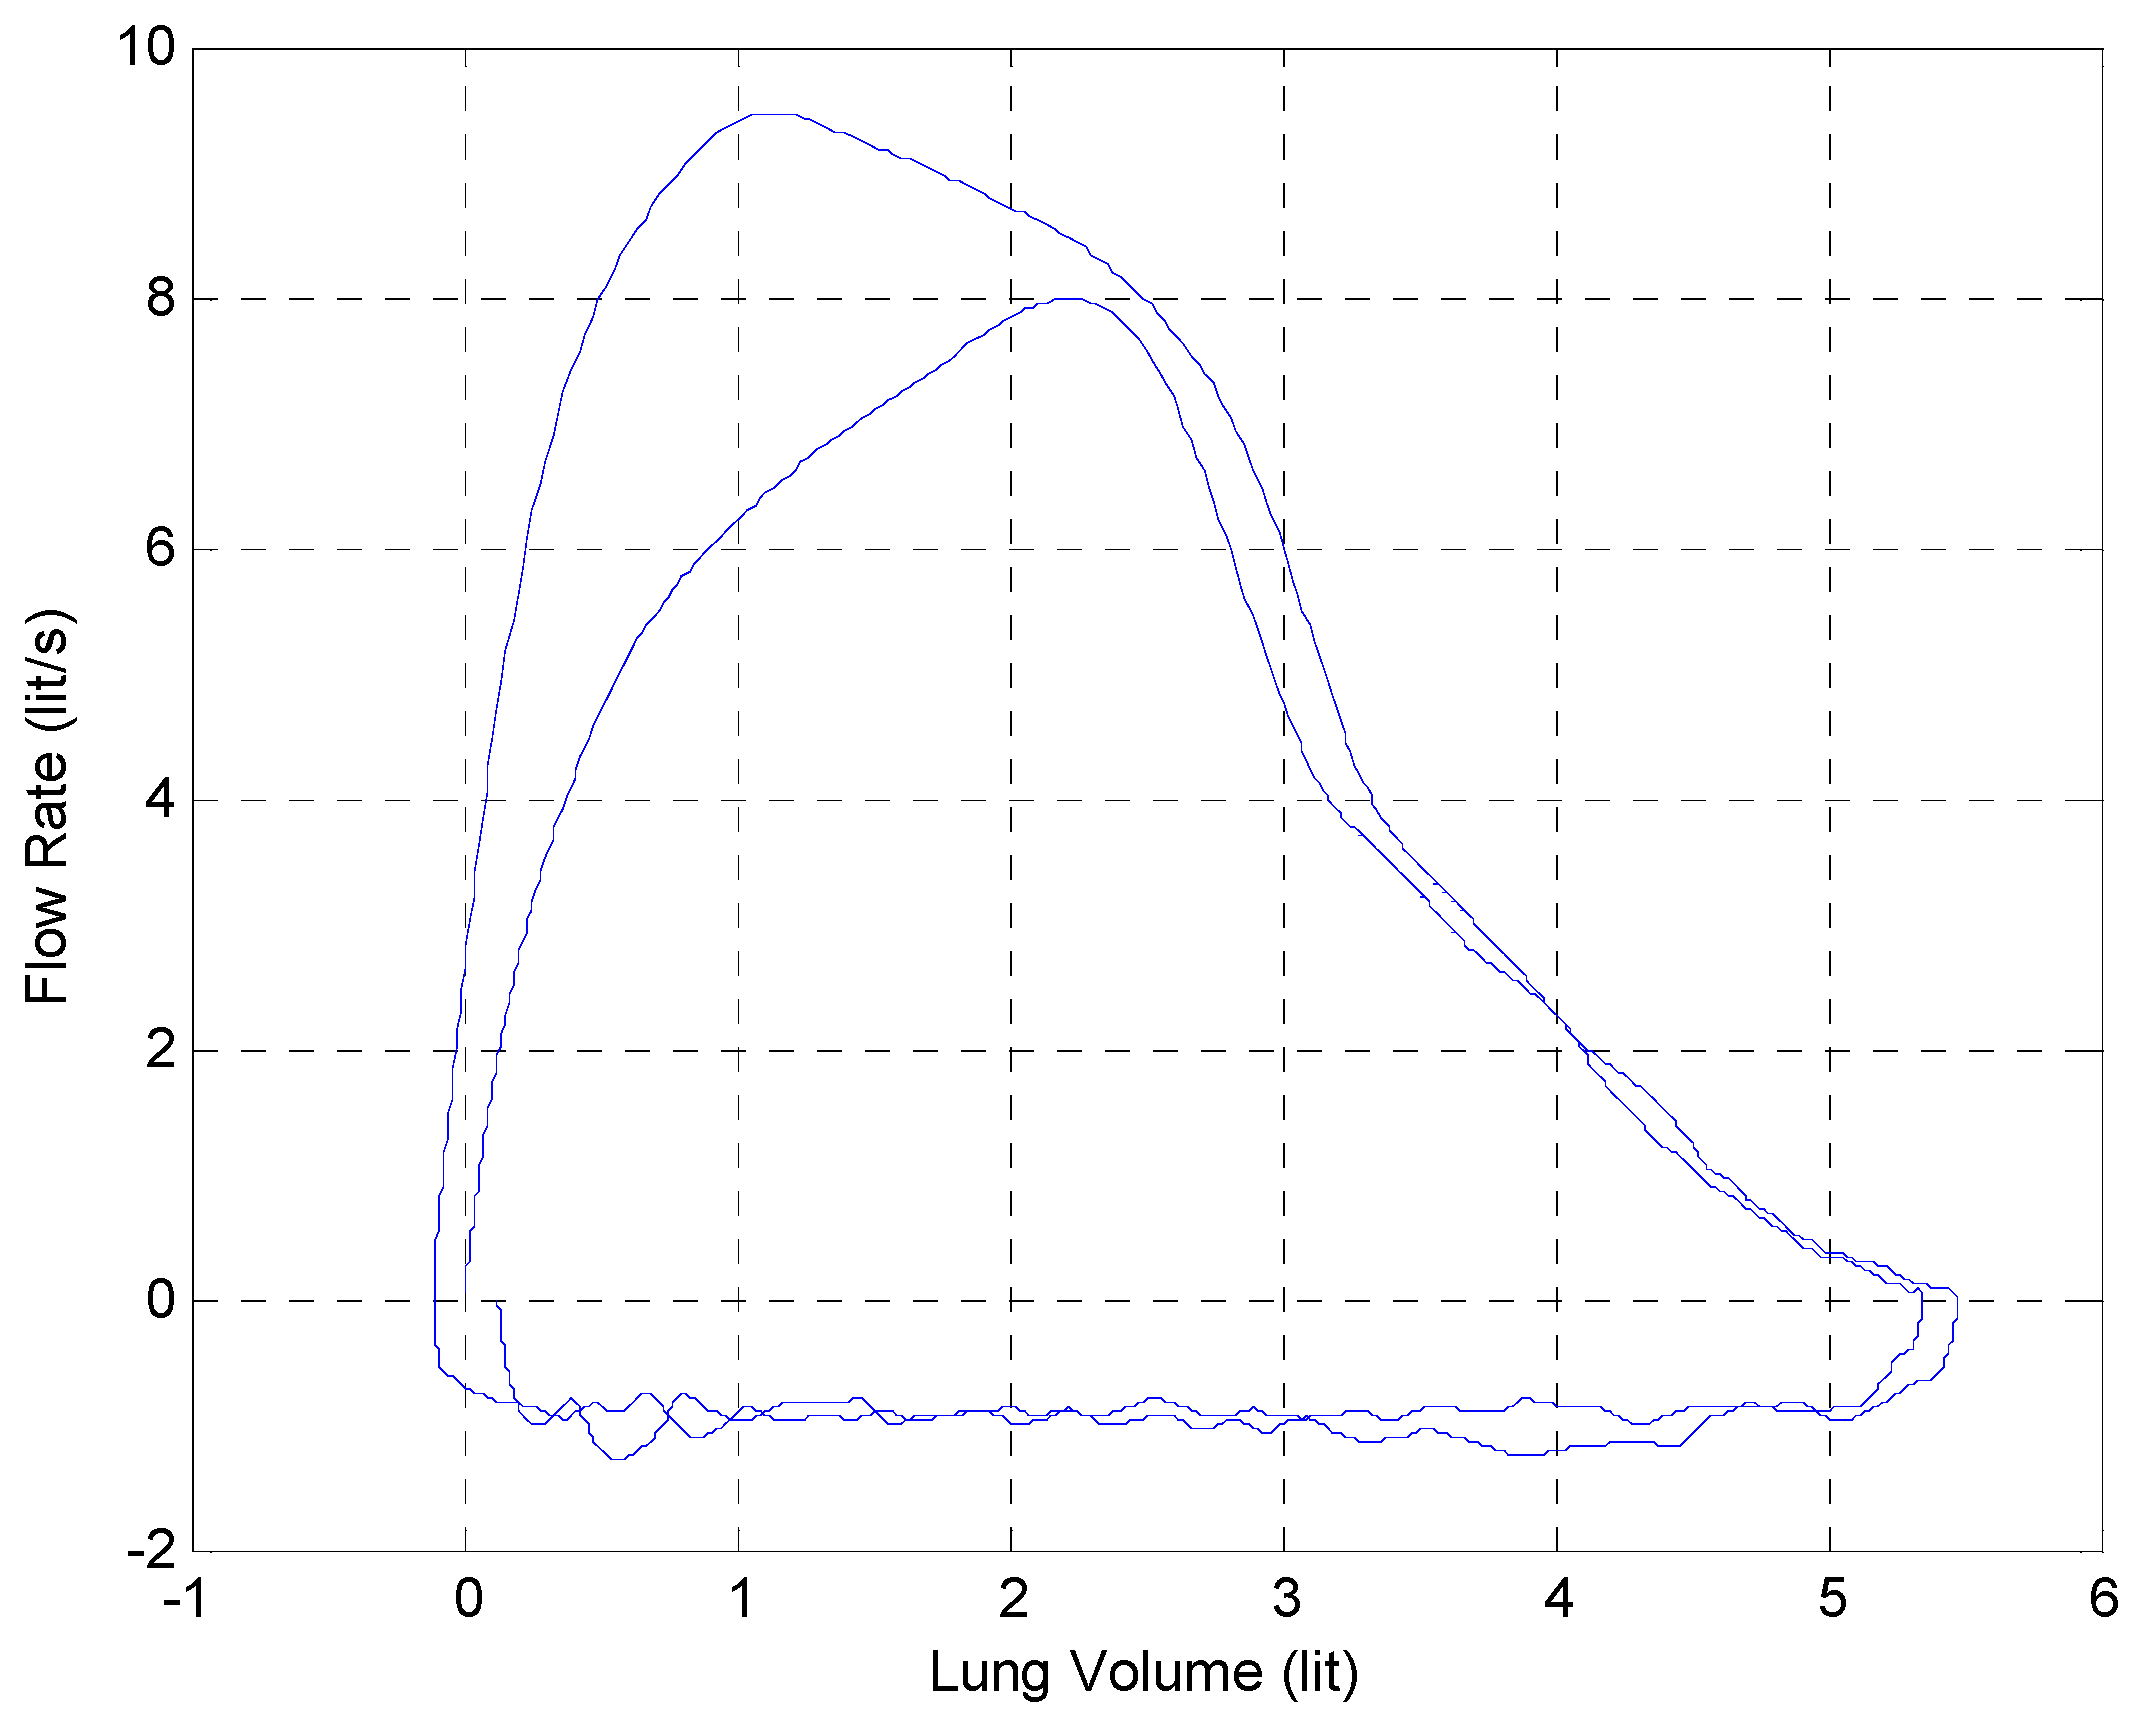
Figure 16.
Measured beat frequency as a function of the differential water level.

Figure 17.
Complete telespirometer configuration.
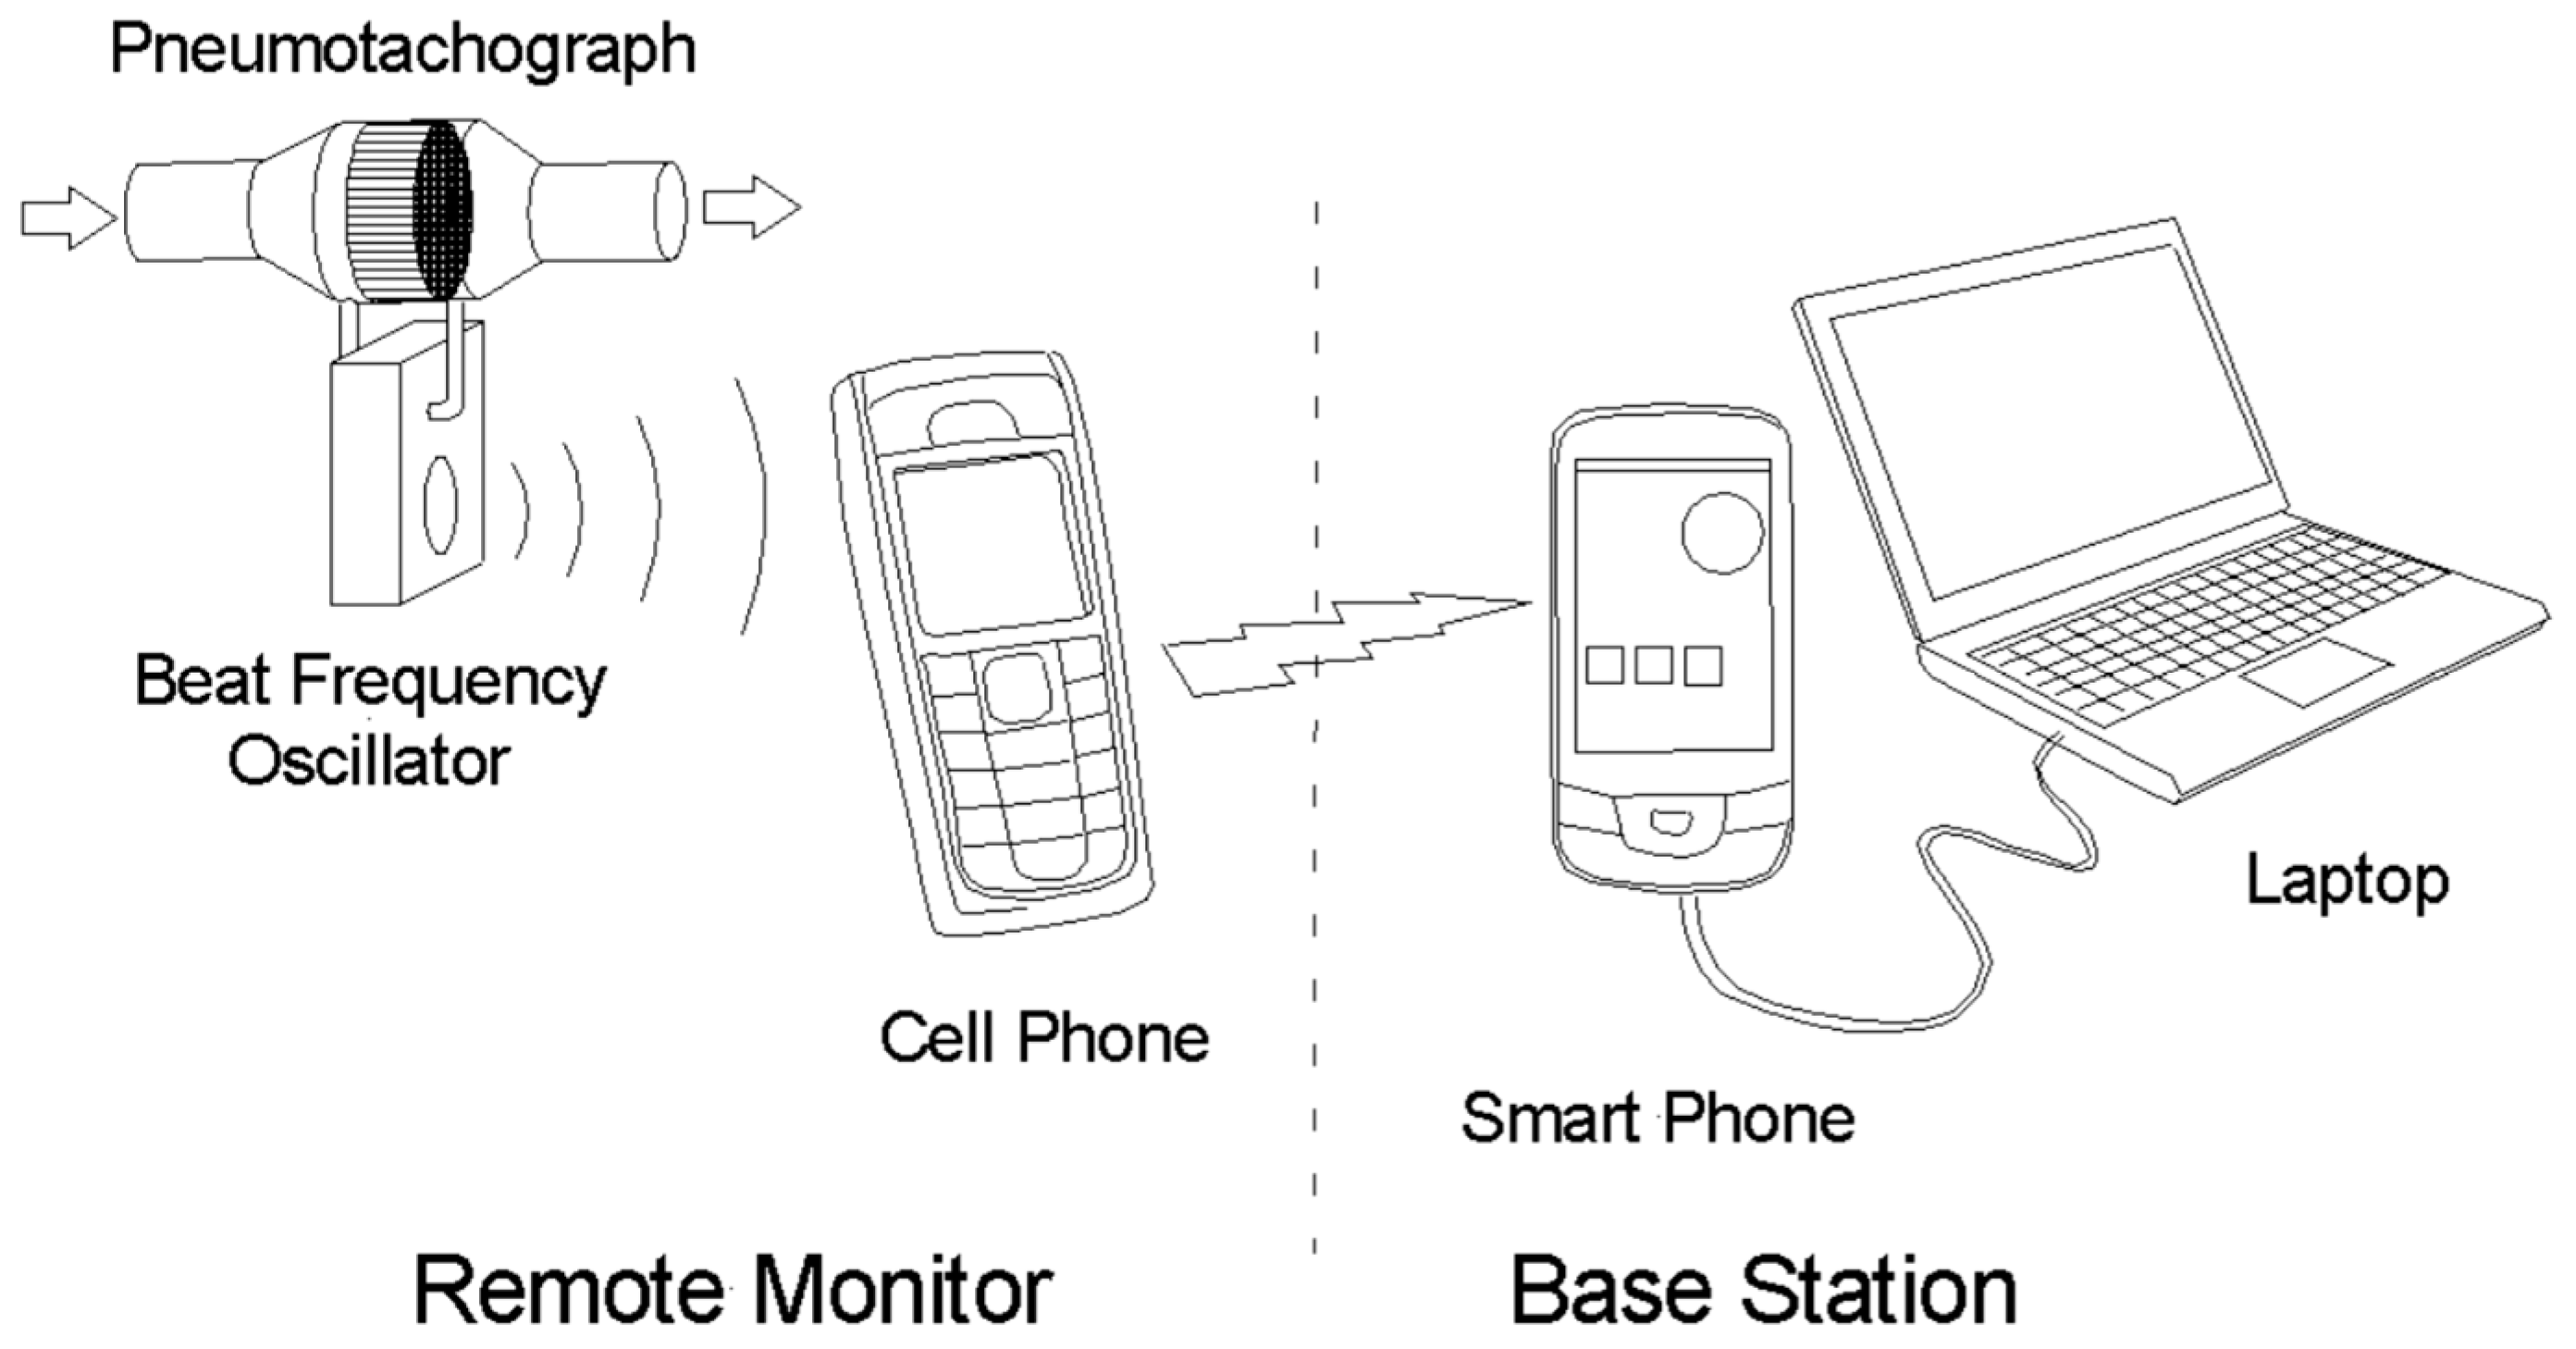
Figure 18.
Received signal spectrogram of two consecutive forced breaths.
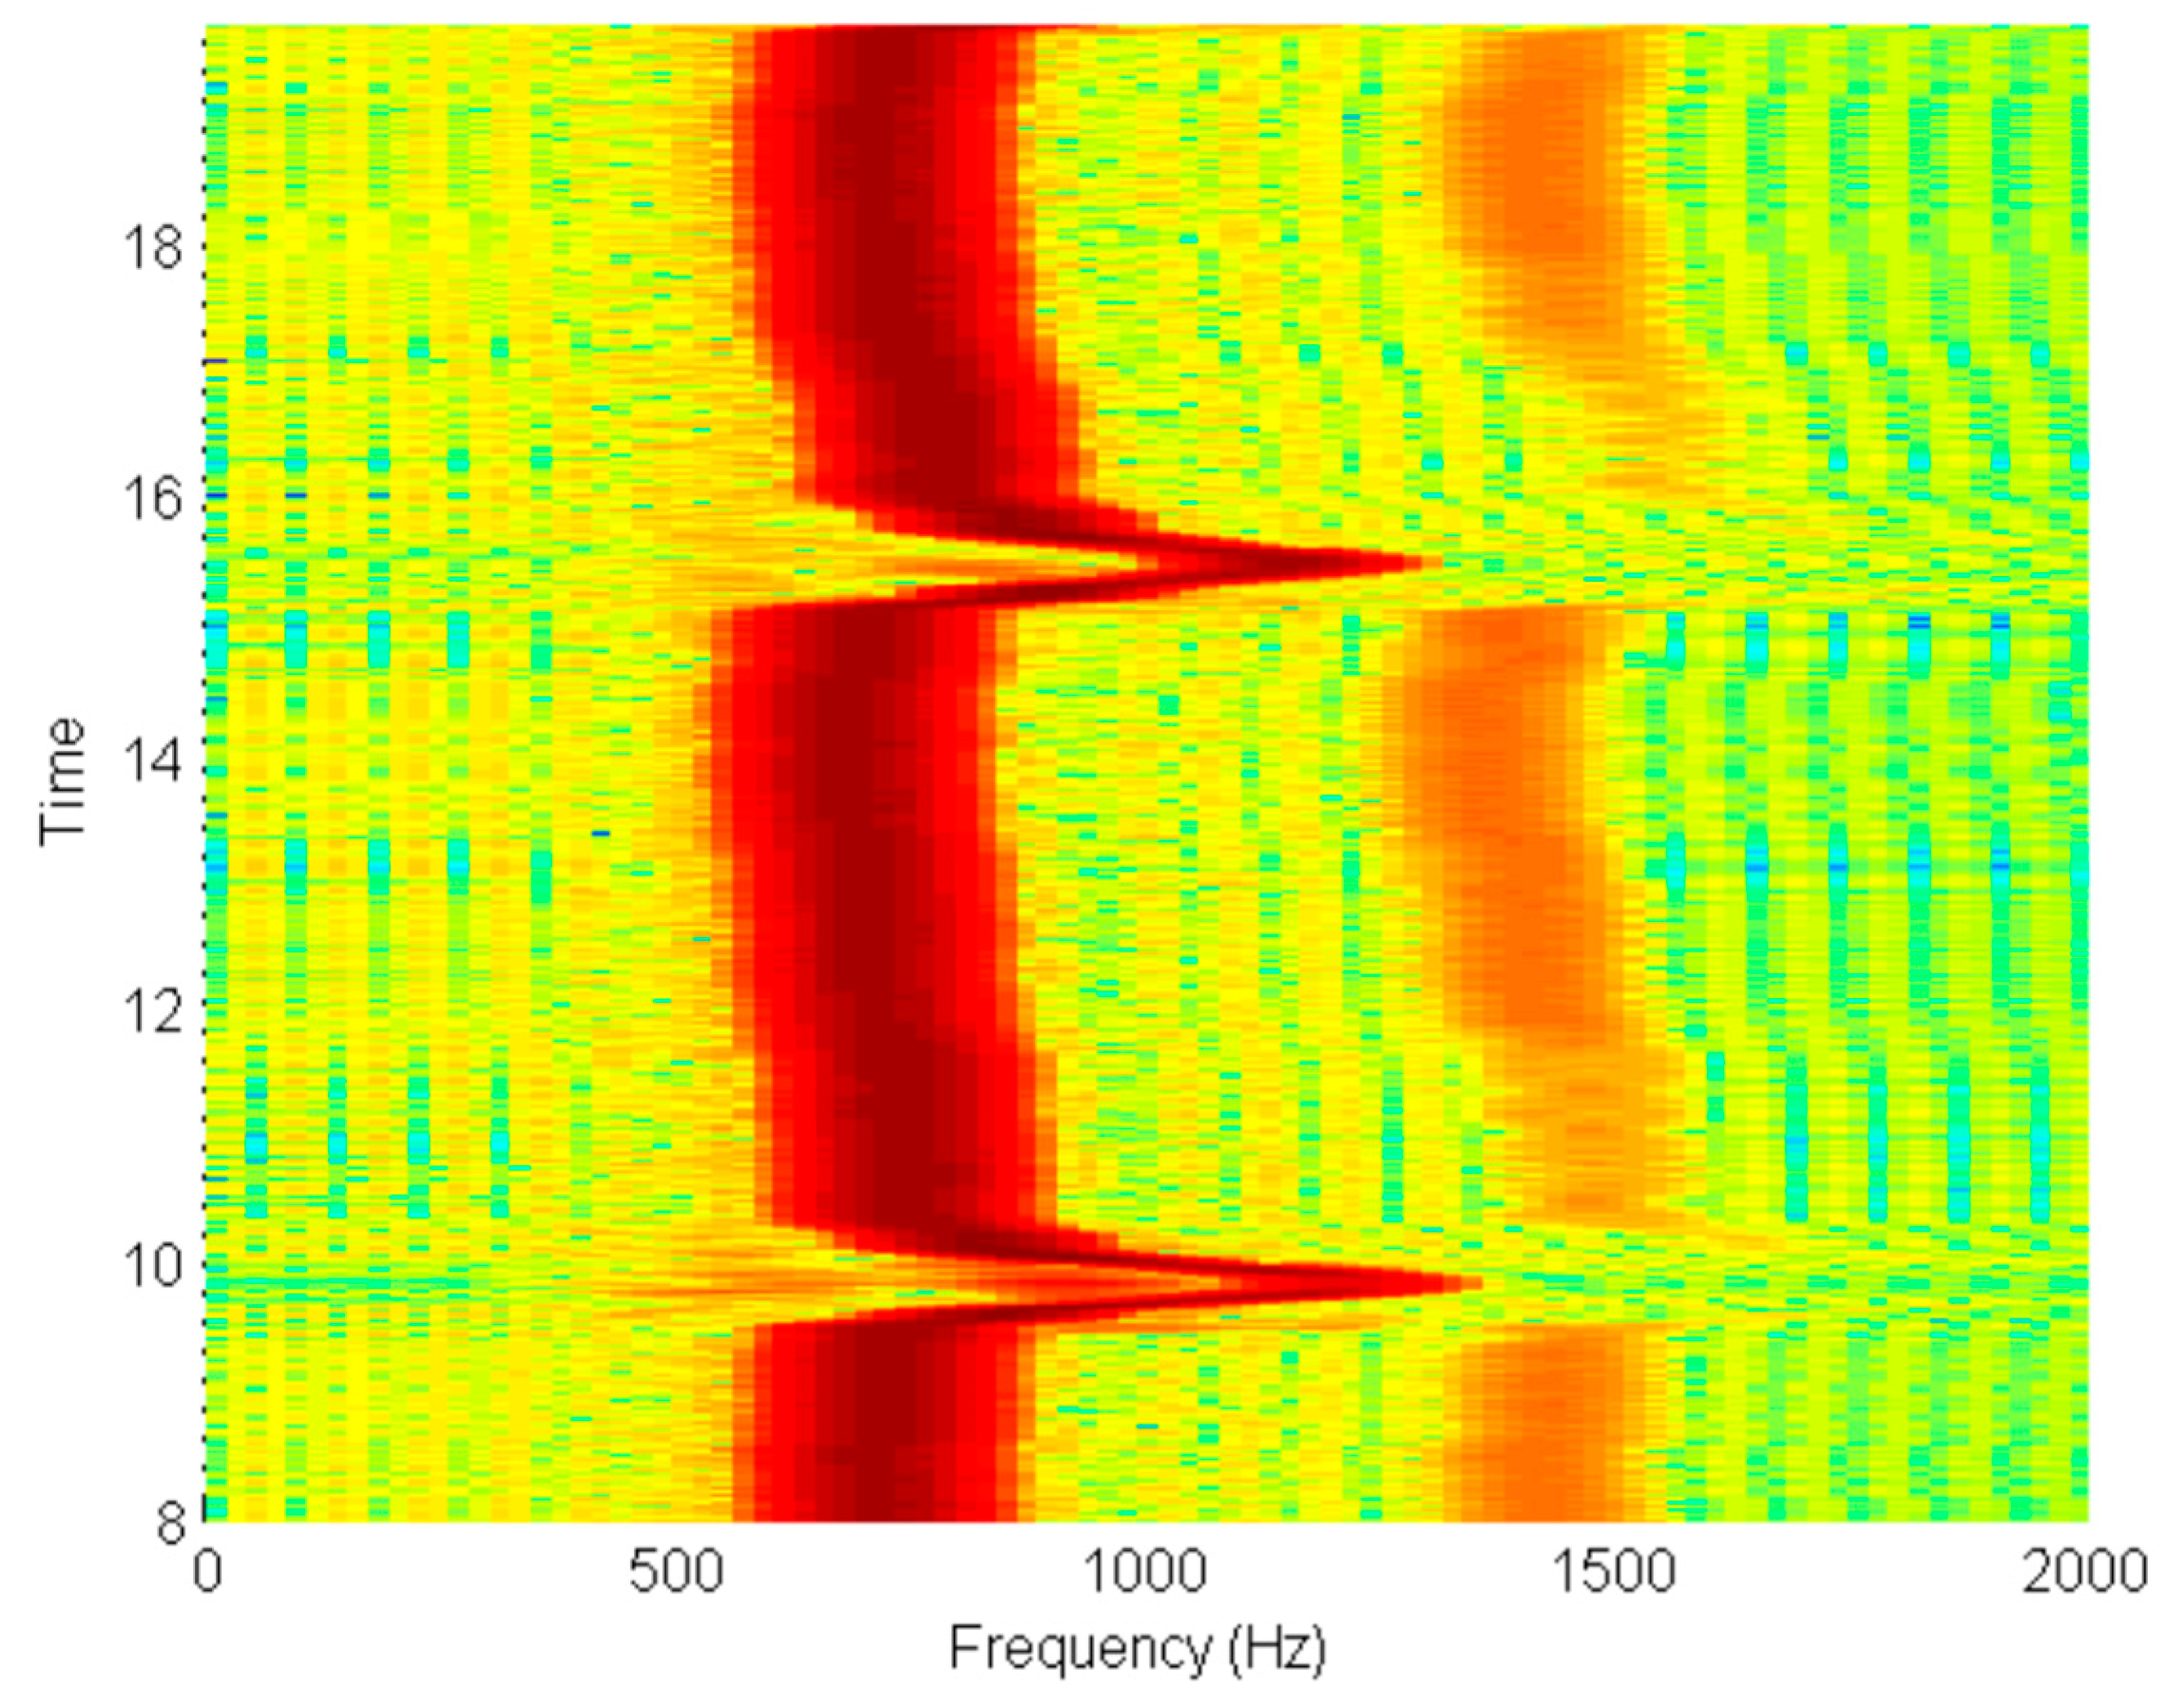
Figure 19.
Signal frequency extracted from spectrogram.
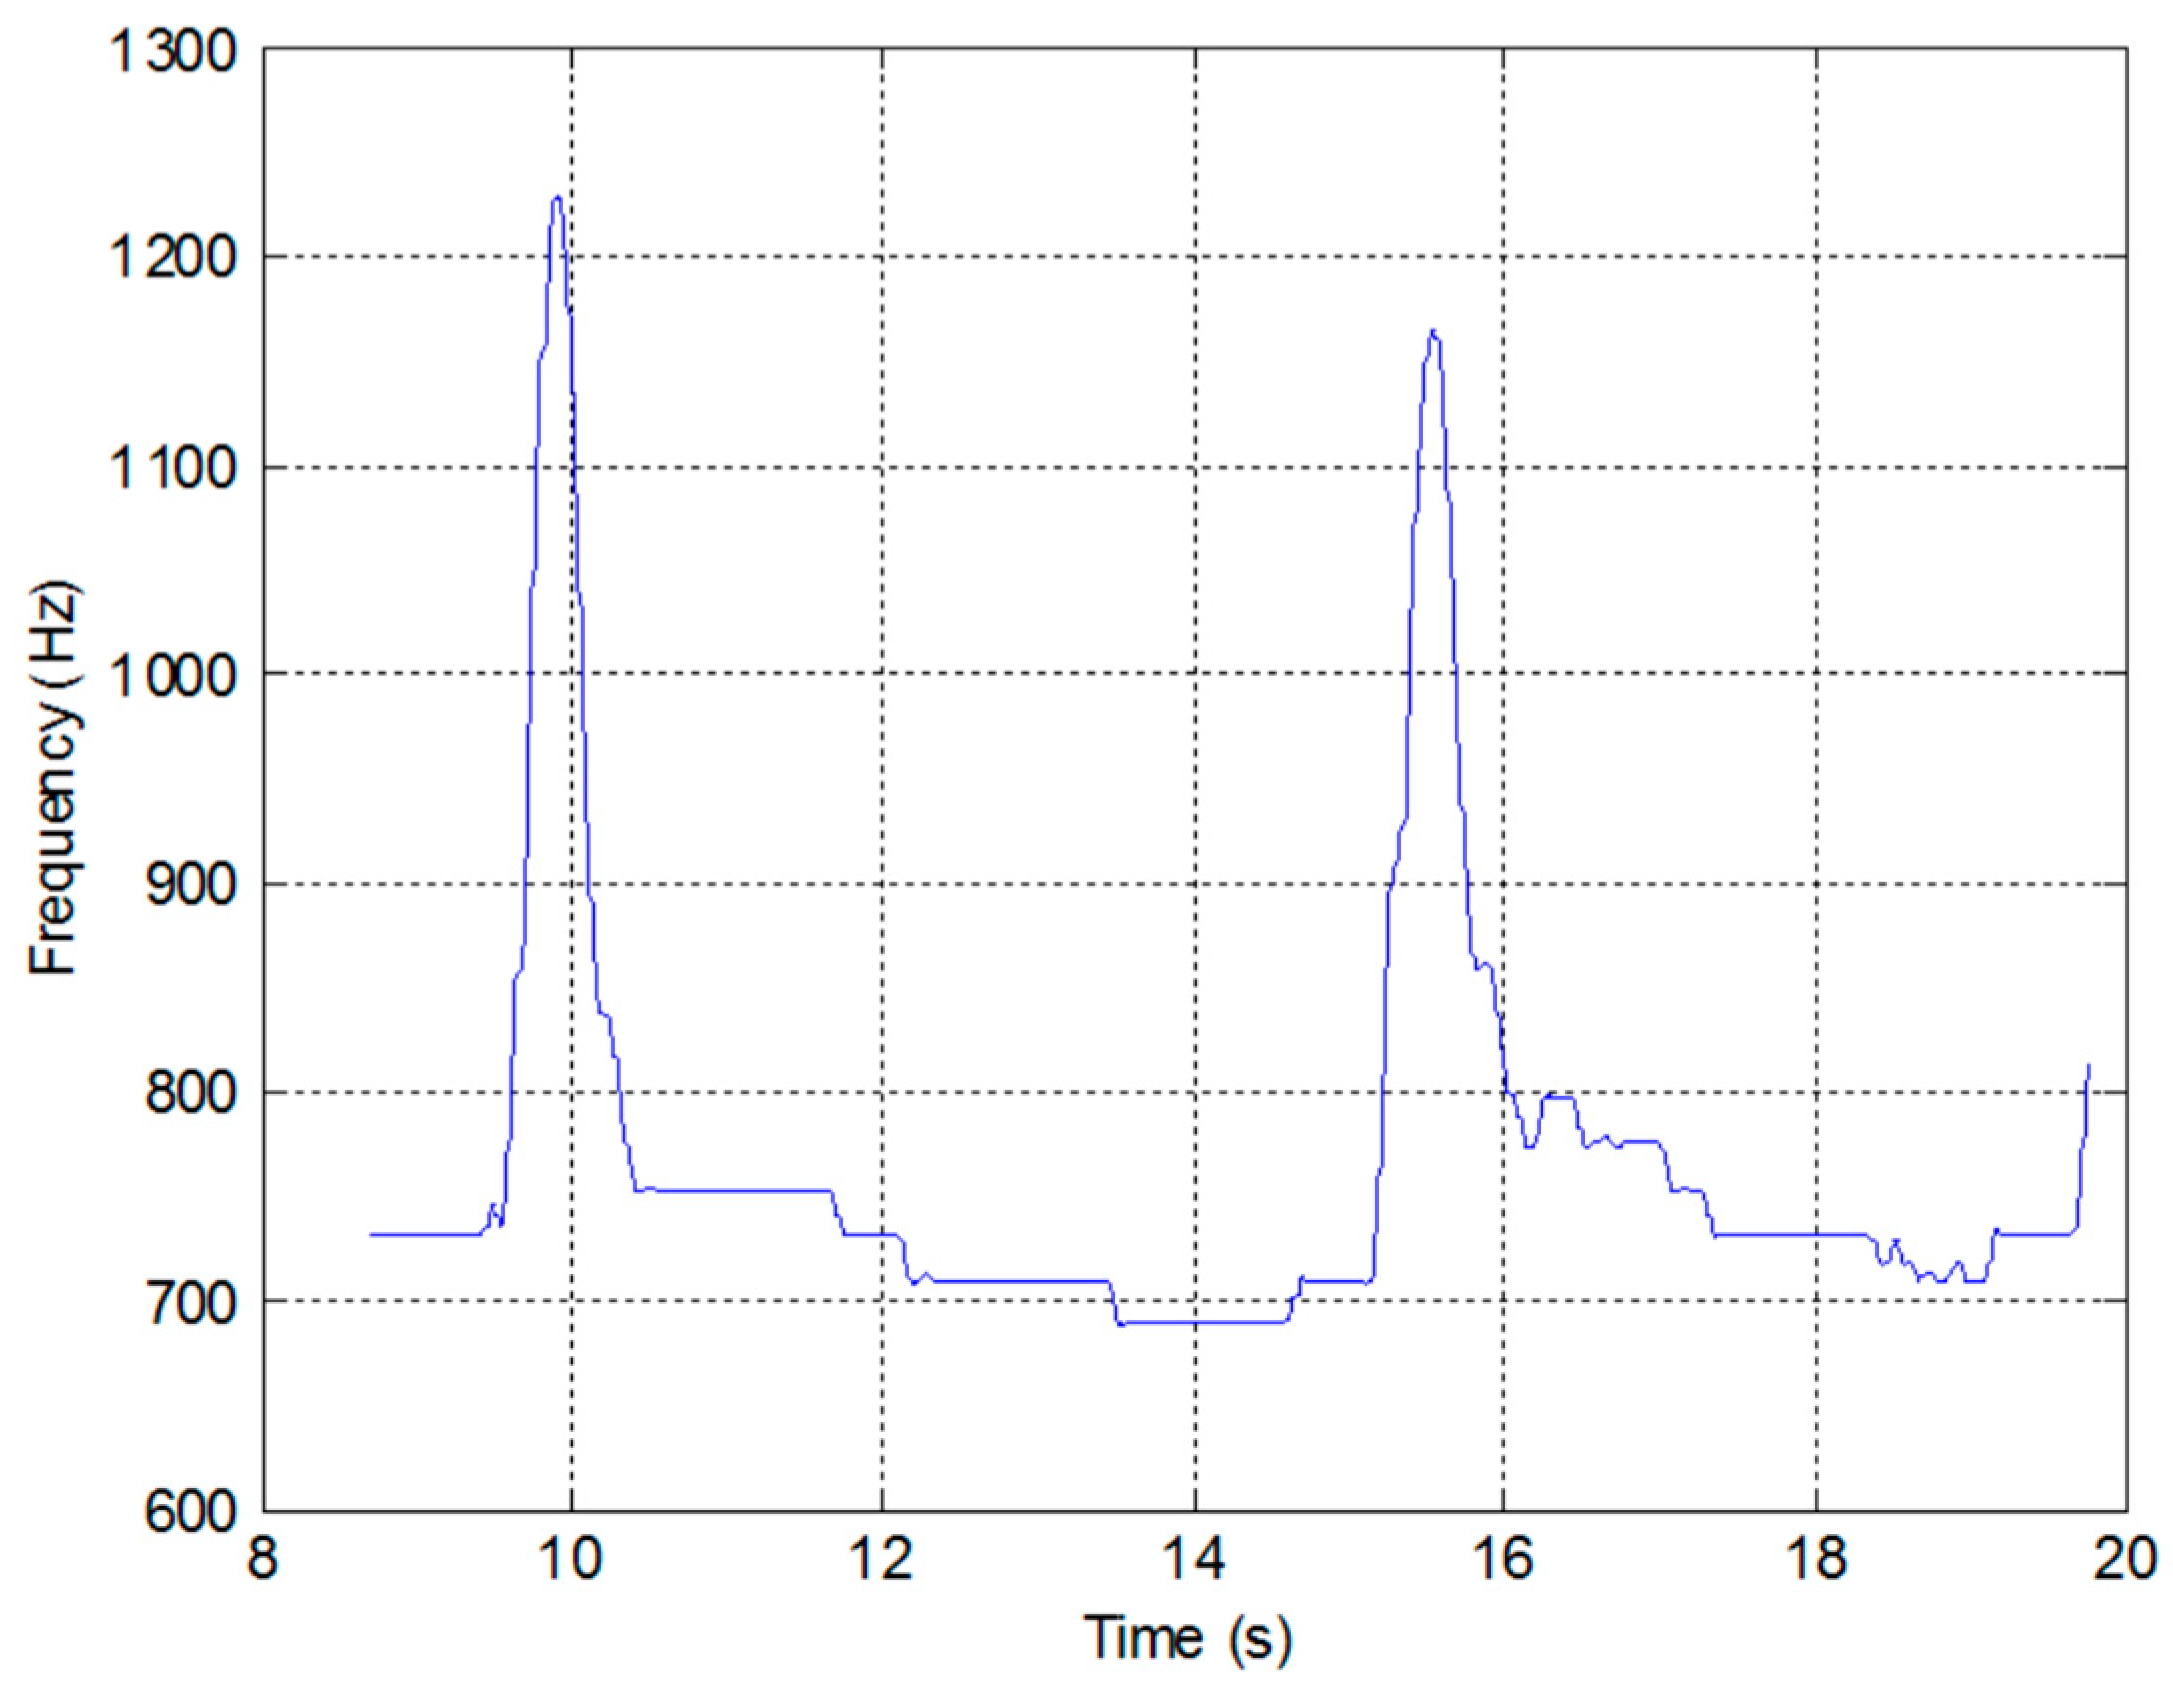
Figure 20.
Normalised flow velocity and flow volume obtained from the recorded data produced by the low-cost sensor.
Figure 20.
Normalised flow velocity and flow volume obtained from the recorded data produced by the low-cost sensor.

Figure 21.
Normalised flow velocity and flow volume obtained from the recorded data produced by the low-cost sensor.
Figure 21.
Normalised flow velocity and flow volume obtained from the recorded data produced by the low-cost sensor.
© 2020 by the author. Licensee MDPI, Basel, Switzerland. This article is an open access article distributed under the terms and conditions of the Creative Commons Attribution (CC BY) license (http://creativecommons.org/licenses/by/4.0/).
Share and Cite
MDPI and ACS Style
Brooker, G. A Telespirometer for the Developing World. Electronics 2020, 9, 275. https://doi.org/10.3390/electronics9020275
AMA Style
Brooker G. A Telespirometer for the Developing World. Electronics. 2020; 9(2):275. https://doi.org/10.3390/electronics9020275
Chicago/Turabian StyleBrooker, Graham. 2020. "A Telespirometer for the Developing World" Electronics 9, no. 2: 275. https://doi.org/10.3390/electronics9020275
Note that from the first issue of 2016, this journal uses article numbers instead of page numbers. See further details here.