A Study on the Analytic Power Estimation of the Electromagnetic Resonant Energy Harvester for the High-Speed Train


Department of Railroad Vehicle Research, Korea Railroad Research Institute, Uiwang 16105, Korea
Electronics 2020, 9(3), 403; https://doi.org/10.3390/electronics9030403
Submission received: 29 January 2020
/
Revised: 26 February 2020
/
Accepted: 27 February 2020
/
Published: 28 February 2020
(This article belongs to the Special Issue Energy Harvesting and Storage Applications)
Abstract
:This study is intended to identify the applicability of energy harvesting technologies that are regarded as new electrical power sources for the sensors on high-speed trains. The analytic estimation research is conducted on the amount of electric energy harvested from the high-speed trains, operating at a maximum speed of over 400km/h to verify the applicability of the energy harvesting technology converting the vibration energy of axle and bogie into electric power. Based on the data of the vibration acceleration on the axles and bogies, which were measured by using a 500 Hz analog filter, an analytic estimation on the amount of power harvested by an electromagnetic resonant harvester is conducted through the analysis of the main frequency. The power of the electromagnetic resonant harvester is based on a theoretical model of the mass-spring-damper system, and the harvested power from the axles and bogies in the vertical direction is analytically estimated in this study. The analytic calculations typically give the target value for the final performance of the electromagnetic resonant energy harvester. The targets of the analytic estimations are given to provide the basis for the detailed design and to give a basis for defining the basic design parameters of the electromagnetic resonant energy harvester.
1. Introduction
Today’s technological advancements have reduced the power consumption of wireless sensors and have opened new opportunities in structural health monitoring. However, the need for a continuous power supply is still a challenge [1]. The requirements for an extended period of power supply for wireless sensors caused the need for alternative energy sources. Energy-harvesting technology is a possible method to increase the power supply of wireless sensors by utilizing an environmental energy source. Among the various environmental energy sources, vibration energy exists in various structures, and it is attracting attention as an energy source that could be harvested, thereby supplying the power to wireless sensors [2,3]. The energy harvesting from vibration energy has been inserted into various types of wireless sensors that can be used to monitor the health condition of complex systems such as bridges [4,5,6,7], pipelines [8], and wind turbines [9,10].
The same issue occurs in the trains [11]. The high-speed operation of the train makes reliability and safety of paramount importance, and consequently, the cost of train maintenance is increased. Thus, efforts would need to be made to develop new technology that is capable of meeting both requirements for reliability and safety while taking maintenance costs into account. For that, the ‘intelligentization’ of the train is needed. The basis of train intelligence is the development of real-time sensing technology, which requires the construction of an intelligent monitoring system incorporating IT technology. The monitoring system is needed for the early detection of abnormal conditions to prevent system failure and accidents [12,13,14]. The high-speed train mostly uses the wired sensors for the monitoring system [15]. Recently, the demand for a monitoring system using a wireless sensor is gradually increasing; however, there are limitations at present regarding the installation and the difficulty of accessing high-speed trains. In particular, when applied to the monitoring system of the high-speed train using wireless sensors and IT technology, maintenance based on real-time conditions during driving becomes possible, which differs from the methods currently used in maintenance management such as periodic disassembly and inspection. As a result, the reliability and stability of the train can be improved [16].
However, even in the case of wireless sensors with less installation and location constraints, the power supply problem must be solved for the innovative monitoring system. As the current energy density increase rate of the battery does not meet the demands of the application, periodic battery replacement is necessary for real-time or long-term monitoring of the high-speed train. The battery replacement, which consumes energy continuously is a limited resource, is non-environmentally friendly, and generates additional maintenance tasks [17]. Therefore, the intelligent monitoring of high-speed trains requires the development of environmentally friendly and semi-permanent ‘energy harvesting’ powered monitoring technology through the use of exploiting the ambient energy generated during system operation.
Energy harvesting module research using electromagnetic induction should analyze the characteristics of mechanical motion [18]. Mechanical motion characteristics can be classified as vibration or rotational motion according to the energy source [12,19]. In this study, vibration acceleration was selected as the main energy source. It is possible to establish the equation of motion by analyzing the periodic motion characteristics of a “spring-mass-damper”, which is the basic system of vibration, and predicting the amount of power generated according to the effects of mass, spring, and damping, which are the major design factors of the energy harvester [20,21,22].
In this study, to verify the applicability of the energy harvesting technology that produces electric energy from a vibration energy source according to the operation of a high-speed train, an analytic estimation study is carried out on the amount of energy harvested from the vibration acceleration of a high-speed train. The power of an electromagnetic resonant harvester is based on a theoretical model of the mass-spring-damper system and the harvestable power from axles and the bogie in the vertical direction are analytically estimated in this study. The analytic calculations typically give the target value for the final performance of the electromagnetic resonant energy harvester. The targets of the analytic estimations are given to provide the basis for the detailed design and to give a basis for defining the basic design parameters of the electromagnetic resonant energy harvester.
2. Measurement of Ambient Energy during Operation of Railroad System
2.1. Vibration Acceleration for Energy Harvesting Measurement Position and Sensors
In this study, the measurement test of vibration acceleration in the railroad system was performed on a high-speed train, traveling at over 400 km/h.
As shown in Figure 1, acceleration sensors were installed for the real-time measurement of vibration acceleration occurring in the ① axle and ② bogie frame during the operation of the train. The vibration acceleration sensor (range: ± 50 G, sampling rate: 1 kHz) of the installation position ① axle was installed to measure the vibration acceleration value generated by the contact between the rail and the wheel while driving without shock absorbers. The vibration acceleration sensor (range: ± 25 G, sampling rate: 1 kHz) located at position ② bogie frame was installed to measure the vibration acceleration values at various suspensions points of the bogie and the axle as well as the bogie frame itself. In addition, in order to confirm the speed and position of the train for the measured values of each sensor, real-time speed and position information were recorded together with a speed sensor installed on the axle.
2.2. Results of Vibration Energy Source Measurement during the Train Operation
First, this study analyzed the results of vibration energy sources measured by the method described above. In the case of the vibration acceleration, it was measured that the vibration acceleration value occurred significantly in both positions ① axle and ② bogie frame at high speed.
As shown in Figure 2, the vibration acceleration value generated by the contact between the rail and the wheel of a high-speed train was measured on the axle and the bogie without shock absorber, and it was confirmed that a very large value of about ± 40 G was generated as the instantaneous maximum value. In addition, the vibration acceleration measurement result measured at the center of the bogie frame—as shown in Figure 3, it is attenuated by various suspensions elements of the bogie, the axle, and the bogie frame itself—is much smaller than the vibration acceleration of the axle but was confirmed to still be considerable vibration acceleration, occurring at ± 8 G. In particular, the high-speed trains selected for this study were subjected to ambient energy measurement tests during the first run after regular maintenance work. Therefore, since the damage to the wheels generated during the normal operation of the train is removed, the vibration acceleration results are assured to be without abnormal vibrations caused by wheel damage. Therefore, even under these driving conditions, as shown in Figure 2 and Figure 3, very large vibration acceleration was measured during driving, and the values from the metro, freight train, etc., may be larger than the high-speed train vibration acceleration results measured in this study.
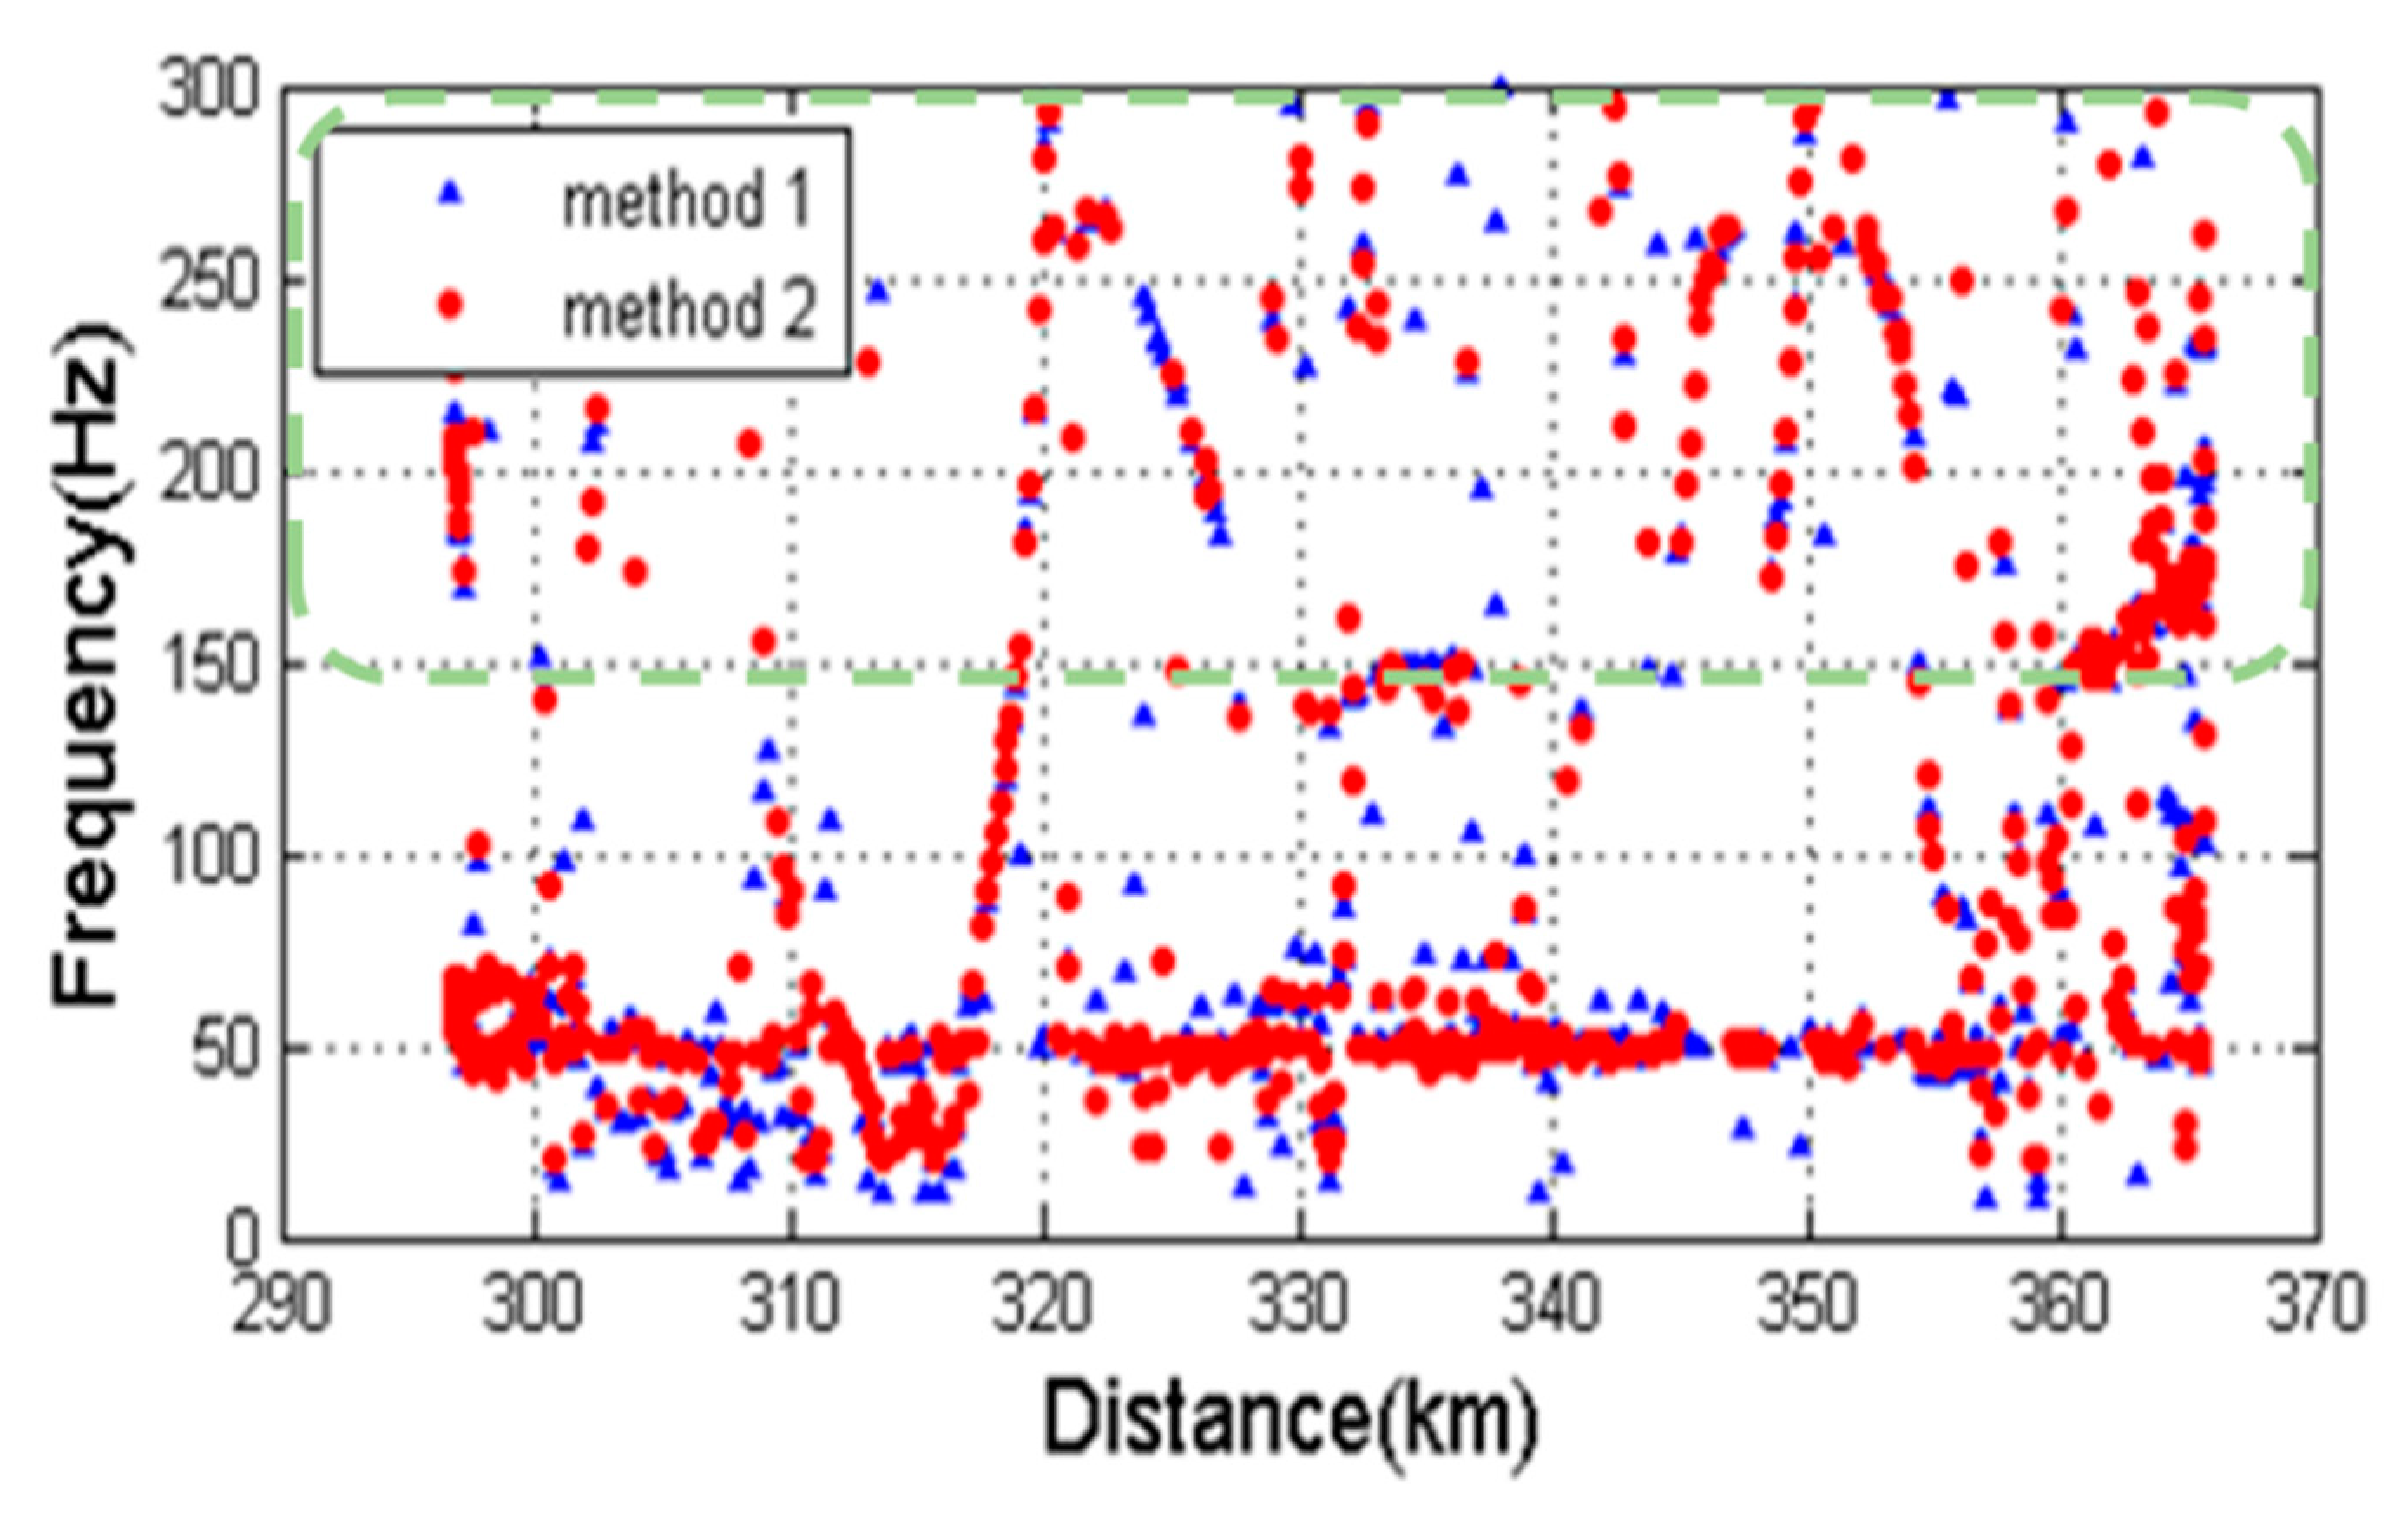
The frequency analysis was performed on the acceleration data obtained from measurements at each position. “Method 1” of the frequency analysis graph is to take the maximum value and the frequency component at that time after the Fast Fourier Transform (FFT) frequency analysis on the vibration acceleration every 2 seconds at each installation position. “Method 2” takes the maximum value and the frequency component at that time after smoothing to the 10 Hz band after the FFT frequency analysis for the vibration acceleration data at each installation position every 2 seconds. The frequency analysis results were compared with the train traveled position (distance), which was indicated by the number of kilometers of distance away from the starting point of the track, and the frequency change according to the distance traveled was analyzed. As a result of the frequency analysis using these two methods, it was determined that the vibration acceleration measured in the axle and bogie were different in the frequency range, as shown in Figure 4 and Figure 5. In the case of the axle, the vibration acceleration value is shown in the range of 300 Hz or less, but the acceleration measured in the bogie is shown to be concentrated in the range of 150 Hz or less due to the attenuation by the suspension devices. The difference of vibration acceleration is apparent in the green color dash area of Figure 4 and Figure 5.
3. Estimation of Energy Harvesting Power during the High-Speed Train Operation
Energy harvesting using kinetic energy such as vibration acceleration that occurs during the train operation is more applicable when compared to other energy sources. In general, energy harvesting using kinetic energy uses the principle of converting kinetic energy into electrical energy by mechanical deformation or the vibration of a structure, and various conversion technologies such as the piezo material and electromagnetic effects are used as the conversion technology [23,24].
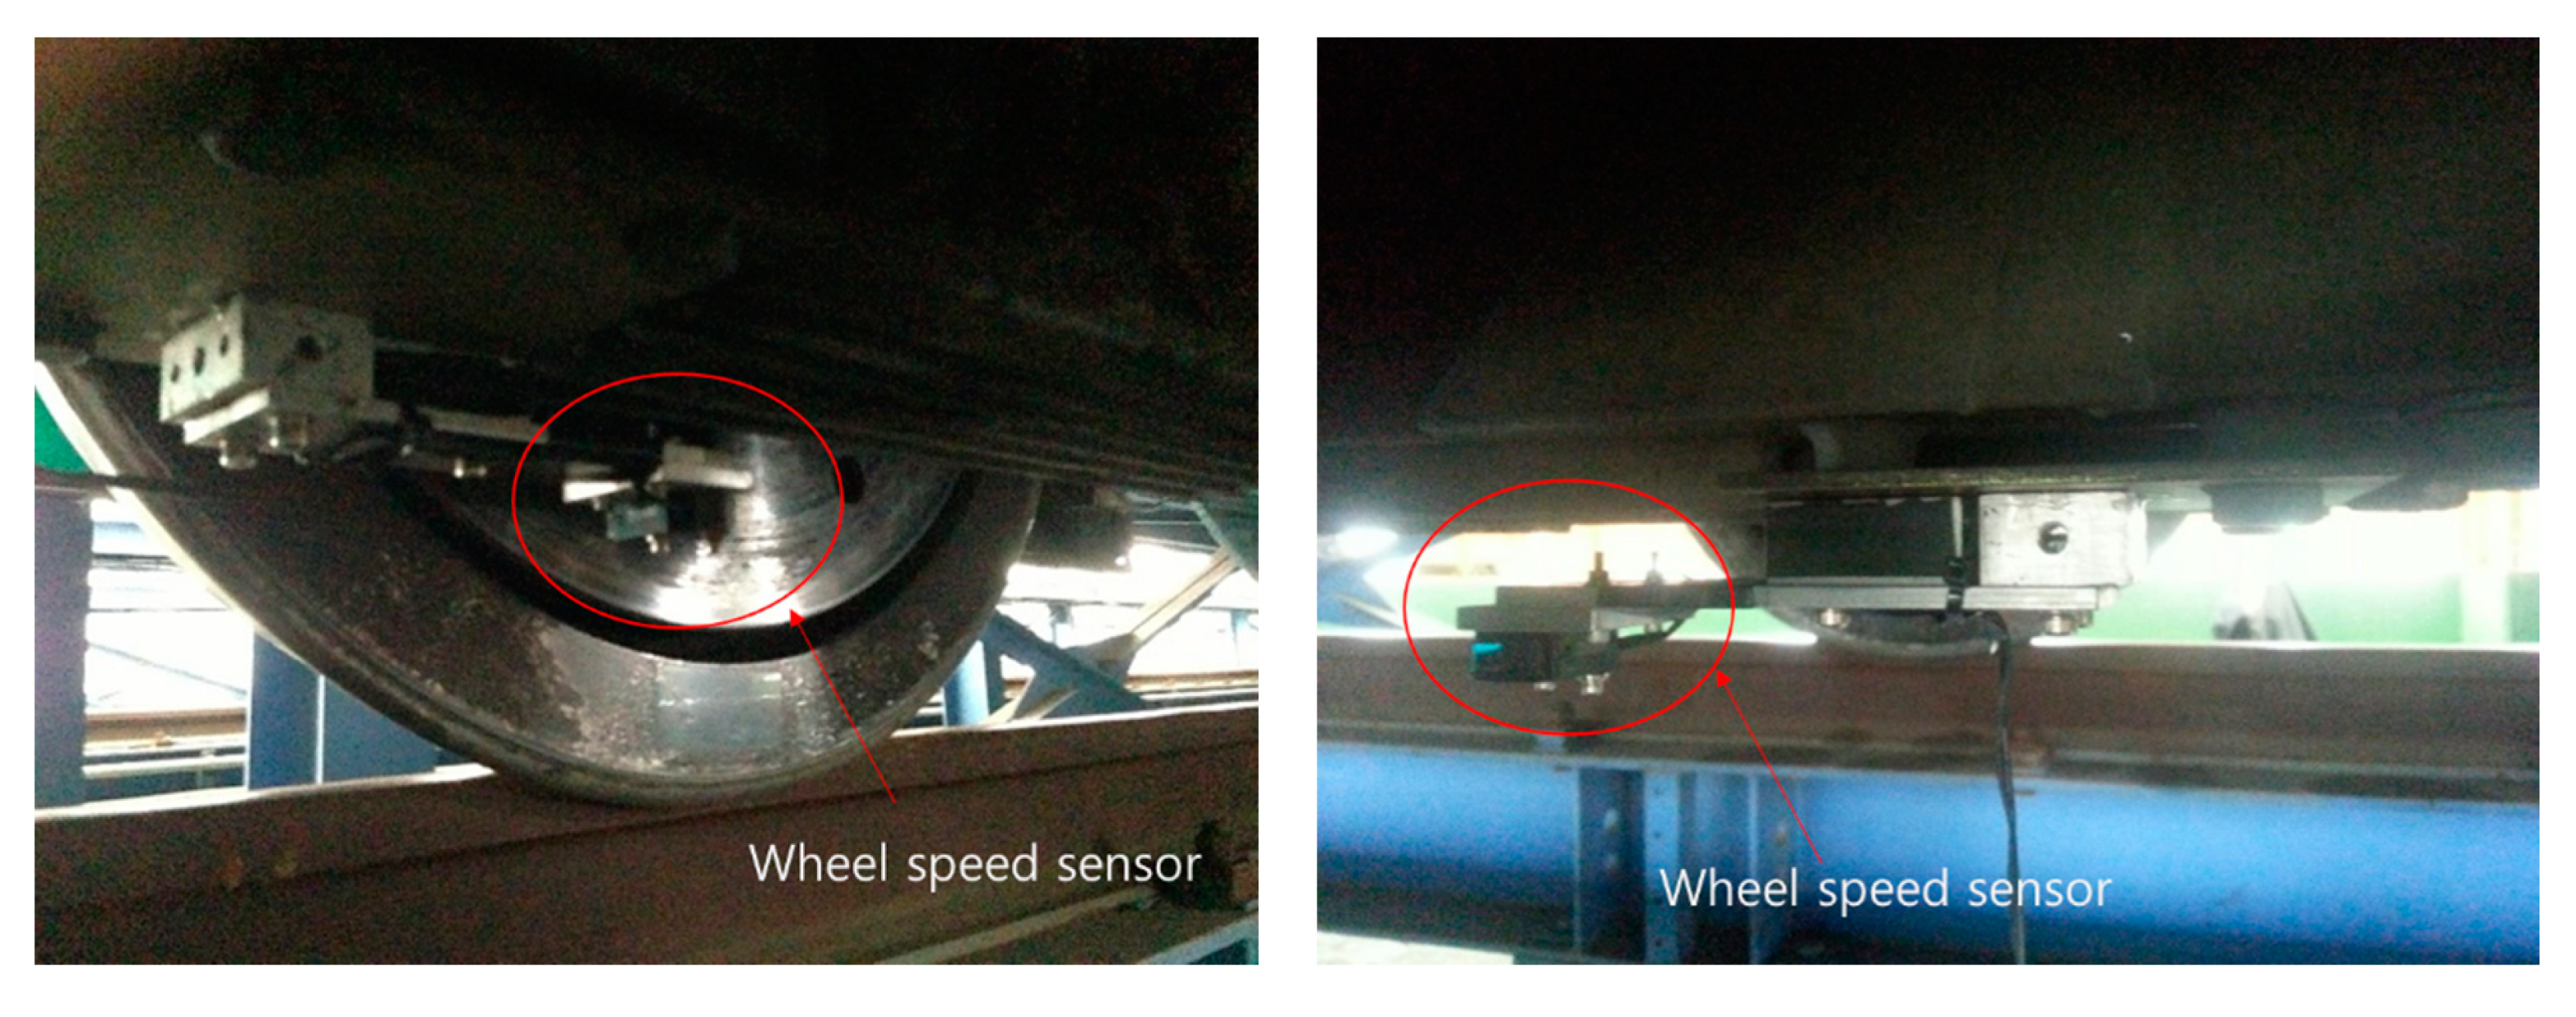
In this study, based on the vibration acceleration data measured at the axle and bogie, the energy harvesting power of the electromagnetic resonant energy harvester, which is in consideration of the durability of the energy harvester and the power quantity [25,26,27], is predicted. For reference, in order to compare the vibration acceleration with the operational speed, a reflective-type laser wheel speed sensor was installed on the lower part of the bogie as shown in Figure 6, and the operation speed was synchronized with the vibration acceleration data.
3.1. Computation Spectrograms
The frequency at which the electromagnetic resonant energy harvester is tuned should be selected so that the amplitude of the vibration acceleration frequency is as high as possible considering the train speed. In order to find a suitable frequency, the spectrograms of the measured vibration accelerations are computed with respect to the train speeds. These spectrograms show the vibration acceleration amplitude spectrums at certain frequencies with different train speeds as a 3D diagram. The spectrograms are computed using the following procedure:
- The data is divided into segments of 213 samples (8.192 seconds when the sample time is 1 millisecond).
- Acceleration is checked for anomalies (low-frequency drift, sensor limit hits). If anomalies are found, the segment is rejected.
- The mean-squared spectrum (MSS) of the vibration acceleration during the segment is computed using a Hamming window length 211 (frequency resolution 0.49 Hz) with a 50% overlap. The spectrum is transformed into an amplitude spectrum.
- The train velocity change (max–min) during the segment is computed, and the segment is rejected if it is more than 10 km/h. (The purpose of this is to reduce the effects of frequency modulation of vibration signals due to train velocity changes).
- The mean value of the train velocity during the segment is computed.
- The spectrums and mean velocities from all accepted segments are saved.
- The segment data from all accepted test runs are combined, sorted according to the mean velocity, and plotted as a 3D spectrogram.
However, when computing the spectrograms, it appeared that in spite of analog low-pass filtering of the acceleration signals, there exist some frequency folding effects. Figure 7 shows the spectrogram example of vibration acceleration on the axle at the vertical direction of the right side of the number 6 axle: V_Ax06_R. The folding (downward wisps) appears significantly at high frequencies (> 300 Hz). For this reason, the frequency scale of the spectrograms in the following, as shown in Figure 7, is limited to 200 Hz. The wheel rotation speed, in which the wheel diameter is 860 mm, is an integer multiple that has harmonic frequencies, and these are plotted as red lines in the spectrograms. The acceleration data are quantized with steps of about 0.0126 G (= 0.224 m/s2, ± 50 G sensor with a 13-bit AD-converter). Some quantization noise of the measurement data occurs. The downward wisps in Figure 7 are caused by frequency folding between 500 and 1000 Hz. The folding appears strongly at high frequencies at high speeds and less strongly at middle frequencies at high speeds.
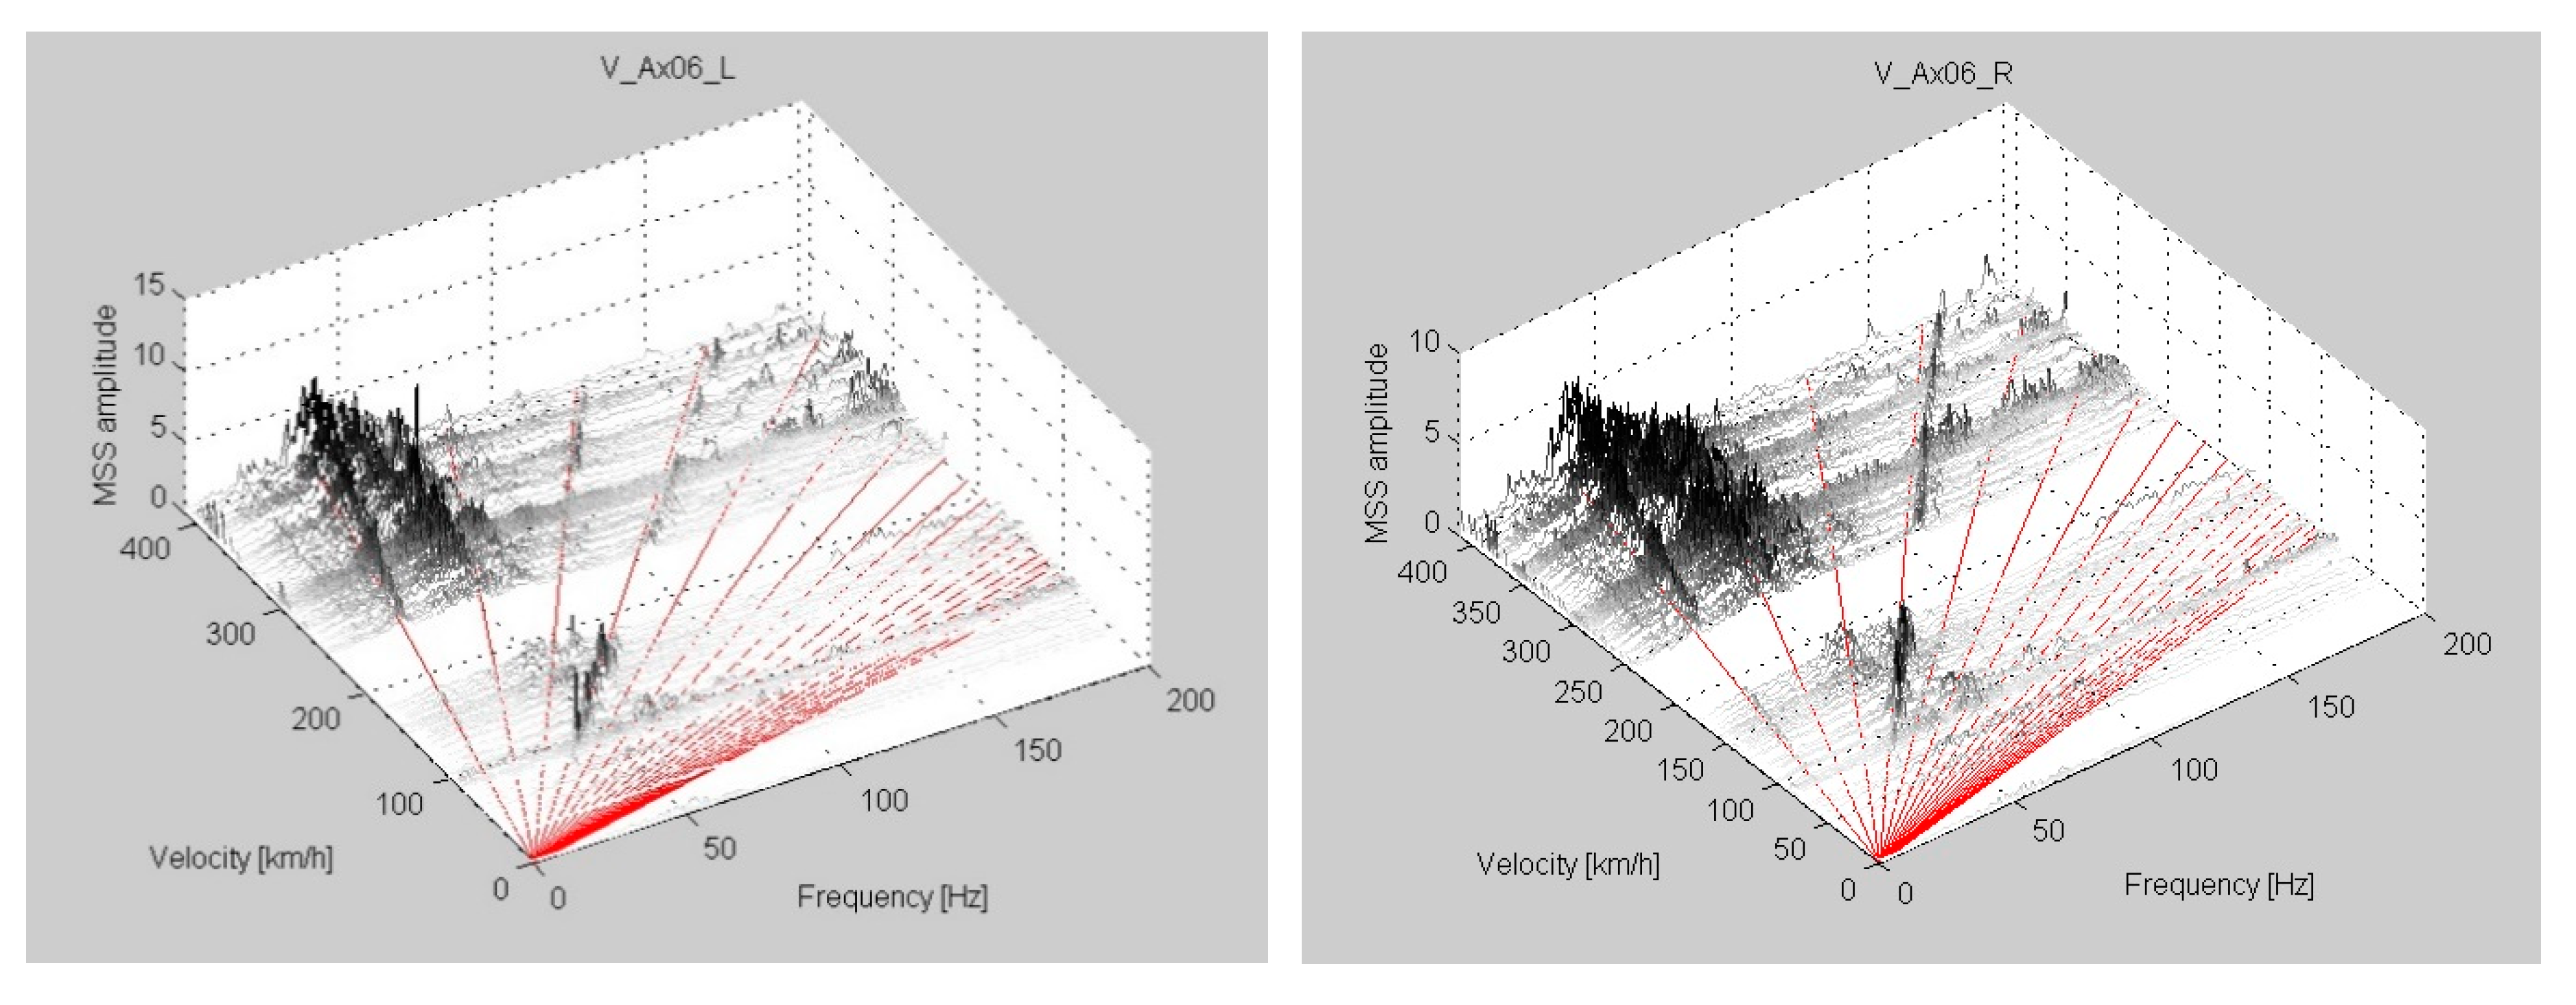
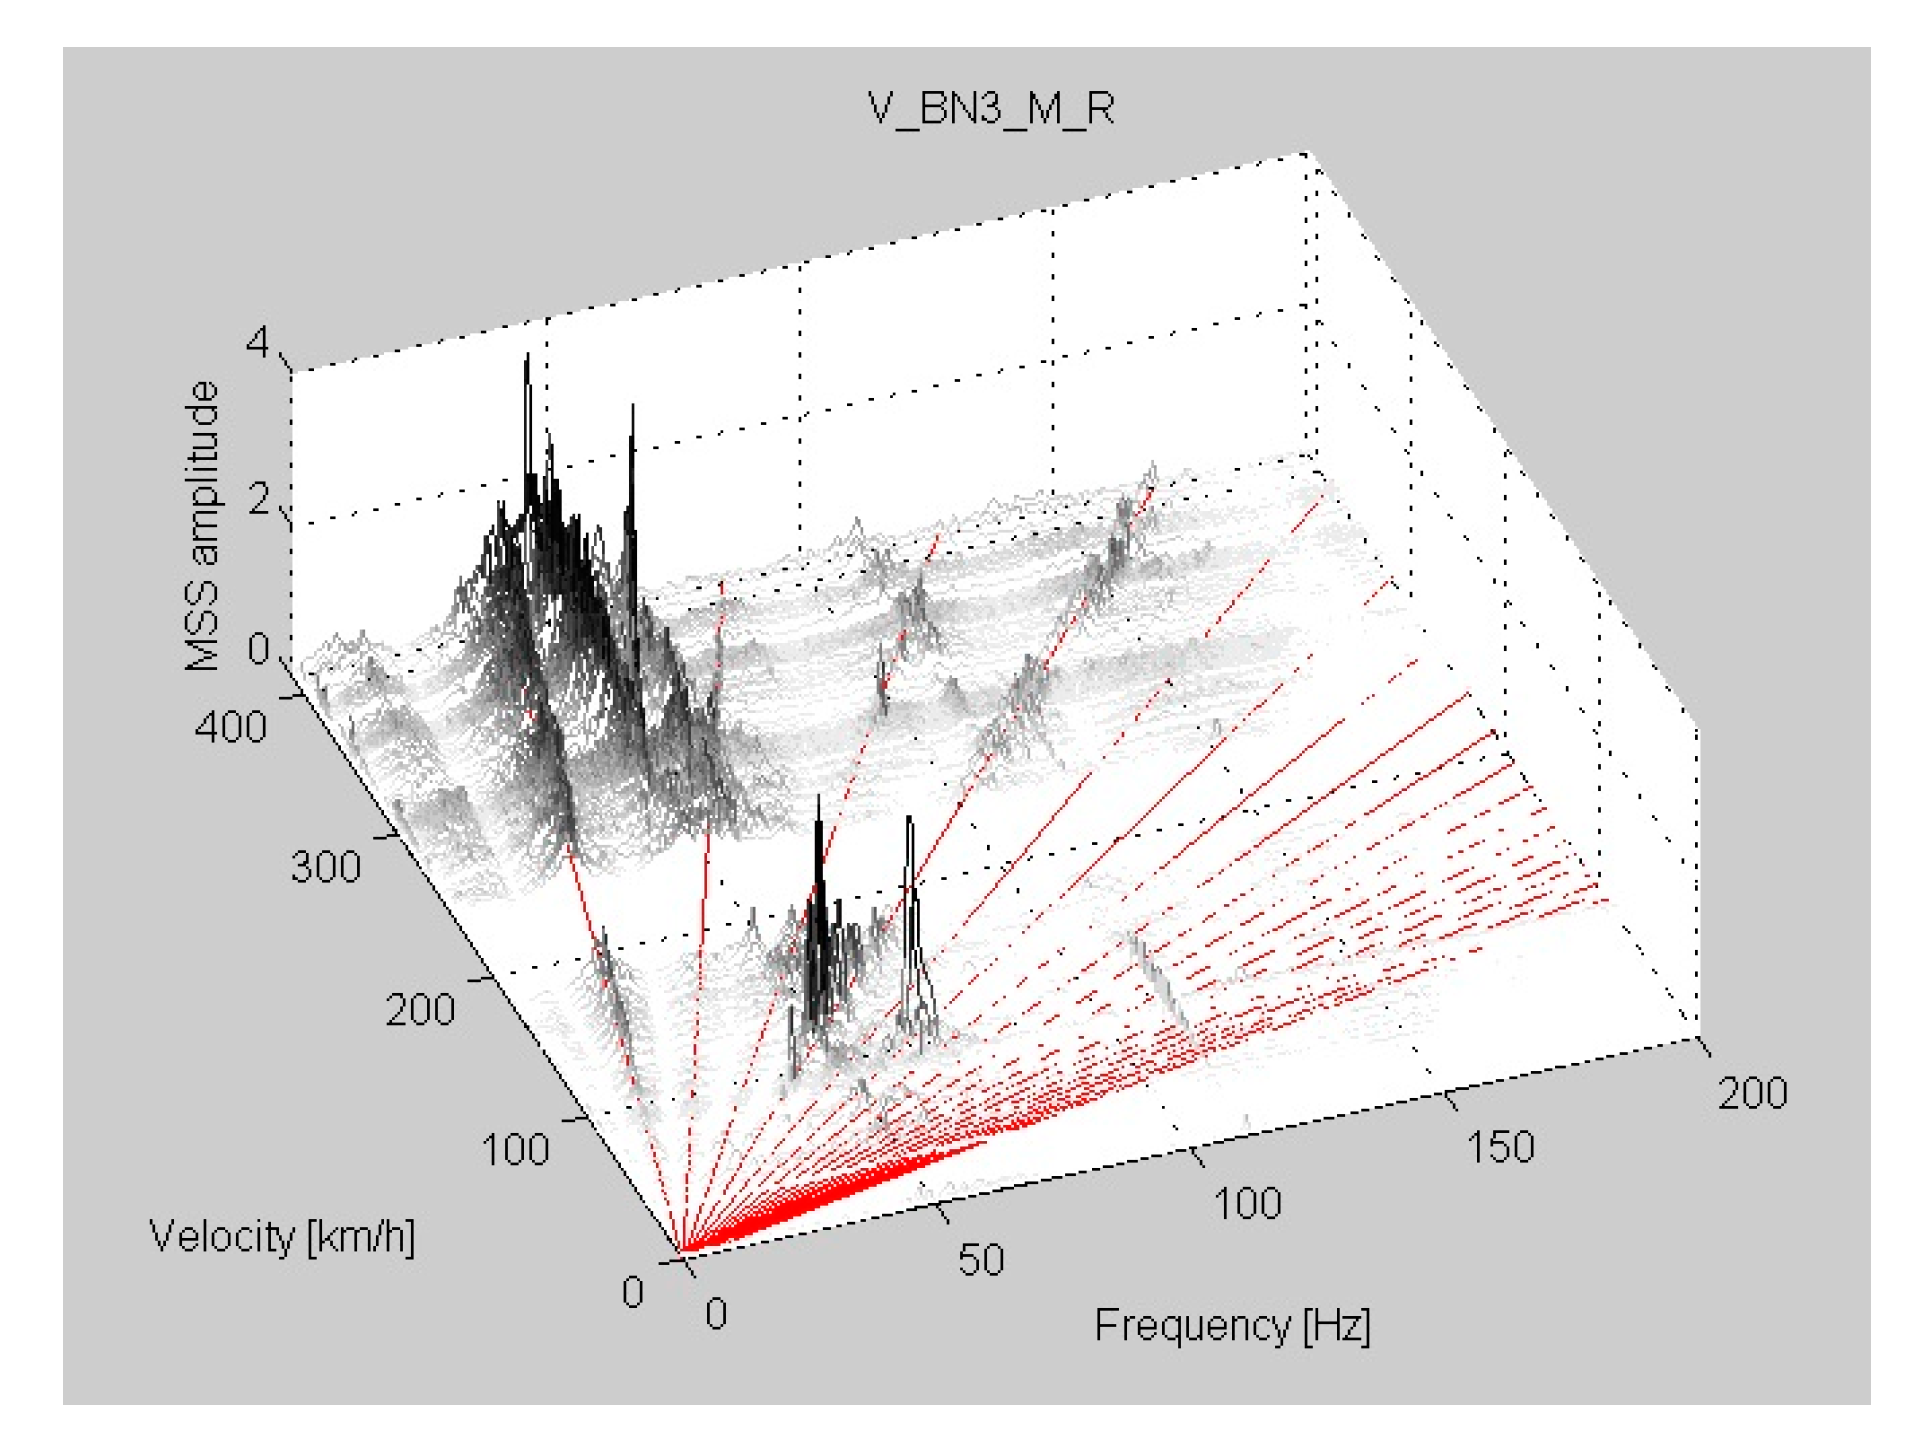
The segment data from all test runs are combined, sorted according to mean velocity, and plotted as a 3D spectrogram. Then, the spectrograms of the vertical vibration measurements from all axles and bogie are shown in Figure 8 and Figure 9. From here, V_Ax06_L and V_Ax06_R are values of the vertical direction of each left and right side on the number 6 axle. V_BN3_M_R is the value at the vertical direction of the right side of the number 3 bogie, which is at the middle position (center) of each coach car.
The rotation speed (in Hz) of the wheels with respect to train speed is also analyzed. This speed and its integer multiples (harmonic frequencies) are plotted with red lines in the spectrograms. It can be noted that the vibration frequencies mostly follow the harmonic frequencies of the wheel rotation except around 50 Hz, where the excitation seems to occur at around 1.5 times the wheel rotation speed at higher train speeds. In order to find the best frequencies for the resonant energy harvester, the mean spectrums across all train velocities are shown in Table 1. Table 1 lists the main peak frequencies for the axle and the bogie. It can be noted that the frequencies of 50.3 Hz and 61.0 Hz are the candidates for energy harvesting in the axle. Note that 45.9 Hz is also a good candidate for the main peak frequency of the bogie for energy harvesting.
3.2. Analytic Estimation of the Energy Harvesting Power on the Railroad System
Figure 10 shows a schematic diagram of the mass-spring-damper system and vibration energy harvester, which consists of a mass (m) on a spring (k). When the generator is vibrated, the mass moves out of phase with the generator frame, so that there is a net movement between the mass and the frame. This relative displacement is sinusoidal in amplitude and can drive a suitable transducer to generate electrical energy. The transducer is depicted as a dashpot, d, because the conversion of mechanical energy into electrical energy damps the vibration [28].
In sinusoidal vibration, the power dissipated by a mass-spring-damper system when its base is vibrating at its natural frequency can be calculated as follows [28,29,30]:
where:
- is the dissipated power [W]
- m is the vibrating mass [kg]
- A is the vibration acceleration amplitude of the frame of the mass-spring-damper system [m/s2]
- is the undamped natural frequency of the mass-spring-damper system [rad/s]
- is the total damping ratio [–]
In addition to the vibrating mass, the design of mass-spring-damper systems is limited by the device size. The maximum power output from a mass-spring-damper based on a vibration energy harvester is obtained when the mass is moving without hitting limits.
In this situation, the amplitude of the mass vibration at the undamped natural frequency can be calculated as follows:
where:
- D is the amplitude of the mass vibration with respect to the frame of the mass-spring-damper system [m]
The total damping ratio consists of a parasitic damping ratio caused by mass-spring-damper mechanics and the electric damping ratio is caused by the energy converter and the energy harvesting electronics as follows:
The harvestable electric power (including the losses of the energy converter and the energy harvesting electronics) can be calculated as follows:
In the optimal case, the parasitic damping is zero. However, mechanical damping is always present to some extent. On the other hand, the harvesting electronics alone do not necessarily provide enough damping to keep D within the limits set by the mechanics of the mass-spring-damper system.
The electric damping ratio () depends on the energy converter (electromagnetic, electrostatic, piezoelectric), the energy harvesting electronics, and the payload connected to it (sensor, radio transmitter, etc.). If all the other parameters in Equation (4) except is fixed, the maximum value of the harvestable electric power () is attained by condition = , which can be easily seen by differentiating the right side of Equation (4) with respect to , marking the derivative set to zero and solving for . The related harvestable electric power () and vibration amplitude () are:
However, the condition = may lead to too high of a mass vibration amplitude () with respect to the limits of the mechanical dimensions of the energy harvester. In this case, the vibration amplitude can be reduced by increasing .
According to Equations (4)–(6), the design drives of the energy converter and the electronics connected to it for optimal energy acquisition are as follows.
Keep the electric damping as close as possible to the parasitic damping .
If the vibration amplitude D produced by the previous condition surpasses the limits set by the mechanical dimensions, increase . so that D is as close as possible to its maximum allowed value.
Minimize the electric losses of the energy converter and the energy-harvesting electronics.
The performance of many reported energy harvesters was measured and compared in [18,19,20,21,22,23,24,25,26,27,28,29,30,31,32]. Generally, the obtained power was well below 20% of the maximum with a rising trend in device volume (largest 10 cm3) and a decreasing trend in natural frequency.
However, the vibration excitation of the mass-spring-damper-system based on an energy harvester spreads over a wider frequency band on the train. In this case, the harvestable energy can be estimated by analyzing the vibration measurement sample sequences taken from the target application.
The dependency between the movement of the mass-spring-damper system frame and the relative movement of the mass with respect to the frame can be modeled by the following differential equation [31]:
where:
Moreover, k and depend on m, , and as follows:
Based on Equations (7)–(9), the following Laplace-domain transfer function can be derived:
where:
- s is the Laplace variable [rad]
- V(s) is the Laplace transform of , i.e., the relative velocity of the mass with respect to the frame
- A(s) is the Laplace transform of , i.e., the acceleration of the frame.
The power dissipated by the damping is the product of the relative velocity of the mass [] and the damping force influencing the mass []:
Assuming that the electric damping is 50% of the total damping, the harvestable mean power level during the period from time to time can be estimated from v(t) by the following equation:
Similar to Equation (10), the following transfer function for the relative position of the mass can be derived:
where:
- Z(s) is the Laplace transform of , i.e., the relative position of the mass with respect to the frame
By eliminating A and from Equations (2)–(4), the following equation for estimating the relative vibration amplitude D can also be derived:
Equation (14) is useful for estimating the relative amplitude of the mass vibration especially with lower values of , by which the relative vibration of the mass is closer to a sinusoidal movement.
4. Results
The procedure for analyzing the energy availability from each vibration measurement sample sequence is based on the Equations (10)–(13). The undamped natural frequency of the harvester () was selected according to Table 1. The selected frequency was 50.3 Hz for axle signals and 45.9 Hz for bogie signals. The total damping ratio () was set to values 0.1, 0.01, and 0.001, and the percentage of parasitic damping was set to 50%. The vibrating mass (m) was set to 0.1 kg.
The estimated harvestable power from the axle measurements in the vertical direction is shown in Figure 11 and the estimated relative vibration amplitude of the mass is shown in Figure 12. The estimated mean power values for train speeds above 100 km/h are given in Table 2. The estimated mean harvestable power from the axle vibrations with velocities over 100 km/h varied between 65.9643 mW at the vertical direction of left side of the number 6 axle (V_Ax06_L, = 0.1) and 305.5768 mW at the vertical direction of right side of the number 6 axle (V_Ax06_R, = 0.001). Due to the wide-band nature of the vibrations, the effect of the damping ratio on the estimated harvestable power was rather low. The estimated mean harvestable power from the bogie vibrations with velocities over 100 km/h varied between 21.5 mW at the vertical direction of the right side of the number 3 bogie, which is at the middle position (center) of each coach car (V_BN3_M_R, = 0.1), and 87.5 mW (V_BN3_M_R, = 0.001), as shown in Figure 13 and Table 3. It was remarkably lower than that from the axle vibrations. The relative vibration amplitude of the mass depends clearly on the damping ratio.
In the case of Ax06 (number 6 axle), as shown in Figure 14 and Figure 15, in which the harvestable power level seems to be useable, the relative vibration amplitude is clearly above 1 mm with the total damping ratio 0.001 or lower. This is a reasonable result for implementing an inductive energy converter based on a vibrating permanent magnet and a static energy harvesting coil, even though the specific mechanical solutions for boosting the vibration amplitude and increasing the external dimensions of the harvester may still be needed. Independent of the damping ratio and the undamped resonance frequency of the harvester, the estimated harvestable power is directly proportional to the mass. In addition, both the estimated harvestable power level and the relative vibration amplitude of the mass vary greatly depending on the train speed. There are clear resonance peaks in both, which implies that some kind of vibration amplitude limiter (mechanical and/or electrical) is needed to prevent the vibration amplitude to rise unreasonably.
The generated power estimations are based on the theoretical model of the mass-spring-damper system. To keep the model simple enough for analytic calculations, several factors including mechanical constraints and electrical losses are omitted. The analytic calculations typically give only a rough target value for the final performance of the electromagnetic resonant energy harvester, and the real performance can be expected to be lower than the calculated value. The targets of the theoretical estimations are given to provide a basis for the decision for the detailed design and to provide a basis for the basic design parameters of the electromagnetic resonant energy harvester.
5. Conclusions
In this study, to verify the applicability of the energy harvesting technology that makes the electric energy from the vibration energy source according to the train operation for a high-speed train, an analytic estimation is carried out on the amount of energy harvesting power by the vibration acceleration of a high-speed train in operation, and based on that, the following conclusions are drawn.
The estimated mean harvestable power from the axle vibrations with velocities over 100 km/h varied between 65.9643 mW at the vertical direction of the left side of the number 6 axle (V_Ax06_L, = 0.1) and 305.5768 mW at the vertical direction of the right side of the number 6 axle (V_Ax06_R, = 0.001). Due to the wide-band nature of the vibrations, the effect of the damping ratio on the estimated harvestable power was rather low.
The estimated mean harvestable power from the bogie vibrations with velocities over 100 km/h varied between 21.5 mW at the vertical direction of the right side of the number 3 bogie, which is located at the middle position (center) of each coach car (V_BN3_M_R, = 0.1) and 87.5 mW (V_BN3_M_R, = 0.001), which was remarkably lower than that obtained from the axle vibrations.
Contrary to the estimated harvestable power, the relative vibration amplitude of the mass depends clearly on the damping ratio. In the case of Ax06 (number 6 axle), in which the harvestable power level seems to be useable, the relative vibration amplitude is clearly above 1 mm with a total damping factor 0.01 or lower.
Independent of the damping ratio and the undamped resonance frequency of the harvester, the estimated harvestable power is directly proportional to the mass.
Funding
This research was supported by a grant from the R&D Program of the Korea Railroad Research Institute, Republic of Korea (No. PK2001B5).
Conflicts of Interest
The authors declare no conflict of interest.
References
- Jung, H.J.; Song, Y.; Hong, S.K.; Yang, C.H.; Hwang, S.J.; Jeong, S.Y.; Sung, T.H. Design and optimization of piezoelectric impact-based micro wind energy harvester for wireless sensor network. Sens. Actuators A Phys. 2015, 222, 314–321. [Google Scholar] [CrossRef]
- Takezawa, A.; Kitamura, M.; Vatanabe, S.L.; Silva, E.C.N. Design methodology of piezoelectric energy-harvesting skin using topology optimization. Struct. Multidiscip. Optim. 2014, 49, 281–297. [Google Scholar] [CrossRef] [Green Version]
- Knight, C.; Davidson, J.; Behrens, S. Energy options for wireless sensor nodes. Sensors 2008, 8, 8037–8066. [Google Scholar] [CrossRef]
- Song, Y. Finite-element implementation of piezoelectric energy harvesting system from vibrations of railway bridge. J. Energy Eng. 2019, 145. [Google Scholar] [CrossRef]
- Khan, F.U.; Iqbal, M. Electromagnetic Bridge Energy Harvester Utilizing Bridge’s Vibrations and Ambient Wind for Wireless Sensor Node Application. J. Sens. 2018, 2018, 18. [Google Scholar] [CrossRef]
- Takeya, K.; Sasaki, E.; Kobayashi, Y. Design and parametric study on energy harvesting from bridge vibration using tuned dual-mass damper systems. J. Sound Vib. 2016, 361, 50–65. [Google Scholar] [CrossRef]
- Sazonov, E.; Li, H.; Curry, D.; Pillay, P. Self-powered sensors for monitoring of highway bridges. IEEE Sens. J. 2009, 9, 1422–1429. [Google Scholar] [CrossRef] [Green Version]
- Wang, D.; Chiu, C.; Pham, H. Electromagnetic energy harvesting from vibrations induced by Kármán vortex street. Mechatronics 2012, 22, 746–756. [Google Scholar] [CrossRef]
- Mullen, C.; Lee, S. Optimization of An Electromagnetic Energy Harvesting Backpack under Actual Walking and Running Scenarios, ASME Smart Materials, Adaptive Structures and Intelligent Systems (SMASIS); SMASIS2016-9291, V002T07A015; American Society of Mechanical Engineers: New York, NY, USA, 2016; p. 8. [Google Scholar]
- Jung, H.J.; Nezami, S.; Lee, S. Power Supply Switch Circuit for Intermittent Energy Harvesting. Electronics 2019, 8, 1446. [Google Scholar] [CrossRef] [Green Version]
- Nagode, C.; Ahmadian, M.; Taheri, S. Effective Energy Harvesting Devices for Railroad Applications. Proc. SPIE 2010, 76430. Available online: https://spie.org/Publications/Proceedings/Paper/10.1117/12.847866?SSO=1 (accessed on 29 January 2020). [CrossRef]
- Eshghi, A.T.; Lee, S.; Sadoughi, M.K.; Hu, C.; Kim, Y.; Seo, J. Design optimization under uncertainty and speed variability for a piezoelectric energy harvester powering a tire pressure monitoring sensor. Smart Mater. Struct. 2017, 26, 18. [Google Scholar] [CrossRef]
- Orrego, S.; Shoele, K.; Ruas, A.; Doran, K.; Caggiano, B.; Mittal, R.; Kang, S.H. Harvesting ambient wind energy with an inverted piezoelectric flag. Appl. Energy 2017, 194, 212–222. [Google Scholar] [CrossRef]
- Elvin, N.G.; Lajnef, N.; Elvin, A.A. Feasibility of structural monitoring with vibration powered sensors. Smart Mater. Struct. 2006, 15, 977–986. [Google Scholar] [CrossRef]
- Kure, G. Condition monitoring: The apotheosis of maintenance. Int. Railw. J. 2009, 49, 42–43. [Google Scholar]
- Gatin, O. WSN and Energy Harvesting Opportunities for Railway Applications at SNCF. In Proceedings of the Energy harvesting & Storage Europe Conference, Munich, Germany, 26–27 May 2010. [Google Scholar]
- Seong, S.; Hu, C.; Lee, S. Design under uncertainty for reliable power generation of piezoelectric energy harvester. J. Intell. Mater. Syst. Struct. 2017, 28. [Google Scholar] [CrossRef]
- Mitcheson, P.D.; Reilly, E.K.; Toh, T.; Wright, P.K.; Yeatman, E.M. Performance limits of the three MEMS inertial energy generator transduction types. J. Micromech. Microeng. 2007, 17, 211–216. [Google Scholar] [CrossRef] [Green Version]
- Nezami, S.; Jung, H.; Lee, S. Design of a disk-swing driven piezoelectric energy harvester for slow rotary system application. Smart Mater. Struct. 2019, 28. [Google Scholar] [CrossRef]
- Meninger, S.; Mur-Miranda, J.O.; Amirtharajah, R.; Chandrakasan, A.; Lang, J.H. Vibration-to-electric energy conversion. IEEE Trans. Very Large Scale Integr. (VLSI) Syst. 2001, 9, 64–76. [Google Scholar] [CrossRef]
- Yang, B.; Lee, C.; Xiang, W.; Xie, J.; He, J.H.; Kotlanka, R.K.; Low, S.P.; Feng, H. Electromagnetic energy harvesting from vibrations of multiple frequencies. J. Micromech. Microeng. 2009, 19, 035001. [Google Scholar] [CrossRef]
- Khan, F.; Stoeber, B.; Sassani, F. Modeling of linear micro electromagnetic energy harvesters with nonuniform magnetic field for sinusoidal vibrations. Microsyst. Technol. 2015, 21, 683–692. [Google Scholar] [CrossRef]
- Mathúna, C.Ó.; O’Donnell, T.; Martinez-Catala, R.V.; Rohan, J.; O’Flynn, B. Energy scavenging for long term deployable wireless sensor networks. Talanta 2008, 75, 613–623. [Google Scholar] [CrossRef] [PubMed]
- Cepnik, C.; Lausecker, R.; Wallrabe, U. Review on electrodynamic energy harvesters—A classification approach. Micromachines 2013, 4, 168–196. [Google Scholar] [CrossRef] [Green Version]
- Paul, D.M.; Eric, M.Y.; Rao, G.K.; Andrew, S.H.; Tim, C.G. Energy Harvesting from Human and Machine Motion for Wireless Electronic Devices. Proc. IEEE 2008, 96, 1457–1486. [Google Scholar]
- Anton, S.R.; Sondano, H.A. A review of power harvesting using piezoelectric materials. Smart Mater. Struct. 2007, 16, R1–R21. [Google Scholar] [CrossRef]
- Priya, S. Advances in energy harvesting using low profile piezoelectric transducers. J. Electroceram 2007, 19, 165–182. [Google Scholar] [CrossRef]
- Williams, C.B.; Yates, R.B. Analysis of a micro-electric generator for microsystems. Sens. Actuators A Phys. 1996, 52, 8–11. [Google Scholar] [CrossRef]
- Järviluoma, M.; Strömmer, E. Vibration Analysis Report; VTT Technical Research Centre of Finland: Oulu, Finland, 2013; pp. 7–19. [Google Scholar]
- Caruso, G.; Chirianni, G.; Vairo, G. Energy harvesting from wind-induced bridge vibrations via electromagnetic transduction. Eng. Struct. 2016, 115, 118–128. [Google Scholar] [CrossRef]
- Roundy, S.; Wright, P.K.; Rabaey, J.M. Energy Scavenging for Wireless Sensor Networks with Special Focus on Vibrations; Springer Nature: Berlin/Heidelberg, Germany, 2004. [Google Scholar]
- Khan, F. Review of non-resonant vibration based energy harvesters for wireless sensor nodes. J. Renew. Sustain. Energy 2016, 8, 44702. [Google Scholar] [CrossRef]
Figure 1.
The sensor installation position on the axle and bogie of a high-speed train: Top: High-speed train for this research (left), the bogie of the high-speed train (right), Bottom: The sensor at the axle box (left), the sensor at the bogie frame (right).
Figure 1.
The sensor installation position on the axle and bogie of a high-speed train: Top: High-speed train for this research (left), the bogie of the high-speed train (right), Bottom: The sensor at the axle box (left), the sensor at the bogie frame (right).
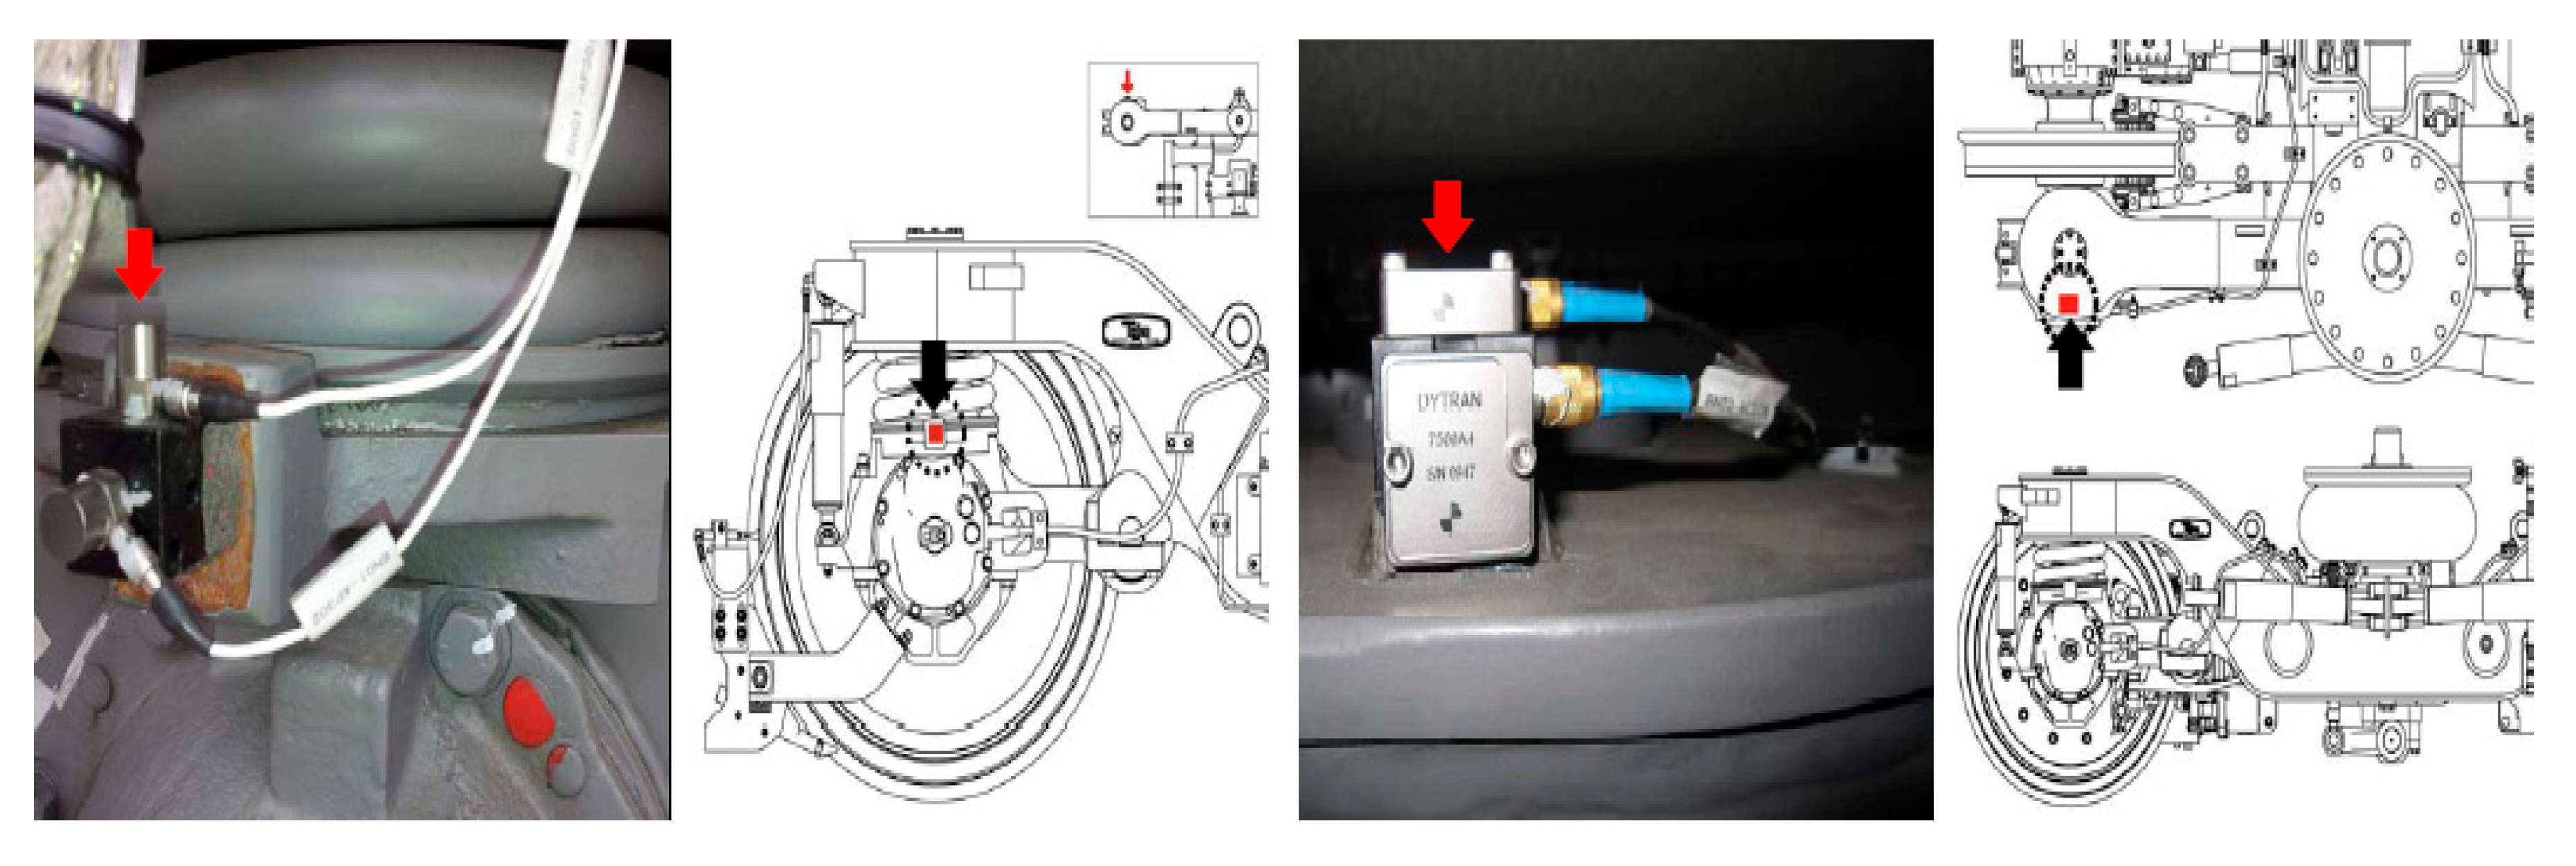
Figure 2.
The vibration acceleration on the axle.
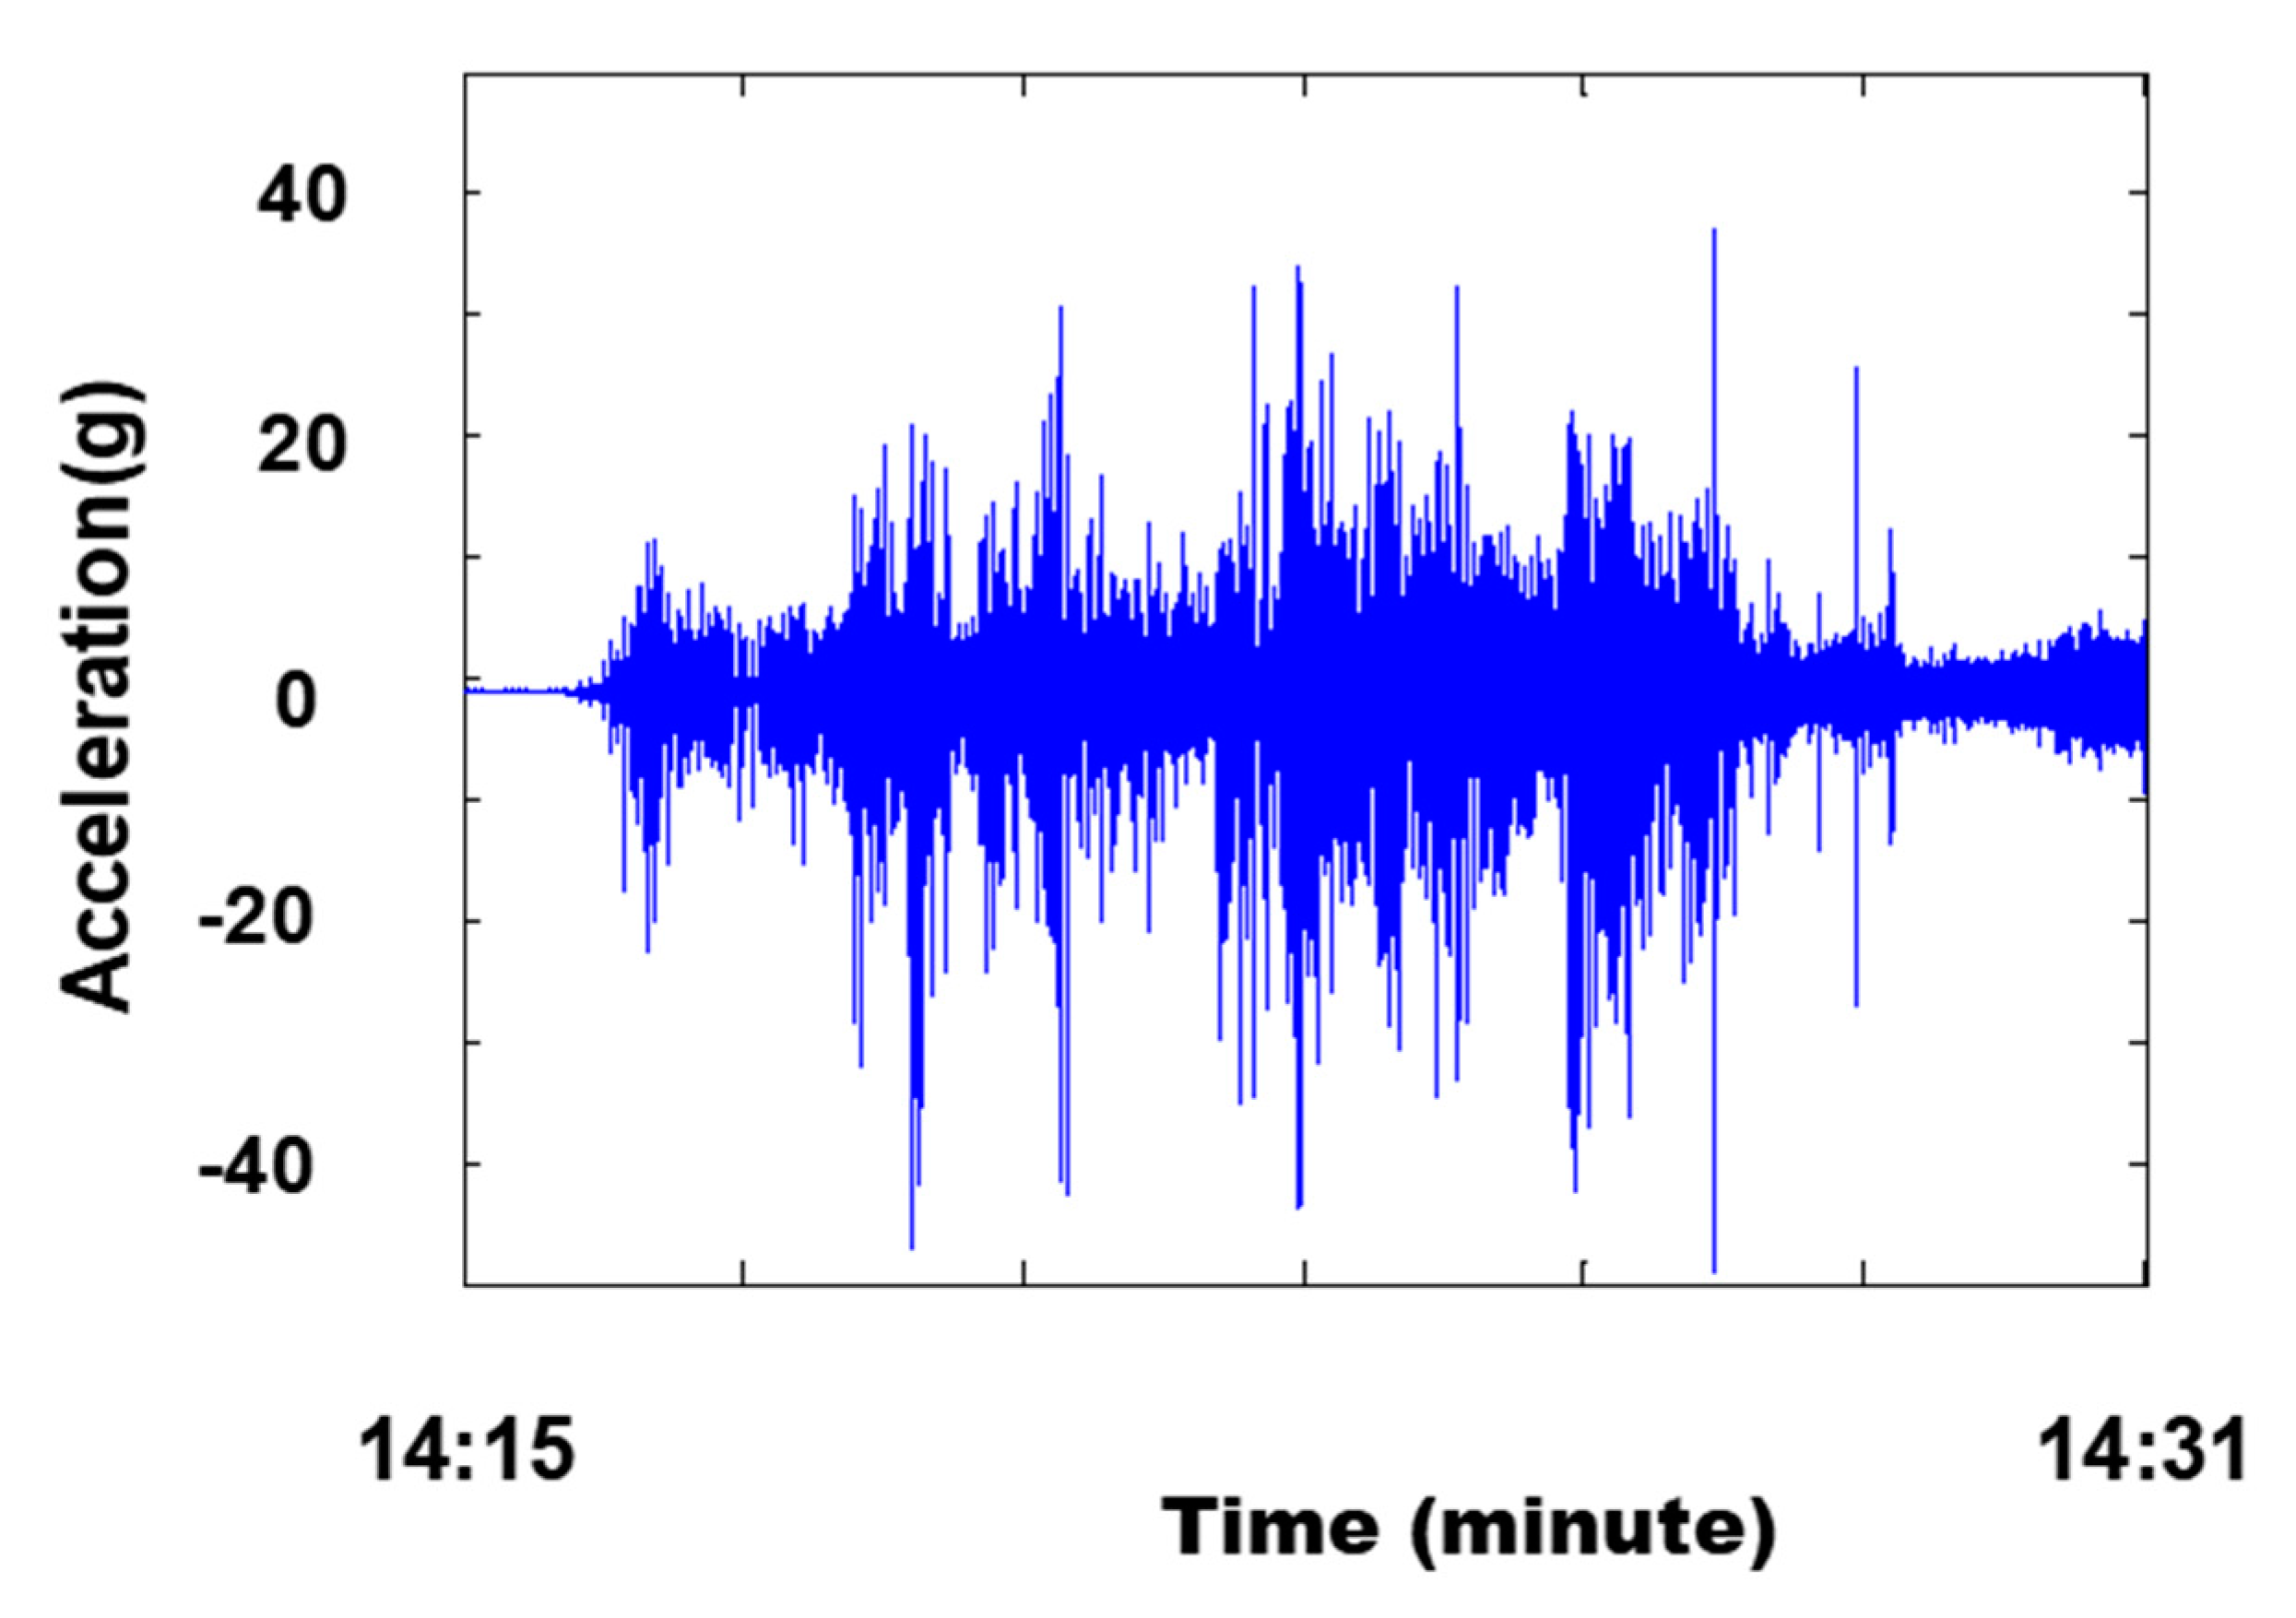
Figure 3.
The vibration acceleration on the bogie frame.
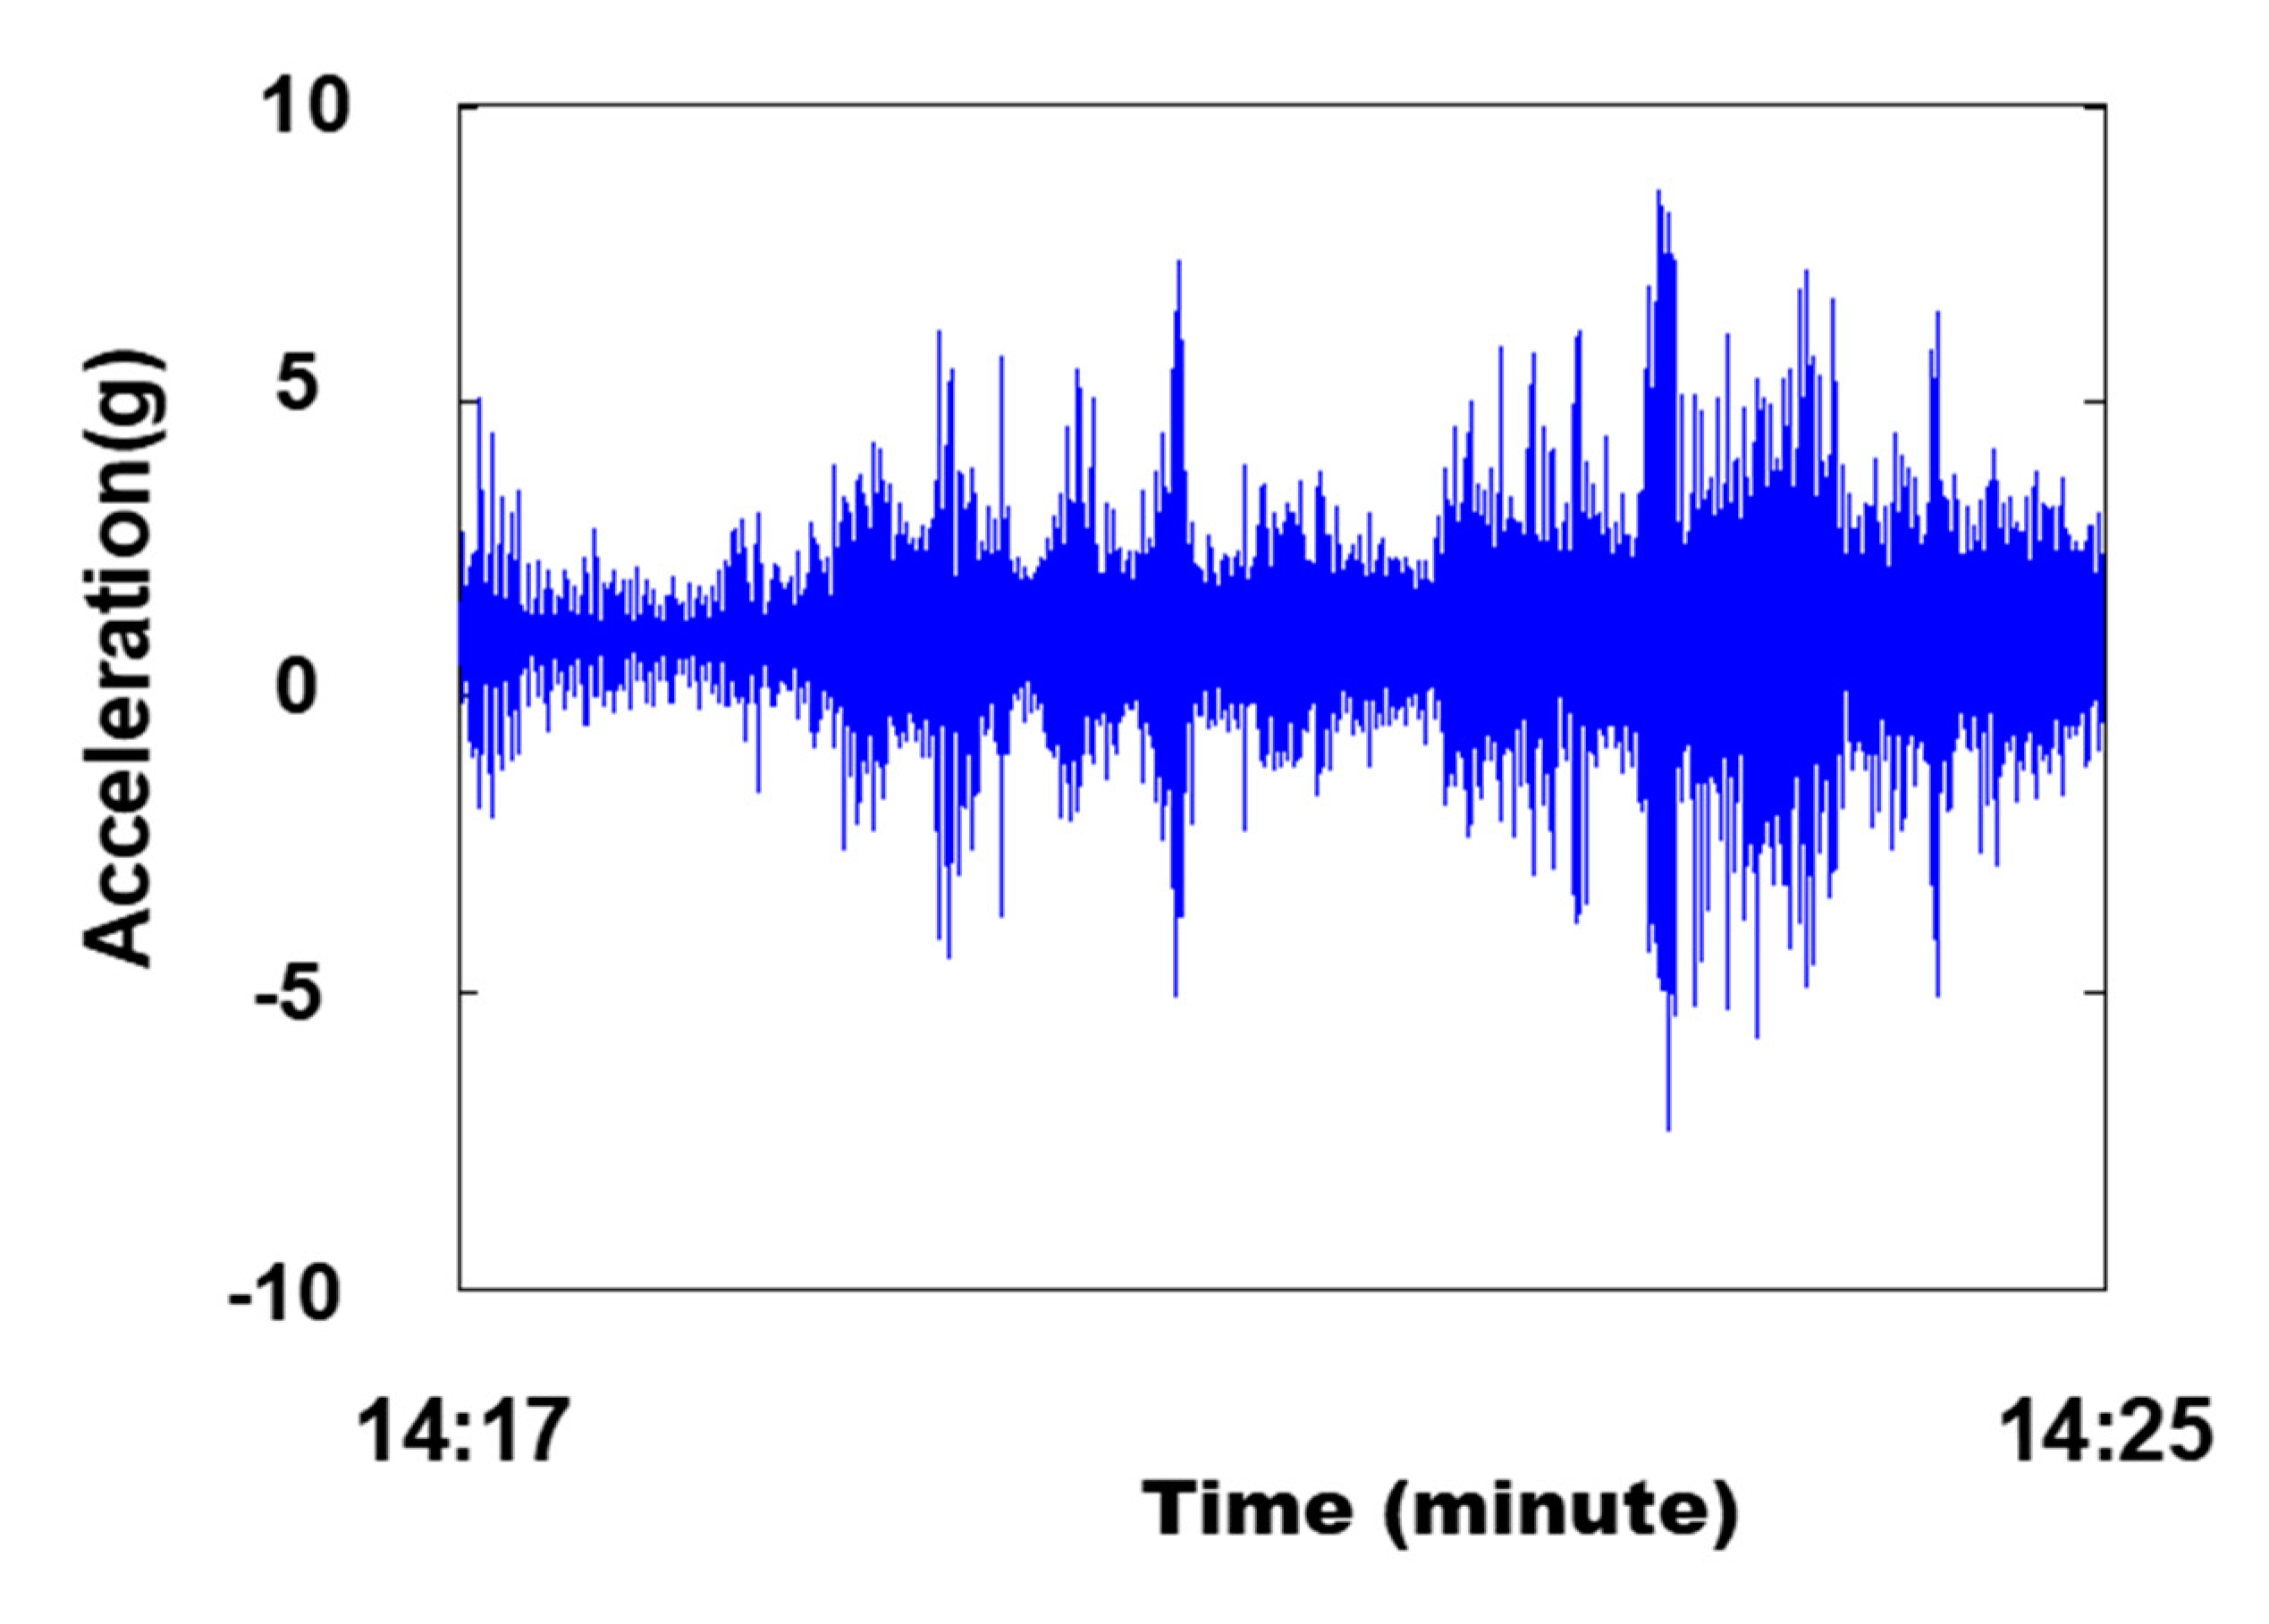
Figure 4.
The frequency analysis of vibration acceleration on the axle with the train traveled position (Distance), which was indicated by the number of kilometers of distance away from the starting point of the track: The vibration acceleration value is shown in the range of 300 Hz or less in the case of the axle.

Figure 5.
The frequency analysis of vibration acceleration on the bogie with the train traveled position (Distance), which is indicated by the number of kilometers of distance away from the starting point of the track: The acceleration measured in the bogie is shown to be concentrated in the range of 150 Hz or less in case of the bogie (the difference of vibration acceleration is apparent in the green color dash area of Figure 4 and Figure 5).
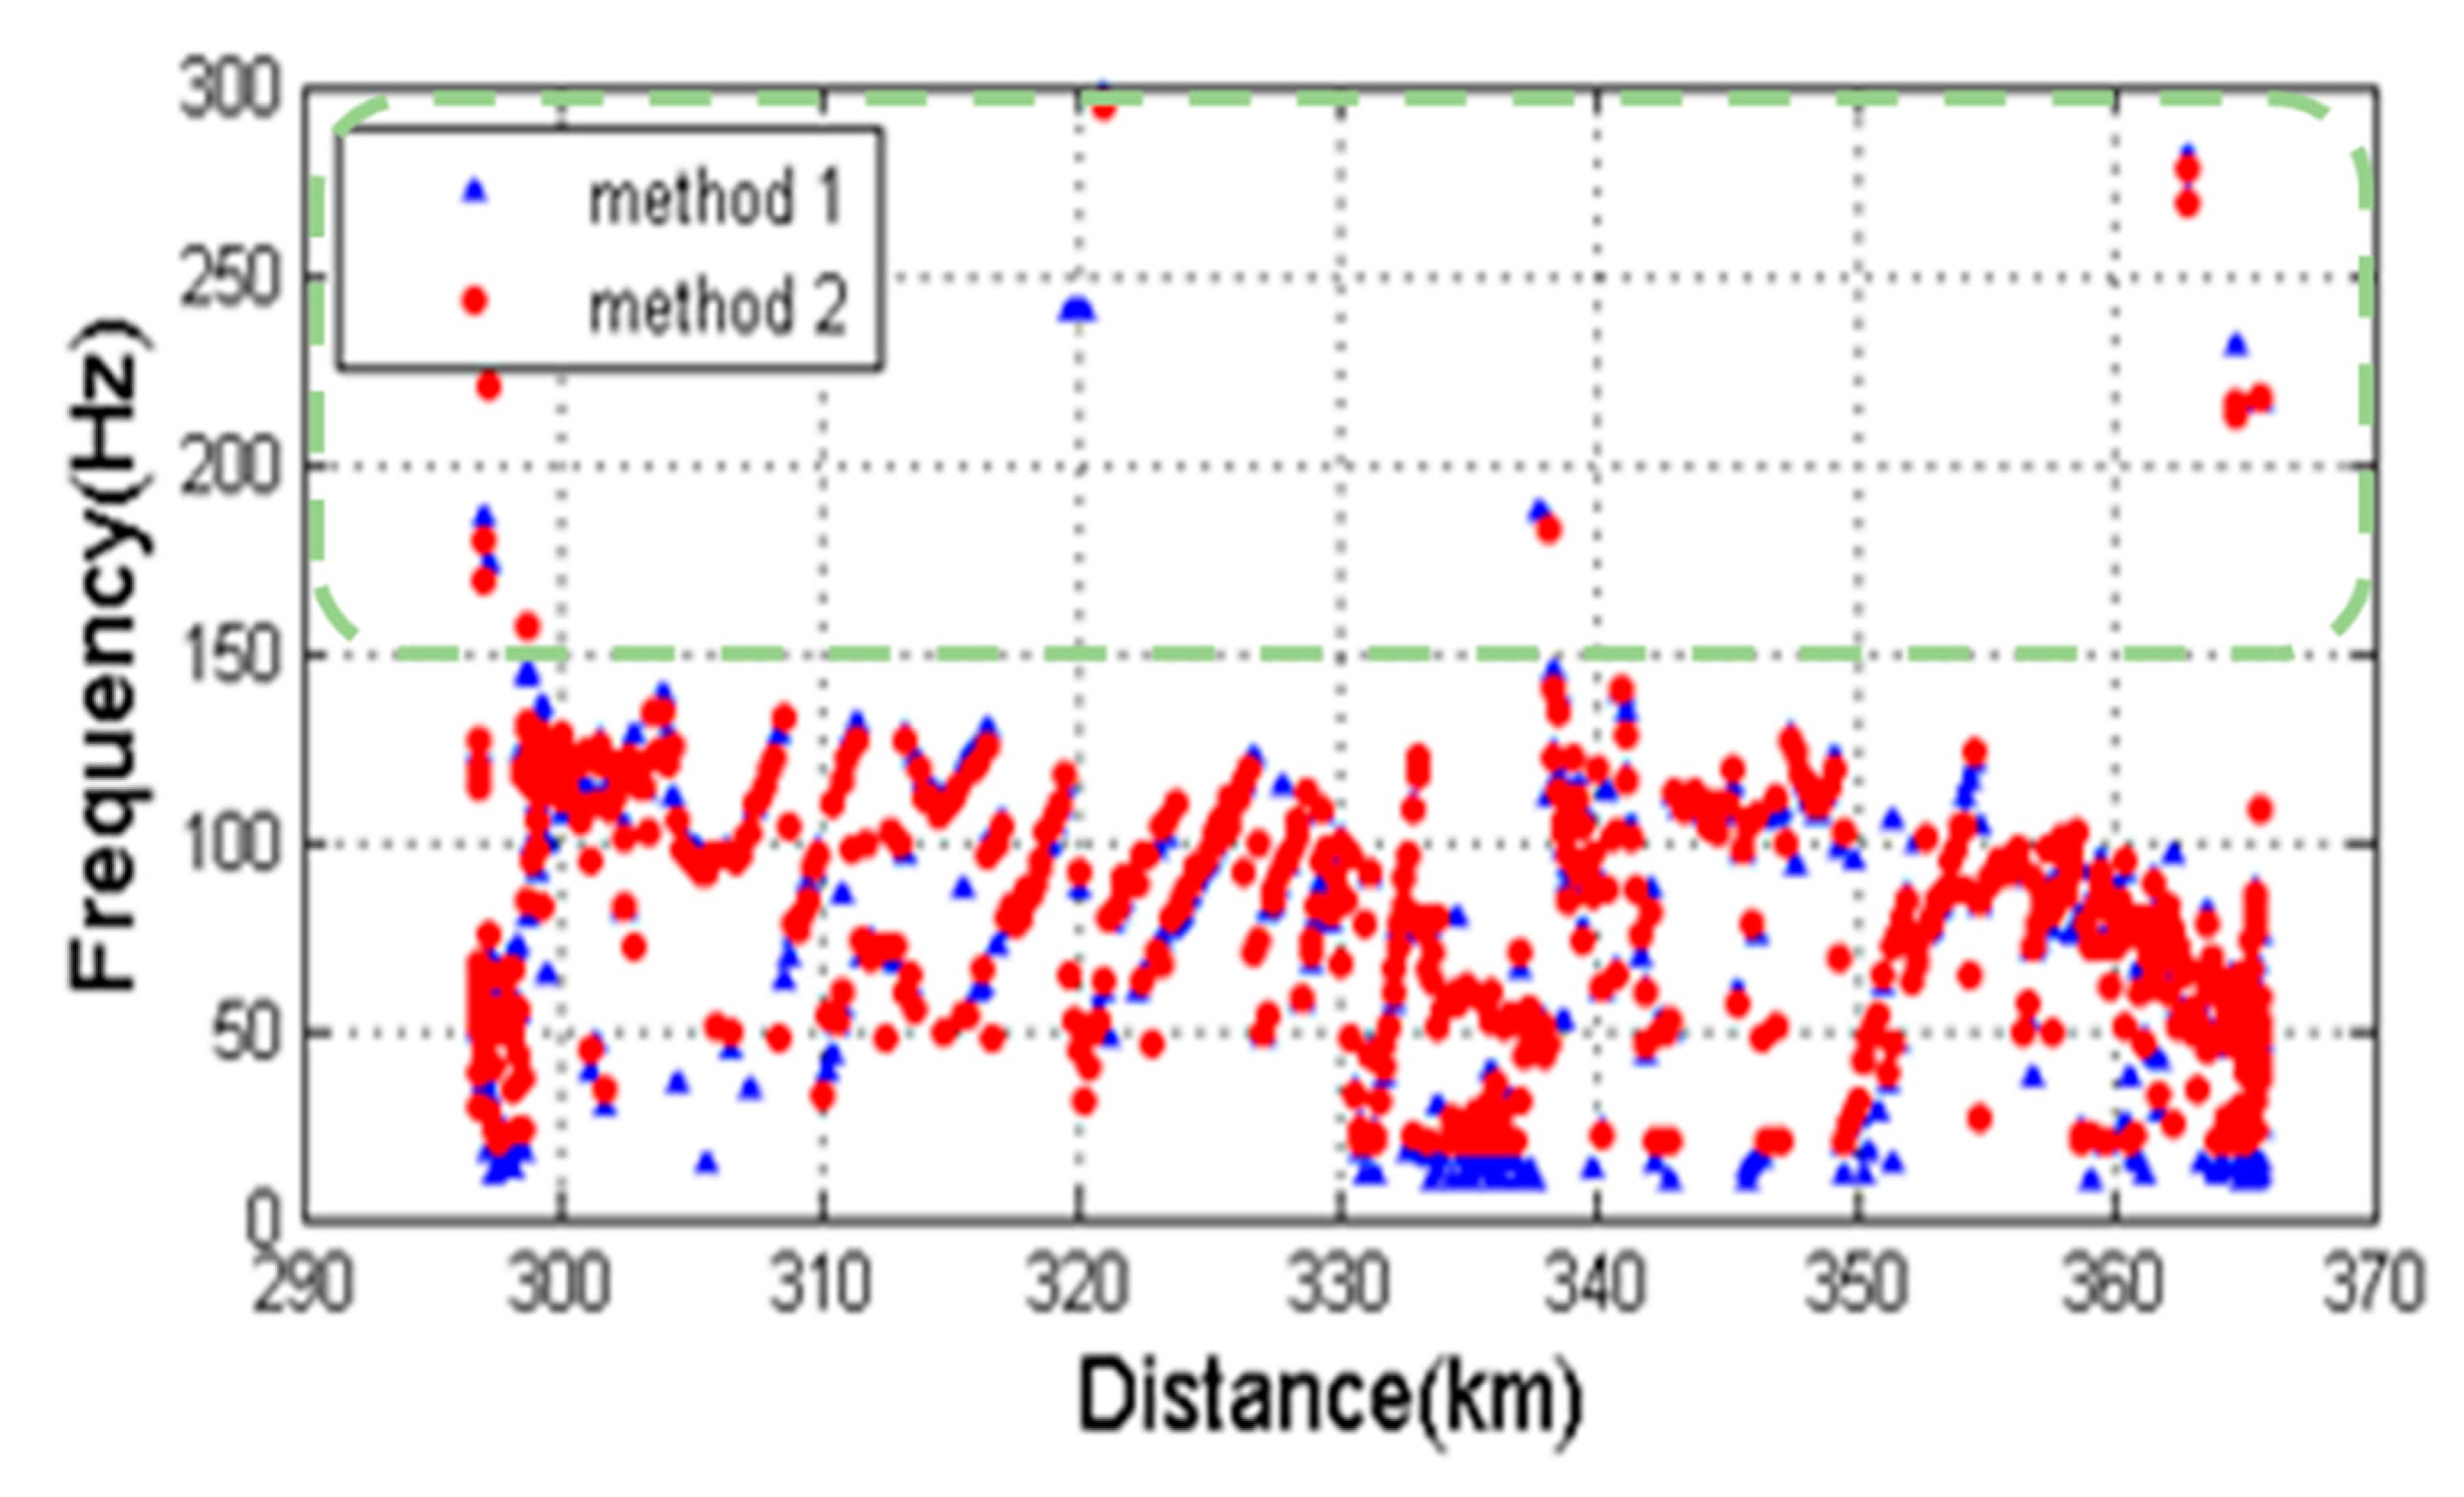
Figure 6.
The reflective-type laser wheel speed sensor on the bogie.

Figure 7.
The vibration acceleration spectrogram on the axle and folding effect at the vertical direction of right side of number 6 axle V_Ax06_R: (left) 3D spectrogram of FFT analysis of vibration acceleration with train speed, (right) 2D spectrogram of vibration acceleration frequency and train speed, the downward wisps (blue dash line) are caused by the folding effect. The folding effect appears stronger at high frequencies at high speeds and less strong at the middle frequencies at high speeds. The wheel rotation speed (wheel diameter 860 mm) and its integer multiples (harmonic frequencies) are plotted with red lines in the spectrograms.
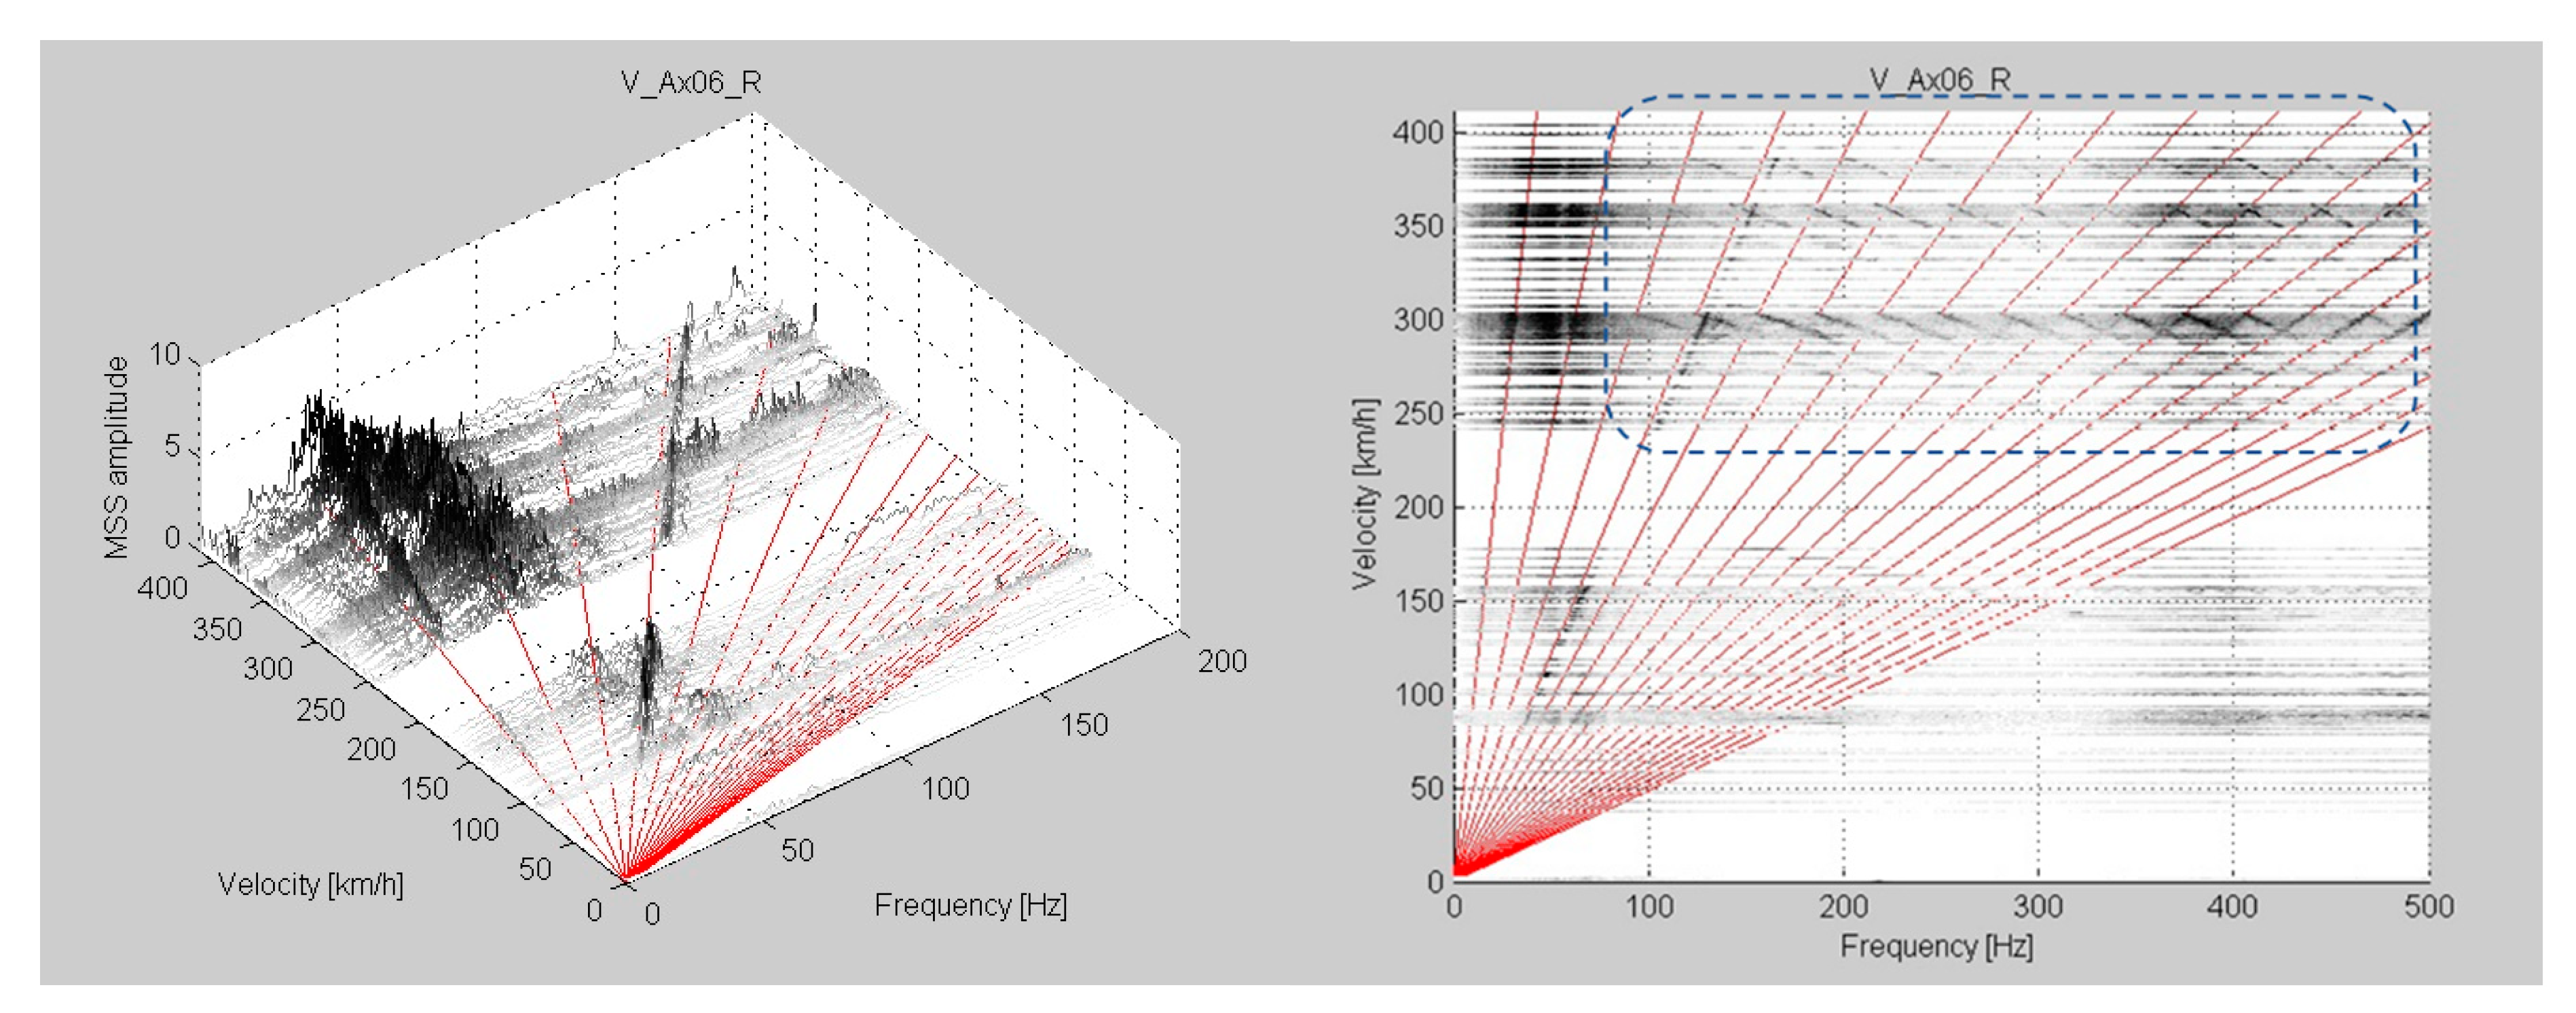
Figure 8.
The vibration acceleration spectrogram on the axle at the vertical direction of each left and right side of the number 6 axle V_Ax06_L and V_Ax06_R: (left) 3D spectrogram of FFT analysis of vibration acceleration with train speed at V_Ax06_L, (right) 3D spectrogram of FFT analysis of vibration acceleration with train speed at V_Ax06_R. The wheel rotation speed (wheel diameter 860 mm) and its integer multiples (harmonic frequencies) are plotted with red lines in the spectrograms.

Figure 9.
The vibration acceleration spectrogram on the bogie at the vertical direction of the right side of the number 3 bogie, which is in the middle position (center) of each coach car: V_BN3_M_R: 3D spectrogram of FFT analysis of vibration acceleration with train speed. The wheel rotation speed (wheel diameter 860 mm) and its integer multiples (harmonic frequencies) are plotted with red lines in the spectrograms.

Figure 10.
A schematic diagram of the vibration energy harvester based on a resonant mass-spring-damper system [28]: The estimated power generation from the vertical vibration of the axles when the total damping ratio is 0.001, 0.01, or 0.1, and the mass is 0.1 kg.
Figure 10.
A schematic diagram of the vibration energy harvester based on a resonant mass-spring-damper system [28]: The estimated power generation from the vertical vibration of the axles when the total damping ratio is 0.001, 0.01, or 0.1, and the mass is 0.1 kg.
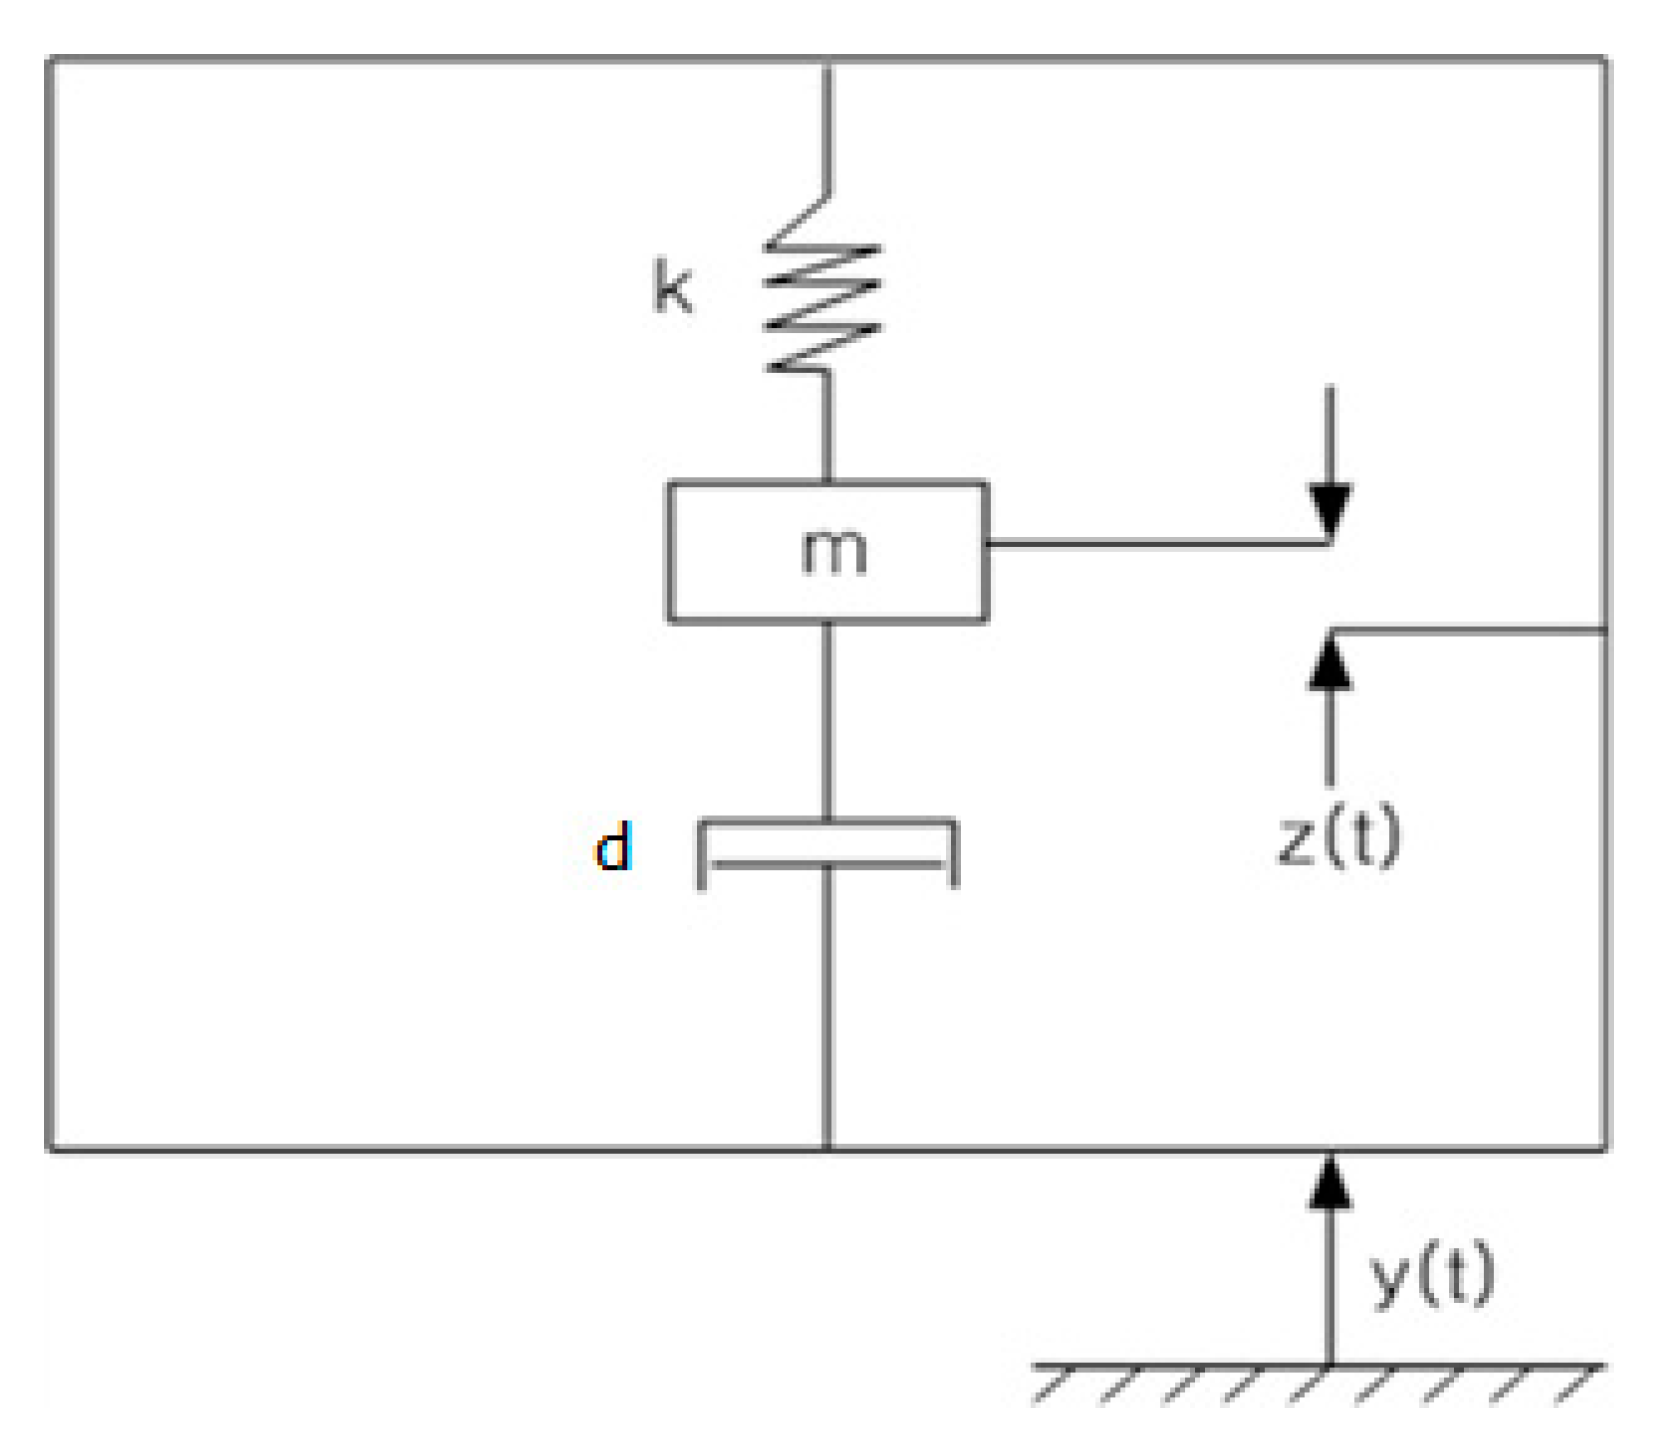
Figure 11.
The estimated power generation from the vertical vibration of the axles when the total damping ratio is 0.001, 0.01 or 0.1; the mass is 0.1 kg; and the natural frequency is 50.3 Hz (at the vertical direction of each left and right side of the number 6 axle: V_Ax06_L and V_Ax06_R).
Figure 11.
The estimated power generation from the vertical vibration of the axles when the total damping ratio is 0.001, 0.01 or 0.1; the mass is 0.1 kg; and the natural frequency is 50.3 Hz (at the vertical direction of each left and right side of the number 6 axle: V_Ax06_L and V_Ax06_R).

Figure 12.
The relative vibration amplitudes of the harvester mass from the vertical vibration of the axles when the total damping ratio is 0.001, 0.01, or 0.1; the mass is 0.1 kg; and the natural frequency is 50.3 Hz (at the vertical direction of each left and right side of number 6 axle: V_Ax06_L and V_Ax06_R).
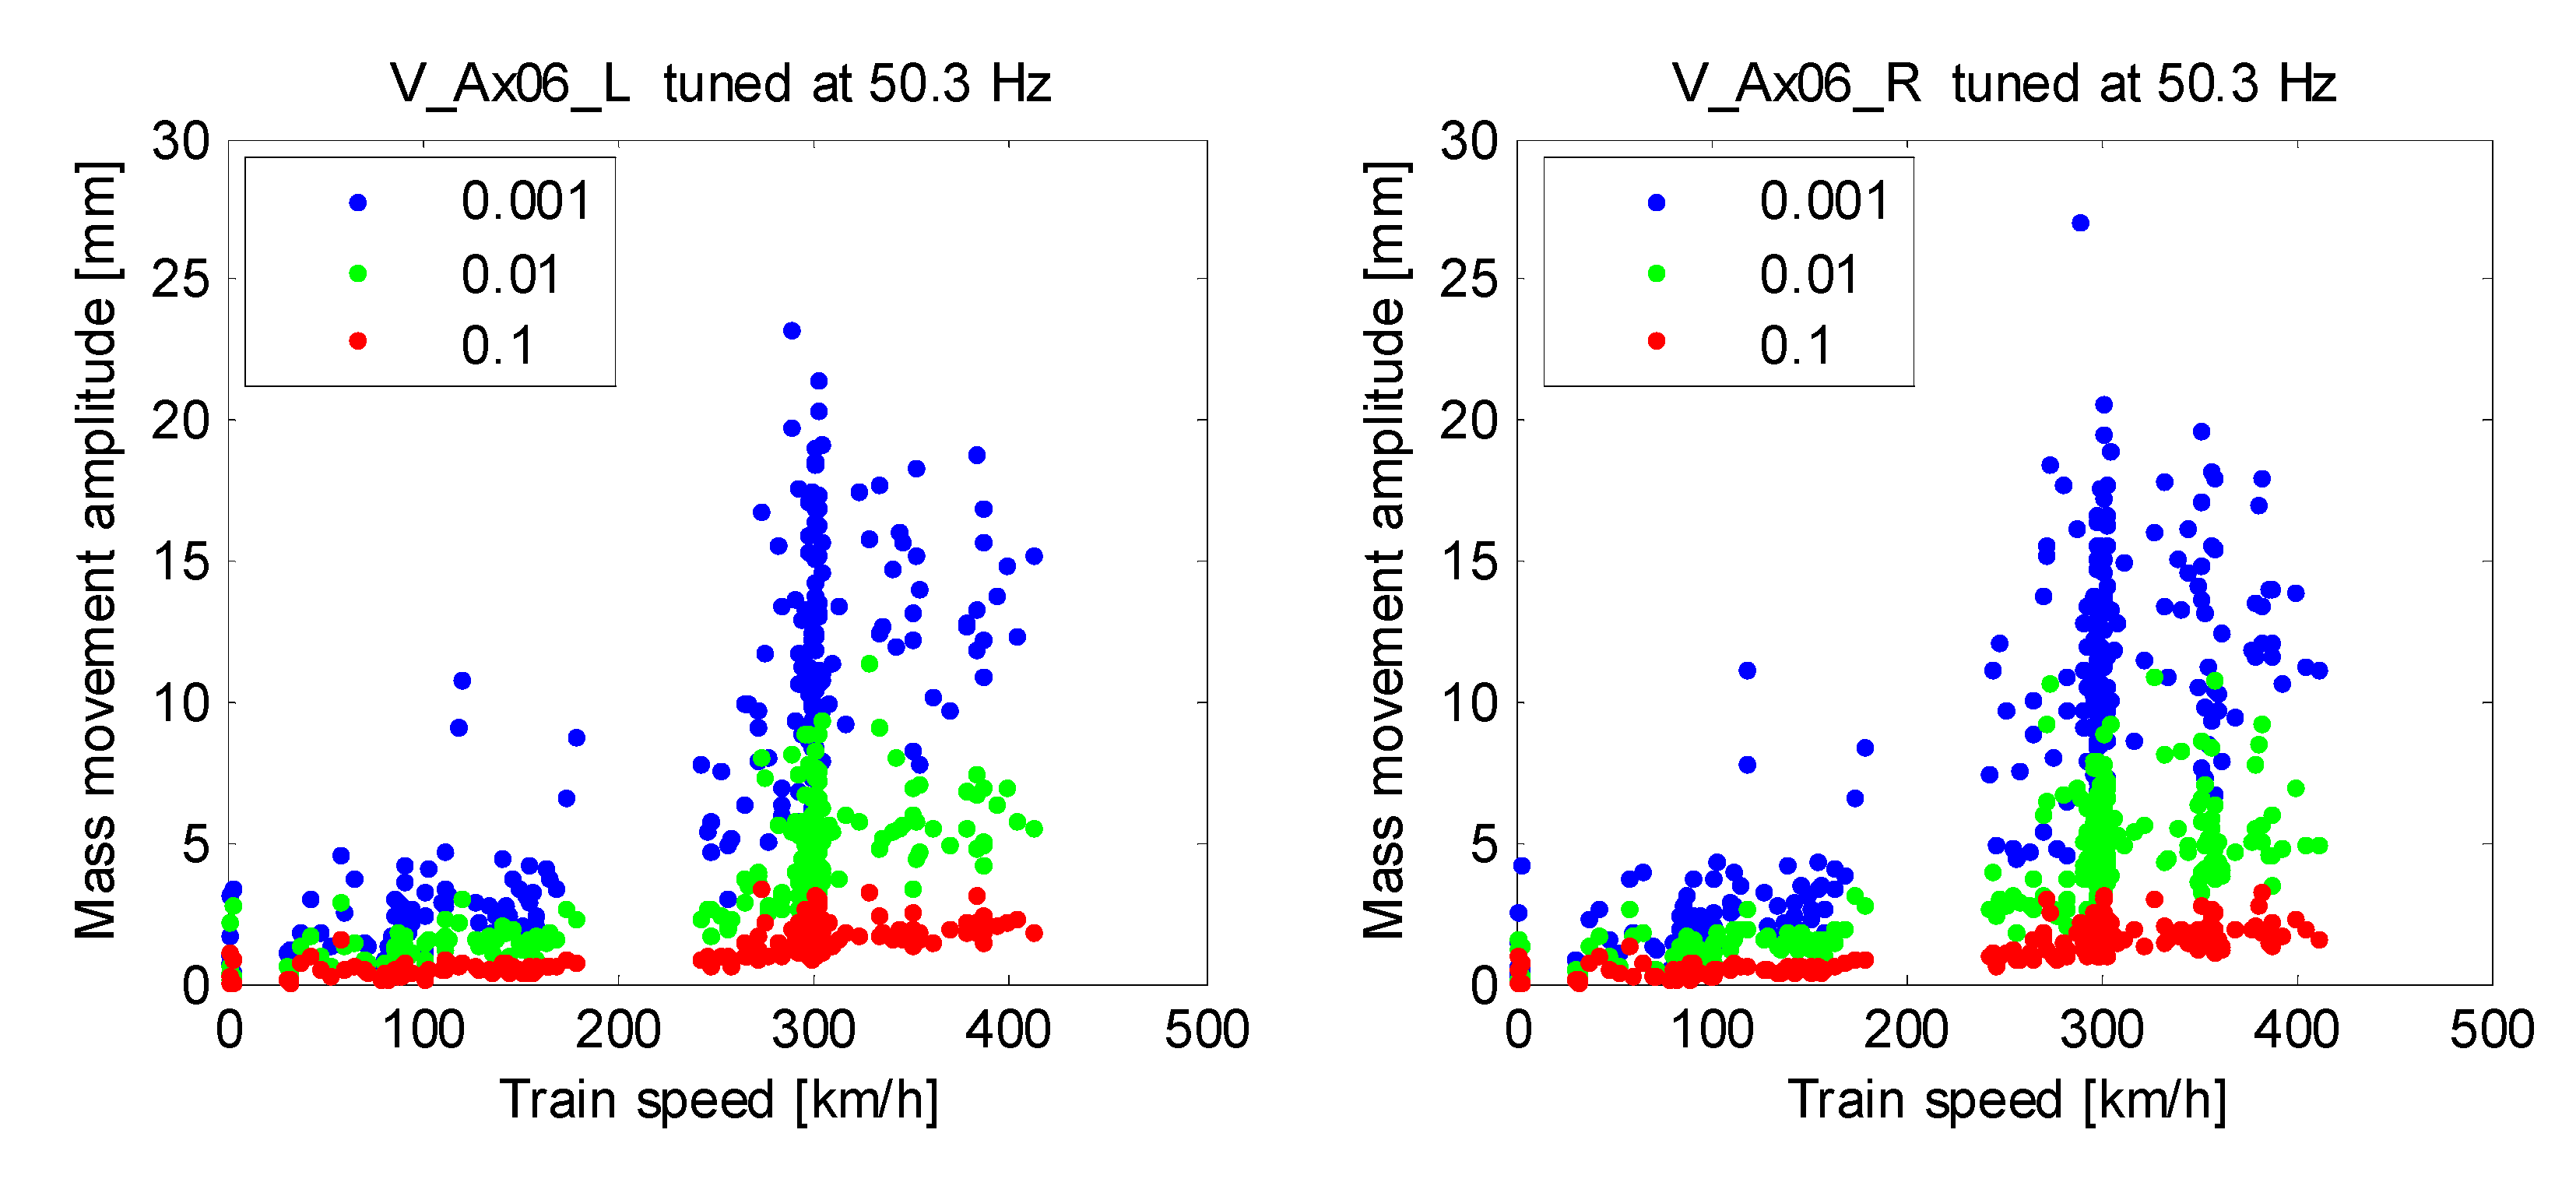
Figure 13.
The estimated power generation and the relative vibration amplitudes of the harvester mass from the vertical vibration of the bogie when the total damping ratio is 0.001, 0.01, or 0.1; the mass is 0.1 kg; and the natural frequency is 45.9 Hz. The horizontal lines are the mean values for speeds above 100 km/h (at the vertical direction of the right side of the number 3 bogie, which is in the middle position (center) of each coach car: V_BN3_M_R).

Figure 14.
The estimated maximum generated power from the vertical vibration of the axles and bogie when the total damping ratio is 0.1, the mass is 0.1 kg, and the natural frequencies are 50.3 Hz (axle) and 45.9 Hz (bogie).
Figure 14.
The estimated maximum generated power from the vertical vibration of the axles and bogie when the total damping ratio is 0.1, the mass is 0.1 kg, and the natural frequencies are 50.3 Hz (axle) and 45.9 Hz (bogie).
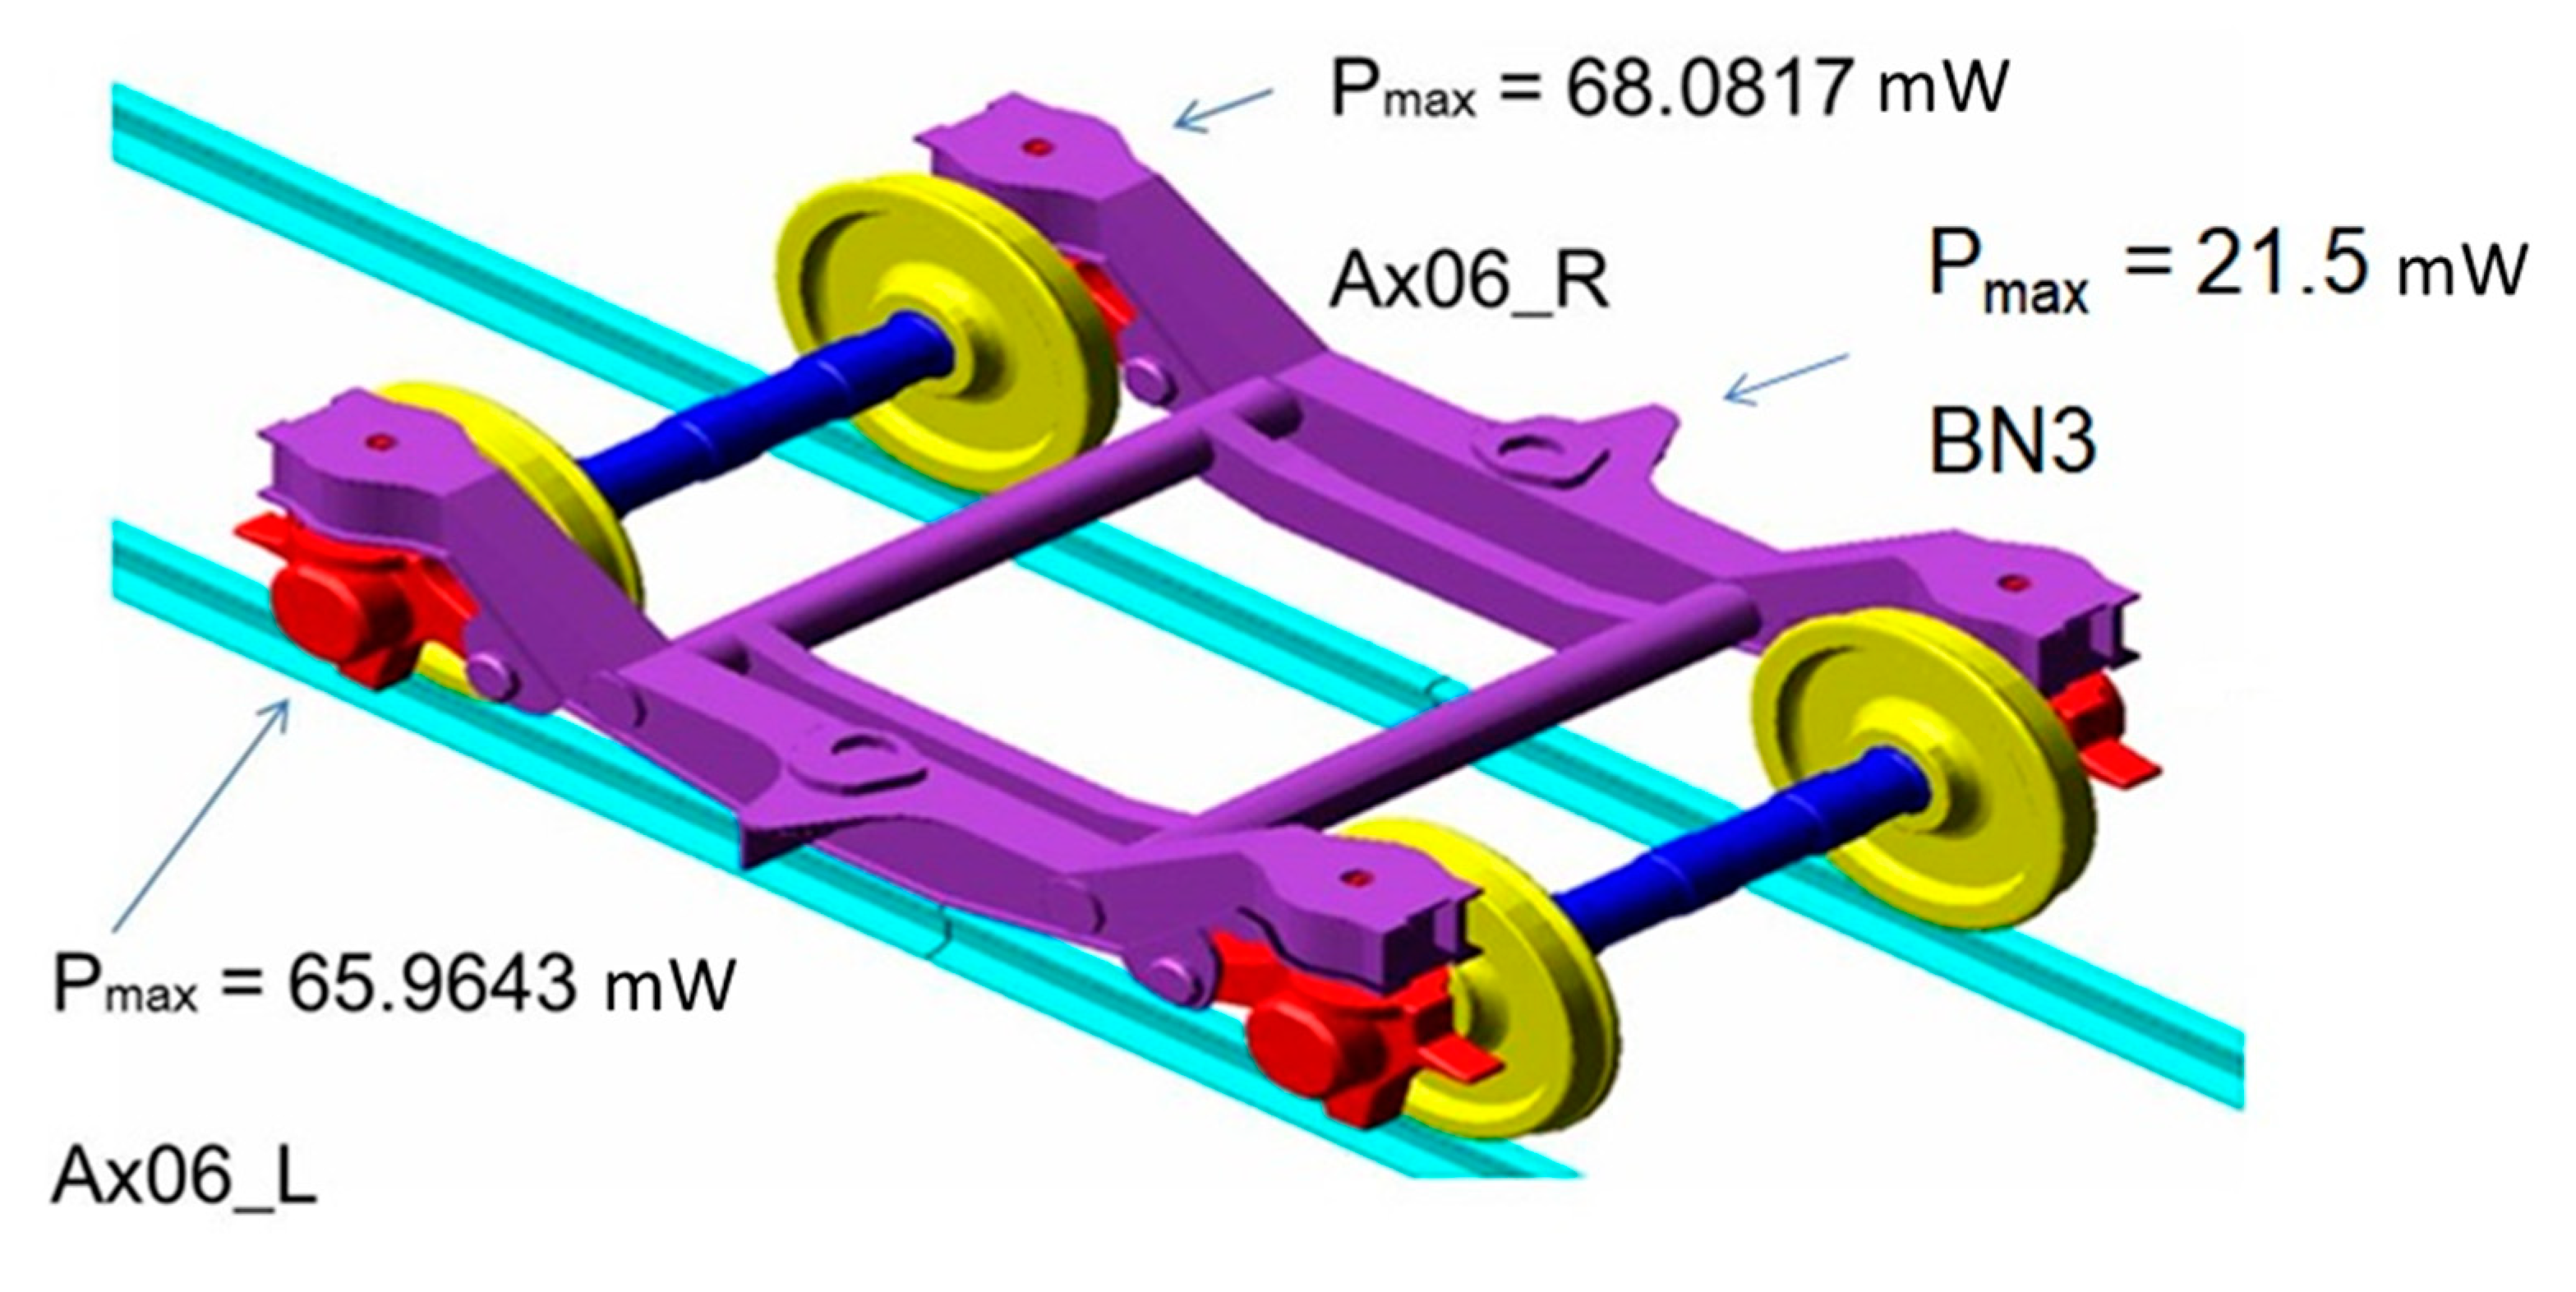
Figure 15.
The estimated maximum generated power from the vertical vibration of the axles and bogie when the total damping ratio is 0.001, the mass is 0.1 kg, and the natural frequencies are 50.3 Hz (axle) and 45.9 Hz (bogie).
Figure 15.
The estimated maximum generated power from the vertical vibration of the axles and bogie when the total damping ratio is 0.001, the mass is 0.1 kg, and the natural frequencies are 50.3 Hz (axle) and 45.9 Hz (bogie).


Table 1.
Main peak frequencies in the vertical vibration measurements in the axle and bogie.
| Location | Peak Frequencies, Hz | |||
|---|---|---|---|---|
| V_Ax06_L | 29.79 | 47.36 | 50.30 | 61.04 |
| V_Ax06_R | 29.79 | 47.36 | 50.30 | 61.04 |
| V_BN3_M_R | 30.27 | 45.90 | 55.18 | 59.57 |
Table 2.
The max power estimates of vertical axle vibrations with 0.1 kg mass, 50.3 Hz natural frequency, and three different total damping ratios ξT around 300 km/h and the mean power estimation.
Table 2.
The max power estimates of vertical axle vibrations with 0.1 kg mass, 50.3 Hz natural frequency, and three different total damping ratios ξT around 300 km/h and the mean power estimation.
| Max Power at Each Location [mW] | Mean Power at Each Location [mW] | |||
|---|---|---|---|---|
| Damping ratio | V_Ax06_L | V_Ax06_R | V_Ax06_L | V_Ax06_R |
| 0.001 | 290.9715 | 305.5768 | 49.0 | 51.4 |
| 0.01 | 162.9827 | 161.3689 | 42.1 | 44.8 |
| 0.1 | 65.9643 | 68.0817 | 25.7 | 26.9 |
Table 3.
The mean power estimates of the vertical and transversal bogie vibrations with a 0.1 kg mass, 45.9 Hz natural frequency, and three different total damping ratios.
Table 3.
The mean power estimates of the vertical and transversal bogie vibrations with a 0.1 kg mass, 45.9 Hz natural frequency, and three different total damping ratios.
| Max Power at Each Location [mW] | Mean Power at Each Location [mW] | |
|---|---|---|
| Damping ratio | V_BN3_M_R | V_BN3_M_R |
| 0.001 | 87.5 | 7.5 |
| 0.01 | 73.7 | 6.3 |
| 0.1 | 21.5 | 2.9 |
© 2020 by the author. Licensee MDPI, Basel, Switzerland. This article is an open access article distributed under the terms and conditions of the Creative Commons Attribution (CC BY) license (http://creativecommons.org/licenses/by/4.0/).
Share and Cite
MDPI and ACS Style
Kim, J. A Study on the Analytic Power Estimation of the Electromagnetic Resonant Energy Harvester for the High-Speed Train. Electronics 2020, 9, 403. https://doi.org/10.3390/electronics9030403
AMA Style
Kim J. A Study on the Analytic Power Estimation of the Electromagnetic Resonant Energy Harvester for the High-Speed Train. Electronics. 2020; 9(3):403. https://doi.org/10.3390/electronics9030403
Chicago/Turabian StyleKim, Jaehoon. 2020. "A Study on the Analytic Power Estimation of the Electromagnetic Resonant Energy Harvester for the High-Speed Train" Electronics 9, no. 3: 403. https://doi.org/10.3390/electronics9030403
Note that from the first issue of 2016, this journal uses article numbers instead of page numbers. See further details here.