
Plaque Reduction Neutralization Test (PRNT) Accuracy in Evaluating Humoral Immune Response to SARS-CoV-2
 , , , , ,
  , and add
Show full author list
, and add
Show full author list
Abstract
1. Introduction
2. Materials and Methods
2.1. Ethics Statements and Sample Collection
2.2. Virus and Cell Lines
2.3. Plaque Reduction Neutralization Test (PRNT) Optimization
2.4. Validation of Analytical Procedure—PRNT-SARS-CoV-2
2.4.1. Selectivity
2.4.2. Accuracy
2.4.3. Precision
2.4.4. Robustness
2.5. Statistical Analysis
3. Results
3.1. Optimization of the Neutralization Test
3.2. SARS-CoV-2 Neutralizing Antibody Screening Using PRNT
3.3. Establishing a Serological Panel
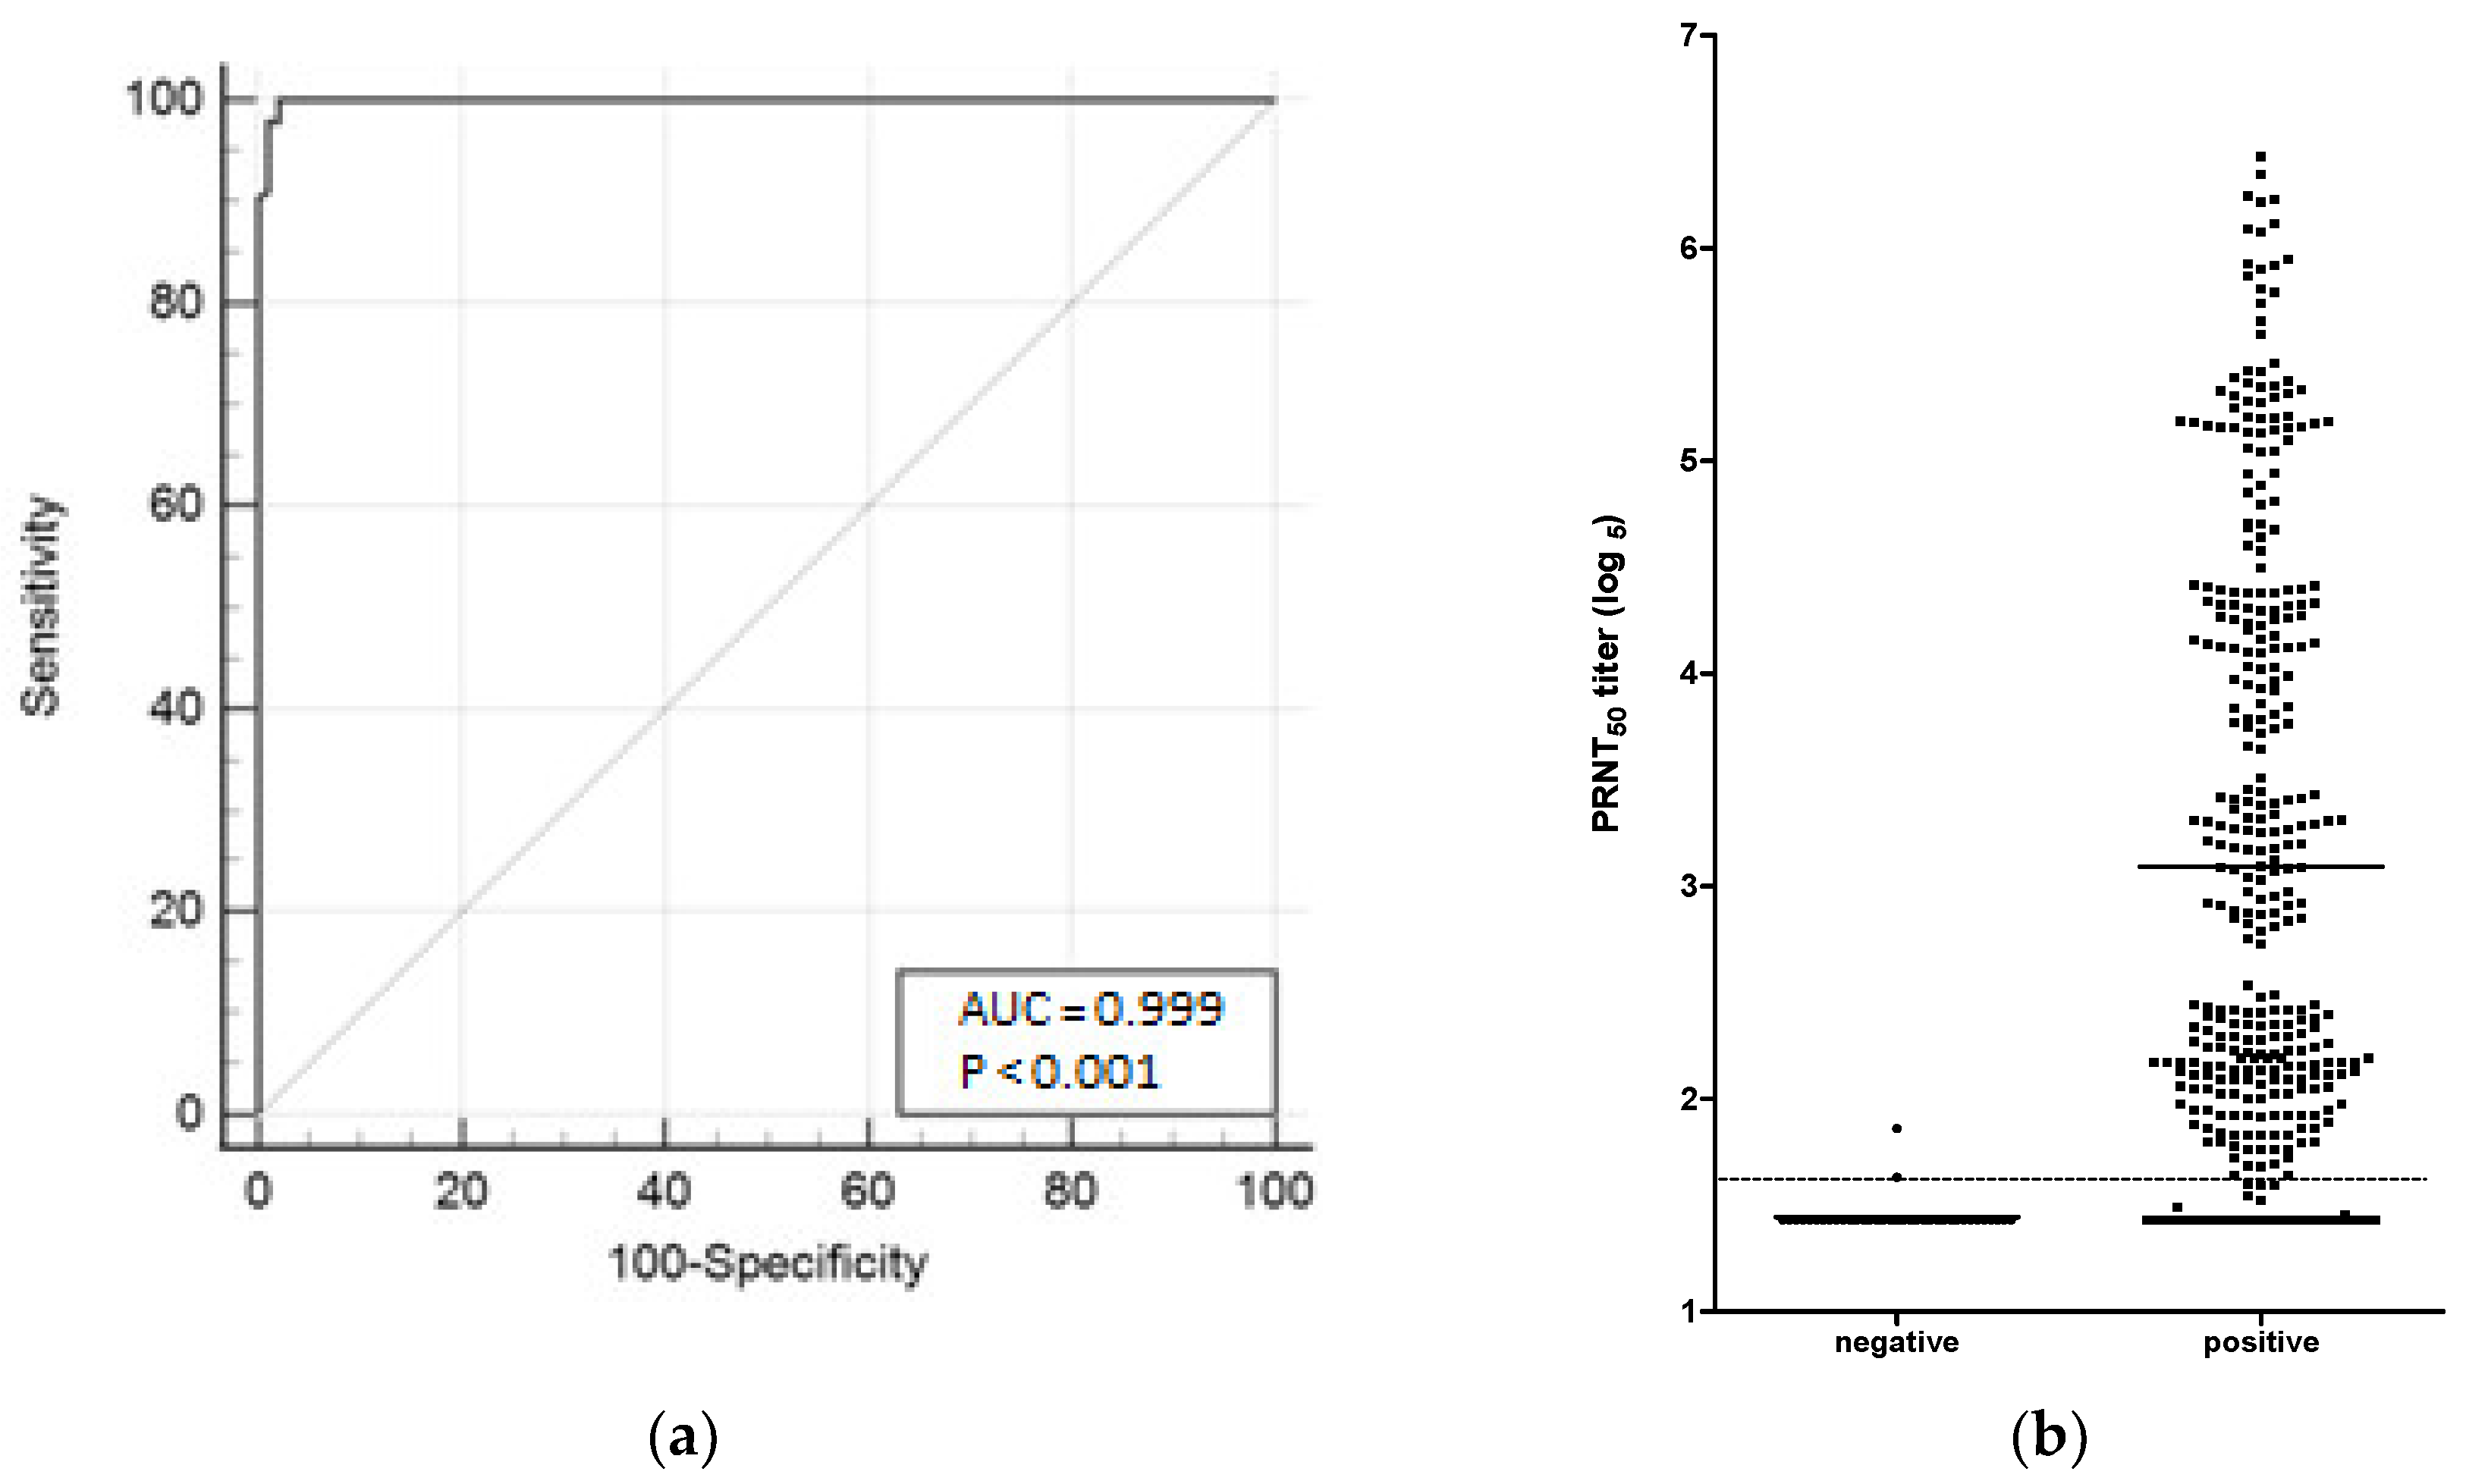
3.4. ROC Curve
3.5. PRNT50 for SARS-CoV-2 Validation
3.5.1. Selectivity
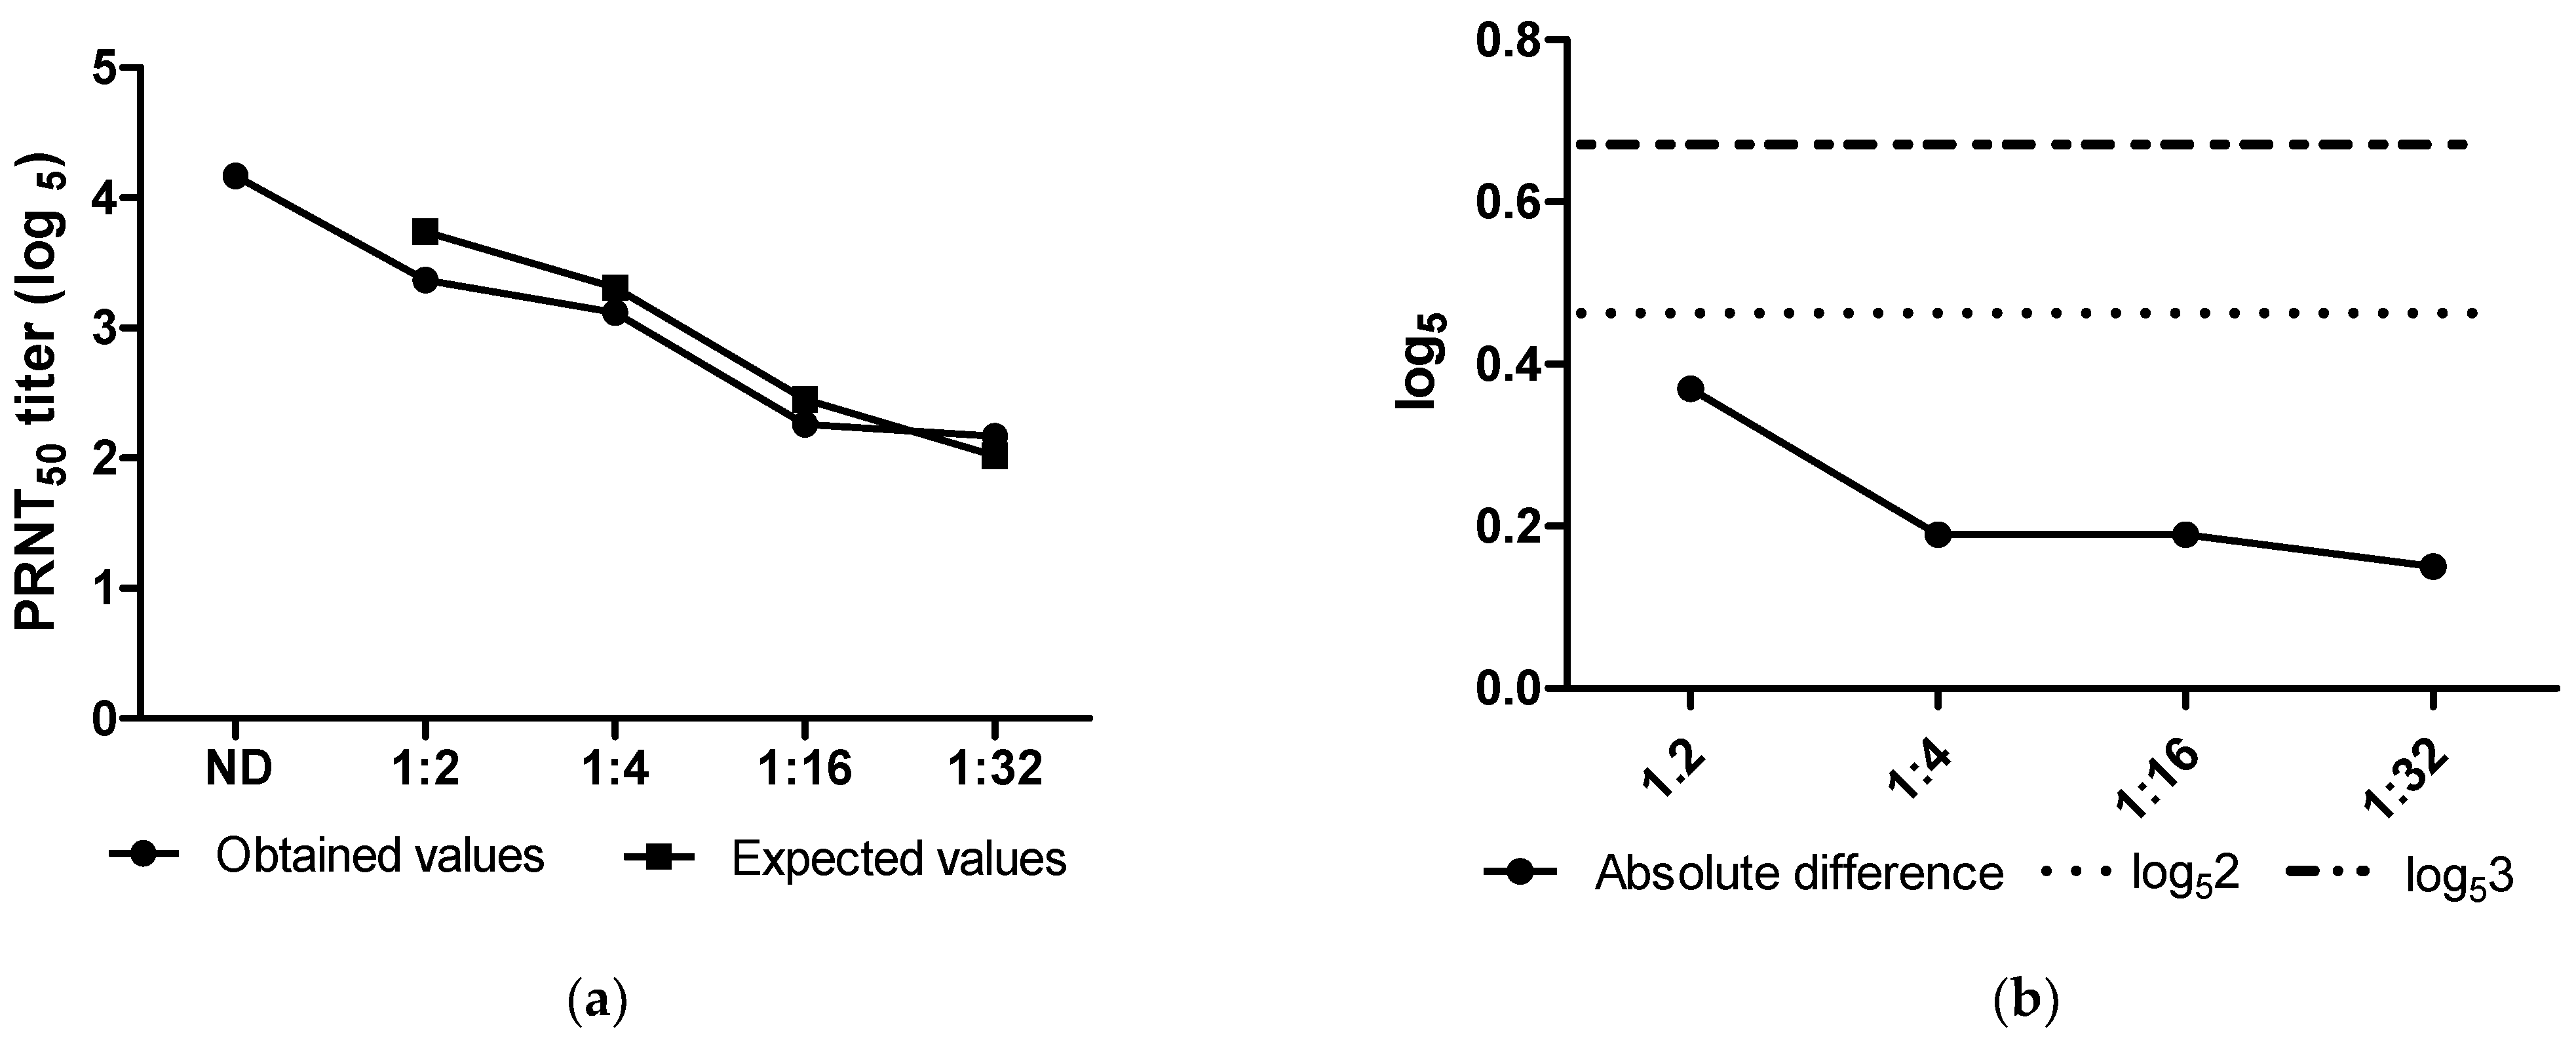
3.5.2. Accuracy
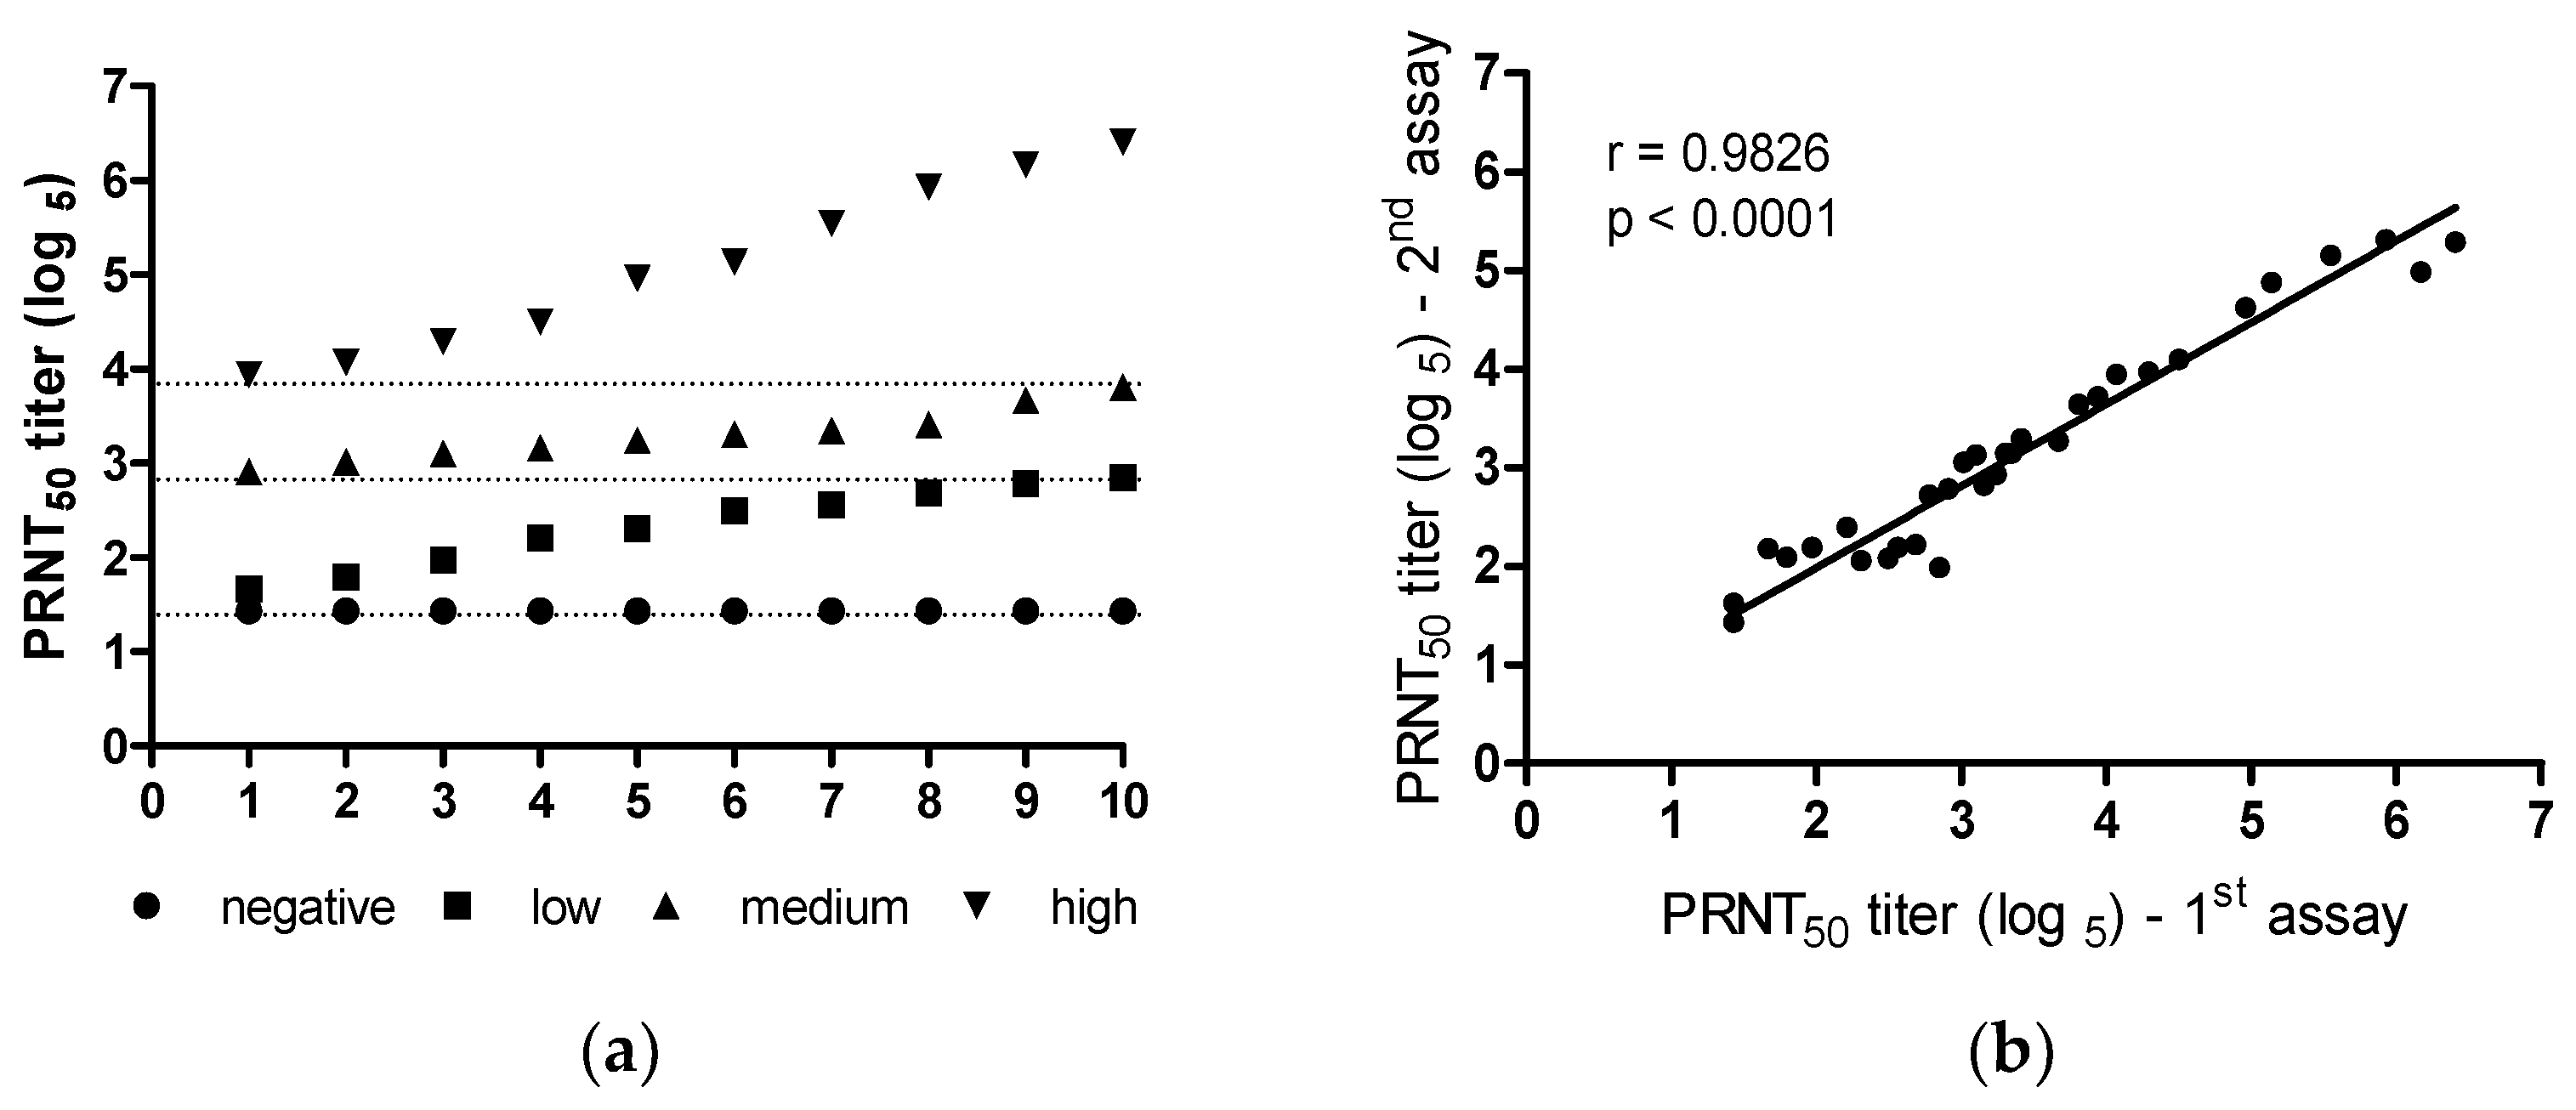
3.5.3. Precision
3.5.4. Robustness
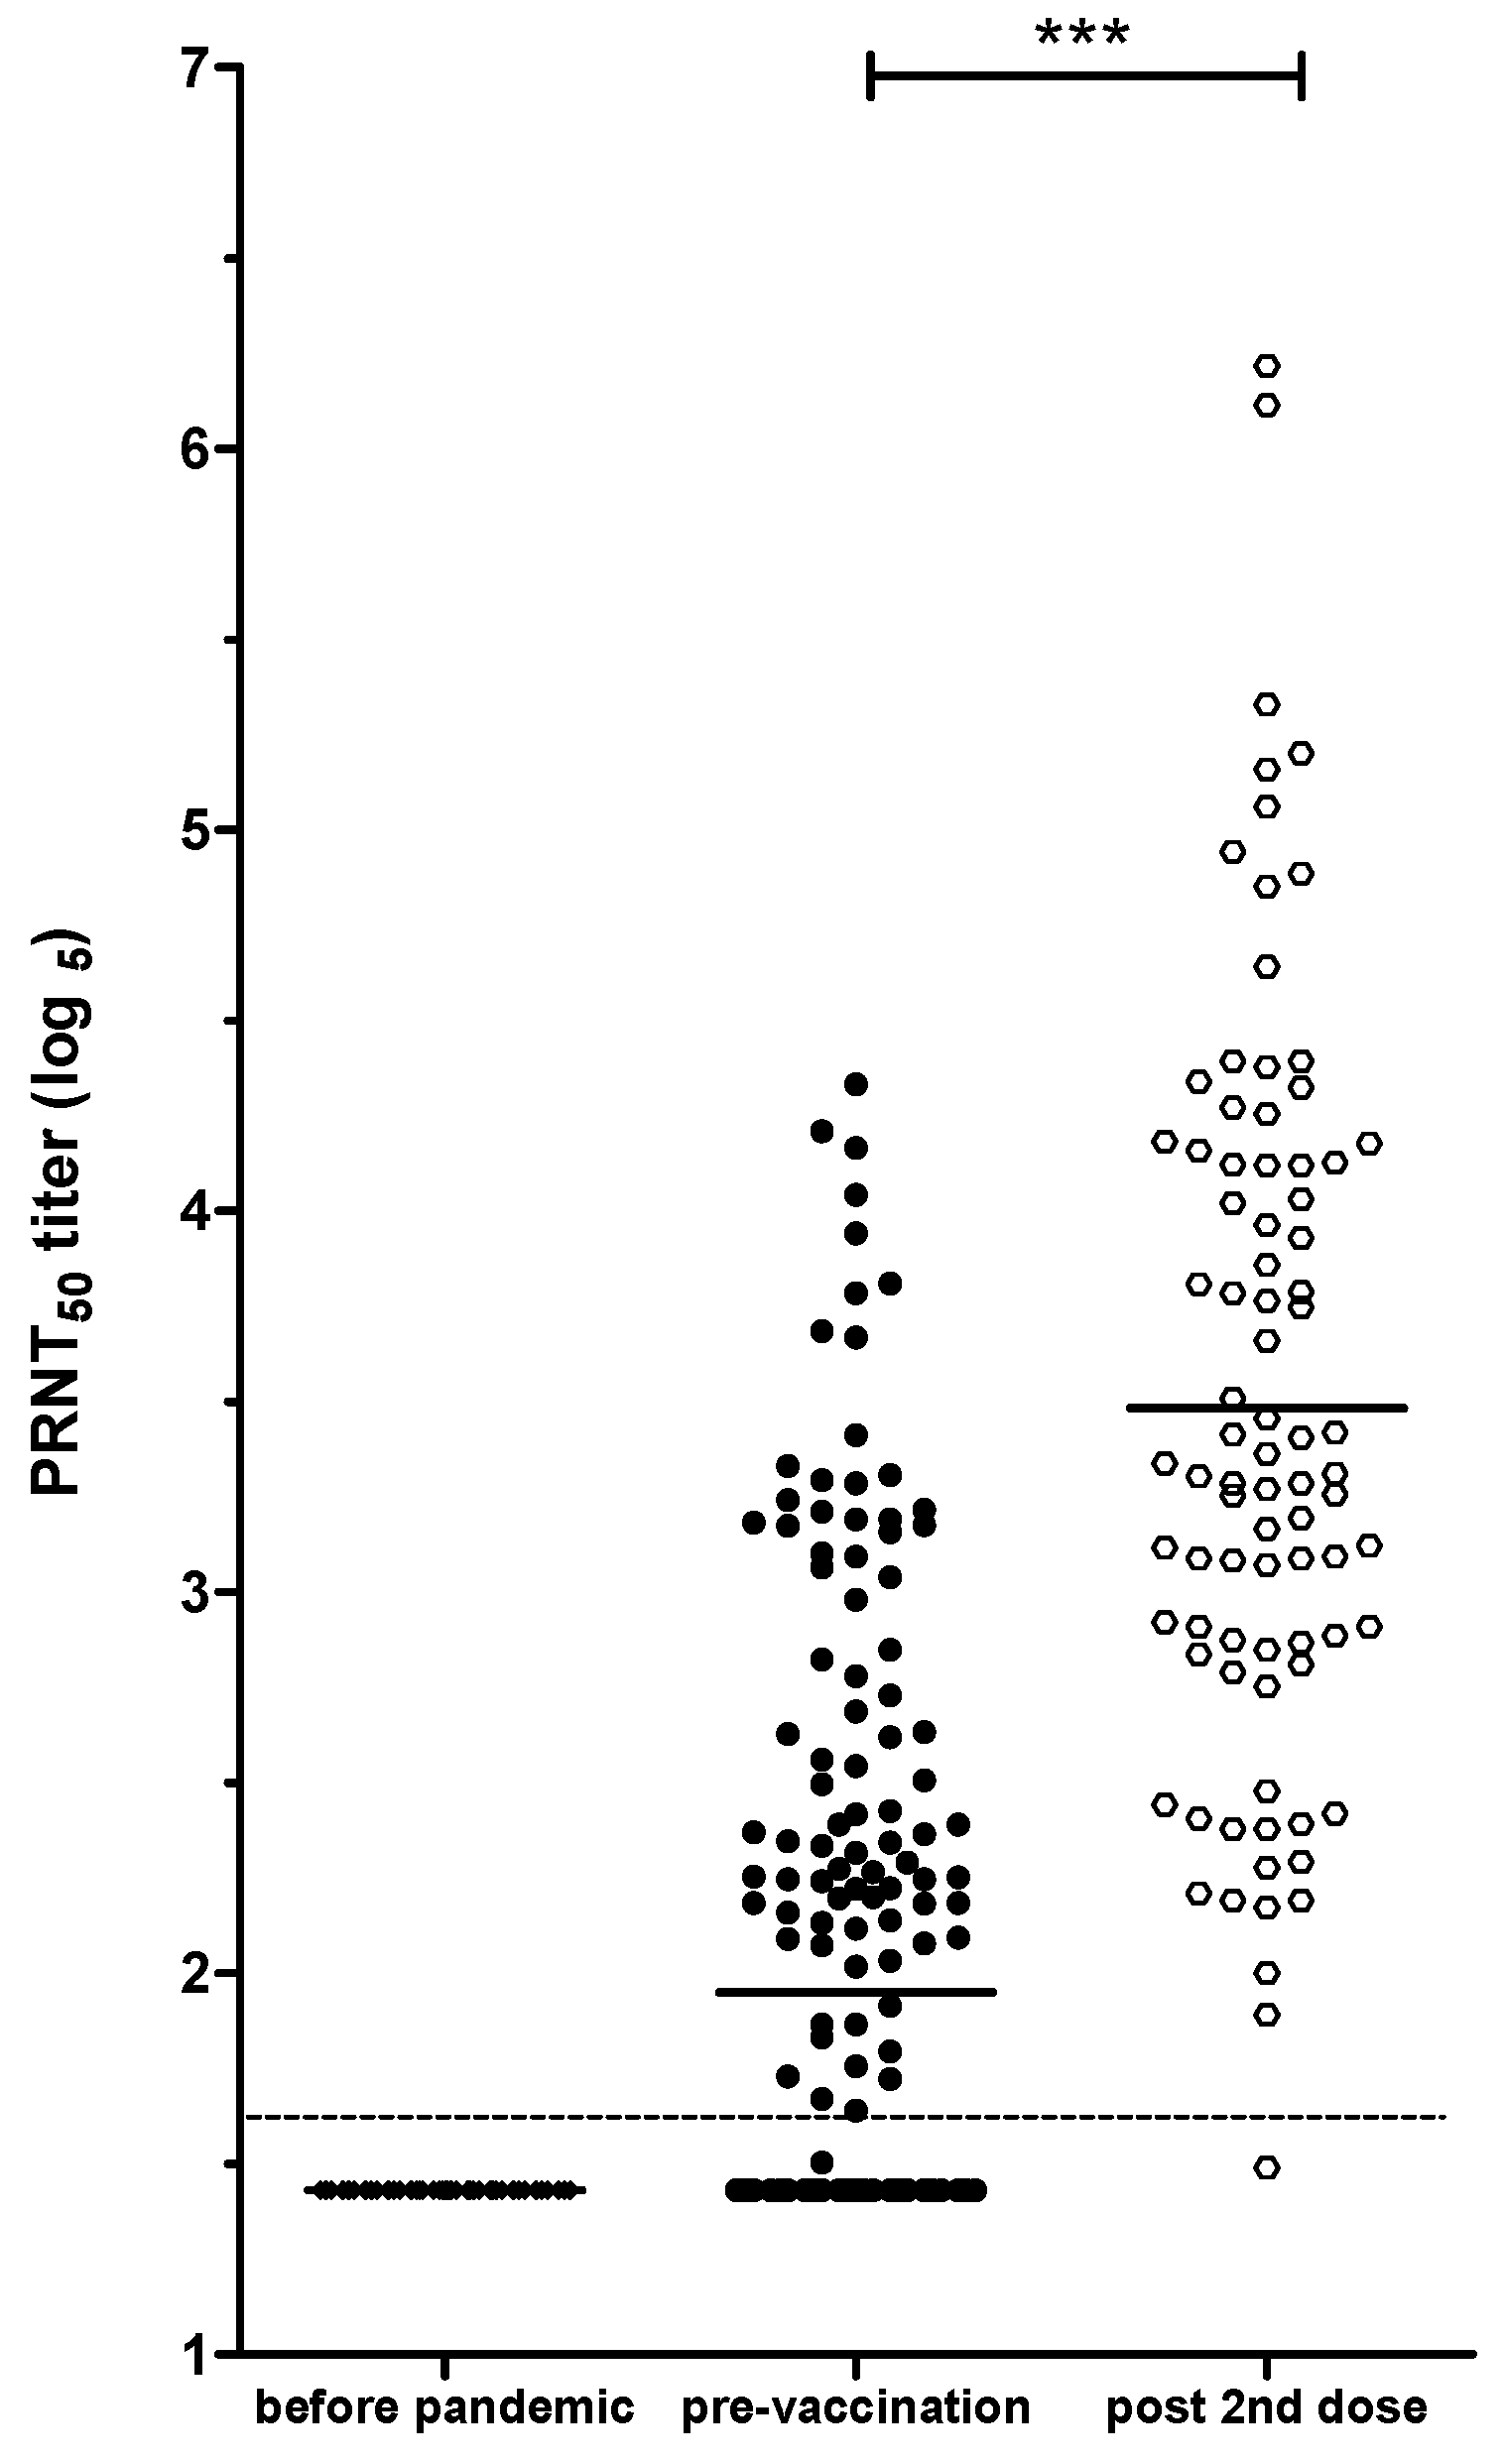
3.6. PRNT-SARS-CoV-2 as a Tool to Evaluate Immune Response in Individuals Vaccinated against COVID-19, with or without Natural SARS-CoV-2 Infection
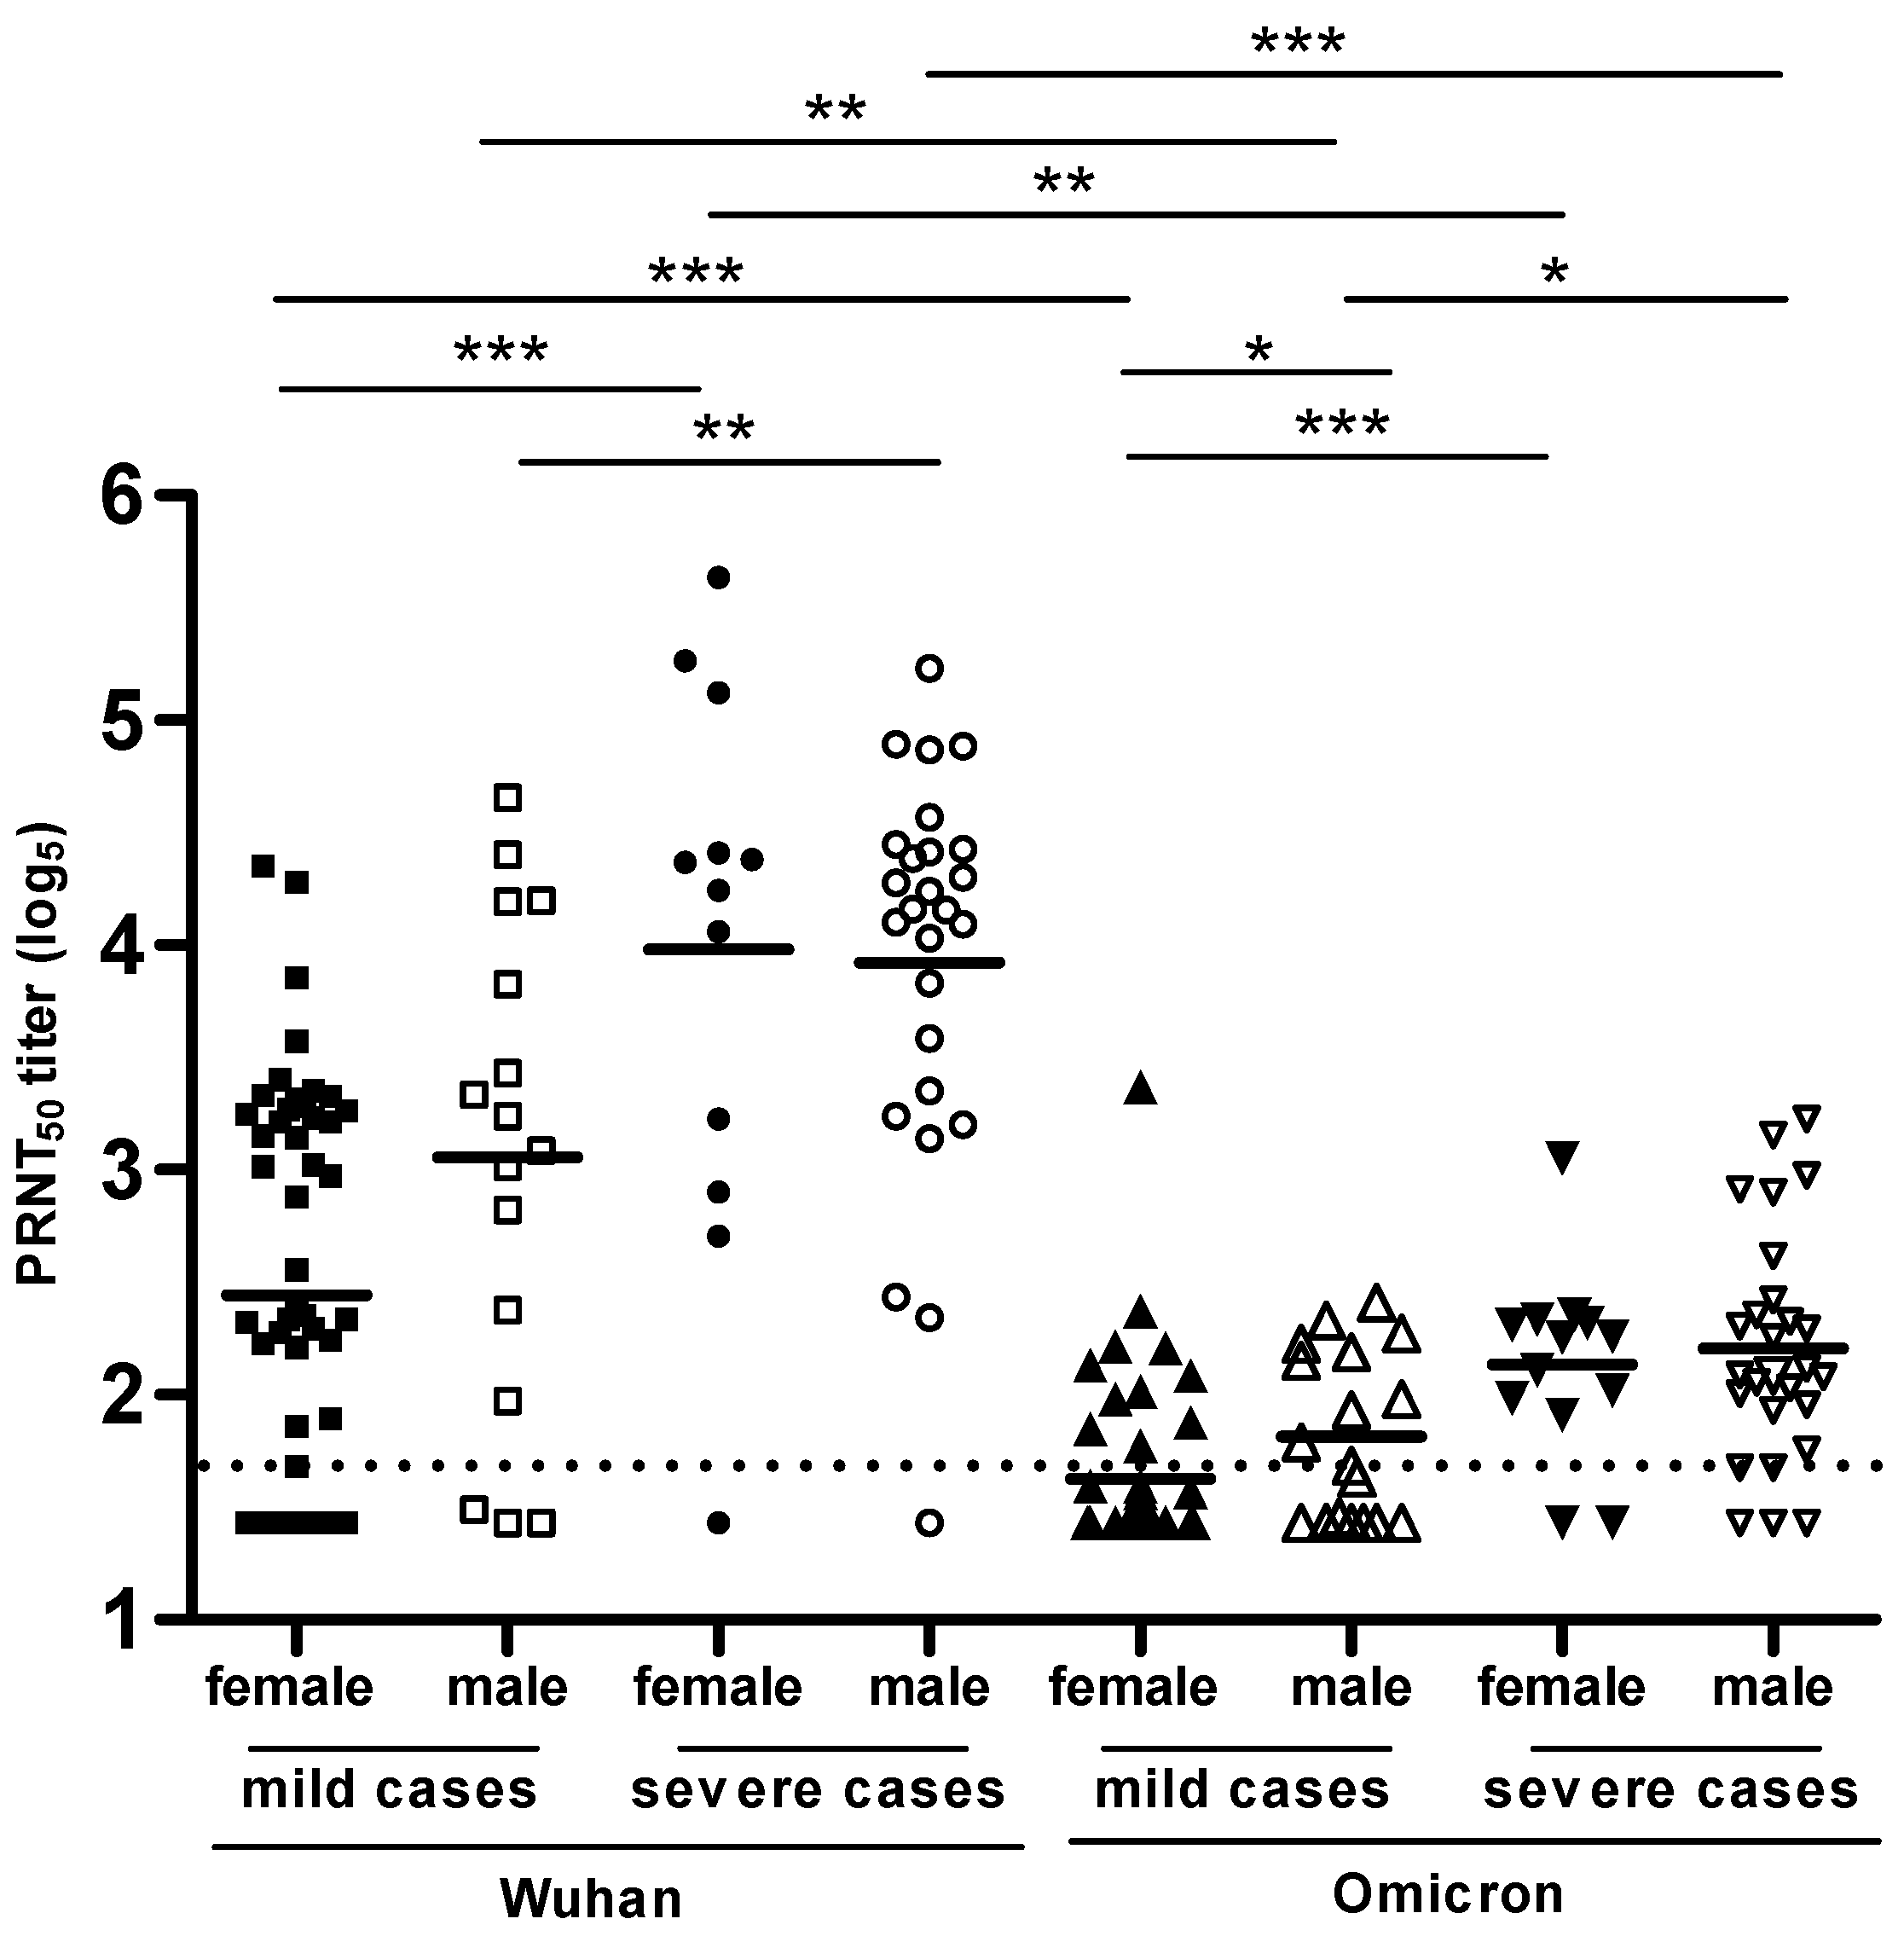
3.7. PRNT-SARS-CoV-2 Used to Compare the Levels of NAbs Produced Specific to the Wuhan Strain and the Omicron Variant in Volunteers with COVID-19 Disease
4. Discussion
Author Contributions
Funding
Institutional Review Board Statement
Informed Consent Statement
Data Availability Statement
Acknowledgments
Conflicts of Interest
References
- Wang, Z.; Yang, B.; Li, Q.; Wen, L.; Zhang, R. Clinical Features of 69 Cases with Coronavirus Disease 2019 in Wuhan, China. Clin. Infect. Dis. 2020, 71, 769–777. [Google Scholar] [CrossRef]
- Zhou, F.; Yu, T.; Du, R.; Fan, G.; Liu, Y.; Liu, Z.; Xiang, J.; Wang, Y.; Song, B.; Gu, X.; et al. Clinical Course and Risk Factors for Mortality of Adult Inpatients with COVID-19 in Wuhan, China: A Retrospective Cohort Study. Lancet 2020, 395, 1054–1062. [Google Scholar] [CrossRef]
- Wu, Z.; McGoogan, J.M. Characteristics of and Important Lessons from the Coronavirus Disease 2019 (COVID-19) Outbreak in China: Summary of a Report of 72,314 Cases from the Chinese Center for Disease Control and Prevention. JAMA 2020, 323, 1239–1242. [Google Scholar] [CrossRef] [PubMed]
- Letko, M.; Marzi, A.; Munster, V. Functional Assessment of Cell Entry and Receptor Usage for SARS-CoV-2 and Other Lineage B Betacoronaviruses. Nat. Microbiol. 2020, 5, 562–569. [Google Scholar] [CrossRef] [PubMed]
- Harvey, W.T.; Carabelli, A.M.; Jackson, B.; Gupta, R.K.; Thomson, E.C.; Harrison, E.M.; Ludden, C.; Reeve, R.; Rambaut, A.; COVID-19 Genomics UK (COG-UK) Consortium; et al. SARS-CoV-2 Variants, Spike Mutations and Immune Escape. Nat. Rev. Microbiol. 2021, 19, 409–424. [Google Scholar] [CrossRef]
- Shen, X.; Tang, H.; Pajon, R.; Smith, G.; Glenn, G.M.; Shi, W.; Korber, B.; Montefiori, D.C. Neutralization of SARS-CoV-2 Variants B.1.429 and B.1.351. N. Engl. J. Med. 2021, 384, 2352–2354. [Google Scholar] [CrossRef] [PubMed]
- Fiolet, T.; Kherabi, Y.; MacDonald, C.-J.; Ghosn, J.; Peiffer-Smadja, N. Comparing COVID-19 Vaccines for Their Characteristics, Efficacy and Effectiveness against SARS-CoV-2 and Variants of Concern: A Narrative Review. Clin. Microbiol. Infect. 2022, 28, 202–221. [Google Scholar] [CrossRef]
- Carvalho, T.; Krammer, F.; Iwasaki, A. The First 12 Months of COVID-19: A Timeline of Immunological Insights. Nat. Rev. Immunol. 2021, 21, 245–256. [Google Scholar] [CrossRef]
- Qi, H.; Liu, B.; Wang, X.; Zhang, L. The Humoral Response and Antibodies against SARS-CoV-2 Infection. Nat. Immunol. 2022, 23, 1008–1020. [Google Scholar] [CrossRef]
- Suthar, M.S.; Zimmerman, M.; Kauffman, R.; Mantus, G.; Linderman, S.; Vanderheiden, A.; Nyhoff, L.; Davis, C.; Adekunle, S.; Affer, M.; et al. Rapid Generation of Neutralizing Antibody Responses in COVID-19 Patients. medRxiv 2020, 9, 1–15. [Google Scholar] [CrossRef]
- Jackson, L.A.; Anderson, E.J.; Rouphael, N.G.; Roberts, P.C.; Makhene, M.; Coler, R.N.; McCullough, M.P.; Chappell, J.D.; Denison, M.R.; Stevens, L.J.; et al. An mRNA Vaccine against SARS-CoV-2-Preliminary Report. N. Engl. J. Med. 2020, 383, 1920–1931. [Google Scholar] [CrossRef] [PubMed]
- Wajnberg, A.; Amanat, F.; Firpo, A.; Altman, D.R.; Bailey, M.J.; Mansour, M.; McMahon, M.; Meade, P.; Mendu, D.R.; Muellers, K.; et al. Robust Neutralizing Antibodies to SARS-CoV-2 Infection Persist for Months. Science 2020, 370, 1227–1230. [Google Scholar] [CrossRef]
- Dan, J.M.; Mateus, J.; Kato, Y.; Hastie, K.M.; Yu, E.D.; Faliti, C.E.; Grifoni, A.; Ramirez, S.I.; Haupt, S.; Frazier, A.; et al. Immunological Memory to SARS-CoV-2 Assessed for up to 8 Months after Infection. Science 2021, 371, eabf4063. [Google Scholar] [CrossRef]
- Seow, J.; Graham, C.; Merrick, B.; Acors, S.; Pickering, S.; Steel, K.J.A.; Hemmings, O.; O’Byrne, A.; Kouphou, N.; Galao, R.P.; et al. Longitudinal Observation and Decline of Neutralizing Antibody Responses in the Three Months following SARS-CoV-2 Infection in Humans. Nat. Microbiol. 2020, 5, 1598–1607. [Google Scholar] [CrossRef] [PubMed]
- Wang, K.; Long, Q.-X.; Deng, H.-J.; Hu, J.; Gao, Q.-Z.; Zhang, G.-J.; He, C.-L.; Huang, L.-Y.; Hu, J.-L.; Chen, J.; et al. Longitudinal Dynamics of the Neutralizing Antibody Response to Severe Acute Respiratory Syndrome Coronavirus 2 (SARS-CoV-2) Infection. Clin. Infect. Dis. 2021, 73, e531–e539. [Google Scholar] [CrossRef]
- Dulbecco, R. Production of Plaques in Monolayer Tissue Cultures by Single Particles of an Animal Virus. Proc. Natl. Acad. Sci. USA 1952, 38, 747–752. [Google Scholar] [CrossRef] [PubMed]
- Dulbecco, R.; Vogt, M. Plaque Formation and Isolation of Pure Lines with Poliomyelitis Viruses. J. Exp. Med. 1954, 99, 167–182. [Google Scholar] [CrossRef]
- Russell, P.K.; Nisalak, A.; Sukhavachana, P.; Vivona, S. A Plaque Reduction Test for Dengue Virus Neutralizing Antibodies. J. Immunol. 1967, 99, 285–290. [Google Scholar] [CrossRef]
- Ennis, F.A. Immunity to Mumps in an Institutional Epidemic. Correlation of Insusceptibility to Mumps with Serum Plaque Neutralizing and Hemagglutination-Inhibiting Antibodies. J. Infect. Dis. 1969, 119, 654–657. [Google Scholar] [CrossRef]
- Porterfield, J.S. A Plaque Technique for the Titration of Yellow Fever Virus and Antisera. Trans. R. Soc. Trop. Med. Hyg. 1959, 53, 458–466. [Google Scholar] [CrossRef]
- Cohen, B.J.; Audet, S.; Andrews, N.; Beeler, J.; WHO working group on measles plaque reduction neutralization test. Plaque Reduction Neutralization Test for Measles Antibodies: Description of a Standardised Laboratory Method for Use in Immunogenicity Studies of Aerosol Vaccination. Vaccine 2007, 26, 59–66. [Google Scholar] [CrossRef]
- Weldon, W.C.; Oberste, M.S.; Pallansch, M.A. Standardized Methods for Detection of Poliovirus Antibodies. Methods Mol. Biol. 2016, 1387, 145–176. [Google Scholar] [CrossRef]
- Tomori, O.; Johnson, K.M.; Kiley, M.P.; Elliott, L.H. Standardization of a Plaque Assay for Lassa Virus. J. Med. Virol. 1987, 22, 77–89. [Google Scholar] [CrossRef] [PubMed]
- Okuno, Y.; Igarashi, A.; Fukai, K. Neutralization Tests for Dengue and Japanese Encephalitis Viruses by the Focus Reduction Method Using Peroxidase-Anti-Peroxidase Staining. Biken J. 1978, 21, 137–147. [Google Scholar] [PubMed]
- Albrecht, P.; Herrmann, K.; Burns, G.R. Role of Virus Strain in Conventional and Enhanced Measles Plaque Neutralization Test. J. Virol. Methods 1981, 3, 251–260. [Google Scholar] [CrossRef]
- Jacofsky, D.; Jacofsky, E.M.; Jacofsky, M. Understanding Antibody Testing for COVID-19. J. Arthroplast. 2020, 35, S74–S81. [Google Scholar] [CrossRef] [PubMed]
- Mauldin, J.; Carbone, K.; Hsu, H.; Yolken, R.; Rubin, S. Mumps Virus-Specific Antibody Titers from Pre-Vaccine Era Sera: Comparison of the Plaque Reduction Neutralization Assay and Enzyme Immunoassays. J. Clin. Microbiol. 2005, 43, 4847–4851. [Google Scholar] [CrossRef] [PubMed]
- Castro Dopico, X.; Ols, S.; Loré, K.; Karlsson Hedestam, G.B. Immunity to SARS-CoV-2 Induced by Infection or Vaccination. J. Intern. Med. 2022, 291, 32–50. [Google Scholar] [CrossRef]
- Machado, B.A.S.; Hodel, K.V.S.; Fonseca, L.M.D.S.; Pires, V.C.; Mascarenhas, L.A.B.; da Silva Andrade, L.P.C.; Moret, M.A.; Badaró, R. The Importance of Vaccination in the Context of the COVID-19 Pandemic: A Brief Update Regarding the Use of Vaccines. Vaccines 2022, 10, 591. [Google Scholar] [CrossRef]
- Khoury, D.S.; Cromer, D.; Reynaldi, A.; Schlub, T.E.; Wheatley, A.K.; Juno, J.A.; Subbarao, K.; Kent, S.J.; Triccas, J.A.; Davenport, M.P. Neutralizing Antibody Levels Are Highly Predictive of Immune Protection from Symptomatic SARS-CoV-2 Infection. Nat. Med. 2021, 27, 1205–1211. [Google Scholar] [CrossRef]
- Khoury, D.S.; Wheatley, A.K.; Ramuta, M.D.; Reynaldi, A.; Cromer, D.; Subbarao, K.; O’Connor, D.H.; Kent, S.J.; Davenport, M.P. Measuring Immunity to SARS-CoV-2 Infection: Comparing Assays and Animal Models. Nat. Rev. Immunol. 2020, 20, 727–738. [Google Scholar] [CrossRef] [PubMed]
- Lee, C.Y.-P.; Lin, R.T.P.; Renia, L.; Ng, L.F.P. Serological Approaches for COVID-19: Epidemiologic Perspective on Surveillance and Control. Front. Immunol. 2020, 11, 879. [Google Scholar] [CrossRef]
- Azamor, T.; Horbach, I.S.; Brito, E.; Cunha, D.; Melgaço, J.G.; Silva, A.M.V.D.; Tubarão, L.N.; Azevedo, A.S.; Santos, R.T.; Alves, N.D.S.; et al. Protective Immunity of COVID-19 Vaccination with ChAdOx1 nCoV-19 Following Previous SARS-CoV-2 Infection: A Humoral and Cellular Investigation. Viruses 2022, 14, 1916. [Google Scholar] [CrossRef] [PubMed]
- Gomes, M.P.B.; Linhares, J.H.R.; Dos Santos, T.P.; Pereira, R.C.; Santos, R.T.; da Silva, S.A.; Souza, M.C.O.; da Silva, J.F.A.; Trindade, G.F.; Gomes, V.S.; et al. Inactivated and Immunogenic SARS-CoV-2 for Safe Use in Immunoassays and as an Immunization Control for Non-Clinical Trials. Viruses 2023, 15, 1486. [Google Scholar] [CrossRef] [PubMed]
- CDC. Interim Laboratory Biosafety Guidelines for Handling and Processing Specimens Associated with Coronavirus Disease 2019 (COVID-19). 2021. Available online: https://www.cdc.gov/coronavirus/2019-nCoV/lab/lab-biosafety-guidelines.html (accessed on 1 December 2023).
- Magnusson, B.; Örnemark, U. (Eds.) Eurachem Guide: The Fitness for Purpose of Analytical Methods—A Laboratory Guide to Method Validation and Related Topics; A Laboratory Guide to Method Validation and Related Topics; LGC: London, UK, 2014; ISBN 978-91-87461-59-0. Available online: http://www.eurachem.org (accessed on 9 December 2023).
- WHO. WHO TRS 1019 Good Manufacturing Pratices Annex 3: Validation and Qualification. In WHO Expert Committee on Specifications for Pharmaceutical Preparations-Fifty-Third Report; World Health Organization: Geneva, Switzerland, 2019; Available online: https://www.who.int/publications/m/item/trs1019-annex3 (accessed on 9 December 2023).
- Who Guidelines on Validation—Appendix 4-Analytical Method Validation. Working Document QAS/16.671. 2016. Available online: https://dcvmn.org/wp-content/uploads/2017/01/who_guideline_validation_analyticalmethodvalidationqas16-671.pdf (accessed on 9 December 2023).
- European Medicines Agency. CPMP ICH Topic Q 2 (R1) Validation of Analytical Procedures: Text and Methodology. In Note For Guidance on Validation of Analytical Procedures: Text and Methodology (Cpmp/Ich/381/95); European Medicines Agency: Amsterdam, The Netherlands, 1995; Available online: https://www.ema.europa.eu/en/documents/scientific-guideline/ich-guideline-q2r1-validation-analytical-procedures-text-and-methodology-step-5-first-version_en.pdf (accessed on 9 December 2023).
- Bioanalytical Method Validation Guidance for Industry. 2018. Available online: https://www.fda.gov/regulatory-information/search-fda-guidance-documents/bioanalytical-method-validation-guidance-industry (accessed on 5 December 2023).
- USP 1237 VIROLOGY TEST METHODS. 2020. Available online: https://doi.usp.org/USPNF/USPNF_M915_01_01.html (accessed on 5 December 2023).
- USP 1225 Validation of Compendial Procedures. 2020. Available online: http://ftp.uspbpep.com/v29240/usp29nf24s0_c1225.html (accessed on 5 December 2023).
- Pereira, P.R.T. ANVISA RDCo27/2012. Available online: https://bvsms.saude.gov.br/bvs/saudelegis/anvisa/2012/rdc0027_17_05_2012.html (accessed on 5 December 2023).
- Rosner, B. Fundamentals of Biostatistical; Cengage Learning: Carolyn Crockets, MA, USA, 2000. [Google Scholar]
- Armitage, P.; Berry, G.; Matthews, J.N.S. Statistical Methods in Medical Research; John Wiley & Sons: Hoboken, NJ, USA, 2002; ISBN 978-0-470-77366-6. [Google Scholar]
- Committee for Medicinal Products for Human Use (CHMP). COMIRNATY; European Medicines Agencyl: Amsterdam, The Netherlands, 2021. [Google Scholar]
- Thuluva, S.; Paradkar, V.; Gunneri, S.R.; Yerroju, V.; Mogulla, R.; Turaga, K.; Kyasani, M.; Manoharan, S.K.; Medigeshi, G.; Singh, J.; et al. Evaluation of Safety and Immunogenicity of Receptor-Binding Domain-Based COVID-19 Vaccine (Corbevax) to Select the Optimum Formulation in Open-Label, Multicentre, and Randomised Phase-1/2 and Phase-2 Clinical Trials. eBioMedicine 2022, 83, 104217. [Google Scholar] [CrossRef]
- Song, J.Y.; Choi, W.S.; Heo, J.Y.; Kim, E.J.; Lee, J.S.; Jung, D.S.; Kim, S.-W.; Park, K.-H.; Eom, J.S.; Jeong, S.J.; et al. Immunogenicity and Safety of SARS-CoV-2 Recombinant Protein Nanoparticle Vaccine GBP510 Adjuvanted with AS03: Interim Results of a Randomised, Active-Controlled, Observer-Blinded, Phase 3 Trial. eClinicalMedicine 2023, 64, 102140. [Google Scholar] [CrossRef]
- Moo-Young, M. Comprehensive Biotechnology; Elsevier: Amsterdam, The Netherlands, 2011; ISBN 978-0-08-088504-9. [Google Scholar]
- Valcourt, E.J.; Manguiat, K.; Robinson, A.; Lin, Y.-C.; Abe, K.T.; Mubareka, S.; Shigayeva, A.; Zhong, Z.; Girardin, R.C.; DuPuis, A.; et al. Evaluating Humoral Immunity against SARS-CoV-2: Validation of a Plaque-Reduction Neutralization Test and a Multilaboratory Comparison of Conventional and Surrogate Neutralization Assays. Microbiol. Spectr. 2021, 9, e0088621. [Google Scholar] [CrossRef]
- Espejo, A.P.; Akgun, Y.; Al Mana, A.F.; Tjendra, Y.; Millan, N.C.; Gomez-Fernandez, C.; Cray, C. Review of Current Advances in Serologic Testing for COVID-19. Am. J. Clin. Pathol. 2020, 154, 293–304. [Google Scholar] [CrossRef]
- Habli, Z.; Saleh, S.; Zaraket, H.; Khraiche, M.L. COVID-19 in-Vitro Diagnostics: State-of-the-Art and Challenges for Rapid, Scalable, and High-Accuracy Screening. Front. Bioeng. Biotechnol. 2020, 8, 605702. [Google Scholar] [CrossRef]
- Montesinos, I.; Dahma, H.; Wolff, F.; Dauby, N.; Delaunoy, S.; Wuyts, M.; Detemmerman, C.; Duterme, C.; Vandenberg, O.; Martin, C.; et al. Neutralizing Antibody Responses following Natural SARS-CoV-2 Infection: Dynamics and Correlation with Commercial Serologic Tests. J. Clin. Virol. 2021, 144, 104988. [Google Scholar] [CrossRef]
- Cunha, L.E.R.; Stolet, A.A.; Strauch, M.A.; Pereira, V.A.R.; Dumard, C.H.; Gomes, A.M.O.; Monteiro, F.L.; Higa, L.M.; Souza, P.N.C.; Fonseca, J.G.; et al. Polyclonal F(Ab’)2 Fragments of Equine Antibodies Raised against the Spike Protein Neutralize SARS-CoV-2 Variants with High Potency. iScience 2021, 24, 103315. [Google Scholar] [CrossRef] [PubMed]
- Chu, J.J.H.; Ahidjo, B.A.; Mok, C.K. SARS-CoV-2 Methods and Protocols; Methods in Molecular Biology; Humana Press Inc.: Totowa, NJ, USA, 2022; p. 2452. ISBN 978-1-07-162111-0. [Google Scholar]
- Cyster, J.G.; Allen, C.D.C. B Cell Responses–Cell Interaction Dynamics and Decisions. Cell 2019, 177, 524–540. [Google Scholar] [CrossRef]
- Goldblatt, D.; Alter, G.; Crotty, S.; Plotkin, S.A. Correlates of Protection against SARS-CoV-2 Infection and COVID-19 Disease. Immunol. Rev. 2022, 310, 6–26. [Google Scholar] [CrossRef]
- Plotkin, S.A. Correlates of Protection Induced by Vaccination. Clin. Vaccine Immunol. 2010, 17, 1055–1065. [Google Scholar] [CrossRef]
- Zheng, X.; Duan, R.; Gong, F.; Wei, X.; Dong, Y.; Chen, R.; Liang, M.; Tang, C.; Lu, L. Accuracy of Serological Tests for COVID-19: A Systematic Review and Meta-Analysis. Front. Public. Health 2022, 10, 923525. [Google Scholar] [CrossRef] [PubMed]
- Cotugno, N.; Ruggiero, A.; Bonfante, F.; Petrara, M.R.; Zicari, S.; Pascucci, G.R.; Zangari, P.; De Ioris, M.A.; Santilli, V.; Manno, E.C.; et al. Virological and Immunological Features of SARS-CoV-2-Infected Children Who Develop Neutralizing Antibodies. Cell Rep. 2021, 34, 108852. [Google Scholar] [CrossRef] [PubMed]
- Deshpande, G.R.; Sapkal, G.N.; Tilekar, B.N.; Yadav, P.D.; Gurav, Y.; Gaikwad, S.; Kaushal, H.; Deshpande, K.S.; Kaduskar, O.; Sarkale, P.; et al. Neutralizing Antibody Responses to SARS-CoV-2 in COVID-19 Patients. Indian. J. Med. Res. 2020, 152, 82–87. [Google Scholar] [CrossRef]
- Merluza, J.; Ung, J.; Makowski, K.; Robinson, A.; Manguiat, K.; Mueller, N.; Audet, J.; Chen, J.C.-Y.; Strong, J.E.; Wood, H.; et al. Validation and Establishment of the SARS-CoV-2 Lentivirus Surrogate Neutralization Assay as a Prescreening Tool for the Plaque Reduction Neutralization Test. Microbiol. Spectr. 2023, 11, e03789-22. [Google Scholar] [CrossRef]
- Metz, C.E. Basic Principles of ROC Analysis. Semin. Nucl. Med. 1978, 8, 283–298. [Google Scholar] [CrossRef]
- Suhail, A.R. Methods of Clinical Epidemiology; Springer Series on Epidemiology and Public Health; Springer: Berlin/Heidelberg, Germany, 2013; ISBN 978-3-642-37131-8. [Google Scholar]
- DeLong, E.R.; DeLong, D.M.; Clarke-Pearson, D.L. Comparing the Areas under Two or More Correlated Receiver Operating Characteristic Curves: A Nonparametric Approach. Biometrics 1988, 44, 837–845. [Google Scholar] [CrossRef]
- Hashem, A.M.; Algaissi, A.; Almahboub, S.A.; Alfaleh, M.A.; Abujamel, T.S.; Alamri, S.S.; Alluhaybi, K.A.; Hobani, H.I.; AlHarbi, R.H.; Alsulaiman, R.M.; et al. Early Humoral Response Correlates with Disease Severity and Outcomes in COVID-19 Patients. Viruses 2020, 12, 1390. [Google Scholar] [CrossRef] [PubMed]
- Gao, Y.; Ding, M.; Dong, X.; Zhang, J.; Kursat Azkur, A.; Azkur, D.; Gan, H.; Sun, Y.; Fu, W.; Li, W.; et al. Risk Factors for Severe and Critically Ill COVID-19 Patients: A Review. Allergy 2021, 76, 428–455. [Google Scholar] [CrossRef] [PubMed]
- Pulliam, J.R.C.; van Schalkwyk, C.; Govender, N.; von Gottberg, A.; Cohen, C.; Groome, M.J.; Dushoff, J.; Mlisana, K.; Moultrie, H. Increased Risk of SARS-CoV-2 Reinfection Associated with Emergence of Omicron in South Africa. Science 2022, 376, eabn4947. [Google Scholar] [CrossRef] [PubMed]
- Cao, Y.; Wang, J.; Jian, F.; Xiao, T.; Song, W.; Yisimayi, A.; Huang, W.; Li, Q.; Wang, P.; An, R.; et al. Omicron Escapes the Majority of Existing SARS-CoV-2 Neutralizing Antibodies. Nature 2022, 602, 657–663. [Google Scholar] [CrossRef]
- Cele, S.; Jackson, L.; Khoury, D.S.; Khan, K.; Moyo-Gwete, T.; Tegally, H.; San, J.E.; Cromer, D.; Scheepers, C.; Amoako, D.G.; et al. Omicron Extensively but Incompletely Escapes Pfizer BNT162b2 Neutralization. Nature 2022, 602, 654–656. [Google Scholar] [CrossRef]


| Validation Step | Design | Runs | Replicates | Acceptance Criteria |
|---|---|---|---|---|
| Selectivity | DENV + SARS-CoV-2, ZIKV + SARS-CoV-2, YFV + SARS-CoV-2, and MV + SARS-CoV-2 | 1 | 3 | Compliant if 80% of SARS-CoV-2 positive samples, when mixed with positive samples for DENV, ZIKV, YFV, and MV, present titers below four-fold variation, compared with positive serum only for SARS-CoV-2 |
| Precision | 18 positive SARS-CoV-2 sera (6 low, 6 medium, and 6 high titers) | 3 | 3 | Compliant if more than 90% of the results are within 4-fold the mean titer difference in more than 80% of the positive samples tested |
| Accuracy | standard serum diluted or not in 1:2, 1:4, 1:16, and 1:32 in negative serum | 3 | 5 | Compliant if the absolute difference between the expected and observed values is below log53 = 0.68 in more than 80% for each dilution |
| Robustness | adsorption time: 30, 60, and 90 min; monolayer preparation: N-1 and N-2 | 3 | 1 | Compliant if the average experimental value of each series is within the variation limit (log53 = 0.68) when compared to the results obtained in the reference test |
| Assay Characteristic | Reference-Standard PRNT | PRNT SARS-CoV-2 Tested Conditions | PRNT SARS-CoV-2 Selected Condition |
|---|---|---|---|
| Cell concentration | NA | 120,000 cells/well | 200,000 cells/well |
| 200,000 cells/well | |||
| Virus dilution | 100 PFU/100 µL | 60 PFU/60 µL | 60 PFU/60 µL |
| 70 PFU/60 µL | |||
| 100 PFU/60 µL | |||
| Overlay | 1.5% CMC in MEM, 4% FBS, 37 °C, 72 h | 1.5% CMC in E199, 5% FBS, 37 °C, 72 h | 1.5% CMC in E199, 5% FBS, 37 °C, 72 h |
| 2.0% CMC in E199, 5% FBS, 37 °C, 72 h | |||
| 2.5% CMC in E199, 5% FBS, 37 °C, 72 h |
| Sample | GMT | GMT log5 | Average log5 | Absolute Difference | Criteria | Conclusion |
|---|---|---|---|---|---|---|
| SARS-CoV-2 | 419 | 3.75 | 3.75 | NA | NA | NA |
| SARS-CoV-2 + DENV | 447 | 3.79 | 3.61 | 0.15 | 0.43 (up to 2-fold) | Compliant |
| 203 | 3.3 | |||||
| 401 | 3.72 | |||||
| SARS-CoV-2 + ZIKV | 378 | 3.69 | 3.57 | 0.18 | 0.43 (up to 2-fold) | Compliant |
| 322 | 3.59 | |||||
| 250 | 3.43 | |||||
| SARS-CoV-2 + YFV | 291 | 3.52 | 3.66 | 0.09 | 0.43 (up to 2-fold) | Compliant |
| 399 | 3.72 | |||||
| 408 | 3.73 | |||||
| SARS-CoV-2 + MV | 559 | 3.93 | 3.73 | 0.02 | 0.43 (up to 2-fold) | Compliant |
| 439 | 3.78 | |||||
| 275 | 3.49 |
| Titer (log5) | Obtained Values (log5) | Expected Values (log5) | Absolute Difference (log5) (%) | Criteria | Conclusion | |||
|---|---|---|---|---|---|---|---|---|
| Assay #1 | Assay #2 | Assay #3 | ||||||
| Not diluted | 4.09 | 4.12 | 4.36 | 4.17 | - | - | - | - |
| 4.09 | 4.20 | 4.26 | ||||||
| 3.93 | 4.03 | 4.42 | ||||||
| 4.13 | 4.17 | 4.49 | ||||||
| 4.05 | 4.09 | 4.16 | ||||||
| 1:2 | 3.33 | 3.22 | 3.79 | 3.37 | 3.74 | 0.37 | <0.68 | Compliant |
| 3.31 | 3.27 | 3.35 | ||||||
| 3.31 | 3.65 | 3.42 | ||||||
| 3.36 | 3.24 | 3.28 | ||||||
| 3.27 | 3.22 | 3.52 | ||||||
| 1:4 | 3.12 | 3.11 | 3.10 | 3.12 | 3.31 | 0.19 | <0.68 | Compliant |
| 3.11 | 3.11 | 3.07 | ||||||
| 3.17 | 2.97 | 3.58 | ||||||
| 3.13 | 2.90 | 3.37 | ||||||
| 3.02 | 2.86 | 3.13 | ||||||
| 1:16 | 2.35 | 2.17 | 2.41 | 2.26 | 2.45 | 0.19 | <0.68 | Compliant |
| 2.28 | 2.13 | 2.38 | ||||||
| 2.12 | 2.18 | 2.36 | ||||||
| 2.11 | 2.21 | 2.33 | ||||||
| 2.29 | 2.26 | 2.30 | ||||||
| 1:32 | 1.99 | 2.18 | 2.10 | 2.17 | 2.02 | 0.15 | <0.68 | Compliant |
| 2.18 | 2.13 | 2.23 | ||||||
| 2.19 | 2.16 | 2.20 | ||||||
| 2.26 | 2.24 | 2.16 | ||||||
| 2.13 | 1.96 | 2.40 | ||||||
| Titer | Sample | Repetition | Mean Δ (log5) | Global Δ (log5) | Criteria | Conclusion |
|---|---|---|---|---|---|---|
| Low | #1 | 1 | 0.102 | 0.100 | <0.86 | Compliant |
| 2 | 0.148 | |||||
| 3 | 0.051 | |||||
| #2 | 1 | 0.145 | 0.103 | Compliant | ||
| 2 | 0.120 | |||||
| 3 | 0.043 | |||||
| #3 | 1 | 0.070 | 0.096 | Compliant | ||
| 2 | 0.100 | |||||
| 3 | 0.166 | |||||
| #4 | 1 | 0.117 | 0.093 | Compliant | ||
| 2 | 0.089 | |||||
| 3 | 0.074 | |||||
| #5 | 1 | 0.279 | 0.279 | Compliant | ||
| 2 | 0.279 | |||||
| 3 | NA | |||||
| #6 | 1 | 0.346 | 0.286 | Compliant | ||
| 2 | 0.320 | |||||
| 3 | 0.191 | |||||
| Medium | #1 | 1 | 0.369 | 0.372 | <0.86 | Compliant |
| 2 | 0.397 | |||||
| 3 | 0.350 | |||||
| #2 | 1 | 0.350 | 0.288 | Compliant | ||
| 2 | 0.363 | |||||
| 3 | 0.150 | |||||
| #3 | 1 | 0.358 | 0.269 | Compliant | ||
| 2 | 0.378 | |||||
| 3 | 0.071 | |||||
| #4 | 1 | 0.518 | 0.369 | Compliant | ||
| 2 | 0.371 | |||||
| 3 | 0.217 | |||||
| #5 | 1 | 0.123 | 0.191 | Compliant | ||
| 2 | 0.286 | |||||
| 3 | 0.163 | |||||
| #6 | 1 | 0.496 | 0.424 | Compliant | ||
| 2 | 0.421 | |||||
| 3 | 0.354 | |||||
| High | #1 | 1 | 0.319 | 0.234 | <0.86 | Compliant |
| 2 | 0.270 | |||||
| 3 | 0.113 | |||||
| #2 | 1 | 0.298 | 0.316 | Compliant | ||
| 2 | 0.508 | |||||
| 3 | 0.143 | |||||
| #3 | 1 | 0.081 | 0.089 | Compliant | ||
| 2 | 0.065 | |||||
| 3 | 0.122 | |||||
| #4 | 1 | 0.220 | 0.146 | Compliant | ||
| 2 | 0.098 | |||||
| 3 | 0.122 | |||||
| #5 | 1 | 0.194 | 0.234 | Compliant | ||
| 2 | 0.300 | |||||
| 3 | 0.209 | |||||
| #6 | 1 | 0.511 | 0.341 | Compliant | ||
| 2 | 0.256 | |||||
| 3 | 0.255 |
| Positive Control | Conditions | Assay #1 | Assay #2 | Assay #3 | Conclusion | |||||
|---|---|---|---|---|---|---|---|---|---|---|
| Positive Control Mean (log5) | Δ | Positive Control Mean (log5) | Δ | Positive Control Mean (log5) | Δ | |||||
| Positive control Standard condition | 3.38 | N-1 | 30 m | 3.07 | 0.16 | 2.91 | 0.33 | 3.16 | 0.08 | Compliant |
| 3.14 | 60 m | 3.26 | 0.03 | 3.13 | 0.11 | 2.81 | 0.08 | Compliant | ||
| 3.18 | 90 m | 4.43 | 1.20 | 3.52 | 0.28 | 3.30 | 0.06 | Non-compliant | ||
| 3.07 | N-2 | 30 m | 3.64 | 0.40 | 3.01 | 0.23 | 3.08 | 0.16 | Compliant | |
| 3.38 | 60 m | 3.29 | 0.06 | 3.12 | 0.12 | 3.15 | 0.09 | Compliant | ||
| 3.24 | 90 m | 3.54 | 0.30 | 3.27 | 0.04 | 3.96 | 0.73 | Non-compliant | ||
| Mean | 3.23 | |||||||||
| Negative control Standard condition | 1.98 | N-1 | 30 m | 1.43 | 0.14 | 1.43 | 0.14 | 1.43 | 0.14 | Compliant |
| 1.53 | 60 m | 1.36 | 0.21 | 1.62 | 0.04 | 1.62 | 0.14 | Compliant | ||
| 1.43 | 90 m | 1.43 | 0.14 | 1.43 | 0.14 | 1.43 | 0.14 | Compliant | ||
| 1.62 | N-2 | 30 m | 1.43 | 0.14 | 1.60 | 0.03 | 1.43 | 0.14 | Compliant | |
| 1.43 | 60 m | 1.43 | 0.14 | 1.43 | 0.14 | 1.43 | 0.14 | Compliant | ||
| 1.43 | 90 m | 1.54 | 0.03 | 1.43 | 0.14 | 1.43 | 0.14 | Compliant | ||
| Mean | 1.57 | |||||||||
Disclaimer/Publisher’s Note: The statements, opinions and data contained in all publications are solely those of the individual author(s) and contributor(s) and not of MDPI and/or the editor(s). MDPI and/or the editor(s) disclaim responsibility for any injury to people or property resulting from any ideas, methods, instructions or products referred to in the content. |
© 2024 by the authors. Licensee MDPI, Basel, Switzerland. This article is an open access article distributed under the terms and conditions of the Creative Commons Attribution (CC BY) license (https://creativecommons.org/licenses/by/4.0/).
Share and Cite
Horbach, I.S.; de Souza Azevedo, A.; Schwarcz, W.D.; Alves, N.d.S.; de Moura Dias, B.; Setatino, B.P.; da Cruz Moura, L.; de Souza, A.F.; Denani, C.B.; da Silva, S.A.; et al. Plaque Reduction Neutralization Test (PRNT) Accuracy in Evaluating Humoral Immune Response to SARS-CoV-2. Diseases 2024, 12, 29. https://doi.org/10.3390/diseases12010029
Horbach IS, de Souza Azevedo A, Schwarcz WD, Alves NdS, de Moura Dias B, Setatino BP, da Cruz Moura L, de Souza AF, Denani CB, da Silva SA, et al. Plaque Reduction Neutralization Test (PRNT) Accuracy in Evaluating Humoral Immune Response to SARS-CoV-2. Diseases. 2024; 12(1):29. https://doi.org/10.3390/diseases12010029
Chicago/Turabian StyleHorbach, Ingrid Siciliano, Adriana de Souza Azevedo, Waleska Dias Schwarcz, Nathalia dos Santos Alves, Brenda de Moura Dias, Bruno Pimenta Setatino, Luma da Cruz Moura, Ariane Faria de Souza, Caio Bidueira Denani, Stephanie Almeida da Silva, and et al. 2024. "Plaque Reduction Neutralization Test (PRNT) Accuracy in Evaluating Humoral Immune Response to SARS-CoV-2" Diseases 12, no. 1: 29. https://doi.org/10.3390/diseases12010029
APA StyleHorbach, I. S., de Souza Azevedo, A., Schwarcz, W. D., Alves, N. d. S., de Moura Dias, B., Setatino, B. P., da Cruz Moura, L., de Souza, A. F., Denani, C. B., da Silva, S. A., Pimentel, T. G., de Oliveira Silva Ferreira, V., Azamor, T., Ano Bom, A. P. D., da Penha Gomes Gouvea, M., Mill, J. G., Valim, V., Polese, J., Campi-Azevedo, A. C., ... de Sousa Junior, I. P. (2024). Plaque Reduction Neutralization Test (PRNT) Accuracy in Evaluating Humoral Immune Response to SARS-CoV-2. Diseases, 12(1), 29. https://doi.org/10.3390/diseases12010029