Article

Continuity of Use of Food Delivery Apps: An Integrated Approach to the Health Belief Model and the Technology Readiness and Acceptance Model

by
Graça Miranda Silva
1,*,
Álvaro Dias
2,3 and
Maria Simão Rodrigues
4
1
ADVANCE/CSG, ISEG, Lisbon School of Economics & Management, Universidade de Lisboa, 1249-078 Lisbon, Portugal
2
The Transdisciplinary Research Center of Innovation & Entrepreneurship Ecosystems (TRIE), Universidade Lusófona, 1749-024 Lisbon, Portugal
3
Department of Marketing, Operation and General Management (IBS), ISCTE-IUL, 1649-026 Lisbon, Portugal
4
ISEG, Lisbon School of Economics & Management, Universidade de Lisboa, 1249-078 Lisbon, Portugal
*
Author to whom correspondence should be addressed.
J. Open Innov. Technol. Mark. Complex. 2022, 8(3), 114; https://doi.org/10.3390/joitmc8030114
Submission received: 6 June 2022 / Revised: 4 July 2022 / Accepted: 5 July 2022 / Published: 6 July 2022

Abstract

:
The pandemic forced both organizations and consumers to make many adjustments to their daily lives. However, due the technological advances that have been seen in recent years, some tools have become much more widely used. Among them are the food delivery applications (FDAs) that experienced an exponential growth during the pandemic. This study proposes an integrated model based on the health belief model and the technology readiness and acceptance model to better understand the determinants of users’ continuance intention to use FDAs. Empirical data collected from 288 Portuguese users of FDAs during the pandemic was analyzed using partial least squares structural equation modeling. The results show that both the perceived susceptibility to and severity of COVID-19 infection positively influenced the perceived usefulness of food delivery applications. Technology readiness is also a predictor of perceived usefulness. Both self-efficacy and technology readiness predict users’ perceived ease of use. Users’ continuance intention to use food delivery applications is directly influenced by perceived usefulness and ease of use and indirectly by self-efficacy, technology readiness, perceived severity, and perceived susceptibility.

1. Introduction

The recent pandemic (COVID-19) erupted as a severe infectious disease in late 2019, progressively expanding to rapidly assume a worldwide expansion [1]. Several innovative measures have been presented and proposed to mitigate the situation, such as the use of a protective mask, social distancing and self-isolation, among others, all of them strongly recommended by the World Health Organization [2] and aimed at reducing the risk of disease transmission [1,3]. Given this situation, fewer consumers intend to use many services, such as the traditional restaurant industry, which suffered and suffers dramatically during this pandemic [4].
The negative influence of COVID-19 on supply and demand in the restaurant industry changed people’s consumption habits and accelerated the transformation of restaurant companies from traditional service to online services, to seek to survive the pandemic situation [4,5]. It is in this process that technology, based on a well-known growth of wireless communication technologies and high internet penetration rates, is seen by food service businesses as an important resource for innovation and competitiveness [6].
The rise of digital technologies has led to a reshaping of markets, and the convenience of being able to order food more easily, with vast options to choose from, has enabled consumers to shift to on-demand shopping through websites or apps [7]. In 2019, online food delivery services reached a value of USD 107.4 billion worldwide and are expected to be worth USD 182.3 billion by 2024 [8]. Food delivery services through online apps have become a global trend [9]. This type of application is among the fastest growing sectors of mobile applications [8].
During the COVID-19 pandemic, the use of food delivery applications (FDAs) has not only met the requirements of businesses but also the demands of customers for convenient food supplies and personal safety concerns since these applications allow customers to effectively and easily order and access their food from several restaurants at convenient times and locations [10]. Consequently, the factors that have motivated users to use these same applications continuously during this pandemic situation are essential to understanding online food delivery purchasing behavior and decision-making processes regarding FDA services.
Several theoretical perspectives have been applied to understand the usage behavior of a new technology and research focused on technology acceptance has been reported in the past two decades [11]. Among these, TAM (technology acceptance model) suggested by Davis [12], and TR (technology readiness) suggested by Parasuraman [13] have been popular models, used to study the factors that contribute to the acceptance of a new technology [14]. Perceived ease of use and perceived usefulness are considered the most important constructs of TAM [15] since users’ acceptance or rejection of a technology is mainly influenced by them [12]. However, these two constructs are both affected by external variables. Therefore, to better explain users’ technology adoption and continued usage of a technology (FDA in our study) it is important to understand the antecedents of perceived usefulness and perceived ease of use. TR has been recognized as an important antecedent of TAM constructs (e.g., [16,17]). TRAM (technology readiness and acceptance model), suggested by Lin et al. [17], is an extended model that combines TAM and TR. Despite the recognized importance of TR as an antecedent of TAM, the application of TRAM to explain the adoption and post-adoption of technologies in the mobile applications arena has been scarce. Some exceptions are the study of Aboelmaged et al. [18] in the context of mobile apps’ use for wellness and fitness applications, Ferreira et al. [19] in the context of mobile self-scanning applications, Jin (2020) in the context of brand applications, and Chiu and Cho [20] in the context of health and fitness applications. To the best of our knowledge, no study has applied TRAM in the context of FDAs.
Concurrently, active customer participation is an essential attribute of service in an e-service context and a crucial element for open innovation [21]. Thus, the implementation of TAMs in service contexts cannot be dissociated from high customer involvement to explain consumer adoption of technology [22]. It is therefore important to identify and qualify the psychological processes of perceived value of a technology and structure a model that incorporates individual difference variables such as technological readiness, self-efficacy, and perceived threat.
The health belief model (HBM) is used to directly explain perceived usefulness and indirectly the continued use of apps [23] from the individual perspective. HBM is used to predict health behavior more generally [24]. The basic assumption of HBM is that individuals will have a preventive attitude towards their health if they feel vulnerable to illness [25]. Wahyuni and Nurbojatmiko [26] in their study show that individuals’ concerns about their own health also influence their intentions to use e-services. Thus, it is appropriate to study the impact of individuals’ concerns about COVID-19 on their intention to continue using food delivery apps. Therefore, the present study aims to combine the TRAM with the HBM [27]. In other words, this study combines a technological perspective with the individual perspective [25]. The main objective of this study is to explain the intention to continue using food delivery apps.
The proposed conceptual model also analyzes the effect of the HBM on the perceived usefulness of these applications and the effect of technological readiness on the perceived usefulness, perceived ease of use, and continuity intention. Finally, it also examines user satisfaction. This study contributes to the literature as it examines the factors affecting users’ intention to continue using food delivery applications in the context of the COVID-19 pandemic. Furthermore, the study combines the TRAM model with the HBM model to explain continuance intent. To the best of our knowledge, this is the first study to combine these models to explain the intention to continue using food delivery apps.

2. Literature Review

2.1. Food Delivery Apps (FDAs)

Among the most popular mobile applications that have been recently developed by service organizations/companies are mobile food ordering applications [10]. These can be defined as mobile applications that smartphone users download and use as an innovative and convenient channel to access restaurants, view food menus, place orders, and make payments without any physical interaction with restaurant staff [5,28]. Technology has helped and driven food service businesses to keep up with the changes in the industry [6]. Smartphones allow for real-time connection/connectivity with mobile applications, and have greatly increased the popularity of food delivery applications, which has also led to much greater competition in these markets [29]. Mobile applications are seen as an additional means by companies to attract new customers and to influence the existing ones to continue and increase their loyalty [28]. The increasing use of smartphones has also led to many changes in people’s dining cultures and food delivery apps are among the most innovative changes in the contemporary restaurant market [30]. During the pandemic, many traditional food delivery services switched platforms and new companies entered the business and began using FDAs to maintain themselves or utilize the opportunity to transition to the digital platform [31].

2.2. Health Belief Model (HBM)

The HBM was initially developed by Hochbaum [32] to help predict individuals’ behavioral reactions to disease. This model is one of the most notable public health frameworks for understanding why individuals may or may not act upon a threat to either their personal or community health [33]. Like many public health behavior models, this model conceptualizes the determinants of behavior [34]. According to the HBM, the dimensions of perceived susceptibility, perceived severity, perceived benefits, perceived barriers, action cues, and self-efficacy can be used to explain whether a person takes action to prevent, track, or improve their health behaviors [35,36]. Beliefs are influenced by each person’s background and comprise their impression of perceived threat, perceived benefits and barriers to taking action, and their perceived ability to take action (i.e., perceived self-efficacy) [37]. Additionally, according to the HBM, the perception of the threat of disease is measured by the perception of susceptibility and severity; the perception of benefits and the perception of barriers, together with the perception of self-efficacy, promote the development of health behaviors among the population affected by a given disease [38]. The perception of susceptibility refers to the beliefs of being vulnerable to the disease, while the perception of severity refers to beliefs concerning the negative effects of disease contraction, i.e., the severity of the risk [39]. The perception of benefits refers to the existence of a way to reduce the incidence or severity of the disease, while the perception of barriers refers to the higher costs versus the benefits of the action [40].
The two dimensions of perceived threat, perceived susceptibility and perceived severity [41], have been widely adopted to explain different behaviors such as technology adoption (e.g., [27,42,43]), fear of travel (e.g., [44]), organic food choices [45], among others. Recent studies also adopted these dimensions to explain customer intention to use online food delivery services during COVID-19 [46,47].

2.2.1. Perceived Threat

Perceived threat has been recognized as a core component to understand a variety of preventive health behaviors, such as those related to COVID-19 [47]. The two dimensions of perceived threat (perceived severity and perceived susceptibility) are also among the various measurements that have been widely used to determine people’s perceptions of a disease [46]. The perception of susceptibility refers to the belief of being vulnerable to the disease, while the perception of severity refers to belief concerning the negative effects of disease contraction, i.e., the severity of the risk [39]. According to the HBM, an individual is considered more likely to take appropriate action if the perceived threat of disease is high. In turn, the perceived threat will be higher if the perceived severity is higher—that is, the disease is considered to be a serious problem.

2.2.2. Perceived Self-Efficacy

Perceived self-efficacy can be defined as the belief that one has the ability to overcome a given challenge [34].
In the health management literature, self-efficacy can be seen as a significant determinant of preventive health behaviors [48]. Venkatesh et al. [11] explain self-efficacy as the ability of individuals to perform a given task. In the context of technology adoption, self-efficacy thus refers to users’ confidence in their ability to use a technology and serves as a determinant of perceived ease of use [11]. Perceived self-efficacy is considered to be an important precursor to the adoption of new technologies [49], being especially relevant in the use of mobile devices and, although they offer advantages, they also increase challenges, compared to computers. Contemporary studies have shown that self-efficacy affects behavioral intention to adopt apps, e-government system, and e-portfolios, among other things, both directly and indirectly ([15,50]). In the present study self-efficacy was analyzed in relation to technology adoption, and not integrated into the HBM.

2.3. Models Related to Technology Acceptance

2.3.1. TAM

The literature has used several theoretical frameworks to explain the adoption and use of technologies. The technology acceptance model (TAM), developed by Davis [12], is now one of the most widely used models to explain the acceptance of new technologies [51], and is recognized as a valid and robust model [52]. TAM suggests that when a user encounters a new technology, there are several factors that affect how they accept and use it, and it has been used in both consumer and organizational contexts to explain the factors that affect the acceptance of a particular technology [53]. TAM has also been widely applied to examine individual technology adoption behaviors across different populations and types of innovative technologies [54], such as e-portfolios [10], and m-commerce [55], among others. This is also useful in explaining what influences an individual’s intention to use mobile technologies [56] and smartphones [22]. Fishbein and Ajzen [57] suggest that behavior can be predicted based on the intention to perform it and that this intention is driven, in part, by attitudes toward it. Some studies applied TAM to examine individuals’ usage and behavior in the context of applications (e.g., [58]). These studies demonstrated that TAM was an appropriate theoretical framework to explain individuals’ intentions to use apps.
Among the wide adoption in all fields of technology acceptance studies, TAM [12] has also been used to predict consumers’ acceptance of technology in relation to health ([59]). According to TAM, perceived usefulness and perceived ease of use are the two main determinants of technology use [60]. While TAM has proven useful [61], additional constructs believed to have enhanced TAM have resulted in a variety of extended models, such as TAM2 and TAM3 [11,62]. It is also important to note that while TAM is instrumental in the initial acceptance of the new technology, more and more researchers have emphasized that the success of the new technology should not be limited to that same initial acceptance, but supported by continued use [63]. For example, Bhattacherjee [64] suggests continuance intention as a variable of technology acceptance, and thus, in order to include continuance intention, research on technology acceptance has been expanded.

2.3.2. TRAM

Several studies have applied the technology acceptance model (TAM) as a theoretical basis to analyze individuals’ intentions to use applications (e.g., [30,58]). However, some have argued that this model may not be sufficient to explain individuals’ technology adoption behavior, as the main variables of TAM measure utilitarian aspects of technology use, i.e., ease of use and usefulness (e.g., [17]). Thus, several authors suggest an integration of additional factors in order to extend TAM to better explain individuals’ psychological processes in their behavior regarding technology adoption (e.g., [17,19]).
TRAM combines the general personality constructs of TR with the specific model of TAM, thus determining how individuals’ technology-related beliefs may affect their perceptions of interacting with, experiencing, and using new technologies [16]. The integration of TR and TAM can provide a deeper understanding of the psychological process involved in application adoption behavior [20]. Since Lin et al. [17] introduced TRAM, several researchers have conducted studies to examine users’ technology adoption behavior in a wide range of settings, such as m-services [65] and mobile self-scanning applications [19].

2.3.3. Technology Readiness (TR)

Technology readiness (TR) was defined by Parasuraman ([13], p. 308) as being “the propensity of people to embrace and use new technologies to achieve goals in home life and work”. The same author argues that technology readiness is divided into four components. The first two are related to positive feelings, i.e., optimism (belief that technology will bring efficiency, control, benefits, and flexibility) and innovation (being a pioneer in testing innovative technology-based services or products). The other two are related to negative feelings, i.e., discomfort (reflects the individual’s perception of lack of control and confidence in using the technology) and insecurity (fear that the technology-based service, product or process may not work in an accurate and reliable way).
The four dimensions of TR are independent of each other and are associated with an individual’s behavioral disposition and general thoughts and feelings toward technology [66]. TR can be considered as an overall state of mind arising from mental and inhibiting factors that jointly determine a person’s tendency to use new technologies [67]. If an individual has a higher level of TR then their rate of adoption of new technologies is higher. In addition, the individual exhibits more intensive use of technology and greater ease in using it [68].

2.3.4. Continuance Intention

The number of studies on the intention to continue using information systems (IS) has grown rapidly in recent years and now covers several contexts such as the intention to continue in m-services, in applications, and in m-commerce, among others [69]. Although most of the previous research on these systems is strongly focused on the initial acceptance, it is now sought to investigate the direct effects on the continuity intention of mobile applications, since it is considered essential for the long-term viability of an IS [64].
Kim and Kang [70] argue that ongoing IS usage may specifically reflect users’ behavioral patterns toward a target IS/m-service. Bhattacherjee et al. [64] also indicate that while the initial adoption of an IS/IT is an important advance for IS/IT success, users’ continued use, rather than initial acceptance, is the determining factor of the long-term sustainability and ultimate success of IS/IT. It becomes evident that the intention of continued use is strongly associated with user behaviors (i.e., a behavior that an individual can decide whether to perform or not) [71]. Bhattacherjee [72] was one of the first researchers to distinguish between technology acceptance and continuance of use behavior. Bhattacherjee [72] further defines continuance intention to use as an individual’s intention to continue to use an information system. In their literature review, Nabavi et al. [73] also described it as a user’s decision to continue using a specific IT that an individual has already used.
Designing strategies to continuously attract the user is one of the most critical phenomena in the IT world [74]. Similarly, other authors have postulated that continuous usage is more important than initial usage, as it is argued that the cost to develop a new customer can be up to five times more than the cost to maintain an existing customer (e.g., [72]).

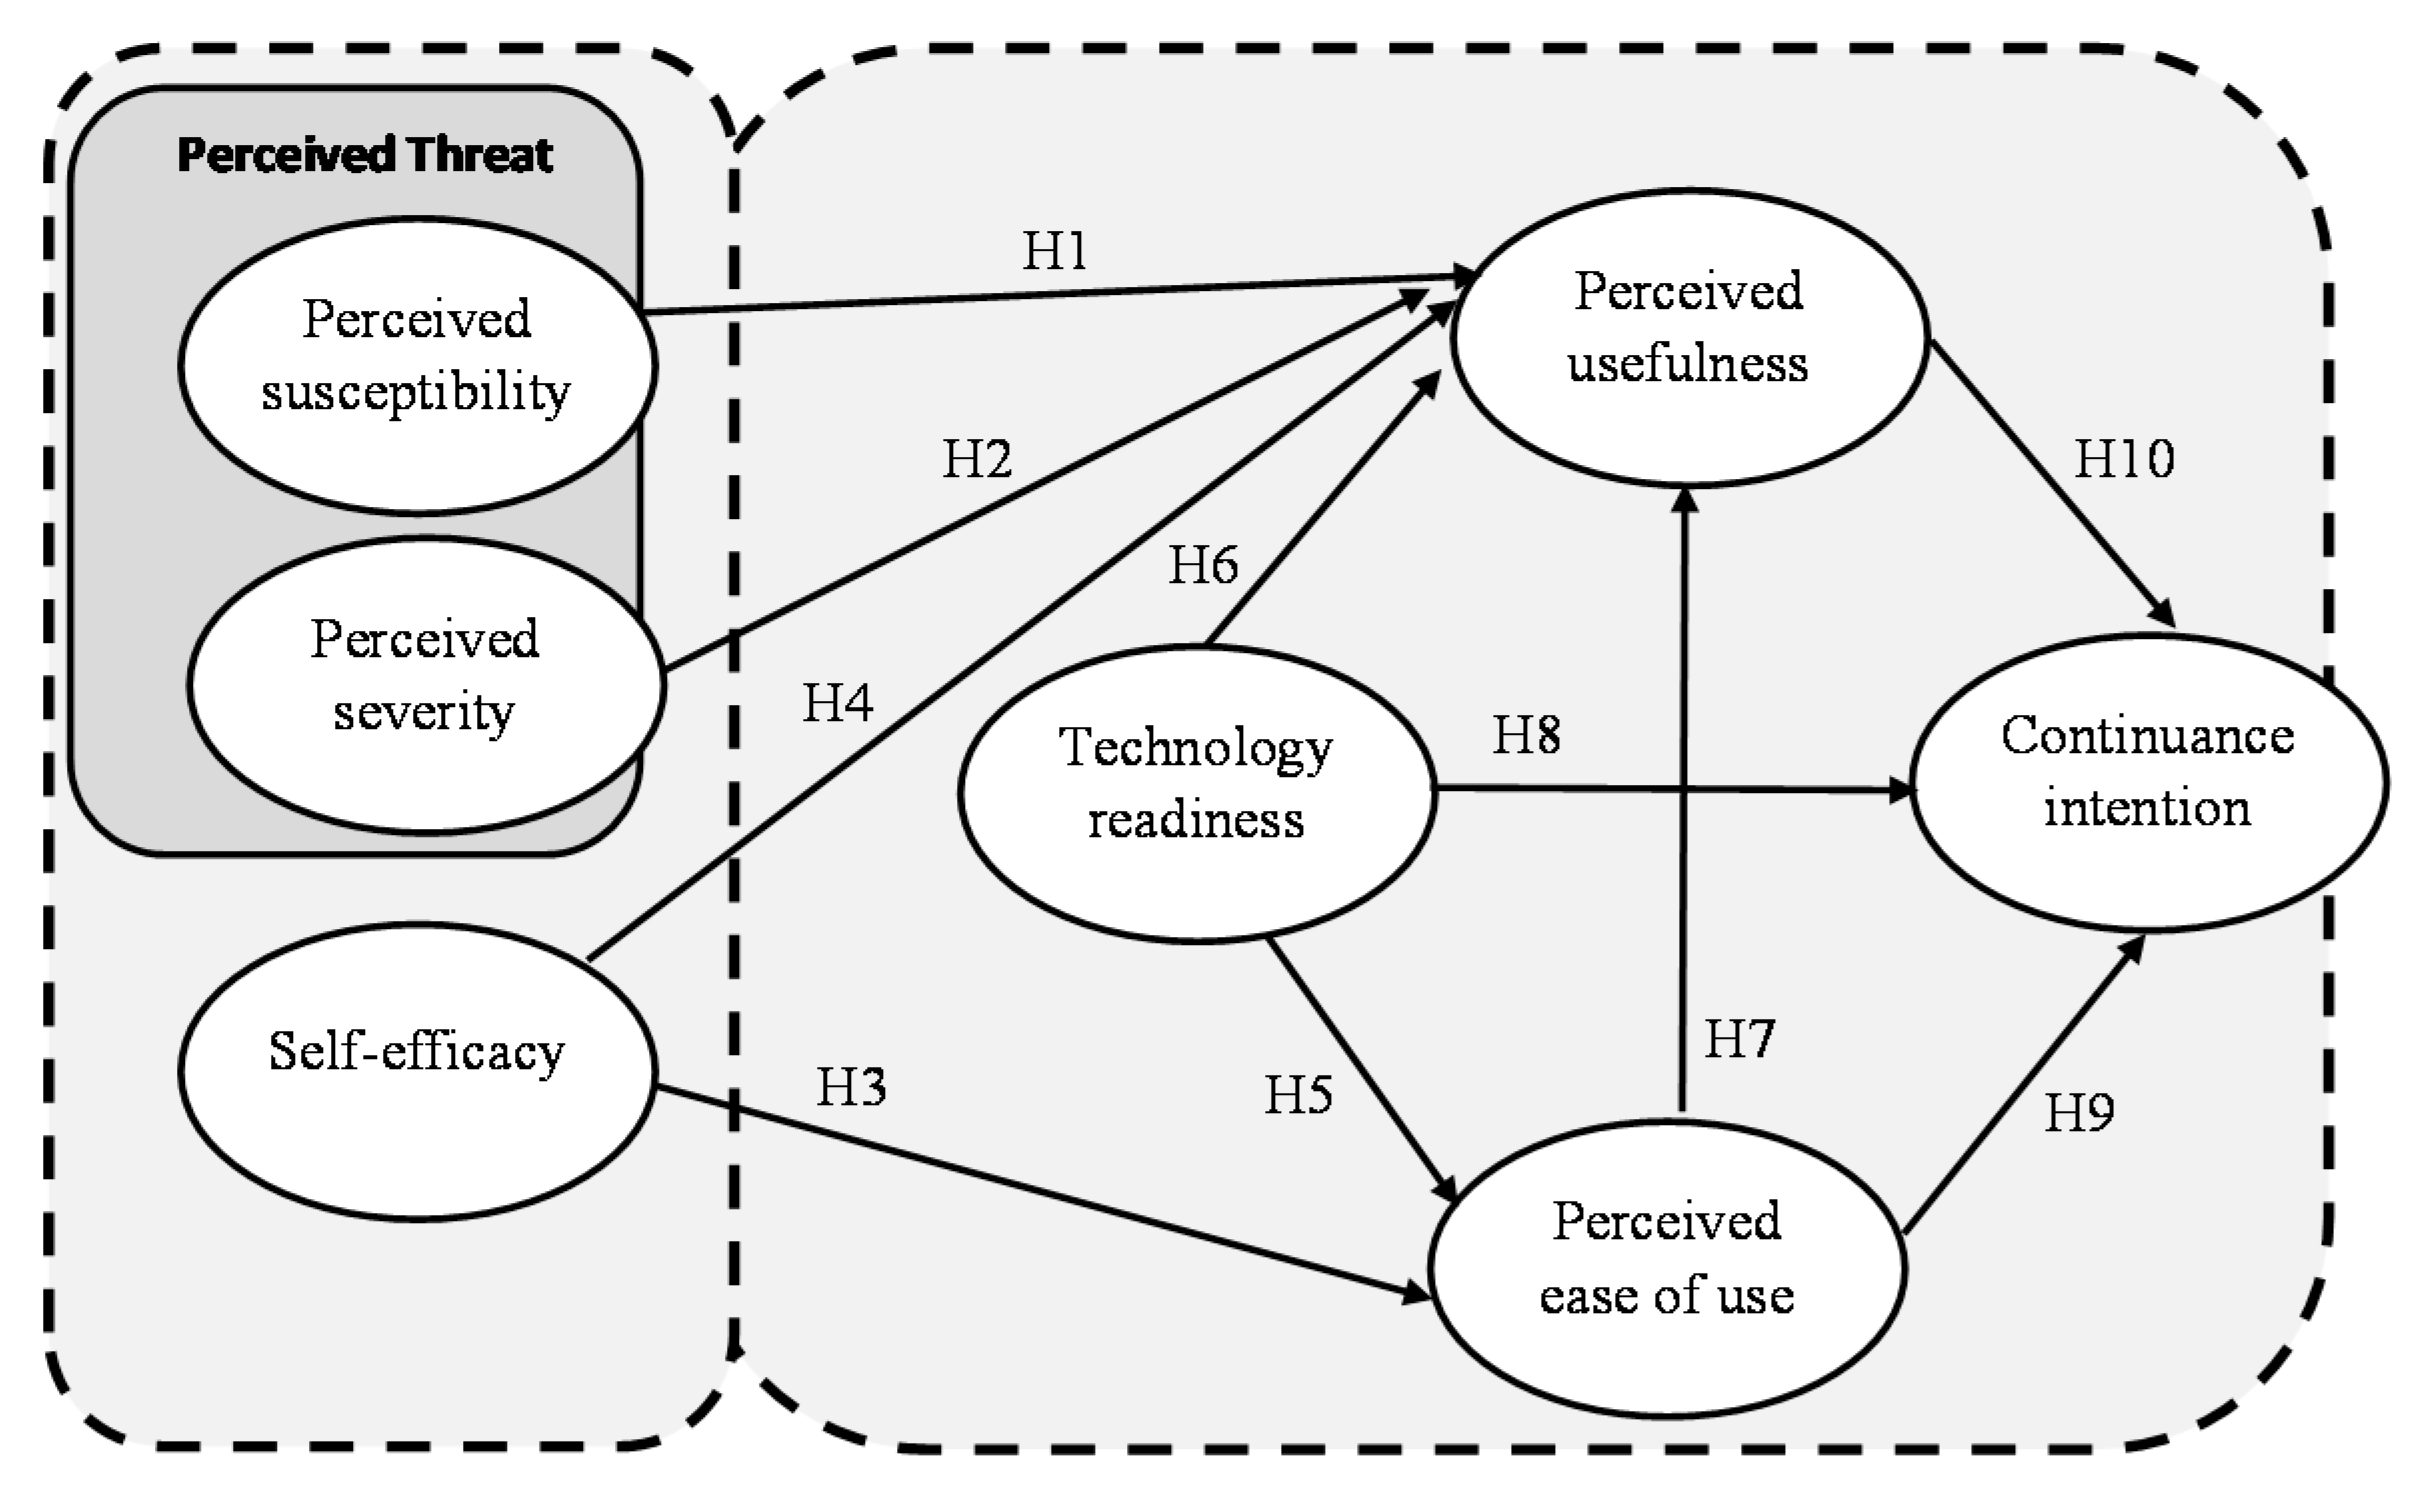
2.4. Proposed Model and Development of Hypotheses

Due to COVID-19, people believe that their health is at risk and thus may formulate a higher perception of usefulness regarding applications, to prevent and thus reduce the likelihood of COVID-19 infection [27]. The adoption of technology was considered as a behavior to promote, protect, or maintain one’s own health [75]. Therefore, this technology adoption can be explained by the HBM, since it suggests that people’s beliefs about health problems, perceived benefits, and perceived barriers to action, as well as self-efficacy, explain the involvement or lack thereof in health promotion behavior by individuals [35]. The perception of health threat refers to people’s awareness and care, as well as the potential consequences. Previous studies developed in the health care context found contradictory results regarding the influence of perceived threat, which involves perceived susceptibility and severity, on perceived usefulness. For example, Dou et al. [76] found a strong relationship between perceived threat and perceived usefulness while Kim and Park [60] found lack of a significant relationship. However, more recent studies developed in the context of COVID-19 found a positive significant effect of perceived susceptibility and severity on perceived usefulness of mobile-based payments [27] and e-wallet systems [42]. Thus, the following hypotheses are proposed:
Hypothesis 1 (H1).
The susceptibility to COVID-19 positively affects perceived usefulness of the FDA.
Hypothesis 2 (H2).
The severity of COVID-19 positively affects perceived usefulness of the FDA.
Technological self-efficacy is the personal belief that a person has the adequate and accurate skills and abilities to succeed when dealing with a technology-related task [77]. Based on Luarn and Lin’s [78] study on mobile services, the current research focuses on whether individuals believe that they have the necessary knowledge, skills or ability to use food delivery applications (FDAs). Thus, perceived self-efficacy is defined as the judgment of one’s ability to use food delivery applications. Self-efficacy has been adapted for the purpose of being incorporated into technology adoption models (e.g., [15,49]). This implies that consumers of mobile services are more likely to pursue activities within their perceived areas of competence, self-efficacy being an important factor in understanding individual responses to new technologies [79]. This variable has figured in studies developed in different contexts such as e-shopping [80], mobile banking [10], use of e-portfolios [15], food delivery services [46], use of electronic wallets [42], and mHealth services [44], among others.
Self-efficacy plays an important role in the context of technology and IS use (Ahmed et al. 2010) and internet self-efficacy (ISE) in the context of internet technology [4]. Self-efficacy affects user behavior towards using a technology, as individuals with high levels of self-efficacy will be confident in their capability to overcome any difficulties when using the technology [15]. Regarding computer usage, “the higher the individual’s computer self-efficacy, the higher his/her use of computers” ([49], p. 196). A sense of self-efficacy may increase the likelihood that users will evaluate the technology as easy to use [76]. Previous studies developed in different contexts such as mobile commerce, mobile banking, e-portfolios, smartphone health apps, among others, associate higher levels of self-efficacy and perceived ease of use (e.g., [42,71,78]).
Regarding the relationship between self-efficacy and perceived usefulness, the literature presents more contradictory results. Although some studies have found a non-significant effect between these two variables (e.g., [60]) or a negative significant effect (e.g., [15]), several studies in fact found a positive significant effect (e.g., [42,60,71,80]). A recent study developed in the context of mobile technologies’ usage, more specifically, the usage of mobile wallets while dining out in a restaurant, also found a strong association between mobile self-efficacy and mobile usefulness and ease of use [81].
Therefore, the following hypotheses are proposed:
Hypothesis 3 (H3).
Self-efficacy positively affects perceived ease of use of the FDA.
Hypothesis 4 (H4).
Self-efficacy positively effects perceived usefulness of the FDA.
There are few studies assessing the link between TR and TAM, compared to the number of studies applying the TAM model. A high TR may result from previous experience with the same technology which, in turn, may increase ease of use and perceived usefulness [82]. It is expected that technology readiness has a direct positive effect on perceived usefulness, since individuals with higher innovativeness and higher optimism towards technological innovations should be more able to see the utility related to their adoption [17]. Previous studies that linked technology readiness to TAM constructs in various technology adoption contexts, for example self-service technologies [83], online stock trading systems [17], mobile self-scanning applications [19], and m-commerce [84], among others, found a positive and significant relationship between it and perceived usefulness and perceived ease of use. Moreover, Jin [85] also confirmed a positive and a negative effect of positive technology readiness and negative technology readiness, respectively, on perceived usefulness and perceived ease of use.
Previous studies have also linked technology readiness to users’ behavioral intentions in various technology adoption contexts such as self-service technologies [86], online stock trading systems [17], and self-checkout services using smartphones [87], among others. Regarding the relationship between these two variables, the literature reports several results. Some studies found a positive direct effect (e.g., [86]), others support indirect effects through other variables such as perceived usefulness and ease of use [17], and others indicated lack of significant relationship (e.g., [87]). Blut and Wang [16] in their meta-analysis about TR constructs and its impact on technology usage found an indirect effect of technology readiness on usage intention via TAM mediators (ease of use and usefulness).
In view of the above, the following set of hypotheses are presented:
Hypothesis 5 (H5).
Technological readiness positively affects perceived ease of use of the FDA.
Hypothesis 6 (H6).
Technological readiness positively affects perceived usefulness of the FDA.
Hypothesis 7 (H7).
Technological readiness positively affects continuance intention to use the FDA.
TAM is a representative model used to explain and predict individuals’ adoption of information technology. Several studies have used this model as well its extensions to explain the process of information technology acceptance, such as studies of e-service, service mobile apps, information technology systems, and internet-based services, among others (e.g., [11,15,19]), further indicating that behavioral intentions to use a given technology are determined, in part, by users’ perceived ease of use (PEOU) and perceived usefulness (PU). According to TAM, PEOU is a determinant of PU [11,12]. When individuals have perceived ease of use of technology, they are more likely to believe that the technology is useful and helpful for a specific purpose. Venkatesh ([11], p. 343) stated that “the easier a technology is to use, the more useful it may be”. Once individuals perceive ease in using a technology and it has perceived usefulness, individuals will adopt and accept it for a specific purpose [20].
The literature further indicates that PEOU and PU appear to be particularly vital measures of users’ intention to use a particular system [12]. A great deal of research on TAM demonstrates that these two factors have a joint impact on the use and acceptance of a wide variety of technologies (e.g., [65,86]). Users will always want to continue using a particular application that can help them improve their productivity [64,72].
Users need to feel that a particular application (e.g., FDAs) is easy enough to use to motivate them to use it [39]. The theory of reasoned action (TRA) [57], a theory that gave rise to the development of TAM by [12], states that perceived usefulness and perceived ease of use can influence user’s attitudes and intention to use. Thus, PEOU and PU are expected to be positively related to the intention to continue using applications. Moreover, a recent study developed in the context of online food delivery services confirms a strong positive effect of both perceived ease of use and usefulness on continuance intention [46].
According to TAM, perceived ease of use is hypothesized to be a determinant of perceived usefulness. Several empirical studies have also supported this relationship for a wide variety of technologies (e.g., [15,39]). A recent study developed by Roh and Park [88] in the context of O2O food delivery services also found a strong effect of perceived ease of use on usefulness. When an individual realizes that few resources are needed to learn a new mobile technology, he/she may perceive the technology as being useful, which leads to its continued use. In view of the above, the following set of hypotheses is presented:
Hypothesis 8 (H8).
Perceived ease of use positively affects perceived usefulness of the FDA.
Hypothesis 9 (H9).
Perceived ease of use affects continuance intention to use the FDA.
Hypothesis 10 (H10).
Perceived usefulness affects continuance intention to use the FDA.
Figure 1 presents the conceptual and hypotheses.

3. Methodology

3.1. Data Collection and Demographics

The target population of this study consisted of Portuguese smartphone users who have used food delivery apps (FDAs), at least once, during the ongoing COVID-19 virus period. Due to confidentiality issues it was not possible to obtain a sampling frame for the target population. Thus, this study used a non-probability convenience sampling (cf. [5,19]). We adopted a web-based survey questionnaire approach to collect the data. The link of the web-based survey, which included a brief explanation of the study purpose, was available on online channels such as social networks (e.g., Facebook, Instagram, WhatsApp) and online groups since offline data collection was not possible during the pandemic. Data collection occurred over a period of two months during the pandemic, from March to April of 2021. A total of 618 responses was obtained, of which 288 were usable.
As suggested by Churchill [89], a literature review was initially conducted to understand how the variables present in the model have been measured in the literature. Then, the first version of the survey questionnaire was revised by three academic experts in information systems to access content validity of the scales. After that, the survey was pre-tested with users of FDAs. Based on the feedback and comments from both users and academic experts, the final survey was developed.
The details of demographic characteristics are presented in Table 1. A total of 64.2% respondents were female, 53.8% were graduates or post-graduates and 38.5% had master degrees or above as educational background. Regarding the respondents’ ages, it was found that almost half were aged between 18 and 24 years (47.2%) and that 34.7% of respondents were aged between 25 and 34 years. In relation to household monthly income, 62% of respondents had a monthly income of less than EUR 2000.
Most of the respondents reported Uber Eats as the FDA that they used more often (71.2%), followed by Glovo (17.4%), and Bolt Food (6.9%). Respondents were asked when they started using FDAs. It was found that 67% of respondents started using these types of apps in 2019 or before. We further observed that approximately 29% of the respondents started using these apps in the year 2020 and 3.8% of the respondents started using these types of apps in 2021. Out of the 95 respondents that start using FDAs in 2020 or 2021, 59 respondents stated that they started using these apps as a consequence of the COVID-19 pandemic.

3.2. Measures

In the present study, the scales used to measure each of the variables of the proposed conceptual model were adapted from the literature.
Perceived usefulness was measured with four items adapted from Thong et al. [90] and Hsiao et al. [91]. The four items used to measure perceived ease of use were adapted from Thong et al. [90]. Continuance intention was measured with four items adapted from Wang et al. [28] and Hsiao et al. [91]. Self-efficacy was measured using four items adapted from Luarn and Lin [78] and Abdullah et al. [15]. Perceived susceptibility and perceived severity were measured with three items each adapted from Walrave et al. [43]
A sixteen-item scale was used to measure optimism (4 items), innovativeness (4 items), discomfort (4 items), and insecurity (4 items). All items were adopted from Parasuraman and Colby [67] after obtaining permission from Professor Parasuraman and Rockbridge Associates. Following the suggestions of Parasuraman and Colby [67], technology readiness was computed as the average of the four dimensions. Before computing the average, the discomfort and insecurity dimensions were re-coded by subtracting the value indicated in each item by the respondent from 6. All variables were assessed using Likert scales anchored by one (strongly disagree) and five (strongly agree). Items are shown in Appendix A.
Two control variables were also included in our model to ensure the robustness of findings. Following recent studies developed in the context of mobile applications, we used demographic variables as control variables (e.g., [5,19]). More specifically, the variables gender and age were used.

4. Results

The proposed model was tested using used partial least squares structural equations modeling (PLS-SEM), a variance-based structural equation modeling (SEM) technique [92]. The analysis was conducted using Smart PLS 3.0 software (cf. [93]).

4.1. Measurement Model

Before testing the hypotheses, we analyzed the measurement model to check the reliability and validity of the constructs. The standardized indicator loadings and their t statistic for all constructs are presented in Table 2. The values show that all loadings are higher than or equal to the threshold of 0.70 and p < 0.001 (Hair et al. [92]), which supports individual indicator reliability. Internal reliability and convergent validity were examined by means of composite reliabilities (CRs) and average variance extracted (AVE). The values of CR and AVE for all constructs (see also Table 2) are greater than the acceptable cutoff of 0.7 and 0.5, respectively [92,94,95]. Likewise, we confirm that our constructs exhibited adequate construct reliability and convergent validity.
To establish discriminant validity, we apply the Fornell−Larcker and heterotrait-monotrait ratio (HTMT) criteria [92,95]. The Fornell−Larcker criterion compares the square root of the AVE of each construct (shown on the diagonal with bold values in Table 3) with the paired inter-correlation between the construct and any other construct (shown on the left of the diagonal). The results presented in Table 3 confirm that this criterion was meet for all constructs. According to the heterotrait−monotrait ratio (HTMT) criterion, discriminant validity is confirmed when the HTMT ratios are below 0.9 [92,96]. As can be seen in Table 3, this criterion was fulfilled since all HTMT ratios are below 0.9. Taken together, these results provide evidence of the discriminant validity of all constructs.

4.2. Structural Model

The structural model was evaluated using the sign, magnitude, and significance of the structural path coefficients, the variance explained (R2), and the predictive relevance (Q2). To assess the statistical significance of the loadings and path coefficients, a boostrapping procedure using 5000 subsamples was employed as suggested by Hair et al. [97]. Prior to assessing the structural model, the model collinearity was assessed. The VIF values ranged from 1.016 to 1.489, which was below the indicative critical value of 5 [92], showing multicollinearity is not an issue in the model.
To evaluate the predictive relevance of the model, a blindfolding procedure with an omission distance of 7 was applied. The Stone–Geisser’s Q2 obtained for all endogenous constructs (continuance intention: 0.157; perceived usefulness: 0.100; perceived ease of use: 0.112) was well above zero. Thus, the model’s predictive relevance was confirmed. The coefficient of determination (R2) measures the variance of the endogenous constructs explained by the exogenous constructs. According to Falk and Miller [98], the R2 of each endogenous construct in the model should be equal to or greater than 10%. This criterion was accomplished for all endogenous variables in the model (continuance intention: R2 = 30%; perceived usefulness: R2 = 13%; perceived ease of use: R2 = 17%).

5. Discussion: Open Innovation in Food Industry after Using of FDA

Most of the hypothesis were supported by the results. A summary of the hypotheses and their results is presented in Table 4. The importance of these findings is an alert to the importance of developing specific organizational competences to innovate in FDA, a key element to enhance open innovation, as suggested by Rufat-Latre, et al. [99], and represents an important path to enhance competitive advantage [100]. Hypotheses H1 and H2 postulate that perceived usefulness positively relates to perceived susceptibility and perceived severity to COVID-19, respectively. Both hypotheses were supported with (β = 0.199; p < 0.001) and (β = 0.241; p < 0.01). These results are consistent with previous studies also developed during the COVID-19 pandemic in the context of mobile-based payments applications [27], and digital wallets [42]. In other contexts, Wei et al. [101] also concluded that perceived threat of weight loss induces a higher level of usefulness among users of fitness mobile apps. This finding reveals the importance of apps not only in an open innovation context but also for achieving competitive advantage, promoting a more engaged innovation with a wider variety of participants [102,103]. As Jain [104] posits, “mobile app usage will put considerable pressure on mobile access networks, requiring extensive R&D to improve spectral efficiency and expensive investments to increase network capacity” (p. 4).
The results also indicated a strong positive significant effect of self-efficacy on perceived ease of use (β = 0.368; p < 0.001). Thus, H3 was supported. This finding is consistent with previous studies addressing different technologies (e.g., [15,71,76,78]). This means users who are confident in using food delivery apps found their usage easy. Contradicting our expectations, the effect of self-efficacy on perceived usefulness was not significant (β = 0.123; ns). This finding is similar to those of previous studies [56] that also found lack of significant association between self-efficacy and perceived usefulness. However, it contradicts several studies that found a positive strong effect of self-efficacy on perceived usefulness (e.g., [10,42,81]. As such, further development of research in this field is required, especially in studying the predictors of self-efficacy and how they can relate direct and indirectly with perceived usefulness. In this field, cooperation among competing firms can lead to interesting results, because of the complementarity between platforms’ use and functionality, as suggested by Ghazawneh and Henfridsson [105]. For example, in the field of open innovation, the development of delivery apps can represent another form of open innovation for new product development through increased cooperation between competing firms by participating in the development and commercialization of complementary products [106,107].
Hypotheses H5 and H6 postulate that technology readiness positively relates to perceived ease of use and usefulness, respectively. Both hypotheses were supported (β = 0.129; p < 0.05) and (β = 0.310; p < 0.001), respectively. These results are consistent with many previous studies that also found support for these relationships (e.g., [17,19,84]). Hypothesis H7, which postulated a positive effect of TR on continuance intention, was not supported (β = 0.059; not significant). This result is in line with the meta-analysis developed by Blut and Wang [16] in which the authors found lack of significant direct effect of TR motivators (innovativeness, optimism) and inhibitors (insecurity and discomfort) on intention to use a technology.
The proposed link between perceived ease of use and perceived usefulness was not significant (β = −0.061; not significant). Thus, hypothesis H8 was not supported. This is contrary to many previous studies developed in the context of service mobile apps (e.g., [14,39]) as well as other technologies (e.g., [15,17]).
This study also found that perceived ease of use (β = 0.391; p < 0.001), and perceived usefulness (β = 0.382; p < 0.001) are strongly associated with continuance intention. Thus, H9 and H10 were supported. These results are in line with numerous previous studies that also found a strong positive effect of perceived ease of use and usefulness on customers’ usage intention or continuance intention toward a wide variety of technologies (e.g., [15,65,86]). The same effects have been reported in recent studies that analyze the continuance intention to use online food delivery services (e.g., [46,88]). A recent study developed in the context of FDAs also found a strong positive effect of perceived ease of use on intention to use [108]. In the context of a mobile taxi booking application, Weng et al. [109] found a strong relationship between usefulness and continuance intention. In the open innovation field, this is consistent with equity theory that posits that customer satisfaction is highly correlated with the perception of service quality [110]. In this vein, Alzoubi et al. [111] also found that the use of the technologies associated with delivery services increases customer satisfaction and leads to enhanced loyalty levels.
In addition to the hypothesized associations, we also tested indirect effects as these could provide further insights into understanding the continuance usage of FDAs. Although the direct effect of TR on continuance intention was not significant, we found that TR indirectly affects continuance intention through perceived usefulness (β = 0.105; p < 0.001). This result is in line with the conclusions of Blut and Wang [16] who found that TR motivators not directly affect usage behavior, but instead affect it indirectly through other variables such as TAM mediators (ease of use and usefulness). The results also show an indirect effect of HBM constructs, perceived susceptibility (β = 0.067; p < 0.01) and perceived severity (β = 0.081; p < 0.05), on continuance intention through perceived usefulness. A strong indirect effect of self-efficacy on continuance intention through perceived ease of use was also found (β = 0.144; p < 0.001).
Finally, the results showed that both control variables (age and gender) have no significant effect on the continuance intention related to age (β = 0.074; ns) and gender (β = −0.042; ns) (see Table 4). These findings are in line with the study of Kumar and Shah [5] developed in the context of FDAs during the COVID-19 pandemic, as well as other studies developed in the context of mobile applications (e.g., [19]). Although the strong growth of FDA usage was influenced by the pandemic lockdown, the rapid development of this technology and consequent user adoption points to a ‘technology scouting’ approach (instead of technology sourcing), which is more likely to be found in an incremental innovation situation, as found by Parida et al. [112].

6. Conclusions

This study developed a theoretical framework, augmenting the technology acceptance model (TAM) by integrating the health belief model (HBM), and technology readiness model (TRM), to enrich the current understanding of the continued use of FDAs within a broader context of open innovation. According to the study’ findings, seven out of the ten proposed hypotheses were supported.
The study findings show that perceived susceptibility and severity positively influence the perceived usefulness of FDAs. As for perceived self-efficacy, it positively influences perceived ease of use but does not influence perceived usefulness. The results also show that consumers’ technological readiness positively and directly affects both perceived usefulness and perceived ease of use. The direct effect of TR on continuance intention was not confirmed. However, a significant indirect effect through perceived usefulness was found. Both perceived ease of use and perceived usefulness have a strong direct effect on continuance intention. It should be noted that, contrary to previous studies, the effect of perceived ease of use on perceived usefulness was not significant. This fact may be related to the final sample obtained. In other words, most respondents were young people for whom ease of use issues were not so critical.

6.1. Theoretical Contributions

This study offers key contributions for IS continuance usage literature. First, by investigating the factors that contribute to the continuance usage of FDAs during the COVID-19 pandemic, this study contributes to the literature of technology use in emergency situations [5]. Perceived ease of use and usefulness are recognized as the most important constructs of TAM. However, in order to be able to explain users’ technology continuance intention behavior, it is important to understand how perceived usefulness and ease of use are affected by external variables [11,15]. Thus, our study also contributes to the literature by validating the integration of HBM and TAM in the context of FDAs. More specifically, our study highlights the importance of perceived susceptibility and severity as antecedents of perceived usefulness and self-efficacy as antecedent of perceived ease of use. This represents an important link to research in open innovation. For example, Barlatier and Josserand [113] found that social media can enhance these perceptions and create a better connection to key stakeholders for innovation. Finally, in line with previous studies that highlight the importance of the integration of TR with TAM to better understand technology usage [16], and continuance intention to use mobile applications [19], our study also validates this integration by demonstrating that TR is an important antecedent of both perceived usefulness and perceived ease of use.

6.2. Practical Implications

This study has short-term and long-term practical implications. First, the findings indicate that perceived severity and susceptibility to COVID-19 infection influences the perceived usefulness of FDAs and indirectly the continuance intention to use them. This suggest that in the short term, policymakers and marketers should promote the adoption of this type of application as a means of social distancing and consequently prevent the spread of COVID-19. These results also have long-term implications because of future threats of the same kind. Moreover, similarly to Uber Eats and Deliveroo, other FDAs should incentivize customers and drivers adhere to social distancing by launching a “leave at your door service” [46].
The long-term implications also include better understanding of how to ensure the continuance usage of FDAs since the digital transformation that has occurred needs to be sustained and FDAs are the interface between restaurants, suppliers, and consumers. Thus, it is relevant that companies ensure their continued use during and after the COVID-19 pandemic [5].
Based on the empirical results of the study, managers and FDAs designers should also focus on perceived usefulness and perceived ease of use since both are important in promoting users’ continuance intention to use FDAs. Thus, FDA designers should make things easier for users to ensure the continued usage of the apps. For instance, they may simplify registration and data recording procedures, and make use of the information from previous orders to make new orders easier, among other things. In addition, FDA marketers should develop campaigns highlighting the usefulness of FDA services.
The results of the study demonstrate that TR directly influences both perceived ease of use and usefulness, and indirectly affects continuance intention to use a FDA. Managers should take into consideration the fact that the usefulness and ease of use perceived by consumers with low TR when encountering a new FDA will be well below the ones by consumers with high TR. Thus, it would be more profitable for managers to concentrate marketing efforts on consumers with low TR since this kind of consumer is resistant to new technologies. In this way, if a firm can get these consumers to see its innovative FDAs as beneficial and to continue using them, it is expected that consumers with high TR who are more open to new technologies should take the same path [19].

6.3. Limitations

As with any research, this study presents some limitations. First, this study used data collected through a web-based convenience sampling procedure, which can lead to self-selection bias and is prone to obtain samples including users with lower levels of internet phobia. Second, the study focused on users of FDAs in Portugal, and the results cannot be generalized to other countries with different cultures. Therefore, the use of probabilistic sampling and comparations across countries are encouraged.
The variables in the model are all based on consumers’ perceptions. It would be interesting to use objective data. Thirdly, this study raises only a short-term reflection of the users’ perception of the intention to continue using food delivery apps, especially in a particular situation (pandemic context of COVID-19). Having said this, it would be interesting to conduct other studies exploring users’ perceptions in different situations and investigate causality over time, for example, in the case of the COVID-19 pandemic, exploring its effects after it was overcome.
According to Humbani and Wiese [114], the relationship between ease of use and continuance intention warrants further research to determine if indeed the importance of ease of use decreases with experience. Thus, this aspect should also be considered in future studies.

Author Contributions

Conceptualization, G.M.S. and M.S.R.; methodology, G.M.S. and M.S.R.; software, G.M.S.; validation, Á.D.; investigation, G.M.S. and M.S.R.; resources, Á.D. and G.M.S.; data curation, Á.D.; writing—original draft preparation, G.M.S. and M.S.R.; writing—review and editing, Á.D. and G.M.S.; funding acquisition, Á.D. and G.M.S. All authors have read and agreed to the published version of the manuscript.

Funding

This work was supported by the FCT—Fundação para a Ciência e a Tecnologia [grant number UIDB/04521/2020].

Institutional Review Board Statement

Ethical review and approval were waived for this study, since that the in-depth interviews written informed consent was obtained before each session. In the survey, a link to the online survey platform was sent by social media and partners social media, and at no times contact was established between researchers and participants. Moreover, the interview script and the questionnaire personal did not include any information and recording histories. As such, all data accessible to the researchers were stripped of respondents’ names, addresses, or birth dates and cannot be linked back.

Informed Consent Statement

Informed consent was obtained from all subjects involved in the study.

Data Availability Statement

Data available upon reasonable request to the corresponding author.

Conflicts of Interest

The authors declare no conflict of interest.

Appendix A

Table A1. Construct and items description.
Construct and Items Description
Perceived susceptibility (Adapted from Walrave et al., 2020)
PS1I am at risk of being infected by the COVID-19 virus.
PS2It is likely that I would suffer from the COVID-19 virus.
PS3It is possible that I could be infected by the COVID-19 virus.
Perceived severity (Adapted from Walrave et al., 2020)
PSEV1If I were infected by the COVID-19 virus, it would have important health consequences for me.
PSEV2If I were infected by the COVID-19 virus, my health would be severely affected.
PSEV3If I were infected by the COVID-19 virus, my health would be significantly reduced. *
Self-efficacy (Adapted from Luarn and Lin, 2005, and Abdullah et al., 2016)
SE1I could use this food delivery app by just following the instructions.
SE2I am confident of using this food delivery app even if I have never used such a system before.
SE3I am confident of using this food delivery app if someone showed me how to do it first.
SE4I could use this food delivery app if I had seen someone else using it before trying it myself.
Perceived usefulness (Adapted from Thong et al., 2006, and Hsiao et al., 2016)
PU1Using this food delivery app improves my performance in managing my personal life.
PU2Using this food delivery app increases my productivity in managing my personal life.
PU3Using this food delivery app enhances my effectiveness in managing my personal life.
PU4I find this food delivery app to be useful in managing my personal life.
Perceived ease of use (Adapted from Thong et al., 2006, and Leon, 2018).
PEOU1My interaction with this food delivery app is clear and understandable.
PEOU2Interacting with this food delivery app does not require a lot of mental work.
PEOU3I find this food delivery app to be easy to use.
PEOU4I find it easy to get the food delivery app do what I want it to do.
Continuance intention (Adapted from Bhattacherjee, 2001b, Hsiao et al., 2016, and Wang et al., 2019)
CI1I want to continue using this food delivery app rather than discontinue its use.
CI2My intentions are to continue using this food delivery app rather than any alternative.
CI3I will continue to use this food delivery app as regularly as I do now.
CI4I will always try to use this food delivery app in my daily life.
Optimism (Adapted from Parasuraman and Colby, 2015)
OPT1New technologies contribute to a better quality of life.
OPT2Technology gives me more freedom of mobility.
OPT3Technology gives people more control over their daily lives.
OPT4Technology makes me more productive in my personal life.
Innovativeness (Adapted from Parasuraman and Colby, 2015)
IN1Other people come to me for advice on new technologies.
IN2In general, I am among the first in my circle of friends to acquire new technology when it appears.
IN3I can usually figure out new high-tech products and services without help from others.
IN4I keep up with the latest technological developments in my areas of interest.
Discomfort (Adapted from Parasuraman and Colby, 2015)
DIS1When I get technical support from a provider of a high-tech product or service, I sometimes feel as if I am being taken advantage of by someone who knows more than I do.
DIS2Technical support lines are not helpful because they do not explain things in terms I understand.
DIS3Sometimes, I think that technology systems are not designed for use by ordinary people.
DIS4There is no such thing as a manual for a high-tech product or service that’s written in plain language.
Insecurity (Adapted from Parasuraman and Colby, 2015)
INS1People are too dependent on technology to do things for them.
INS2Too much technology distracts people to a point that is harmful.
INS3Technology lowers the quality of relationships by reducing personal interaction.
INS4I do not feel confident doing business with a place that can only be reached online.
Note: * Items dropped during purification phase.

References

  1. Tang, B.; Bragazzi, N.L.; Li, Q.; Tang, S.; Xiao, Y.; Wu, J. An updated estimation of the risk of transmission of the novel coronavirus (2019-nCov). Infect. Dis. Model. 2020, 5, 248–255. [Google Scholar] [CrossRef] [PubMed]
  2. WHO. Coronavirus Disease (COVID-19) Advice for the Public. Available online: https://www.who.int/emergencies/diseases/novel-coronavirus-2019/advice-for-public (accessed on 14 March 2021).
  3. Wilder-Smith, A.; Freedman, D.O. Isolation, quarantine, social distancing and community containment: Pivotal role for old-style public health measures in the novel coronavirus (2019-nCoV) outbreak. J. Travel Med. 2020, 1–4. [Google Scholar] [CrossRef] [PubMed]
  4. Zhao, Y.; Bacao, F. What factors determining customer continuingly using food delivery apps during 2019 novel coronavirus pandemic period? Int. J. Hosp. Manag. 2020, 91, 102683. [Google Scholar] [CrossRef] [PubMed]
  5. Kumar, S.; Shah, A. Revisiting food delivery apps during COVID-19 pandemic? Investigating the role of emotions. J. Retail. Consum. Serv. 2021, 62, 102595. [Google Scholar] [CrossRef]
  6. Bickerton, P.; 7 Technologies That Are Transforming the Hospitality Industry. Hospitality Magazine. 2015. Available online: https://bit.ly/1CPQsc6 (accessed on 8 September 2019).
  7. Hirschberg, C.; Rajko, A.; Schumacher, T.; Wrulich, M. The Changing Market for Food Delivery|McKinsey. 2016. Available online: https://www.mckinsey.com/industries/high-tech/our-insights/the-changing-market-for-food-deliver (accessed on 5 April 2022).
  8. Statistia. eServices Report 2019—Online Food Delivery. 2020a. Available online: https://www.statista.com/study/40457/food-delivery/ (accessed on 5 April 2022).
  9. Muangmee, C.; Kot, S.; Meekaewkunchorn, N.; Kassakorn, N.; Khalid, B. Factors determining the behavioral intention of using food delivery apps during covid-19 pandemics. J. Theor. Appl. Electron. Commer. Res. 2021, 16, 1297–1310. [Google Scholar] [CrossRef]
  10. Alalwan, A.A. Mobile food ordering apps: An empirical study of the factors affecting customer e-satisfaction and continued intention to reuse. Int. J. Inf. Manag. 2020, 50, 28–44. [Google Scholar] [CrossRef]
  11. Venkatesh, V.; Davis, F.D. A Theoretical Extension of the Technology Acceptance Model: Four Longitudinal Field Studies. Manag. Sci. 2000, 46, 186–204. [Google Scholar] [CrossRef] [Green Version]
  12. Davis, F.D. Perceived Usefulness, Perceived Ease of Use, and User Acceptance of Information Technology. MIS Q. 1989, 13, 319–340. [Google Scholar] [CrossRef] [Green Version]
  13. Parasuraman, A. Technology Readiness Index (TRI) a multiple-item scale to measure readiness to embrace new technologies. J. Serv. Res. 2000, 2, 307–320. [Google Scholar] [CrossRef]
  14. Chen, M.-F.; Lin, N.-P. Incorporation of health consciousness into the technology readiness and acceptance model to predict app download and usage intentions. Internet Res. 2018, 28, 351–373. [Google Scholar] [CrossRef]
  15. Abdullah, F.; Ward, R.; Ahmed, E. Investigating the influence of the most commonly used external variables of TAM on students’ Perceived Ease of Use (PEOU) and Perceived Usefulness (PU) of e-portfolios. Comput. Hum. Behav. 2016, 63, 75–90. [Google Scholar] [CrossRef]
  16. Blut, M.; Wang, C. Technology readiness: A meta-analysis of conceptualizations of the construct and its impact on technology usage. J. Acad. Mark. Sci. 2019, 48, 649–669. [Google Scholar] [CrossRef] [Green Version]
  17. Lin, C.H.; Shih, H.Y.; Sher, P.J. Integrating technology readiness into technology acceptance: The TRAM model. Psychol. Mark. 2007, 24, 641–657. [Google Scholar] [CrossRef]
  18. Aboelmaged, M.; Ali, I.; Hashem, G. Mobile apps use for wellness and fitness and university students’ subjective wellbeing. Inf. Dev. 2021, 1–16. [Google Scholar] [CrossRef]
  19. Ferreira, A.; Silva, G.M.; Dias, Á.L. Determinants of continuance intention to use mobile self-scanning applications in retail. Int. J. Qual. Reliab. Manag. 2021; ahead-of-print. [Google Scholar] [CrossRef]
  20. Chiu, W.; Cho, H. The role of technology readiness in individuals’ intention to use health and fitness applications: A comparison between users and non-users. Asia Pac. J. Mark. Logist. 2021, 33, 807–825. [Google Scholar] [CrossRef]
  21. Pinheiro, J.; Lages, L.F.; Silva, G.M.; Dias, A.; Preto, M.T. Effects of Absorptive Capacity and Innovation Spillover on Manufacturing Flexibility. Int. J. Prod. Perf. Mngt. 2022, 71, 1786–1809. [Google Scholar] [CrossRef]
  22. Park, Y.; Chen, J.V. Acceptance and adoption of the innovative use of smartphone. Ind. Manag. Data Syst. 2007, 107, 1349–1365. [Google Scholar] [CrossRef] [Green Version]
  23. Liu, C.F.; Tsai, Y.C.; Jang, F.L. Patients’ acceptance towards a web-based personal health record system: An empirical study in Taiwan. Int. J. Environ. Res. Public Health 2013, 10, 5191–5208. [Google Scholar] [CrossRef] [Green Version]
  24. Mead, N.; Varnam, R.; Rogers, A.; Roland, M. What predicts patients’ interest in the internet as a health resource in primary care in England? J. Health Serv. Res. Policy 2003, 8, 33–39. [Google Scholar] [CrossRef]
  25. Lemire, M.; Paré, G.; Sicotte, C.; Harvey, C. Determinants of Internet use as a preferred source of information on personal health. Int. J. Med. Inform. 2008, 77, 723–734. [Google Scholar] [CrossRef]
  26. Wahyuni, R. Nurbojatmik. Explaining acceptance of e-health services: An extension of TAM and health belief model approach. In Proceedings of the 2017 5th International Conference on Cyber and IT Service Management, CITSM, Denpasar, Bali, Indonesia, 8–10 August 2017. [Google Scholar]
  27. Sreelakshmi, C.C.; Prathap, S.K. Continuance adoption of mobile-based payments in Covid-19 context: An integrated framework of health belief model and expectation confirmation model. Int. J. Pervasive Comput. Commun. 2020, 16, 1742–7371. [Google Scholar] [CrossRef]
  28. Wang, Y.S.; Tseng, T.H.; Wang, W.T.; Shih, Y.W.; Chan, P.Y. Developing and validating a mobile catering app success model. Int. J. Hosp. Manag. 2019, 77, 19–30. [Google Scholar] [CrossRef]
  29. Jeon, E.; Park, H.A. Factors affecting acceptance of smartphone application for management of obesity. Healthc. Inform. Res. 2015, 21, 74–82. [Google Scholar] [CrossRef] [Green Version]
  30. Cho, M.; Bonn, M.A.; Li, J.J. Differences in perceptions about food delivery apps between single-person and multi-person households. Int. J. Hosp. Manag. 2019, 77, 108–116. [Google Scholar] [CrossRef]
  31. Lattani. Food Delivery Platforms Revolutionizing the Market during COVID-19: Why is Regulation Lagging behind? Available online: https://www.ifis.org/blog/food-delivery-platforms-covid-19 (accessed on 24 September 2020).
  32. Hockbaum, G.M. Public Participation in 2 Edical Screening Programs; Department of Health, Education, and Welfare: Washington, DC, USA, 1957.
  33. Carpenter, C.J. A meta-analysis of the effectiveness of health belief model variables in predicting behavior. Health Commun. 2010, 25, 661–669. [Google Scholar] [CrossRef] [Green Version]
  34. Sheppard, J.; Thomas, C.B. Community pharmacists and communication in the time of COVID-19: Applying the health belief model. Res. Soc. Adm. Pharm. 2021, 17, 1984–1987. [Google Scholar]
  35. Janz, N.K.; Becker, M.H. The health belief model: A decade later. Health Educ. Q. 1984, 11, 1–47. [Google Scholar] [CrossRef] [Green Version]
  36. Luquis, R.R.; Kensinger, W.S. Applying the health belief model to assess prevention services among young adults. Int. J. Health Promot. Educ. 2019, 57, 37–47. [Google Scholar] [CrossRef]
  37. Erku, D.A.; Belachew, S.A.; Abrha, S.; Sinnollareddy, M.; Thomas, J.; Steadman, K.J.; Tesfaye, W.H. When fear and misinformation go viral: Pharmacists’ role in deterring medication misinformation during the ‘infodemic’ surrounding COVID-19. Res. Soc. Adm. Pharm. 2021, 17, 1954–1963. [Google Scholar] [CrossRef] [PubMed]
  38. Becker, M.H.; Maiman, L.A. Strategies for enhancing patient compliance. J. Community Health 1980, 6, 113–135. [Google Scholar] [CrossRef] [PubMed]
  39. Wong, L.P.; Alias, H.; Wong, P.F.; Lee, H.Y.; AbuBakar, S. The use of the health belief model to assess predictors of intent to receive the COVID-19 vaccine and willingness to pay. Hum. Vaccines Immunother. 2020, 16, 2204–2214. [Google Scholar] [CrossRef] [PubMed]
  40. Shahnazi, H.; Ahmadi-Livani, M.; Pahlavanzadeh, B.; Rajabi, A.; Hamrah, M.S.; Charkazi, A. Assessing preventive health behaviors from COVID-19: A cross sectional study with health belief model in Golestan Province, Northern of Iran. Infect. Dis. Poverty 2020, 9, 1–9. [Google Scholar] [CrossRef] [PubMed]
  41. Champion, V.L.; Skinner, C.S. Health behavior and health education: Theory, research, and practice. Health Belief Model 2008, 4, 45–65. [Google Scholar]
  42. Aji, H.M.; Berakon, I.; Md Husin, M. COVID-19 and e-wallet usage intention: A multigroup analysis between Indonesia and Malaysia. Cogent Bus. Manag. 2020, 7, 1804181. [Google Scholar] [CrossRef]
  43. Walrave, M.; Waeterloos, C.; Ponnet, K. Adoption of a contact tracing app for containing COVID-19: A health belief model approach. JMIR Public Health Surveill. 2020, 6, e20572. [Google Scholar] [CrossRef]
  44. Zhang, J.X.; Zhang, H.; Ordoñez de Pablos, P.; Sun, Y. Challenges and foresights of global virtual worlds markets. J. Glob. Inf. Technol. Manag. 2014, 17, 69–73. [Google Scholar] [CrossRef]
  45. Scarpa, R.; Thiene, M. Organic food choices and Protection Motivation Theory: Addressing the psychological sources of heterogeneity. Food Qual. Prefer. 2011, 22, 532–541. [Google Scholar] [CrossRef]
  46. Hong, S.; Kim, J.; Lee, H. Antecedents of use-continuance in information systems: Toward aninegrative view. J. Comput. Inf. Syst. 2008, 48, 61–73. [Google Scholar]
  47. Mehrolia, S.; Alagarsamy, S.; Solaikutty, V.M. Customers response to online food delivery services during COVID-19 outbreak using binary logistic regression. Int. J. Consum. Stud. 2021, 45, 396–408. [Google Scholar] [CrossRef]
  48. Stewart, J.E.; Wolfe, G.R.; Maeder, L.; Hartz, G.W. Changes in dental knowledge and self-efficacy scores following interventions to change oral hygiene behavior. Patient Educ. Couns. 1996, 27, 269–277. [Google Scholar] [CrossRef]
  49. Compeau, D.; Higgins, C.A.; Huff, S. Social cognitive theory and individual reactions to computing technology: A longitudinal study. MIS Q. 1999, 23, 145–158. [Google Scholar] [CrossRef]
  50. Fox, G.; Connolly, R. Mobile health technology adoption across generations: Narrowing the digital divide. Inf. Syst. J. 2018, 28, 995–1019. [Google Scholar] [CrossRef]
  51. Suh, B.; Han, I. Effect of trust on customer acceptance of Internet banking. Electron. Commer. Res. Appl. 2002, 1, 9. [Google Scholar] [CrossRef]
  52. King, W.R.; He, J. A meta-analysis of the technology acceptance model. Inf. Manag. 2006, 43, e740–e755. [Google Scholar] [CrossRef]
  53. Rezaei, S.; Shahijan, M.K.; Amin, M.; Ismail, W.K.W. Determinants of App Stores Continuance Behavior: A PLS Path Modelling Approach. J. Internet Commer. 2016, 15, 408–440. [Google Scholar] [CrossRef]
  54. Marangunić, N.; Granić, A. Technology acceptance model: A literature review from 1986 to 2013. Univers. Access Inf. Soc. 2015, 14, 81–95. [Google Scholar] [CrossRef]
  55. Ghazali, E.M.; Mutum, D.S.; Chong, J.H.; Nguyen, B. Do consumers want mobile commerce? A closer look at M-shopping and technology adoption in Malaysia. Asia Pac. J. Mark. Logist. 2018, 30, 1064–1086. [Google Scholar] [CrossRef] [Green Version]
  56. Lee, Y.K.; Park, J.H.; Chung, N.; Blakeney, A. A unified perspective on the factors influencing usage intention toward mobile financial services. J. Bus. Res. 2012, 65, 1590–1599. [Google Scholar] [CrossRef]
  57. Fishbein Mand Ajzen, I. Belief, Attitude, Intention, and Behavior: An Introduction to Theory and Research; Addison-Wesley: Reading, MA, USA, 1975. [Google Scholar]
  58. Byun, H.; Chiu, W.; Bae, J.S. Exploring the adoption of sports brand apps: An application of the modified technology acceptance model. Int. J. Asian Bus. Inf. Manag. 2018, 9, 52–65. [Google Scholar] [CrossRef]
  59. Sun, Y.; Wang, N.; Guo, X.; Peng, J.Z. Understanding the acceptance of mobile health services: A comparison and integration of alternative models. J. Electron. Commer. Res. 2013, 14, 183–200. [Google Scholar]
  60. Kim, J.; Park, H.A. Development of a health information technology acceptance model using consumers’ health behavior intention. J. Med. Internet Res. 2012, 14, 133. [Google Scholar] [CrossRef]
  61. Legris, P.; Ingham, J.; Collerette, P. Why do people use information technology? A critical review of the technology acceptance model. Inf. Manag. 2003, 40, 191–204. [Google Scholar] [CrossRef]
  62. Venkatesh, V.; Bala, H. Technology Acceptance Model 3 and a Research Agenda on Interventions. Decis. Sci. 2008, 39, 273–315. [Google Scholar] [CrossRef] [Green Version]
  63. Joo, Y.J.; So, H.J.; Kim, N.H. Examination of relationships among students’ self-determination, technology acceptance, satisfaction, and continuance intention to use K-MOOCs. Comput. Educ. 2018, 122, 260–272. [Google Scholar] [CrossRef]
  64. Bhattacherjee, A. An empirical analysis of the antecedents of electronic commerce service continuance. Decis. Support Syst. 2001, 32, 201–214. [Google Scholar] [CrossRef]
  65. Oh, J.C.; Yoon, S.J.; Chung, N. The role of technology readiness in consumers’ adoption of mobile internet services between South Korea and China. Int. J. Mob. Commun. 2014, 12, 229–248. [Google Scholar] [CrossRef]
  66. Meng, J.; Elliott, K.M.; Hall, M.C. Technology Readiness Index (TRI): Assessing cross-cultural validity. J. Int. Consum. Mark. 2009, 22, 19–31. [Google Scholar] [CrossRef]
  67. Parasuraman, A.; Colby, C.L. An updated and streamlined technology readiness index: TRI 2.0. J. Serv. Res. 2015, 18, 59–74. [Google Scholar] [CrossRef]
  68. Massey, A.P.; Khatri, V.; Montoya-Weiss, M.M. Usability of online services: The role of technology readiness and context. Decis. Sci. 2007, 38, 277–308. [Google Scholar] [CrossRef]
  69. Franque, F.B.; Oliveira, T.; Tam, C.; de Santini, F.O. A meta-analysis of the quantitative studies in continuance intention to use an information system. Internet Res. 2020, 31, 123–158. [Google Scholar] [CrossRef]
  70. Kim, B.; Kang, M. How user loyalty and nonconscious inertia influence the continued use of mobile communications platforms. Int. J. Mob. Commun. 2016, 14, 387–410. [Google Scholar] [CrossRef]
  71. Kim, B.G.; Park, S.C.; Lee, K.J. A structural equation modeling of the Internet acceptance in Korea. Electron. Commer. Res. Appl. 2007, 6, 425–432. [Google Scholar] [CrossRef]
  72. Bhattacherjee, A. Understanding Information Systems Continuance: An Expectation-Confirmation Model. MIS Q. 2001, 25, 351–370. [Google Scholar] [CrossRef]
  73. Nabavi, A.; Taghavi-Fard, M.T.; Hanafizadeh, P.; Taghva, M.R. Information technology continuance intention: A systematic literature review. Int. J. E-Bus. Res. 2016, 12, 58–95. [Google Scholar] [CrossRef] [Green Version]
  74. Hoehle, H.; Zhang, X.; Venkatesh, V. An espoused cultural perspective to understand continued intention to use mobile applications: A four-country study of mobile social media application usability. Eur. J. Inf. Syst. 2015, 24, 337–359. [Google Scholar] [CrossRef]
  75. Guo, X.; Sun, Y.; Wang, N.; Peng, Z.; Yan, Z. The dark side of elderly acceptance of preventive mobile health services in China. Electron. Mark. 2013, 23, 49–61. [Google Scholar] [CrossRef]
  76. Dou, K.; Yu, P.; Deng, N.; Liu, F.; Guan, Y.; Li, Z.; Ji, Y.; Du, N.; Lu, X.; Duan, H. Patients’ acceptance of smartphone health technology for chronic disease management: A theoretical model and empirical test. JMIR Mhealth Uhealth 2007, 5, 177. [Google Scholar] [CrossRef]
  77. McDonald, T.; Siegall, M. The effects of technological self-efficacy and job focus on job performance, attitudes, and withdrawal behaviors. J. Psychol. Interdiscip. Appl. 1992, 126, 465–475. [Google Scholar] [CrossRef]
  78. Luarn, P.; Lin, H.H. Toward an understanding of the behavioral intention to use mobile banking. Comput. Hum. Behav. 2005, 21, 873–891. [Google Scholar] [CrossRef]
  79. Lewis, T.L.; Loker, S. Technology usage intent among apparel retail employees. Int. J. Retail. Distrib. Manag. 2014, 42, 422–440. [Google Scholar] [CrossRef]
  80. Hernandez, B.; Jimenez, J.; Martin, M.J. The impact of self-efficacy, ease of use and usefulness on e-purchasing: An analysis of experienced e-shoppers. Interact. Comput. 2009, 21, 146–156. [Google Scholar] [CrossRef]
  81. Lew, S.; Tan, G.W.H.; Loh, X.M.; Hew, J.J.; Ooi, K.B. The disruptive mobile wallet in the hospitality industry: An extended mobile technology acceptance model. Technol. Soc. 2020, 63, 101430. [Google Scholar] [CrossRef]
  82. Gefen, D.; Karahanna, E.; Straub, D.W. Trust and TAM in online shopping: An integrated model. MIS Q. 2003, 27, 51–90. [Google Scholar] [CrossRef]
  83. Elliott, K.; Meng, G.; Hall, M. The influence of technology readiness on the evaluation of self-service technology attributes and resulting attitude toward technology usage. Serv. Mark. Q. 2012, 33, 311–329. [Google Scholar] [CrossRef]
  84. Roy, S.; Moorthi, Y.L.R. Technology readiness, perceived ubiquity and m-commerce adoption: The moderating role of privacy. J. Res. Interact. Mark. 2017, 11, 268–295. [Google Scholar] [CrossRef]
  85. Jin, C. The perspective of a revised TRAM on social capital building: The case of Facebook usage. Inf. Manag. 2013, 50, 162–168. [Google Scholar] [CrossRef]
  86. Lin, J.S.C.; Chang, H.C. The role of technology readiness in self-service technology acceptance. Manag. Serv. Qual. Int. J. 2011, 21, 424–444. [Google Scholar] [CrossRef]
  87. Mukerjee, H.S.; Deshmukh, G.K.; Prasad, U.D. Technology Readiness and Likelihood to Use Self-Checkout Services Using Smartphone in Retail Grocery Stores: Empirical Evidences from Hyderabad, India. Bus. Perspect. Res. 2019, 7, 1–15. [Google Scholar] [CrossRef]
  88. Roh, M.; Park, K. Adoption of O2O food delivery services in South Korea: The moderating role of moral obligation in meal preparation. Int. J. Inf. Manag. 2019, 47, 262–273. [Google Scholar] [CrossRef]
  89. Churchill, G.A. A Paradigm for Developing Better Measures of Marketing Constructs. J. Mark. Res. 1979, 16, 64–73. [Google Scholar] [CrossRef]
  90. Thong, J.Y.L.; Hong, S.J.; Tam, K.Y. The effects of post-adoption beliefs on the expectation-confirmation model for information technology continuance. Int. J. Hum. Comput. Stud. 2006, 64, 799–810. [Google Scholar] [CrossRef]
  91. Hsiao, C.H.; Chang, J.J.; Tang, K.Y. Exploring the influential factors in continuance usage of mobile social Apps: Satisfaction, habit, and customer value perspectives. Telemat. Inform. 2016, 33, 342–355. [Google Scholar] [CrossRef]
  92. Hair, J.F.; Hult, G.T.M.; Ringle, C.M.; Sarstedt, M. A Primer on Partial Least Squares Structural Equation Modeling (PLS-SEM), 2nd ed.; Sage: Thousand Oaks, CA, USA, 2017. [Google Scholar]
  93. Ringle, C.M.; Wende, S.; Will, A. SmartPLS3.0. 2015. Available online: Hamburg: www.smartpls.de (accessed on 22 May 2021).
  94. Bagozzi, R.P.; Yi, Y. On the evaluation of structural equation models. J. Acad. Mark. Sci. 1988, 16, 74–94. [Google Scholar] [CrossRef]
  95. Fornell, C.; Larcker, D.F. Evaluating Structural Equation Models with Unobservable Variables and Measurement Error. J. Mark. Res. 1981, 18, 39–50. [Google Scholar] [CrossRef]
  96. Henseler, J.; Ringle, C.M.; Sarstedt, M. A new criterion for assessing discriminant validity in variance-based structural equation modeling. J. Acad. Mark. Sci. 2015, 43, 115–135. [Google Scholar] [CrossRef] [Green Version]
  97. Hair, J.F.; Sarstedt, M.; Ringle, C.M.; Mena, J.A. An assessment of the use of partial least squares structural equation modeling in marketing research. J. Acad. Mark. Sci. 2012, 40, 414–433. [Google Scholar] [CrossRef]
  98. Falk, R.F.; Miller, N.B. A Primer for Soft Modelling; University of Akron Press: Akron, OH, USA, 1992. [Google Scholar]
  99. Rufat-Latre, J.; Muller, A.; Jones, D. Delivering on the promise of open innovation. Strategy Leadersh. 2010, 38, 23–28. [Google Scholar] [CrossRef]
  100. Vanhaverbeke, W.; Chesbrough, H. A classification of open innovation and open business models. New Front. Open Innov. 2014, 6, 50–68. [Google Scholar]
  101. Wei, J.; Vinnikova, A.; Lu, L.; Xu, J. Understanding and predicting the adoption of fitness mobile apps: Evidence from China. Health Commun. 2021, 36, 950–961. [Google Scholar] [CrossRef]
  102. Chesbrough, H. The Future of Open Innovation. Res. Technol. Manag. 2017, 60, 35–38. [Google Scholar] [CrossRef]
  103. Dodgson, M.; Gann, D.; Salter, A. The role of technology in the shift towards open innovation: The case of Procter & Gamble. Rd Manag. 2006, 36, 333–346. [Google Scholar]
  104. Jain, A. Apps marketplaces and the telecom value chain. IEEE Wirel. Commun. 2011, 18, 4–5. [Google Scholar] [CrossRef]
  105. Ghazawneh, A.; Henfridsson, O. Balancing platform control and external contribution in third-party development: The boundary resources model. Inf. Syst. J. 2013, 23, 173–192. [Google Scholar] [CrossRef]
  106. Hilbolling, S.; Berends, H.; Deken, F.; Tuertscher, P. Complementors as connectors: Managing open innovation around digital product platforms. Rd Manag. 2020, 50, 18–30. [Google Scholar] [CrossRef] [Green Version]
  107. Gassmann, O.; Enkel, E.; Chesbrough, H. The future of open innovation. Rd Manag. 2010, 40, 213–221. [Google Scholar] [CrossRef]
  108. Ray, A.; Dhir, A.; Bala, P.K.; Kaur, P. Why do people use food delivery apps (FDA)? A uses and gratification theory perspective. J. Retail. Consum. Serv. 2019, 51, 221–230. [Google Scholar] [CrossRef]
  109. Weng, G.S.; Zailani, S.; Iranmanesh, M.; Hyun, S.S. Mobile taxi booking application service’s continuance usage intention by users. Transp. Res. Part D Transp. Environ. 2017, 57, 207–216. [Google Scholar] [CrossRef]
  110. Koay, K.Y.; Cheah, C.W.; Chang, Y.X. A model of online food delivery service quality, customer satisfaction and customer loyalty: A combination of PLS-SEM and NCA approaches. Br. Food J. 2022. [Google Scholar] [CrossRef]
  111. Alzoubi, H.; Alshurideh, M.; Kurdi, B.; Akour, I.; Aziz, R. Does BLE technology contribute towards improving marketing strategies, customers’ satisfaction and loyalty? The role of open innovation. Int. J. Data Netw. Sci. 2022, 6, 449–460. [Google Scholar] [CrossRef]
  112. Parida, V.; Westerberg, M.; Frishammar, J. Inbound open innovation activities in high-tech SMEs: The impact on innovation performance. J. Small Bus. Manag. 2012, 50, 283–309. [Google Scholar] [CrossRef] [Green Version]
  113. Barlatier, P.J.; Josserand, E. Delivering open innovation promises through social media. J. Bus. Strategy 2018, 39, 21–28. [Google Scholar] [CrossRef] [Green Version]
  114. Humbani, M.; Wiese, M. An integrated framework for the adoption and continuance intention to use mobile payment apps. Int. J. Bank Mark. 2019, 37, 646–664. [Google Scholar] [CrossRef]
Figure 1. Conceptual model and hypotheses.
Joitmc 08 00114 g001
Table 1. Sample characteristics.
CharacteristicsFrequencyPercentage
Gender
Male10035.8
Female18564.2
Age
Less than 2413647.2
25–3410034.7
35–44165.6
45–54227.6
Over 54144.9
Education
High school or below155.2
Intermediate72.4
Undergraduate and postgraduate15553.8
Master or above11138.5
Net monthly income
Less than EUR 2.00117962.1
EUR 2.001–4.0003110.8
More than EUR 400051.7
Did not answer7325.3
Table 2. Measurement model evaluation: individual item reliability, construct reliability, and convergent validity.
ConstructItemStandardized Loadingt-ValueCRCAAVE
Perceived susceptibilityPS10.87612.9570.7710.8650.682
PS20.83210.139
PS30.7656.840
Perceived severityPSEV10.8504.0050.7190.8750.778
PSEV20.9134.601
Self-efficacy
SE10.78418.9450.7950.8670.619
SE20.82825.965
SE30.73416.308
SE40.79923.225
Perceived usefulness
PU10.93086.5070.9310.9510.829
PU20.92273.866
PU30.93064.534
PU40.85832.617
Perceived ease of usePEOU10.87846.4130.8890.9220.747
PEOU20.81424.135
PEOU30.88839.517
PEOU40.87646.269
Continuance intentionCI10.84537.1090.7680.8510.589
CI20.77120.416
CI30.74014.693
CI40.70514.093
Table 3. Measurement model evaluation: discriminant validity.
Discriminant validity: Fornell−Larcker criterion.
VariablesPSPSEVSEPEOUPUCITR AgeGender
Perceived susceptibility (PS)0.826
Perceived severity (PSEV)0.1070.882
Self-efficacy (SE)0.018−0.0610.787
Perceived ease of use (PEOU)0.001−0.0950.3930.865
Perceived usefulness (PU0.1960.0930.1480.0260.911
Continuance intention (CI)0.1290.0270.3350.4050.3540.767
Technology readiness (TR)−0.101−0.540.1940.20.1710.196NA
Age0.047−0.0490.052−0.1−0.0730.0130.068NA
Gender 0.0240.061−0.008−0.032−0.024−0.0540.1010.038NA
Discriminant validity: heterotrait−monotrait ratio (HTMT)
PSPSEVSEPEOUPUCITRAgeGender
Perceived susceptibility (PS)
Perceived severity (PSEV)0.156
Self-efficacy (SE)0.0570.113
Perceived ease of use (PEOU)0.0700.1070.442
Perceived usefulness (PU0.2200.1130.1730.071
Continuance intention (CI)0.1580.0840.4240.4540.408
Technology readiness (TR)0.1140.6270.2150.2030.1740.217
Age0.0540.0630.0630.1120.0760.0930.068
Gender0.0240.0810.0680.0460.0290.0920.1010.038
Note: Bolded numbers are the square roots of AVE. Below the diagonal elements are the correlations between the constructs.
Table 4. Results of the hypothesis testing.
HypothesisPath Coefficientt-ValueDecision
(H1) Perceived susceptibility→perceived usefulness0.1993.713 ***Supported
(H2) Perceived severity→perceived usefulness0.2412.928 **Supported
(H3) Self-efficacy→perceived ease of use0.3687.043 ***Supported
(H4) Self-efficacy→perceived usefulness0.1231.731 n.s.Not supported
(H5) Technology readiness→perceived ease of use0.1291.989 *Supported
(H6) Technology readiness→perceived usefulness0.3104.393 ***Supported
(H7) Technology readiness→continuance intention0.0590.8961 n.s.Not supported
(H8) Perceived ease of use→perceived usefulness−0.0610.944 n.s.Not supported
(H9) Perceived ease of use→continuance intention0.3915.478 ***Supported
(H10) Perceived usefulness→continuance intention0.3385.155 ***Supported
Control variables
Age→continuance intention0.0741.441NA
Gender→continuance intention−0.0420.831 n.s.NA
Note: * p < 0.05, ** p < 0.01, *** p < 0.001; n.s.—not significant; NA—not applicable.
Publisher’s Note: MDPI stays neutral with regard to jurisdictional claims in published maps and institutional affiliations.

