The Level of Digitization of Small, Medium and Large Enterprises in the Central and Eastern European Countries and Its Relationship with Economic Parameters


Abstract
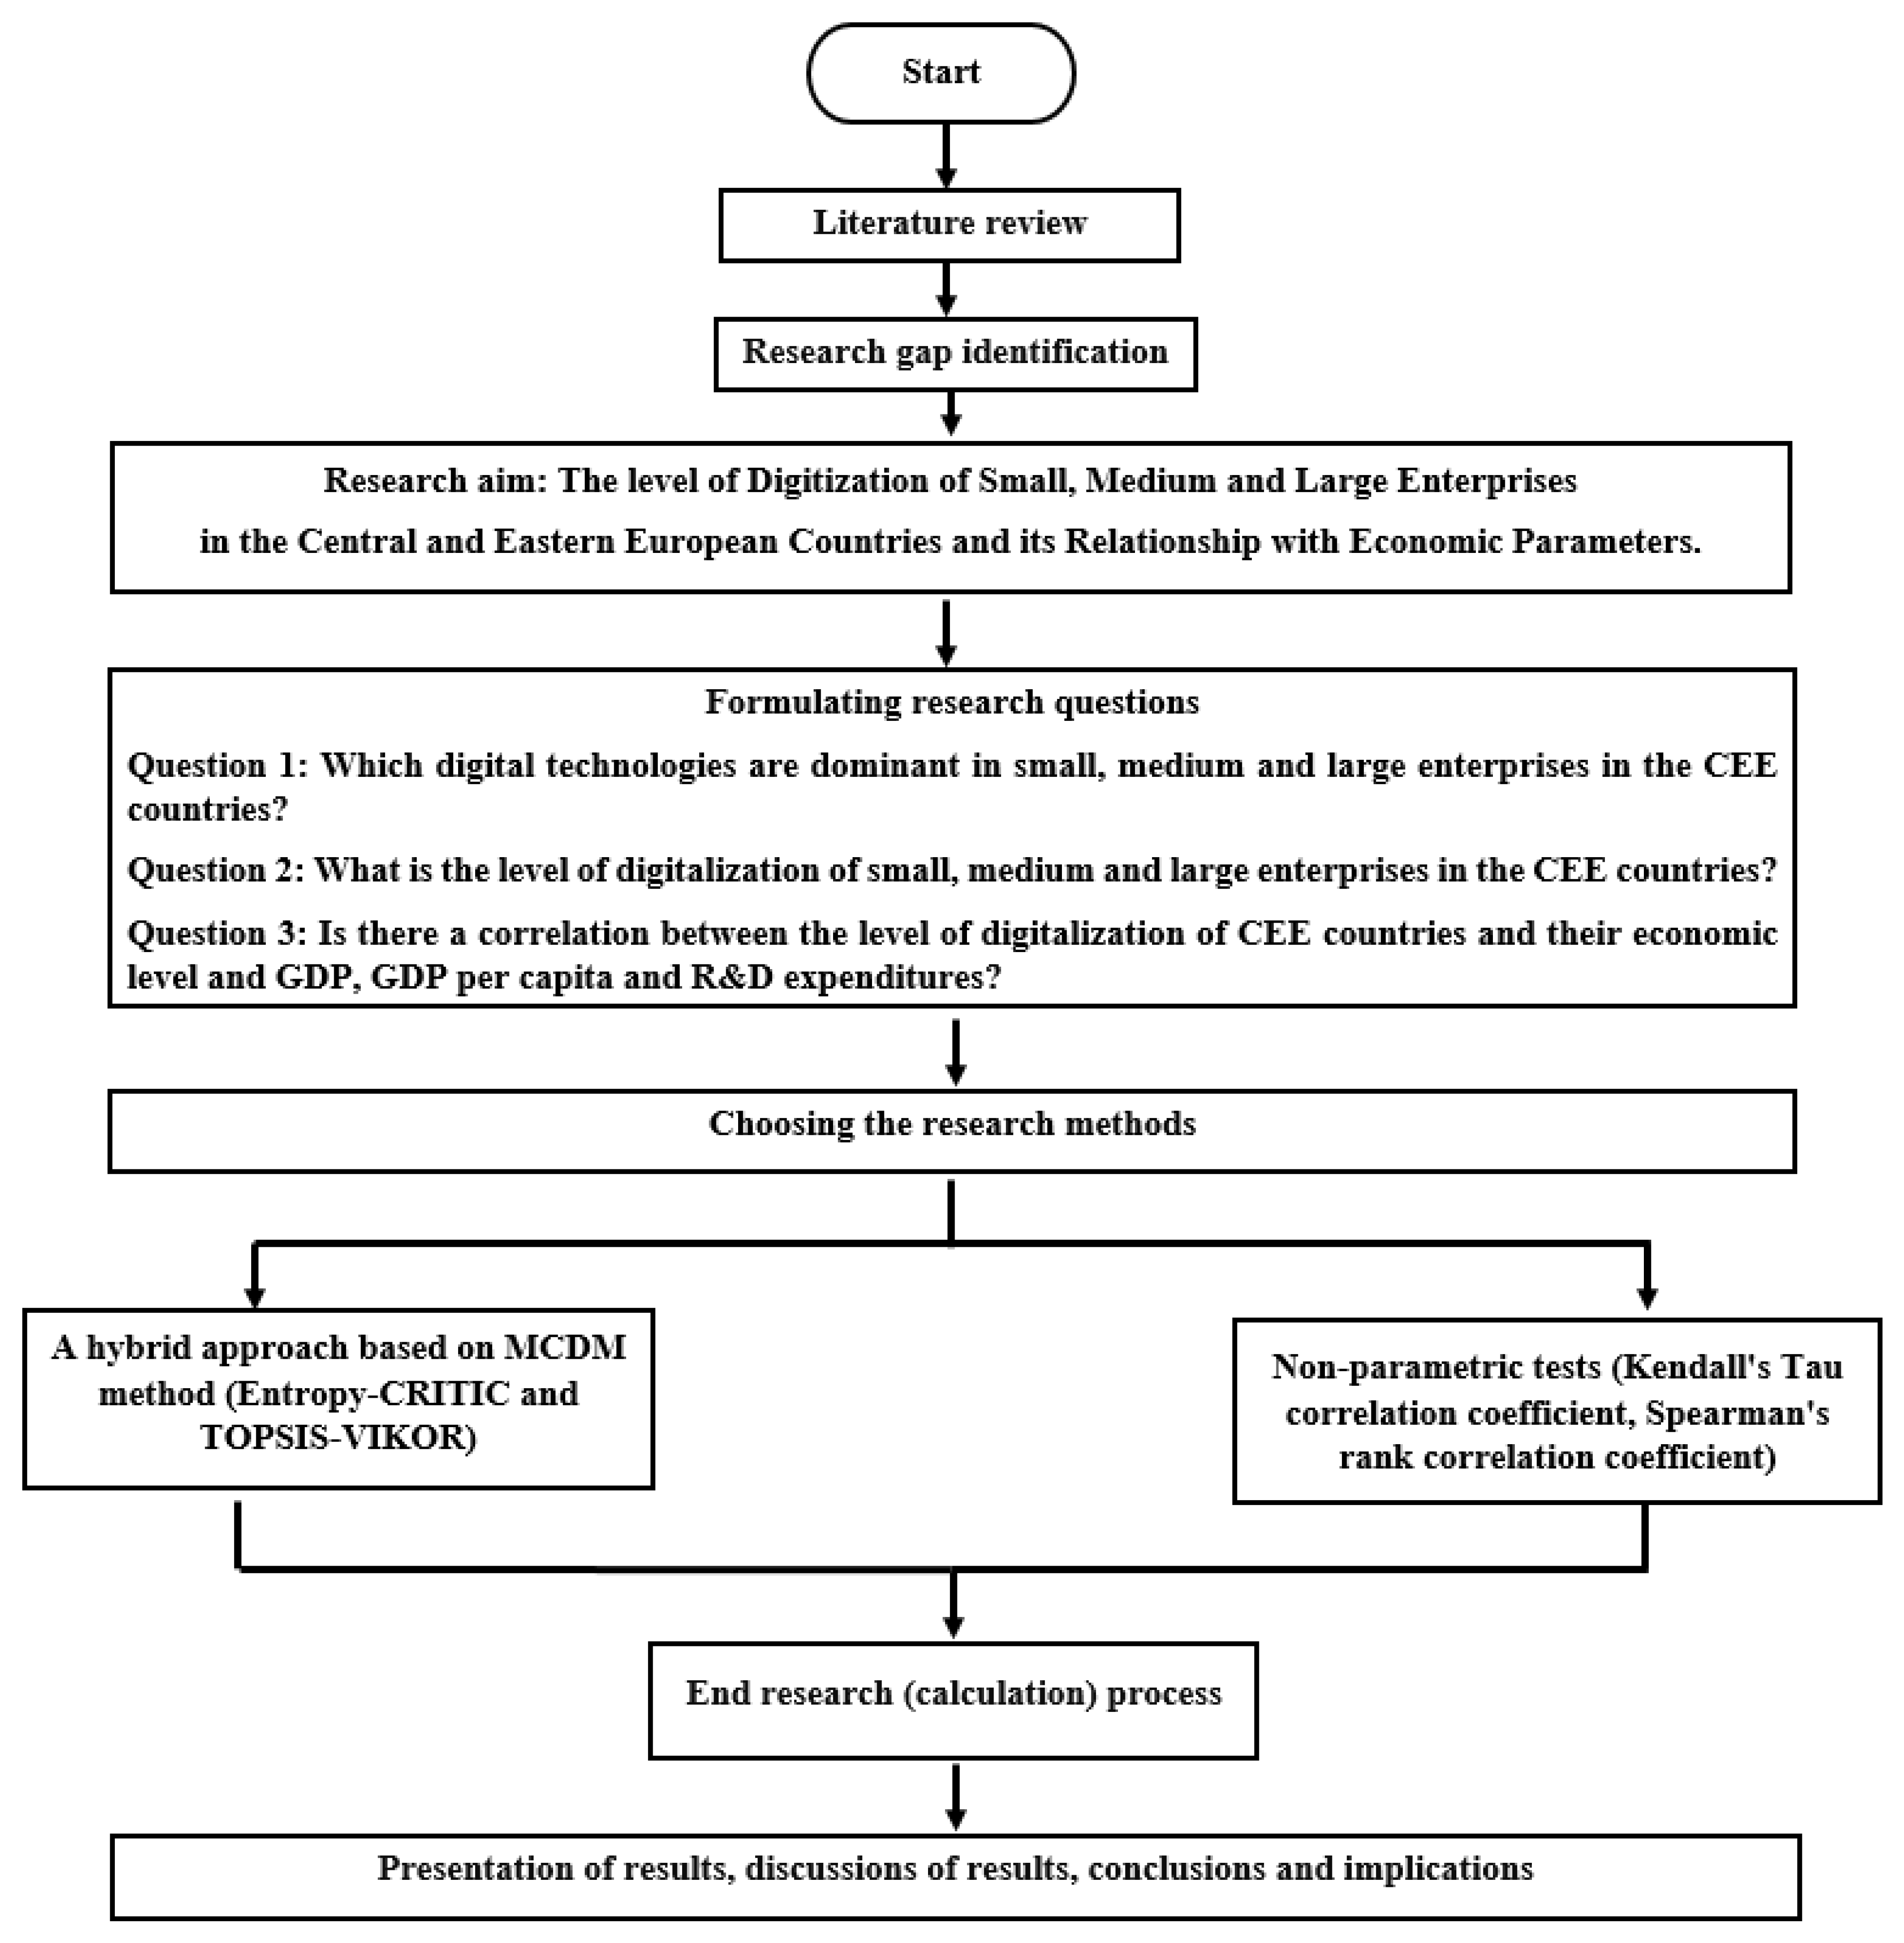
:1. Introduction
- Question 1: Which digital technologies are dominant in small, medium and large enterprises in the CEE countries?
- Question 2: What is the level of digitalization of small, medium and large enterprises in the CEE countries?
- Question 3: Is there a correlation between the level of digitalization of CEE countries and their economic level, GDP, GDP per capita and R&D expenditures?
2. Categories of Enterprises in the European Union
- A small enterprise has between 10 and 49 employees and a turnover or balance sheet total of up to EUR 10 million.
- A medium-sized enterprise has between 50 and 2490 employees and a turnover of up to EUR 50 million, or a balance sheet total of up to EUR 43 million.
- Regardless of the number of employees, exceeded an annual turnover of EUR 50 million, or an annual balance sheet total of EUR 43 million,
- did not exceed an annual turnover of EUR 50 million or an annual balance sheet total of EUR 43 million but had 250 or more employees.
3. Literature Review
3.1. The Impact of Industry 4.0 Technology and Open Innovation Concepts on Business Operations
3.2. Implementation of Industry 4.0 Technology in Enterprises
3.3. Methods for Assessing the Digital Maturity of Companies and Countries
3.4. Research Gap
4. Materials and Methods
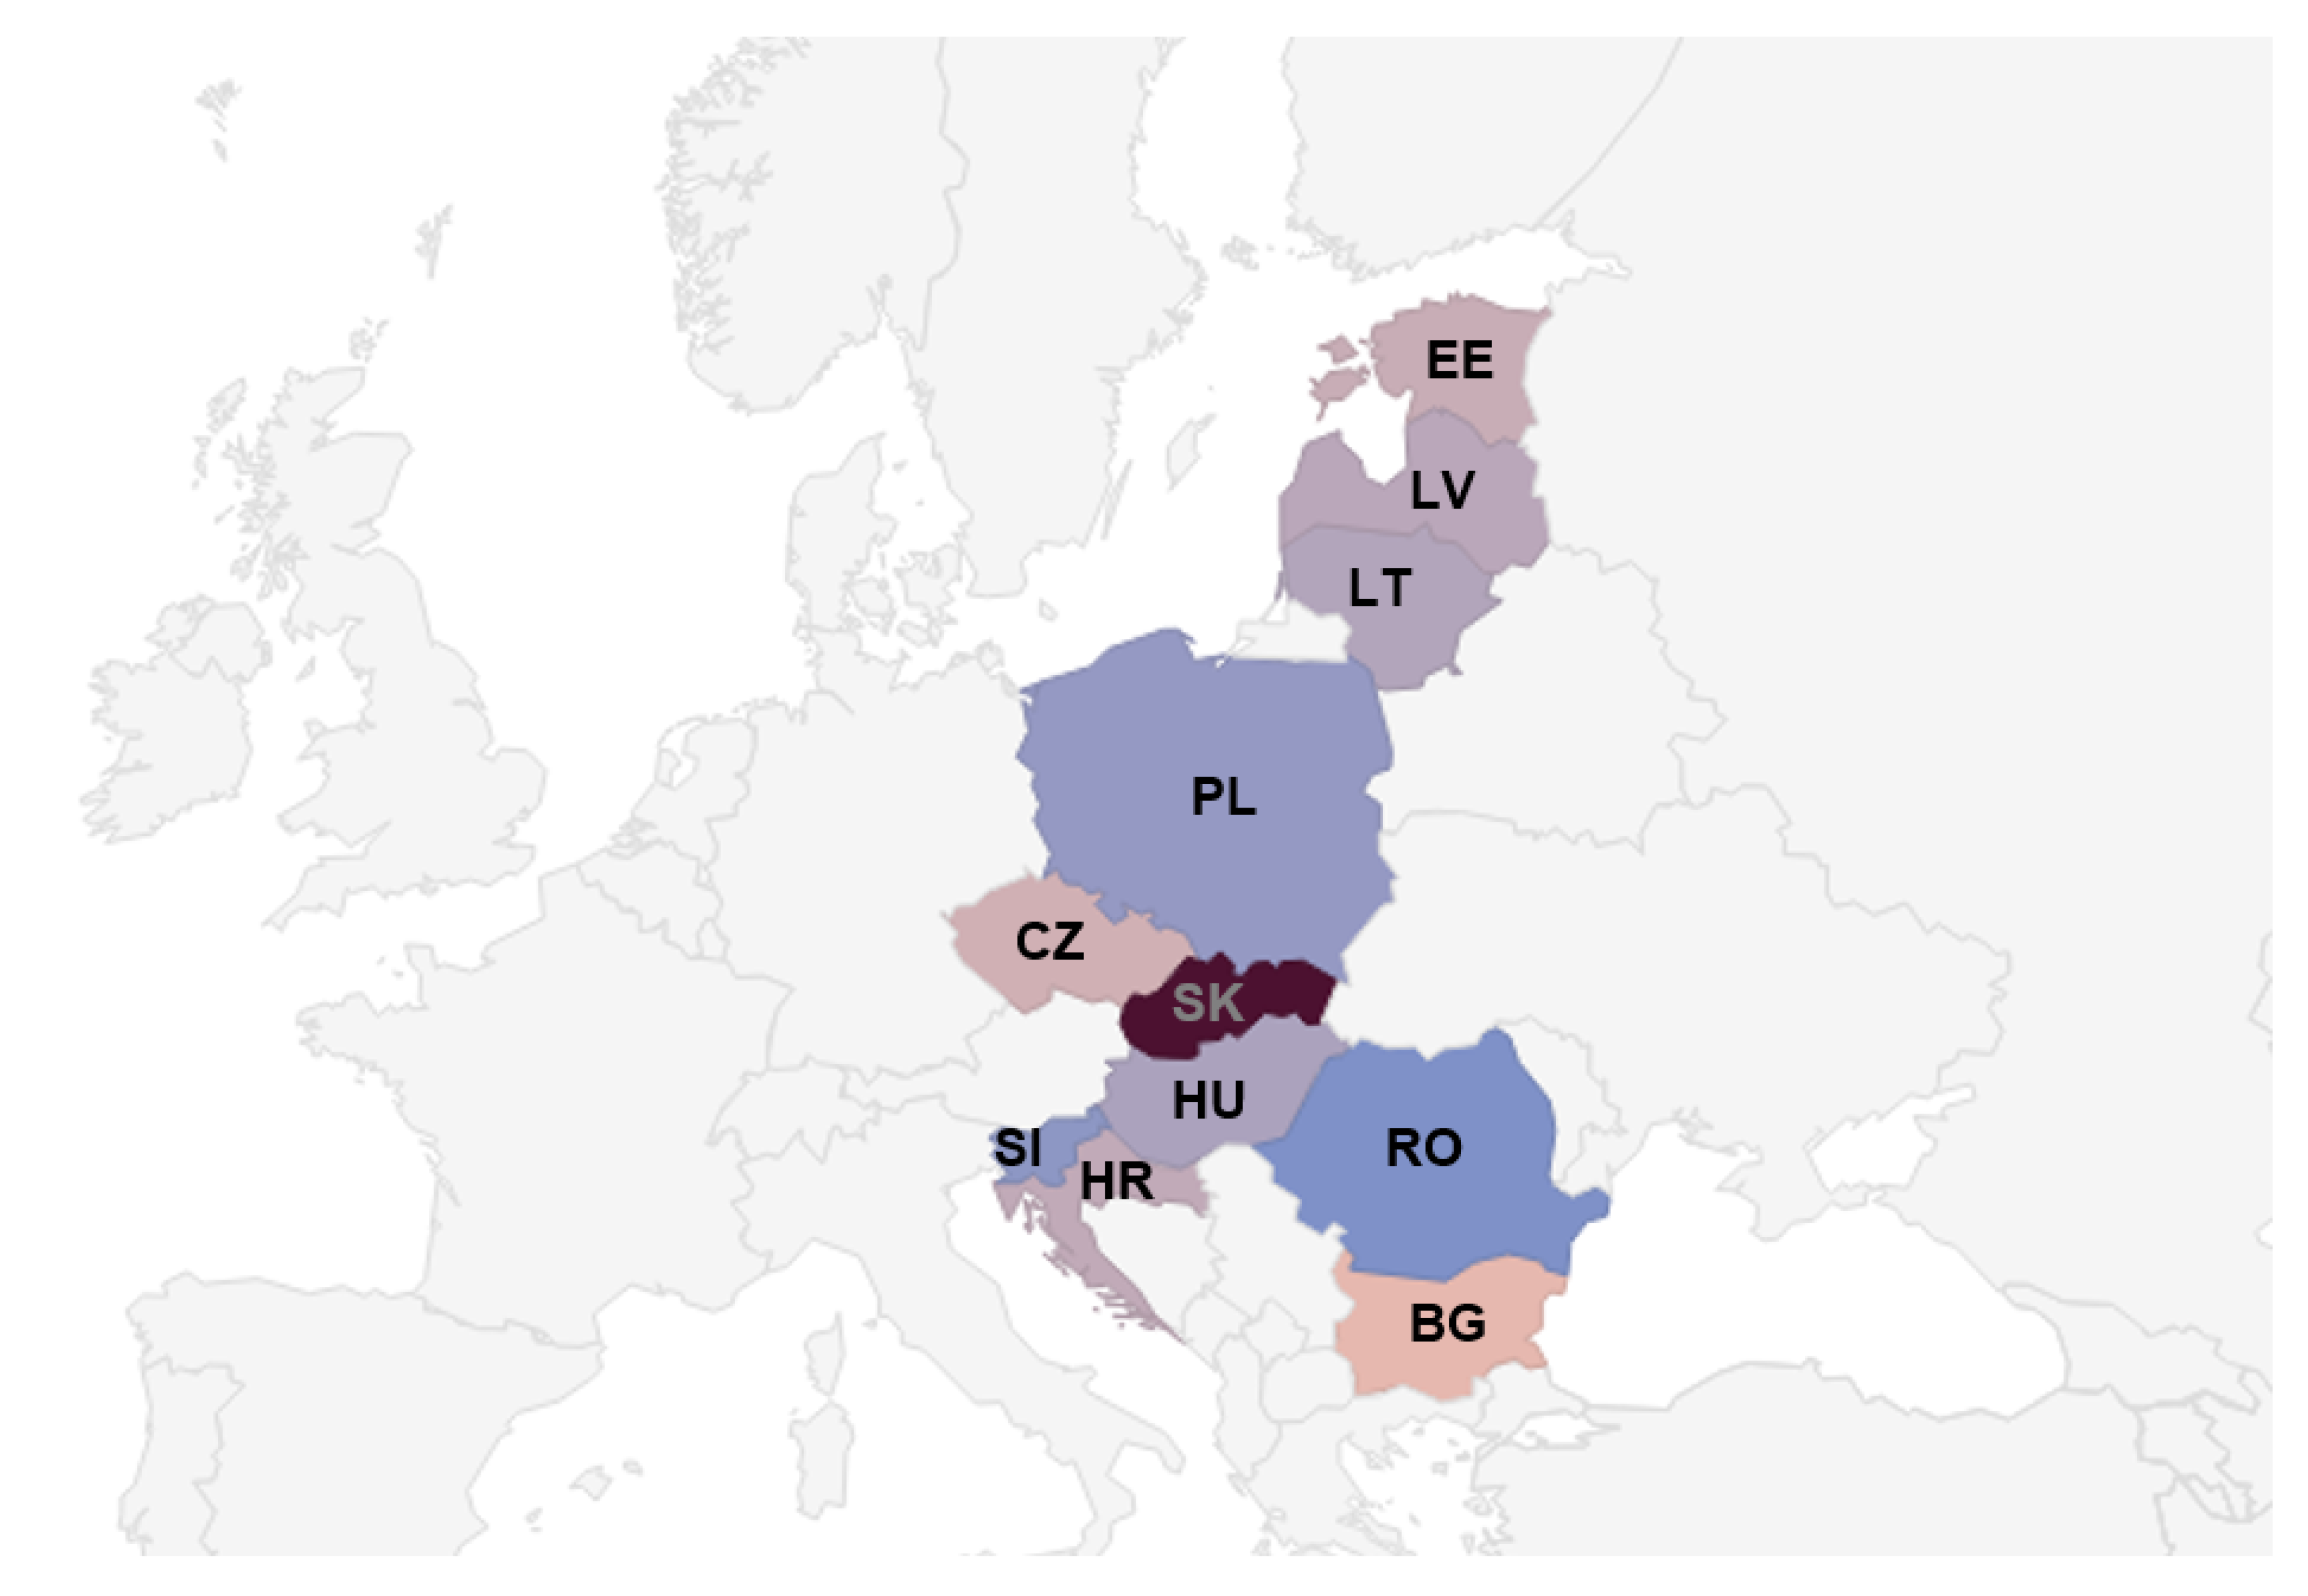
4.1. Area of Research
4.2. Data
4.3. Research Methods
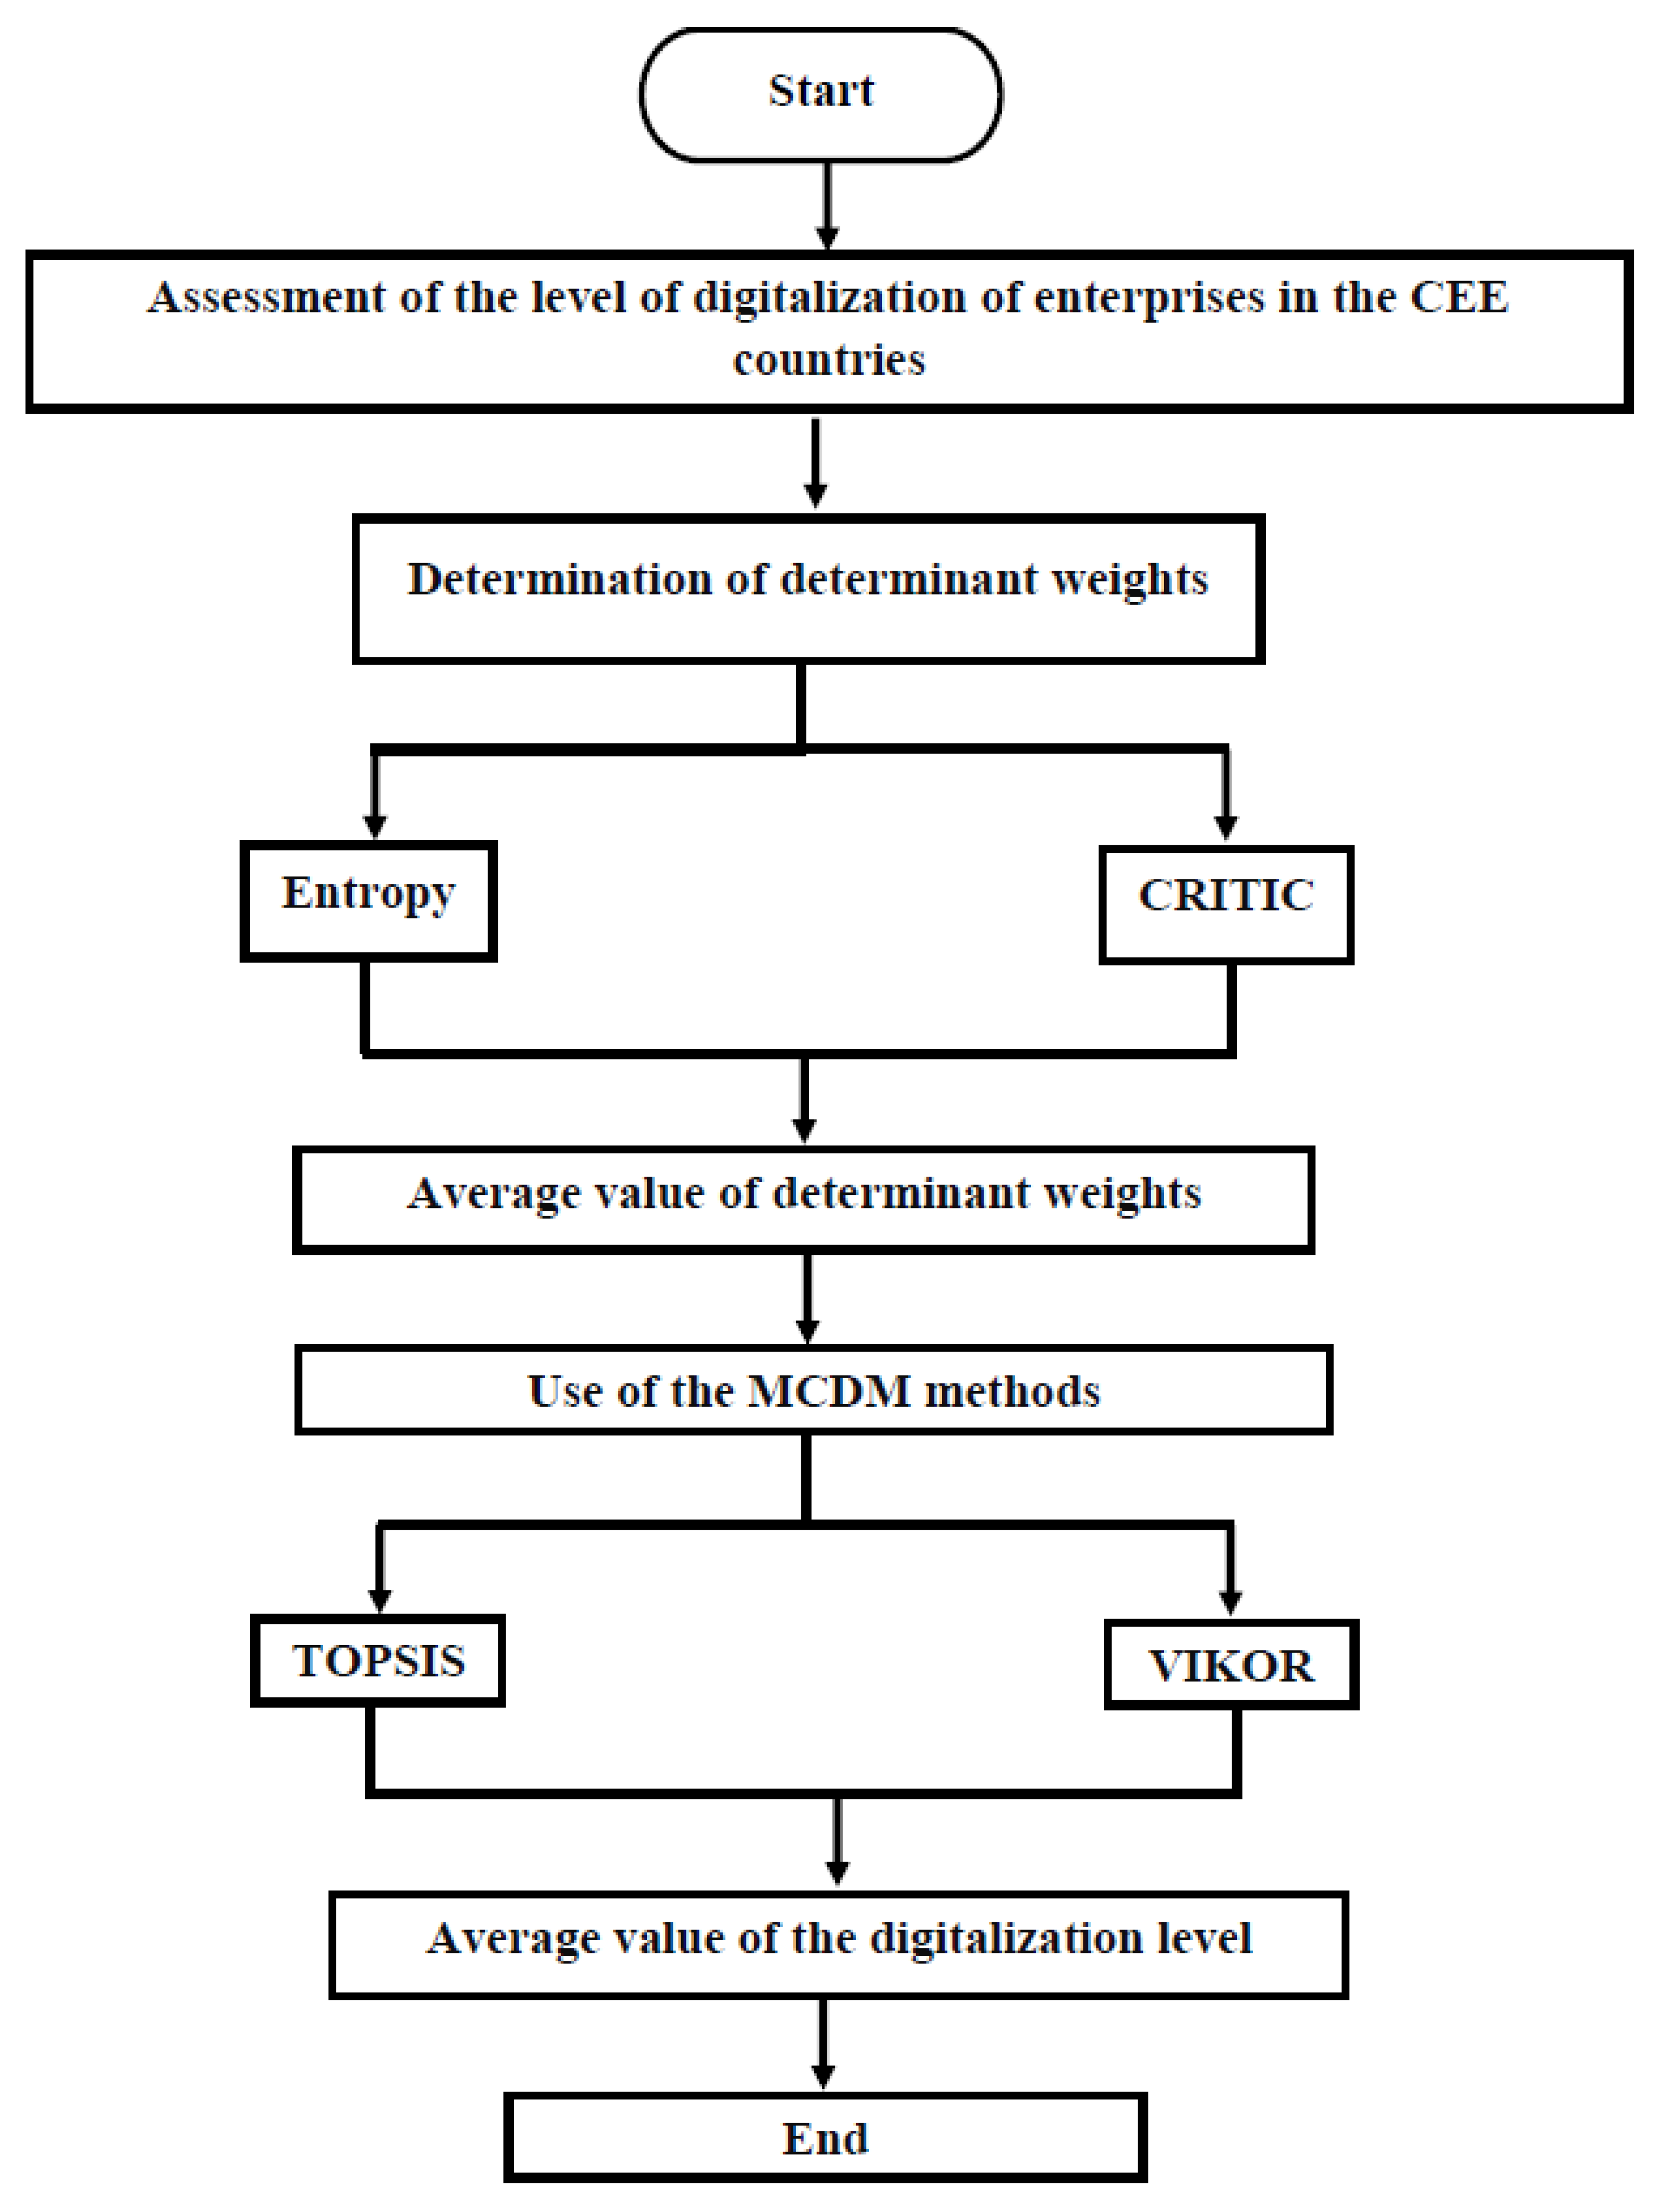
4.3.1. MCDM Methods
Entropy Method
- To construct a decision matrix:
- To construct a normalized decision matrix:
- To determine entropy:whereand nij is the proportion of samples in time t in the i indicator.
- To determine the level of variation of entropy for each criterion (the degree of intrinsic divergence of the scores relative to subsequent criteria) from Equation (5):
- To determine weights (degree of importance) of the criteria according to Equation (6):
CRITIC Method
- To construct a decision matrix that consists of a set of alternatives (Equation (1));
- To construct a normalized decision matrix according to Equation (7):
- To estimate standard deviation for attributes in the normalized decision matrix:
- To determine a correlation between attributes of the normalized decision matrix:
- To determine attribute weights (wi):where: Cj is the quantity of information contained in j-th criterion, σj is the standard deviation of the j-th criterion and rjk is the correlation coefficient between j-th and k-th criteria. For a criterion, high standard deviation and low correlation with the other criteria mean that a given criterion weight is high [52]. The higher the value of Cj, the greater the amount of information obtained from a given criterion.
TOPSIS Method
- To determine a decision matrix, according to Equation (1).
- To determine a normalized matrix, according to:
- To determine a weighted normalized decision matrix:
- To determine the ideal solution S+ and the non-ideal solution S−:
- To determine the Euclidean distance of the object from the ideal variant S+ and the non-ideal variant S−:
- To determine the coefficient of relative closeness of the decision variants Si to the ideal solution S+:
VIKOR Method
- to construct a decision matrix, according to Equation (1);
- to construct a normalized decision matrix, according to Equation (11);
- to determine the best and worst values for all criteria functions i = 1, 2, … n. If the i-th criterion represents profit (the larger the better), then and ; if the i-th criterion represents cost (the smaller the better), then and ;
- to calculate Sj and Rj values forming the ranking measure, from the following relationships:where: wi is the weight of the i-th criterion; Sj and Rj represent the utility measure and the regret measure. The solution obtained by minjSj is with a maximum group utility (‘majority’ rule), and the solution obtained by minjRj is with a minimum individual regret of the ‘opponent’
- to calculate the VIKOR—Qj index value (21):where:where: v is measure of strategy weight (takes value from 0 to 1); Sj and Rj are calculated in step 3 and are introduced as weight of strategy of ‘the majority of criteria’ (or ‘the maximum group utility’). In the present study, v = 0.5;
- to create a ranking of alternatives according to the value of Qj.
4.3.2. Non-Parametric Tests: The Kendall’s Tau Correlation Coefficient and the Spearman’s Rank Coefficient
5. Results
- For small enterprises: Slovenia > Croatia > Estonia > Lithuania > Czech Republic > Slovakia > Latvia > Poland > Hungary > Romania > Bulgaria
- For medium-sized enterprises: Slovenia > Estonia > Czech Republic > Croatia > Lithuania > Latvia > Poland > Slovakia > Hungary > Romania > Bulgaria
- For large enterprises: Slovenia > Czech Republic > Poland > Estonia > Hungary > Croatia > Slovakia > Latvia > Lithuania > Bulgaria > Romania.
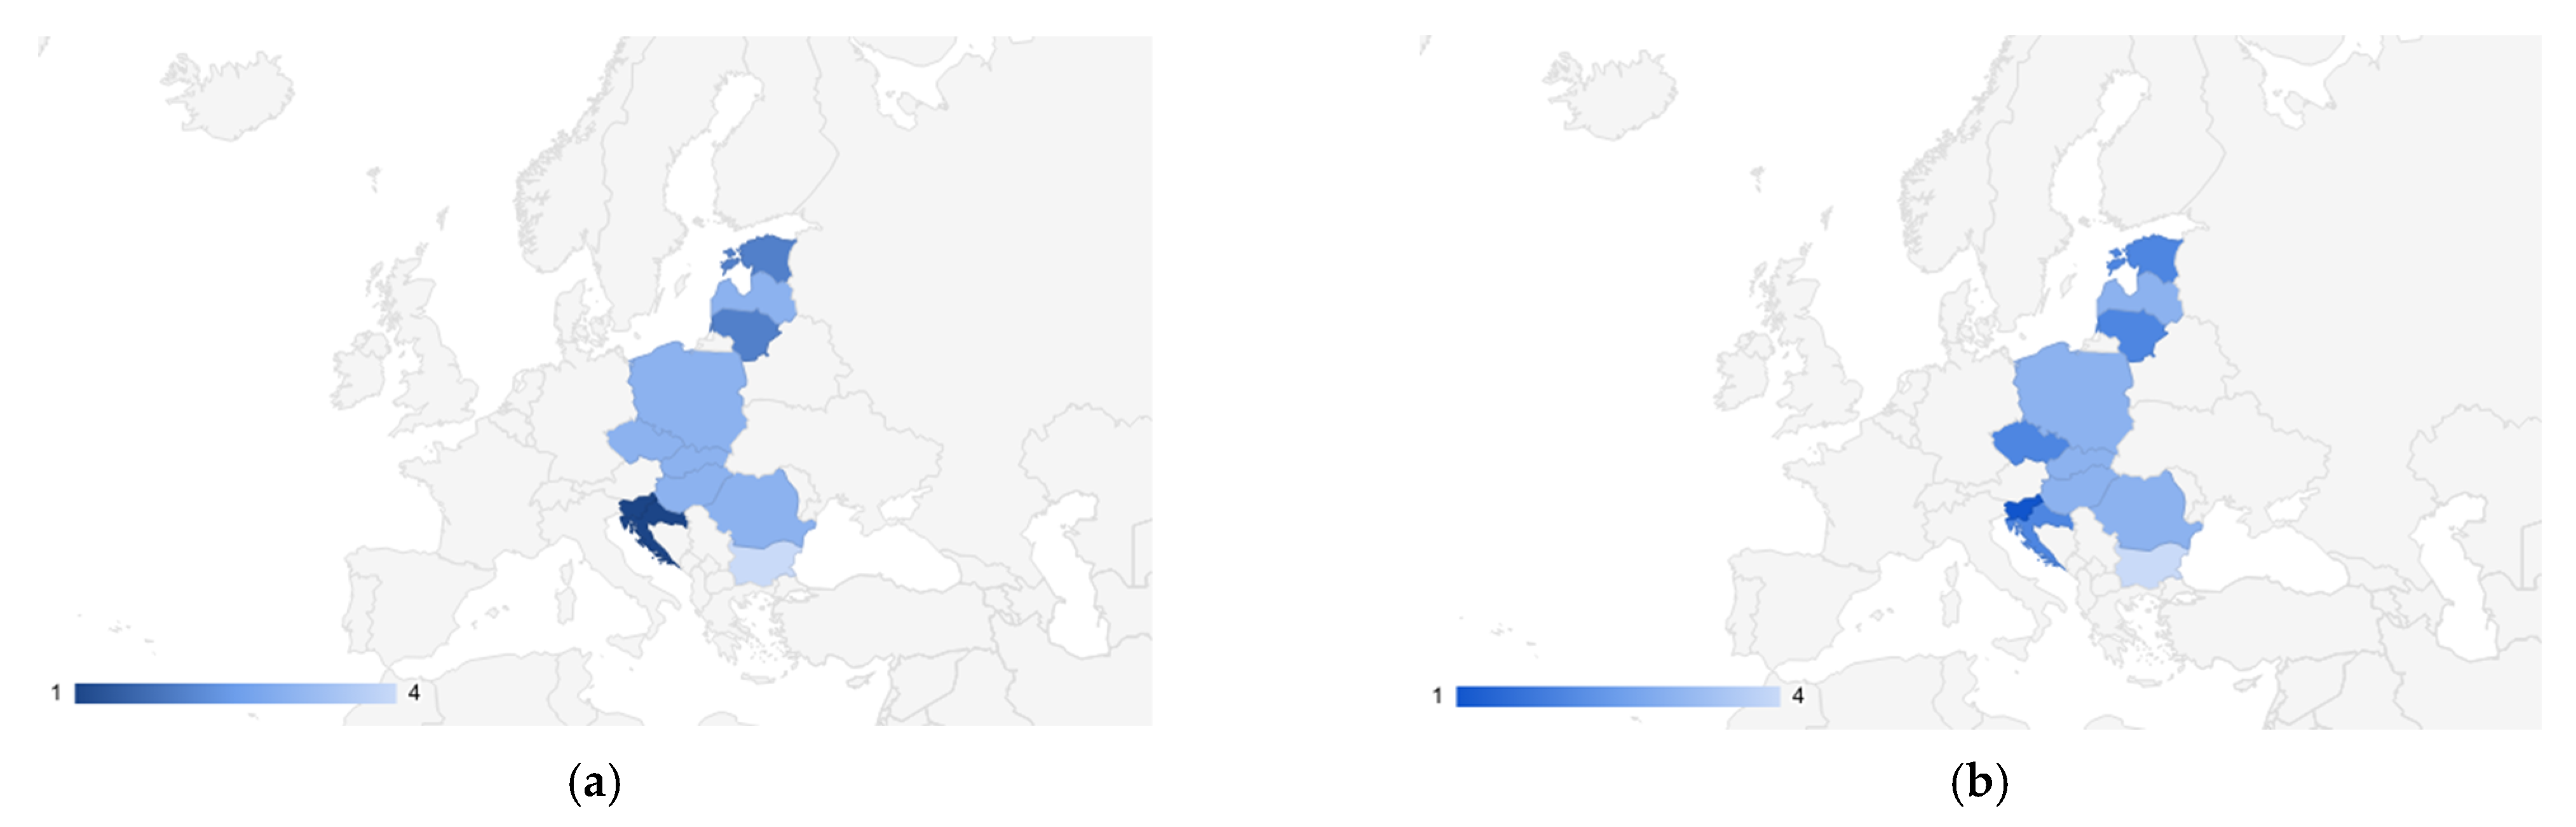
- Class I—high level
- Class II—average level
- Class III—low level
- Class IV—very low level
6. Discussion and Conclusions
Author Contributions
Funding
Institutional Review Board Statement
Informed Consent Statement
Data Availability Statement
Conflicts of Interest
References
- Frank, A.G.; Mendes, G.; Ayala, N.F.; Ghezzi, A. Servitization and Industry 4.0 convergence in the digital transformation of product firms: A business model innovation perspective. Technol. Forecast. Soc. Chang. 2019, 141, 341–351. [Google Scholar] [CrossRef]
- Frank, A.G.; Santos Dalenogare, L.; Ayala, N.F. Industry 4.0 technologies: Implementation patterns in manufacturing companies. Int. J. Prod. Econ. 2019, 210, 15–26. [Google Scholar] [CrossRef]
- Parviainen, P.; Tihinen, M.; Kääriäinen, J.; Teppola, S. Tackling the digitalization challenge: How to benefit from digitalization in practice. Int. J. Inf. Syst. Proj. Manag. 2017, 5, 63–77. [Google Scholar] [CrossRef]
- Yang, F.; Gu, S. Industry 4.0, a revolution that requires technology and national strategies. Complex Intell. Syst. 2021, 7, 1311–1325. [Google Scholar] [CrossRef]
- Rachinger, M.; Rauter, R.; Müller, C.; Vorraber, W.; Schirgi, E. Digitalization and its influence on business model innovation. J. Manuf. Technol. Manag. 2019, 30, 143–1160. [Google Scholar] [CrossRef]
- Toktaş-Palut, P. Analyzing the effects of Industry 4.0 technologies and coordination on the sustainability of supply chains. Sustain. Prod. Consum. 2022, 30, 341–358. [Google Scholar] [CrossRef]
- Lee, J.; Bagheri, B.; Kao, H.A. A cyber-physical systems architecture for industry 4.0-based manufacturing systems. Manuf. Lett. 2015, 3, 18–23. [Google Scholar] [CrossRef]
- Babiceanu, R.F.; Seker, R. Big Data and virtualization for manufacturing cyber-physical systems: A survey of the current status and future outlook. Comput. Ind. 2016, 81, 128–137. [Google Scholar] [CrossRef]
- Dalenogare, L.S.; Benitez, G.B.; Ayala, N.F.; Frank, A.G. The expected contribution of Industry 4.0 technologies for industrial performance. Int. J. Prod. Econ. 2018, 204, 383–394. [Google Scholar] [CrossRef]
- Samara, E.; Andronikidis, A.; Komninos, N.; Bakouros, Y.; Katsoras, E. The Role of Digital Technologies for Regional Development: A System Dynamics Analysis. J. Knowl. Econ. 2022, 1–23. [Google Scholar] [CrossRef]
- Zhang, W.; Zhao, S.; Wan, X.; Yao, Y. Study on the effect of digital economy on high-quality economic development in China. PLoS ONE 2021, 16, e0257365. [Google Scholar] [CrossRef]
- European Broadband: Investing in Digitally Driven Growth. 2013. Available online: https://eur-lex.europa.eu/legal-content/EN/TXT/HTML/?uri=LEGISSUM:si0017&from=EN (accessed on 20 February 2022).
- Towards a Thriving Data-Driven Economy. 2014. Available online: http://eur-lex.europa.eu/legal-content/EN/TXT/?uri=COM%3A2014%3A0442%3AFIN (accessed on 20 February 2022).
- Building a European Data Economy. 2017. Available online: https://eur-lex.europa.eu/legal-content/EN/TXT/?qid=1521790097276&uri=CELEX:52017DC0009 (accessed on 20 February 2022).
- The Age of Artificial Intelligence: Towards a European Strategy for Human-Centric Machines. 2018. Available online: https://ec.europa.eu/jrc/communities/en/node/1286/document/age-artificial-intelligence-towards-european-strategy-human-centric-machines (accessed on 20 February 2022).
- The Digital Europe Programme. 2021. Available online: https://digital-strategy.ec.europa.eu/en/activities/digital-programme (accessed on 20 February 2022).
- Eurostat Database. 2021. Available online: https://ec.europa.eu/eurostat/web/main/data/database (accessed on 20 February 2022).
- Mubarak, M.; Petraite, M. Industry 4.0 technologies, digital trust and technological orientation: What matters in open innovation? Technol. Forecast. Soc. Change 2020, 161, 120332. [Google Scholar] [CrossRef]
- Pyka, A.; Andersen, E.S. Introduction: Long term economic development: Demand, finance, organization, policy and innovation in a schumpeterian perspective. J. Evol. Econ. 2012, 22, 621–625. [Google Scholar] [CrossRef] [Green Version]
- Solow, R. A contribution to the theory of economic growth. Q. J. Econ. 1956, 70, 65. [Google Scholar] [CrossRef]
- Hahn, F.H. Neoclassical growth theory. In Economic Growth. The New Palgrave Economics Collection; Durlauf, S.N., Blume, L.E., Eds.; Palgrave Macmillan: London, UK, 2010. [Google Scholar] [CrossRef]
- Di Bona, G.; Cesarotti, V.; Arcese, G.; Gallo, T. Implementation of Industry 4.0 technology: New opportunities and challenges for maintenance strategy. Procedia Comput. Sci. 2021, 180, 424–429. [Google Scholar] [CrossRef]
- Urbinati, A.; Chiaroni, C.; Chiesa, V.; Frattini, F. The role of digital technologies in open innovation processes: An exploratory multiple case study analysis. R&D Manag. 2020, 50, 136–160. [Google Scholar]
- Chesbrough, H. To recover faster from COVID-19, open up: Managerial implications from an open innovation perspective. Indus. Market. Manag. 2020, 88, 410–413. [Google Scholar] [CrossRef]
- Weking, J.; Stöcker, M.; Kowalkiewicz, M.; Böhm, B.; Krcmar, H. Leveraging industry 4.0—A business model pattern framework. Int. J. Prod. Econ. 2020, 225, 107588. [Google Scholar] [CrossRef]
- Rüßmann, M.; Lorenz, M.; Gerbert, P.; Waldner, M.; Justus, J.; Engel, P.; Harnisch, M. Industry 4.0: The future of productivity and growth in manufacturing industries. Boston Consult. Group 2015, 9, 54–89. [Google Scholar]
- Törngren, M.; Onori, M. Current status and advancement of cyber-physical systems in manufacturing. J. Manuf. Syst. 2015, 37, 517–527. [Google Scholar]
- Brettel, M.; Friederichsen, N.; Keller, M.; Rosenberg, M. How virtualization, decentralization and network building change the manufacturing Landscape. Int. J. Mech. Ind. Sci. Eng. 2014, 8, 37–44. [Google Scholar]
- Gilchrist, A. Industry 4.0: The Industrial Internet of Things; Apress: Berkeley, CA, USA, 2016. [Google Scholar]
- Büchi, G.; Cugno, M.; Castagnoli, R. Smart factory performance and Industry 4.0. Technol. Forecast. Soc. Change 2020, 150, 119790. [Google Scholar] [CrossRef]
- Nagy, J.; Oláh, J.; Erdei, E.; Máté, D.; Popp, J. The Role and Impact of Industry 4.0 and the Internet of Things on the Business Strategy of the Value Chain—The Case of Hungary. Sustainability 2018, 10, 3491. [Google Scholar] [CrossRef] [Green Version]
- Kiel, D.; Arnold, C.; Collisi, M.; Voigt, K. The impact of the industrial internet of things on established business models. In Proceedings of the 25th International Association for Management of Technology (IAMOT) Conference, Orlando, FL, USA, 15–19 May 2016; pp. 673–695. [Google Scholar]
- Weller, C.; Kleer, R.; Piller, F.T. Economic implications of 3D printing: Market structure models in light of additive manufacturing revisited. Int. J. Prod. Econ. 2015, 164, 43–56. [Google Scholar] [CrossRef]
- Yu, F.; Schweisfurth, T. Industry 4.0 technology implementation in SMEs—A survey in the Danish-German border region. Int. J. Innov. Stud. 2020, 4, 76–84. [Google Scholar] [CrossRef]
- Tortora, A.; Alfano, M.; Di Pasquale, V.; Iannone, R.; Pianese, C. A survey study on Industry 4.0 readiness level of Italian small and medium enterprises. Procedia Comput. Sci. 2021, 180, 744–753. [Google Scholar] [CrossRef]
- Raj, A.; Dwivedi, G.; Sharma, A.; Lopes de Sousa Jabbour, A.; Rajak, S. Barriers to the adoption of industry 4.0 technologies in the manufacturing sector: An inter-country comparative perspective. Int. J. Prod. Econ. 2020, 224, 107546. [Google Scholar] [CrossRef]
- Huang, C.-J.; Talla Chicoma, E.D.; Huang, Y.-H. Evaluating the Factors that are Affecting the Implementation of Industry 4.0 Technologies in Manufacturing MSMEs, the Case of Peru. Processes 2019, 7, 161. [Google Scholar] [CrossRef] [Green Version]
- Ingaldi, M.; Ulewicz, R. Problems with the Implementation of Industry 4.0 in Enterprises from the SME Sector. Sustainability 2020, 12, 217. [Google Scholar] [CrossRef] [Green Version]
- Hizam-Hanafiah, M.; Soomro, M.A. The Situation of Technology Companies in Industry 4.0 and the Open Innovation. J. Open Innov. Technol. Mark. Complex. 2021, 7, 34. [Google Scholar] [CrossRef]
- González, A.; Quiñonero, D.; Vega, S. Assessment of the Degree of Implementation of Industry 4.0 Technologies: Case Study of Murcia Region in Southeast Spain. Eng. Econ. 2021, 32, 422–432. [Google Scholar] [CrossRef]
- Schumacher, A.; Erol, S.; Sihn, W. A maturity approach for assessing Industry 4.0 readiness and maturity of manufacturing enterprises. Procedia Cirp 2016, 52, 161–166. [Google Scholar] [CrossRef]
- Pacchini, A.P.T.; Lucatoa, W.C.; Facchini, F.; Mummolo, G. The degree of readiness for the implementation of Industry 4.0. Comput. Ind. 2019, 113, 103125. [Google Scholar] [CrossRef]
- Kljajić Borštnar, M.; Pucihar, A. Multi-Attribute Assessment of Digital Maturity of SMEs. Electronics 2021, 10, 885. [Google Scholar] [CrossRef]
- Akdil, K.Y.; Ustundag, A.; Cevikcan, E. Maturity and Readiness Model for Industry 4.0 Strategy. In Industry 4.0: Managing the Digital Transformation. Springer Series in Advanced Manufacturing; Springer: Cham, Switzerland, 2018. [Google Scholar]
- Lichtblau, K.; Stich, V.; Bertenrath, R.; Blum, M.; Bleider, M.; Millack, A.; Schmitt, K.; Schmitz, E.; Schröter, M. IMPULS—Industrie 4.0—Readiness, Impuls-Stiftung des VDMA, Aachen-Köln. 2015. Available online: https://www.industrie40-readiness.de/?lang=en (accessed on 20 February 2022).
- PwC. Price Water House Coopers: The Industry 4.0/Digital Operations Self Assessment 2016. Available online: https://i40-self-assessment.pwc.de/i40/landing/ (accessed on 20 February 2022).
- Rockwellautomation: The Connected Enterprise Maturity Model. 2014. Available online: https://literature.rockwellautomation.com/idc/groups/literature/documents/wp/cie-wp002_-en-p.pdf (accessed on 20 February 2022).
- Leyh, C.; Schäffer, T.; Bley, K.; Forstenhäusler, S. SIMMI 4.0—A Maturity Model for Classifying the Enterprise-wide IT and Software. Landscape Focusing on Industry 4.0. In Proceedings of the Federated Conference on Computer Science and Information Systems, Sofia, Bulgaria, 6–9 September 2016; Volume 8, pp. 1297–1302. [Google Scholar]
- Zoubek, M.; Simon, M. A framework for a logistics 4.0 maturity model with a specification for internal logistics. MM Sci. J. 2021, 1, 4264–4274. [Google Scholar] [CrossRef]
- Lee, J.; Jun, S.; Chang, T.-W.; Park, J. A Smartness Assessment Framework for Smart Factories Using Analytic Network Process. Sustainability 2017, 9, 794. [Google Scholar] [CrossRef] [Green Version]
- Diakoulaki, D.; Mavrotas, G.; Papayannakis, L.; Determining, L. Objective weights in multiple criteria problems: The CRITIC method. Comput. Oper. Res. 1995, 22, 763–770. [Google Scholar] [CrossRef]
- Aznar Bellver, J.; Cervelló, R.R.; García, F.F. Spanish savings banks and their future transformation into private capital banks. Determining their value by a multicriteria valuation methodology. Eur. J. Econ. Finance Admin. Sci. 2011, 35, 155–164. [Google Scholar]
- Opricovic, S. Multi-criteria Optimization of Civil Engineering Systems. Fac. Civ. Eng. Belgrade 1998, 2, 5–21. [Google Scholar]
- Abdi, H.; Salkind, N.J. Encyclopedia of Measurement and Statistics. Thousand Oaks (CA) Sage 2007, 7, 131–153. [Google Scholar]
- Pereira, C.S.; Durão, N.; Moreira, F.; Veloso, B. The Importance of Digital Transformation in International Business. Sustainability 2022, 14, 834. [Google Scholar] [CrossRef]
- Eller, R.; Alford, P.; Kallmünzer, A.; Peters, M. Antecedents, consequences, and challenges of small and medium-sized enterprise digitalization. J. Bus. Res. 2020, 112, 119–127. [Google Scholar] [CrossRef]
- Jackman, J.A.; Gentile, D.A.; Cho, N.J.; Park, Y. Addressing the digital skills gap for future education. Nat. Hum. Behav. 2021, 5, 542–545. [Google Scholar] [CrossRef] [PubMed]
- Novak, M.; Purta, T.; Marciniak, T.; Ignatowicz, K.; Rozenbaum, K.; Yearwood, K. The Rise of Digital Challengers. How Digitization Can Become the Next Growth Engine for Central and Eastern Europe; Digital/McKinsey, 2018. Available online: https://digitalchallengers.mckinsey.com/ (accessed on 20 February 2022).
- Habibi, F.; Zabardast, M.A. Digitalization, education and economic growth: A comparative analysis of Middle East and OECD countries. Technol. Soc. 2020, 63, 101370. [Google Scholar] [CrossRef]
- Rupeika-Apoga, R.; Bule, L.; Petrovska, K. Digital Transformation of Small and Medium Enterprises: Aspects of Public Support. J. Risk Financial Manag. 2022, 15, 45. [Google Scholar] [CrossRef]
- Stalmachova, K.; Chinoracky, R.; Strenitzerova, M. Changes in Business Models Caused by Digital Transformation and the COVID-19 Pandemic and Possibilities of Their Measurement—Case Study. Sustainability 2022, 14, 127. [Google Scholar] [CrossRef]
- Bikse, V.; Lusena-Ezera, I.; Rivza, P.; Rivza, B. The Development of Digital Transformation and Relevant Competencies for Employees in the Context of the Impact of the COVID-19 Pandemic in Latvia. Sustainability 2021, 13, 9233. [Google Scholar] [CrossRef]
- Hulla, M.; Herstätter, P.; Wolf, M.; Ramsauer, C. Towards digitalization in production in SMEs—A qualitative study of challenges, competencies and requirements for trainings. Procedia CIRP 2021, 104, 887–892. [Google Scholar] [CrossRef]
- Ober, J.; Kochmańska, A. Adaptation of Innovations in the IT Industry in Poland: The Impact of Selected Internal Communication Factors. Sustainability 2022, 14, 140. [Google Scholar] [CrossRef]
- Kuzior, A.; Kettler, K.; Rąb, Ł. Digitalization of Work and Human Resources Processes as a Way to Create a Sustainable and Ethical Organization. Energies 2022, 15, 172. [Google Scholar] [CrossRef]
- Ober, J.; Karwot, J. Pro-Ecological Behavior: Empirical Analysis on the Example of Polish Consumers. Energies 2022, 15, 1690. [Google Scholar] [CrossRef]
- Nagy, H. A Role for the State in the Digital Age. J. Innov. Entrep. 2018, 7, 5. Available online: https://innovation-entrepreneurship.springeropen.com/articles/10.1186/s13731-018-0086-3 (accessed on 1 July 2022).


| Assessment Method/Model | Assessment Dimensions | Assessment Levels | Source |
|---|---|---|---|
| A maturity model for Industry 4.0 Readiness | The model includes 9 dimensions: Strategy, Leadership, Customer, Products, Operations, Culture, People, Governance, and Technology. Each dimension is assigned a weight. | The model includes Likert scale; where 1 = “not important” and 4 = “very important” | [41] |
| The Degree of readiness for the implementation of Industry 4.0 | The model includes 8 dimensions: Internet of Things, Big Data, Cloud Computing, Cyber Physical Systems, Collaborative Robots, Additive Manufacturing, Augmented Reality, Artificial Intelligence. | The model includes 6-point assessment scale: from Embryonic to Ready; where: 0 ≤ Digital Readiness < 10 Embryonic 10 ≤ DR < 25 Initial 25 ≤ DR < 50 Primary 50 ≤ DR < 75 Intermediate 75 ≤ DR < 90 Advanced 90 ≤ DR ≤ 100 Ready | [42] |
| The multi-attribute model | The model includes 7 dimensions: digital technology, management, organizational culture, human resources, strategy, digital business model, role of informatics. | The model includes 4 assessment levels: Initial, Advanced, Lagging behind, Digital Winner | [43] |
| Maturity and Readiness Model for Industry 4.0 | The model includes 3 dimensions of assessment: Smart products and services, Smart business processes, Strategy and Organization | The model includes 4 assessment levels: Absence, Existence, Survival, Maturity | [44] |
| IMPULS—Industry 4.0 Readiness | The model includes 6 dimensions of assessment:
| The model includes 6 assessment levels: Level 0: Outsider; Level 1: Beginner; Level 2: Intermediate; Level 3: Experienced; Level 4: Expert; Level 5: Top performer. | [45] |
| Industry 4.0/Digital Operations Self-Assessment | The model includes 4 stages of assessment and 7 dimensions. The stages of assessment include: Digital novice, Vertical integrator, Horizontal collaborator, Digital champion. Assessment dimensions are: Digital business models and customer access, Digitization of product and service offerings, Digitization and integration of vertical and horizontal value chains, Data and Analytics as core capability, Agile IT architecture, Compliance, security, legal and tax, Organization, employees and digital culture. | The model includes 4 assessment levels: Digital Novice, Vertical Integrator, Horizontal Integrator, Digital Champion | [46] |
| The Connected Enterprise Maturity Model | The model includes 5 stages and 4 evaluation dimensions focused on emerging technologies. The stages of assessment include: 1. Assessment; 2. Secure and upgraded network and controls; 3. Defined and organized working data capital; 4. Analytics; 5. Collaboration. | - | [47] |
| SIMMI 4.0 | The SIMMI 4.0 model includes 3 assessment dimensions: Vertical Integration, Horizontal Integration, Cross-sectional Technology Criteria. | The model includes 5 assessment levels: basic digitization; cross-sectional digitization; horizontal and vertical digitization; full digitization; and optimized full digitization | [48] |
| The Logistics 4.0 Maturity Model | The model makes it possible to assess the maturity level of a logistics company in 3 dimensions: Manipulation, Storage, Supply, Packaging, Material identification. | The model includes 6 assessment levels: from 0 to 5. | [49] |
| A Smartness Assessment Framework for Smart Factories Using Analytic Network Process | Model allows for the evaluation of a company’s level of maturity in 4 dimensions and in 10 subcriteria. These dimensions include: Leadership, Process, System and Automation, Performance) | The model includes 5 assessment levels: from 1 (Checking) to 5 (Autonomy). | [50] |
| Countries | GDP, Million Euro (2021) | GDP per Capita Euro (2021) | Population | Area, km2 |
|---|---|---|---|---|
| Bulgaria | 67,872.1 | 9,850 | 6,951,482 | 110,994 |
| Czech Republic | 238,714.2 | 22,320 | 10,693,939 | 78,866 |
| Estonia | 30,660.1 | 23,060 | 1,328,976 | 45,339 |
| Croatia | 57,310.2 | 14,740 | 4,058,165 | 56,594 |
| Latvia | 32,922.5 | 17,480 | 1,907,675 | 64,589 |
| Lithuania | 55,383.1 | 19,760 | 2,794,090 | 65,300 |
| Hungary | 154,124.4 | 15,870 | 9,769,526 | 93,030 |
| Poland | 570,206.6 | 14,940 | 37,958,138 | 312,685 |
| Romania | 240,154.0 | 12,510 | 19,328,838 | 238,397 |
| Slovenia | 52,020.2 | 24,680 | 2,095,861 | 20,273 |
| Slovakia | 97,122.5 | 17,820 | 5,457,873 | 49,036 |
| Categories | Technologies/Skills | Marking |
|---|---|---|
| Artificial intelligence | Enterprises that use AI technologies | I1 |
| Internet of Things | Use of interconnected devices or systems that can be monitored or remotely controlled via the Internet | I2 |
| Additive manufacturing | 3D printing | I3 |
| Robotization | Use of robots (industrial or service) | I4 |
| Big data | Analysis of big data | I5 |
| Cloud computing | Cloud computing | I6 |
| Integration with customers and/or suppliers | eInvoices | I7 |
| Integration of internal processes | ERP software package | I8 |
| Cybersecurity | ICT security measure used: virtual private network | I9 |
| Internet connection | The maximum contracted download speed of the fastest fixed line Internet connection is at least 100 Mb/s but less than 500 Mb/s | I10 |
| ICT skills | training—ICT skills | I11 |
| Indicator | Average | Median | Min | Max | Variance | Standard Deviation | Coefficient of Variation | Skewness | Kurtosis |
|---|---|---|---|---|---|---|---|---|---|
| I1 | 3.73 | 3.00 | 1.00 | 9.00 | 2.49 | 66.90 | 1.51 | 1.43 | 3.73 |
| I2 | 22.00 | 21.00 | 9.00 | 46.00 | 9.76 | 44.35 | 1.42 | 3.31 | 22.00 |
| I3 | 2.82 | 3.00 | 1.00 | 5.00 | 1.08 | 38.28 | 0.43 | 0.83 | 2.82 |
| I4 | 3.73 | 4.00 | 2.00 | 6.00 | 1.27 | 34.13 | 0.26 | −0.62 | 3.73 |
| I5 | 6.00 | 5.00 | 4.00 | 11.00 | 2.14 | 35.75 | 1.34 | 1.85 | 6.00 |
| I6 | 29.91 | 29.00 | 10.00 | 55.00 | 13.02 | 43.53 | 0.29 | 0.10 | 29.91 |
| I7 | 24.00 | 14.00 | 9.00 | 61.00 | 19.42 | 80.92 | 1.27 | 0.08 | 24.00 |
| I8 | 23.64 | 24.00 | 15.00 | 38.00 | 7.75 | 32.79 | 0.55 | −0.78 | 23.64 |
| I9 | 25.64 | 24.00 | 12.00 | 41.00 | 8.56 | 33.39 | 0.24 | −0.53 | 25.64 |
| I10 | 25.36 | 24.00 | 15.00 | 40.00 | 7.30 | 28.77 | 0.66 | 0.24 | 25.36 |
| I11 | 12.45 | 13.00 | 4.00 | 21.00 | 5.24 | 42.08 | −0.07 | −0.40 | 12.45 |
| Indicator | Average | Median | Min | Max | Variance | Standard Deviation | Coefficient of Variation | Skewness | Kurtosis |
|---|---|---|---|---|---|---|---|---|---|
| I1 | 7.36 | 7.00 | 2.00 | 20.00 | 4.74 | 64.35 | 2.07 | 5.50 | 7.36 |
| I2 | 34.09 | 33.00 | 14.00 | 61.00 | 12.94 | 37.96 | 0.42 | 0.82 | 34.09 |
| I3 | 5.36 | 5.00 | 3.00 | 10.00 | 2.50 | 46.63 | 1.23 | 0.62 | 5.36 |
| I4 | 11.45 | 10.00 | 5.00 | 19.00 | 4.08 | 35.65 | 0.49 | −0.08 | 11.45 |
| I5 | 10.91 | 10.00 | 6.00 | 18.00 | 3.36 | 30.80 | 0.62 | 0.76 | 10.91 |
| I6 | 44.36 | 47.00 | 18.00 | 70.00 | 14.28 | 32.18 | −0.39 | 0.87 | 44.36 |
| I7 | 32.55 | 23.00 | 14.00 | 67.00 | 19.66 | 60.42 | 1.02 | −0.74 | 32.55 |
| I8 | 51.09 | 50.00 | 21.00 | 66.00 | 13.92 | 27.25 | −0.88 | 0.59 | 51.09 |
| I9 | 52.45 | 53.00 | 24.00 | 76.00 | 14.27 | 27.21 | −0.43 | 0.43 | 52.45 |
| I10 | 31.36 | 32.00 | 21.00 | 46.00 | 8.15 | 25.99 | 0.31 | −0.74 | 31.36 |
| I11 | 29.82 | 33.00 | 10.00 | 44.00 | 10.72 | 35.96 | −0.78 | −0.05 | 29.82 |
| Indicator | Average | Median | Min | Max | Variance | Standard Deviation | Coefficient of Variation | Skewness | Kurtosis |
|---|---|---|---|---|---|---|---|---|---|
| I1 | 19.09 | 19.00 | 7.00 | 36.00 | 7.29 | 38.17 | 0.92 | 2.69 | 19.09 |
| I2 | 48.09 | 47.00 | 24.00 | 78.00 | 16.78 | 34.90 | 0.26 | −0.50 | 48.09 |
| I3 | 13.09 | 8.00 | 6.00 | 26.00 | 7.52 | 57.41 | 0.78 | −0.91 | 13.09 |
| I4 | 25.27 | 23.00 | 13.00 | 41.00 | 9.09 | 35.97 | 0.40 | −0.92 | 25.27 |
| I5 | 22.55 | 25.00 | 12.00 | 35.00 | 7.23 | 32.07 | 0.13 | −0.97 | 22.55 |
| I6 | 64.36 | 68.00 | 33.00 | 81.00 | 14.42 | 22.41 | −1.13 | 1.22 | 64.36 |
| I7 | 47.09 | 40.00 | 24.00 | 83.00 | 20.64 | 43.82 | 0.97 | −0.48 | 47.09 |
| I8 | 77.91 | 80.00 | 39.00 | 97.00 | 16.95 | 21.76 | −1.16 | 1.57 | 77.91 |
| I9 | 81.91 | 86.00 | 50.00 | 94.00 | 12.61 | 15.39 | −1.80 | 3.80 | 81.91 |
| I10 | 40.36 | 39.00 | 28.00 | 58.00 | 7.75 | 19.20 | 0.94 | 2.15 | 40.36 |
| I11 | 61.36 | 64.00 | 29.00 | 84.00 | 15.71 | 25.59 | −0.90 | 0.89 | 61.36 |
| Indicator | Medium/Small | Large/Medium | Large/Small |
|---|---|---|---|
| I1 | 1.97 | 2.59 | 5.12 |
| I2 | 1.55 | 1.41 | 2.19 |
| I3 | 1.90 | 2.44 | 4.64 |
| I4 | 3.07 | 2.21 | 6.77 |
| I5 | 1.82 | 2.07 | 3.76 |
| I6 | 1.48 | 1.45 | 2.15 |
| I7 | 1.36 | 1.45 | 1.96 |
| I8 | 2.16 | 1.52 | 3.30 |
| I9 | 2.05 | 1.56 | 3.19 |
| I10 | 1.24 | 1.29 | 1.59 |
| I11 | 2.40 | 2.06 | 4.93 |
| Enterprises | ||||||||||||
|---|---|---|---|---|---|---|---|---|---|---|---|---|
| Small | Small | Small | ||||||||||
| Si+ (Pattern) | Si− (Anti-Pattern) | Pi TOPSIS Measure | Rank | Si+ (Pattern) | Si− (Anti-Pattern) | Pi TOPSIS Measure | Rank | Si+ (Pattern) | Si− (Anti-Pattern) | Pi TOPSIS Measure | Rank | |
| Bulgaria | 0.1162 | 0.0275 | 0.191 | 10 | 0.1012 | 0.0243 | 0.194 | 10 | 0.0859 | 0.0195 | 0.185 | 10 |
| Czech Republic | 0.0978 | 0.0590 | 0.376 | 5 | 0.0738 | 0.0655 | 0.470 | 4 | 0.0401 | 0.0740 | 0.648 | 2 |
| Estonia | 0.0766 | 0.0929 | 0.548 | 3 | 0.0708 | 0.0751 | 0.515 | 3 | 0.0635 | 0.0583 | 0.479 | 4 |
| Croatia | 0.0574 | 0.0922 | 0.616 | 2 | 0.0597 | 0.0718 | 0.546 | 2 | 0.0634 | 0.0495 | 0.439 | 6 |
| Latvia | 0.1053 | 0.0387 | 0.269 | 7 | 0.0819 | 0.0441 | 0.350 | 7 | 0.0732 | 0.0457 | 0.384 | 7 |
| Lithuania | 0.0854 | 0.0538 | 0.387 | 4 | 0.0774 | 0.0485 | 0.385 | 5 | 0.0749 | 0.0371 | 0.331 | 9 |
| Hungary | 0.1082 | 0.0316 | 0.226 | 9 | 0.0943 | 0.0331 | 0.260 | 9 | 0.0661 | 0.0388 | 0.370 | 8 |
| Poland | 0.1089 | 0.0356 | 0.246 | 8 | 0.0839 | 0.0443 | 0.345 | 8 | 0.0493 | 0.0540 | 0.523 | 3 |
| Romania | 0.1226 | 0.0270 | 0.181 | 11 | 0.1104 | 0.0237 | 0.177 | 11 | 0.0965 | 0.0093 | 0.088 | 11 |
| Slovenia | 0.0393 | 0.1136 | 0.743 | 1 | 0.0251 | 0.1077 | 0.811 | 1 | 0.0142 | 0.0934 | 0.868 | 1 |
| Slovakia | 0.0983 | 0.0437 | 0.308 | 6 | 0.0828 | 0.0464 | 0.359 | 6 | 0.0608 | 0.0477 | 0.439 | 5 |
| Enterprises | |||||||||||||||
|---|---|---|---|---|---|---|---|---|---|---|---|---|---|---|---|
| Small | Small | Large | |||||||||||||
| Si | Ri | Qi | 1–Qi | Rank | Si | Ri | Qi | 1–Qi | Rank | Si | Ri | Qi | 1–Qi | Rank | |
| Bulgaria | 0.816 | 0.154 | 0.955 | 0.045 | 11 | 0.794 | 0.128 | 0.937 | 0.063 | 11 | 0.798 | 0.127 | 0.872 | 0.128 | 10 |
| Czech Republic | 0.518 | 0.154 | 0.704 | 0.296 | 5 | 0.423 | 0.116 | 0.582 | 0.418 | 4 | 0.320 | 0.080 | 0.320 | 0.680 | 3 |
| Estonia | 0.528 | 0.091 | 0.255 | 0.745 | 3 | 0.397 | 0.087 | 0.327 | 0.673 | 2 | 0.417 | 0.121 | 0.613 | 0.387 | 5 |
| Croatia | 0.369 | 0.085 | 0.080 | 0.920 | 2 | 0.447 | 0.123 | 0.659 | 0.341 | 7 | 0.488 | 0.121 | 0.655 | 0.345 | 6 |
| Latvia | 0.704 | 0.145 | 0.797 | 0.203 | 7 | 0.597 | 0.106 | 0.623 | 0.377 | 5 | 0.541 | 0.127 | 0.724 | 0.276 | 7 |
| Lithuania | 0.554 | 0.107 | 0.392 | 0.608 | 4 | 0.580 | 0.098 | 0.545 | 0.455 | 3 | 0.582 | 0.127 | 0.748 | 0.252 | 8 |
| Hungary | 0.775 | 0.145 | 0.857 | 0.143 | 9 | 0.693 | 0.123 | 0.828 | 0.172 | 10 | 0.588 | 0.093 | 0.550 | 0.450 | 4 |
| Poland | 0.693 | 0.148 | 0.809 | 0.191 | 8 | 0.562 | 0.113 | 0.658 | 0.342 | 6 | 0.411 | 0.069 | 0.307 | 0.693 | 2 |
| Romania | 0.870 | 0.136 | 0.871 | 0.129 | 10 | 0.885 | 0.106 | 0.822 | 0.178 | 9 | 0.951 | 0.134 | 1.000 | 0.000 | 11 |
| Slovenia | 0.275 | 0.087 | 0.012 | 0.988 | 1 | 0.162 | 0.067 | 0.000 | 1.000 | 1 | 0.086 | 0.048 | 0.000 | 1.000 | 1 |
| Slovakia | 0.671 | 0.139 | 0.726 | 0.274 | 6 | 0.614 | 0.123 | 0.774 | 0.226 | 8 | 0.577 | 0.131 | 0.768 | 0.232 | 9 |
| Enterprises | ||||||
|---|---|---|---|---|---|---|
| Small | Medium | Large | ||||
| Digitalization Index | Rank | Digitalization Index | Rank | Digitalization Index | Rank | |
| Bulgaria | 0.118 | 11 | 0.129 | 11 | 0.157 | 10 |
| Czech Republic | 0.336 | 5 | 0.444 | 3 | 0.664 | 2 |
| Estonia | 0.647 | 3 | 0.594 | 2 | 0.433 | 4 |
| Croatia | 0.768 | 2 | 0.444 | 4 | 0.392 | 6 |
| Latvia | 0.236 | 7 | 0.364 | 6 | 0.330 | 8 |
| Lithuania | 0.498 | 4 | 0.420 | 5 | 0.292 | 9 |
| Hungary | 0.185 | 9 | 0.216 | 9 | 0.410 | 5 |
| Poland | 0.219 | 8 | 0.344 | 7 | 0.608 | 3 |
| Romania | 0.155 | 10 | 0.178 | 10 | 0.044 | 11 |
| Slovenia | 0.866 | 1 | 0.906 | 1 | 0.934 | 1 |
| Slovakia | 0.291 | 6 | 0.293 | 8 | 0.336 | 7 |
| CEE-11 Average | 0.393 | 0.394 | 0.418 | |||
| Size of Enterprises | Level of Digitalization | |||
|---|---|---|---|---|
| Advanced | Average | Low | Very Low | |
| Small | Slovenia, Croatia, | Estonia, Lithuania, | Czech Republic, Latvia, Hungary, Poland, Romania, Slovakia | Bulgaria |
| Medium | Slovenia | Estonia, Croatia, Czech Republic, Lithuania, | Latvia, Hungary, Poland, Romania, Slovakia | Bulgaria |
| Large | Slovenia, Czech Republic, | Estonia, Poland | Croatia, Latvia, Lithuania, Hungary, Slovakia | Bulgaria, Romania |
| Tested Parameters | Spearman’s rank Correlation Coefficient | |||||
|---|---|---|---|---|---|---|
| Small Enterprises | p | Medium Enterprises | p | Large Enterprises | p | |
| Value of GDP | −0.573 | 0.066 | −0.556 | 0.076 | −0.027 | 0.937 |
| Value of GDP of GDP per capita | 0.727 | 0.011 | 0.793 | 0.004 | 0.645 | 0.032 |
| Gross domestic expenditure on R&D, % GDP | 0.609 | 0.047 | 0.711 | 0.014 | 0.927 | 0.000 |
| Tested Parameters | Kendall Coefficient | |||||
|---|---|---|---|---|---|---|
| Small Enterprises | p | Medium Enterprises | p | Large Enterprises | p | |
| Value of GDP | −0.382 | 0.102 | −0.367 | 0.116 | −0.018 | 0.938 |
| Value of GDP of GDP per capita | 0.673 | 0.004 | 0.697 | 0.003 | 0.455 | 0.052 |
| Gross domestic expenditure on R&D, % GDP | 0.455 | 0.052 | 0.550 | 0.018 | 0.818 | 0.000 |
Publisher’s Note: MDPI stays neutral with regard to jurisdictional claims in published maps and institutional affiliations. |
© 2022 by the authors. Licensee MDPI, Basel, Switzerland. This article is an open access article distributed under the terms and conditions of the Creative Commons Attribution (CC BY) license (https://creativecommons.org/licenses/by/4.0/).
Share and Cite
Brodny, J.; Tutak, M. The Level of Digitization of Small, Medium and Large Enterprises in the Central and Eastern European Countries and Its Relationship with Economic Parameters. J. Open Innov. Technol. Mark. Complex. 2022, 8, 113. https://doi.org/10.3390/joitmc8030113
Brodny J, Tutak M. The Level of Digitization of Small, Medium and Large Enterprises in the Central and Eastern European Countries and Its Relationship with Economic Parameters. Journal of Open Innovation: Technology, Market, and Complexity. 2022; 8(3):113. https://doi.org/10.3390/joitmc8030113
Chicago/Turabian StyleBrodny, Jarosław, and Magdalena Tutak. 2022. "The Level of Digitization of Small, Medium and Large Enterprises in the Central and Eastern European Countries and Its Relationship with Economic Parameters" Journal of Open Innovation: Technology, Market, and Complexity 8, no. 3: 113. https://doi.org/10.3390/joitmc8030113