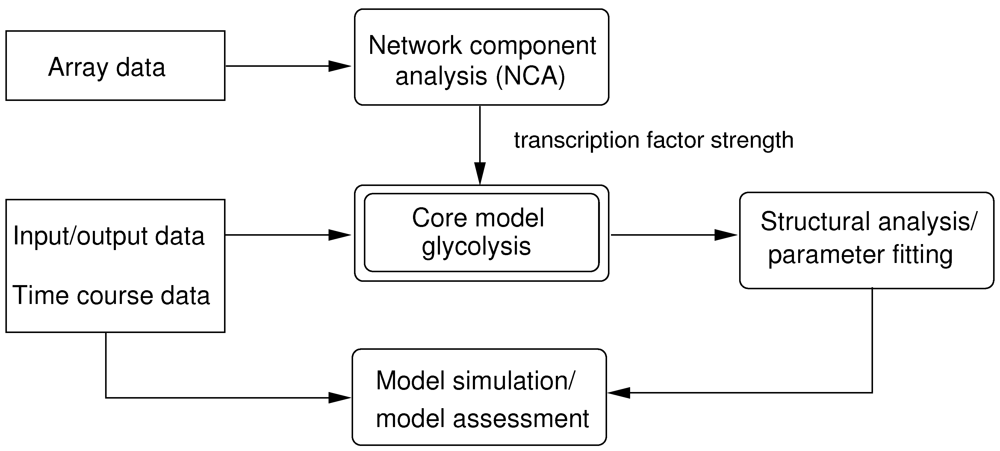
2.1. Structural Analysis of the Glycolysis Core Model
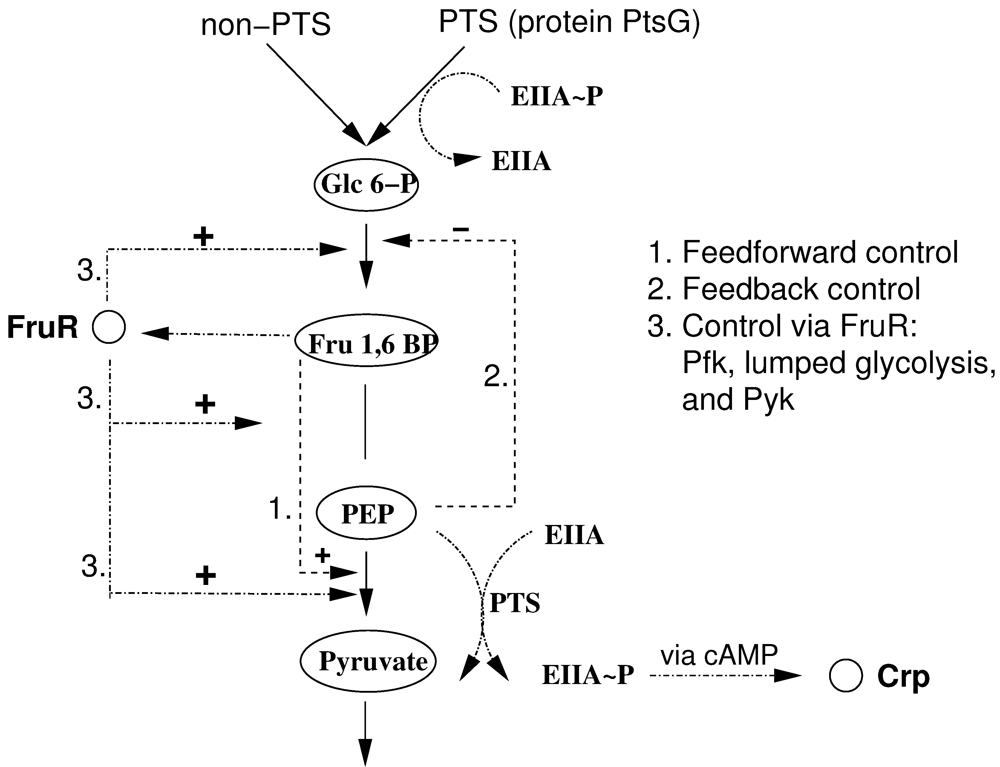
The model describes the steady state behavior of important metabolites of glycolysis in E. coli. Important components and starting points for signalling pathways are fructose-1,6-bisphosphate (ligand for transcription factor FruR), PEP and pyruvate (both determine the degree of phosphorylation of protein EIIA of the PTS). In addition, glucose 6-phosphate is taken into account as entry component into glycolysis.
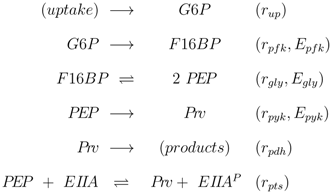
The stoichiometric equations are as follows:
with glucose 6-phosphate
G6
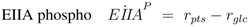
P, phosphoenolpyruvate
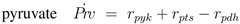
PEP, pyruvate
Prv, and a lumped component of the PTS, enzyme IIA
EIIA;
E stands for the respective enzyme,
r for the rate. The equations consider that a carbohydrate (PTS as well as non-PTS sugars) is fed into glycolysis via glucose-6-phosphate. The carbohydrate is metabolized by a sequence of steps with pyruvate as the final component. In reaction
rgly reversible reaction steps catalyzed by the enzymes fructose bisphosphate aldolase, triose phosphate isomerase, glyceraldehyde-3-phosphate dehydrogenase, phosphoglycerate kinase, phophoglycerate mutase and enolase are lumped (
Egly).
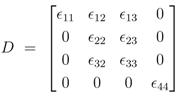
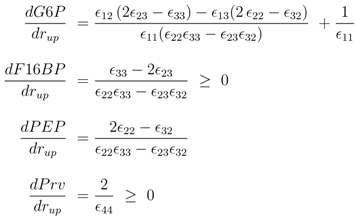
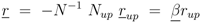
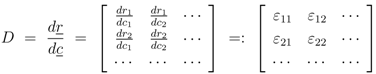
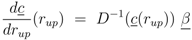
First the influence of regulation of gene expression and of allosteric control is studied. Based on the approach described in Material and Methods, the derivatives
![Metabolites 02 00844 i056]()
for the metabolites are calculated. Matrix
D has the following entries:
where the rows consider
rpfk,
rgly,
rpyk, and
rpdh, and the columns consider
G6
P,
F16
BP,
PEP, and
Prv. While in a previous study [
4] the conditions to guarantee a negative slope for the phosphorylated form of the PTS protein EIIA were derived, the focus is now on the slope of the individual metabolites in dependence of allosteric control, genetic control, and reversibility.
Table 1 summarizes all types of control and relate it to the entries in
D. All other
ε values,
ε11 and
ε33, are based on mass action and have positive values.
Table 1.
Control schemes during growth on carbohydrates. Note that fructose-1,6-bisphosphate acts directly as allostericeffector on pyruvatekinase as well as via FruR. 1 Activation should be seen as double repression: fructose-1,6-bisphosphate inhibits FruR activity; FruR acts as repressor.
| Explanation |
| Allosteric control |
| ε13 < 0 | inhibition of PfkA by PEP |
| ε32(1) > 0 | activation of Pyk by F16BP |
| Genetic control |
| ε12 > 0 | activation1 of PfkA by F16BP |
| ε22 > 0 | activation1 of
rgly by F16BP |
| ε32(2) > 0 | activation1 of Pyk by F16BP |
| Reversibility |
| ε23 < 0 | reversible glycolytic reaction |
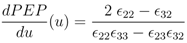
The following derivatives are calculated:
As can be seen immediately for the important metabolites fructose-1,6-bisphosphate and pyruvate, the sign is fixed and positive while the sign of glucose 6-phosphate shows a complex pattern. The sign of PEP only depends on the feedforward activation and could be positive or negative. For a more complete network of central metabolism in
E. coli, all entries of the Jacobian matrix were determined and analyzed [
10]. It turns out that most entries have fixed signs for a given flux distribution with exception of the feedforward loop represented here by
ε32. Matrix
D is related to the inverse of the Jacobian and a similar pattern can also be found here.
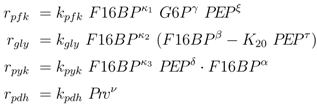
To further explore these equations, a more detailed analysis was done with the following kinetic approximations [
4]:
and the following kinetics for the lumped PTS system:
In many studies, classical saturation kinetics are chosen for the kinetic rate laws. Here, saturation is not explicitly taken into account and kinetic rate laws are approximated with power law exponents (
κi for genetic control, all other exponents for mass action and allosteric control) which are not necessarily integers. Since PEP is involved in signaling, the behavior of PEP is analyzed in more detail. As discussed in [
4], PEP is a highly energetic compound and it is expected that for low growth rates this metabolite should not accumulate. However, based on the analysis of the feedforward loop [
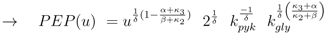
11], a monotonously decreasing behavior is necessary for a robust behavior. To resolve this conflict (a high value of the concentration of PEP is good for robustness, a low value is expected from physiological considerations), the behavior of PEP depending on the uptake rate is studied in more detail. Here, we found that a strict local maximum for PEP depending on the input flux
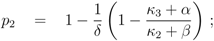
rup could be obtained under the following conditions:
Equation (6) poses a constraint on the reaction order and the influence from transcriptional control. In order to avoid high values of PEP for small growth rates, the condition could be verified with the results of NCA and parameter estimation for the other parameters. The constraint can be interpreted as follows: the strength of control on pyruvate kinase (
κ3 and
α) should be larger than the strength of control on the lumped glycolytic reaction
rgly (
κ2 and
β). The second constraint requires that the latter one is reversible. For a detailed calculation, see Appendix.
2.2. Influence of Transcription Factors on Gene Expression
To determine the κi coefficients for the model, NCA was applied with three data sets. In addition, transcription factor activities could be determined as well and compared with biological knowledge on the system.
The model is similar to the previous one [
3]: 32 transcriptional units are used and three transcription factors are considered (Crp, ArcA, and FruR). Although other transcription factors such as Fnr, SoxS or PdhR influence some of the genes, they are not considered explicitly here, since they are not involved in sensing metabolic fluxes in glycolysis. The number of time points is 35 (16 from growth on glucose and lactose [
12], 18 from the glucose pulse experiment in this study, and 1 from growth on acetate [
13]). Although strains that are used in the cited studies are different, a comparison of the growth behavior for the strains used in [
12,
14] reveals consistency with respect to the growth rate. Experiments in this study were performed with the same strain as in [
14]. Since from [
13] only one data point was taken into account, the entire data set can be regarded as consitent.
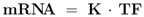
As described above, elements of the coupling matrix
K and transcription factor activities
TF are determined with NCA.
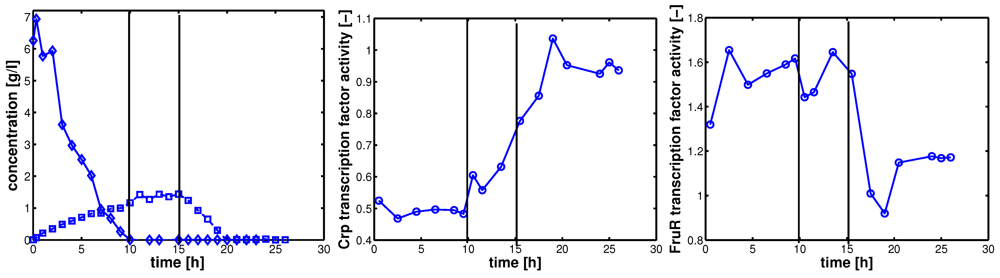
Figure 3 shows the results for strain LJ110 after a glucose pulse. In a continuous culture,
E. coli grows under glucose limited conditions. At time point zero, glucose was pulsed and the dynamics of the extracellular components and biomass was followed. Plot A shows the time course for glucose (diamonds) and acetate (squares). Three phases can be seen and are marked with vertical lines: After 10 h, glucose is depleted; at time point 15 h
E. coli switches to growth on acetate, and after 20 h acetate is depleted. Plots B/C shows the corresponding activities of the transcription factors Crp and FruR, respectively. During growth on glucose, Crp activity is low and after depletion of glucose, Crp activity becomes more and more active. In contrast, FruR activity is high during growth on glucose (since inducer fructose-1,6-bisphosphate is expected to be high in this phase [
15]), and only after shift to acetate uptake, FruR activity becomes lower as expected from other experiments [
16].
Figure 3.
Left (plot A): experimental data for glucose (diamonds) and acetate (squares); middle (plot B) NCA results: Crp transcription factor activity; right (plot C) NCA results: FruR transcription factor activity. Circles indicate the sampling time points for array data analysis.
The elements of the coupling matrix
K that were needed for the core model of the glycolysis are summarized in
Table 2. Values are given for the genes
pfkA,
eno,
gap, and
pykF. See Appendix for a complete plot with all entries of
K.
Table 2.
Entries κi of the coupling matrix K. In further calculations the two values for eno and gap (κ2) are taken as representatives for the lumped glyoclytic reaction rgly.
| gene | value | gene | value |
|---|
| pfkA | 0.41 (κ1) | eno | 0.99 (κ2) |
| gap | 0.99 (κ2) | pykF | 0.49(κ3) |
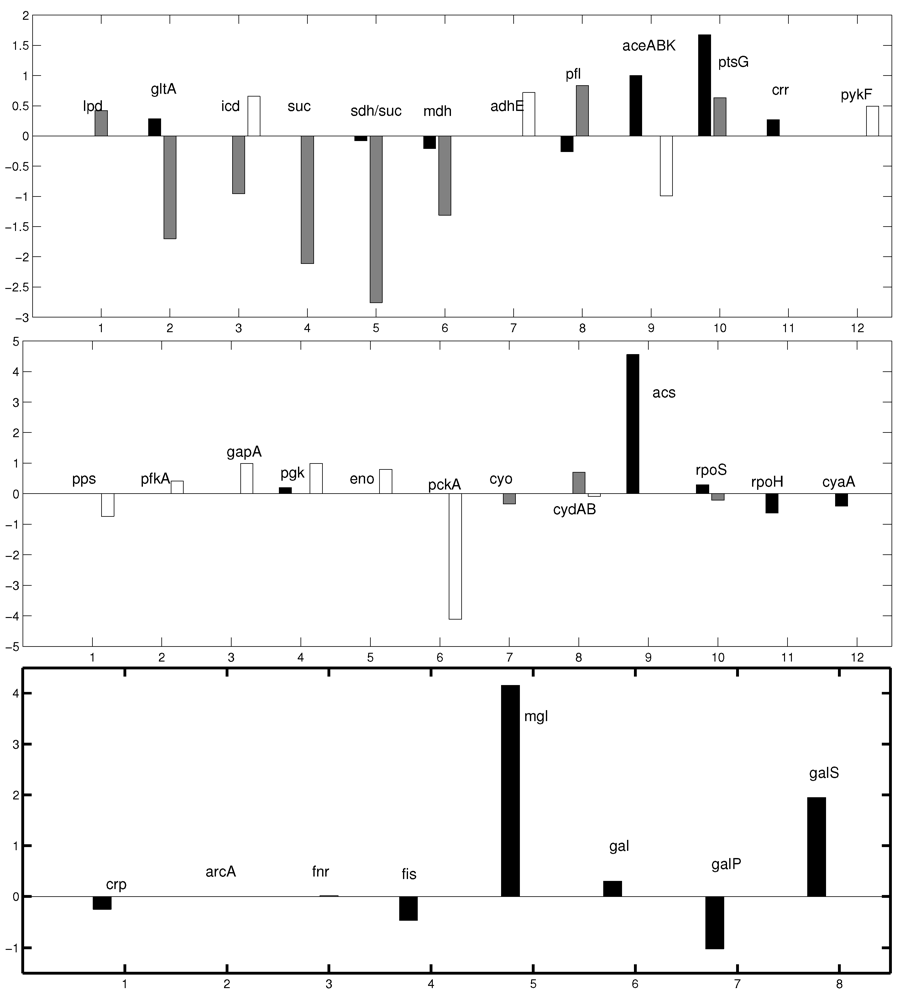
A comparison of signs given in
Table 2 (plus indicates activation and minus indicates repression by the transcription factor) and entries in data bases (e.g., Ecocyc [
17]) shows that signs for all genes were determined correctly. In this way the influence of transcription factor FruR on gene expression of the respective enzymes in glycolysis was determined; these values were further used in the steady state and dynamic analysis of the glycolysis core model.
2.3. Validation with PtsG induced strains
The model presented in previous studies [
2,
4] was extended as described in Material and Methods and experimental data with the inducible PtsG strain were used. In this way, glucose is taken up by two systems: a non-PTS system (unspecific) and a PTS system (PtsG). With increasing amounts of IPTG, a shift from a non-PTS uptake situation to complete PTS uptake could be observed in the experimental data accompanied by increasing growth rates. Based on the data, several parameters could be determined that relate uptake by the the PTS and the non-PTS system with growth rate.
To determine the kinetic parameters a sequential approach was chosen. First, a “rough” estimation of lumped parameters via nonlinear regression analysis was performed. To do so, reversibility of the glycolytic reaction
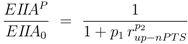
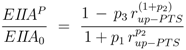
rgly and the feedback of PEP to PfkA were neglected. In this case, the degree of phosphorylation of EIIA could be described for growth on non-PTS sugars and PTS sugars in an analytical form. Moreover, as a result from our theoretical study [
4], a value
v = 1 was chosen. For non-PTS growth the degree of phosphorylation can be calculated as follows [
4]:
and for PTS growth:
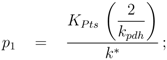
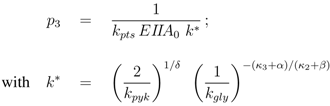
where parameters
pi are lumped kinetic constants:
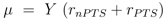
Considering now a simultaneous growth with both uptake systems, the uptake rate can be written as a sum:
and, consequently, depending on the fraction from the overall uptake rate, the degree of phosphorylation will adjust accordingly. Given experimental data for non-PTS growth and PTS growth (data from [
2]), and mixed growth (growth rates, degree of phosphorylation of EIIA for seven experiments 1–7, see Material and Methods) parameters
pj as well as the fraction
fj (
μj) with
j = 1,7 of uptake via the non-PTS system could be estimated. Fraction
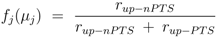
fj (
μj) is defined as:
In summary, 10 parameters are estimated based on 52 data points. Results of the fit are shown in
Figure 4.
Table 3 summarizes the results.
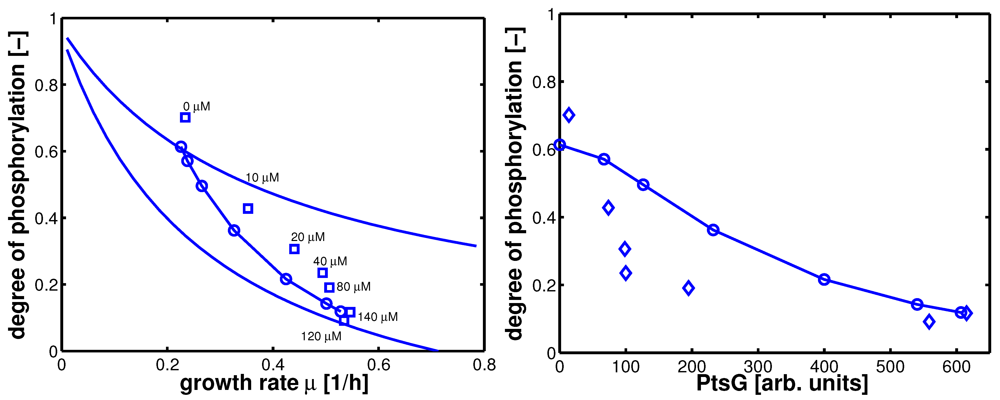
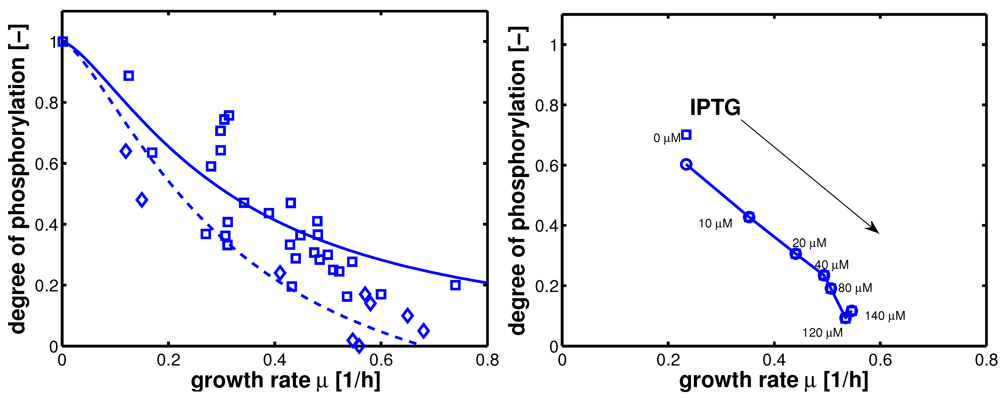
Figure 4.
Degree of phosphorylation of EIIA (
EIIAP / EIIA0) versus growth rate. All data are taken from [
2] (for the non-PTS data see
Figure 3 left and
Figure 7 left therein; for PTS data see
Figure 3 right and
Figure 7 right). Left (plot A): fit of the experimental data (non-PTS substrate squares, PTS substrate diamonds) with Equation system (8,9); solid lines show the simulation results for non-PTS uptake (solid) and PTS uptake (dashed). Right (plot B): For the PtsG induced strains, growth rate as well as degree of phosphorylation change (experimental data square). IPTG is increased which leads to higher expression of PtsG. With nonlinear regression the fraction of uptake via the non-PTS system is determined. See
Table 3.
Table 3.
Fraction fj of uptake via the non-PTS system after non-linear regression.
| Experiment | 1 | 2 | 3 | 4 | 5 | 6 | 7 |
| IPTG (μM) | 0 | 10 | 20 | 40 | 80 | 120 | 140 |
| EIIAP / EIIA0 | 0.70 | 0.43 | 0.31 | 0.24 | 0.19 | 0.09 | 0.12 |
| fj | 1.00 | 0.83 | 0.64 | 0.50 | 0.35 | 0.00 | 0.15 |
As can be seen for experiment 1, it is estimated that glucose is completely taken up via the non-PTS uptake system; in experiment 6 a complete uptake via the PTS system through PtsG is calculated. The fraction
fj could be determined perfectly in experiments 2–6 (
Figure 4 right).
Having the values
fj(
μj) available allows to estimate parameters of the uptake reaction kinetics for the non-PTS and the PTS uptake systems. Measurements of the degree of phosphorylation of protein EIIA were performed in the exponential growth phase. Here, glucose is abundant and it is expected that the enzymes are saturated. The non-PTS system is assumed constitutive, but based on the experiments the uptake is dependent on PtsG induction. Since no details are available for this lumped kinetic expression, an inhibition by PtsG is taken into account (black box approach). For the PTS system, a two-substrate mechanism is used as before [
2]. For the two uptake systems the following kinetics are therefore chosen:
where the second equal sign is valid in case that the enzymes are saturated with glucose (
Glcex >>
K1, K21). The respective uptake rates are estimated (see above) and measurements for
PtsG and
EIIAP are available. Therefore, the four unknown kinetic parameters (
rmax1,
kmax2,
KI, and
K22) could be estimated based on the seven experiments (
Figure 5).
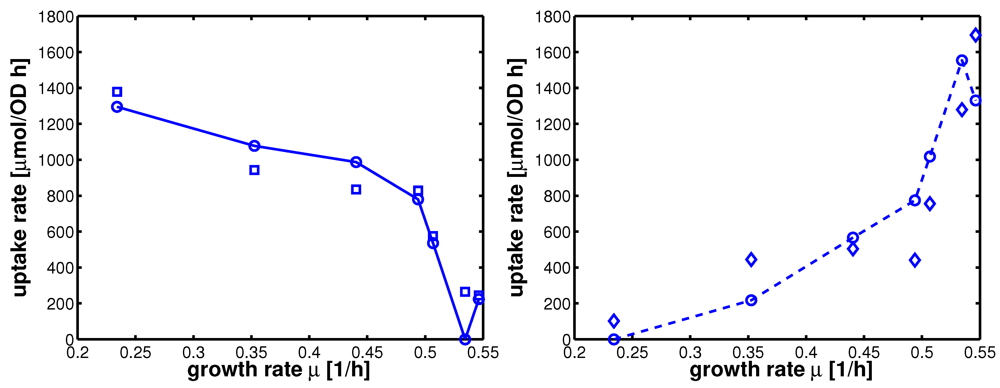
Figure 5.
Uptake rates for non-PTS growth and PTS growth for all experiments 1-7. Left (plot A): Uptake rate of the non-PTS uptake system in dependence on the growth rate (experimental data square). Parameters of equation system (16) were estimated and simulation studies were performed (circle). Right (plot B): Uptake rate of the PTS uptake system in dependence on the growth rate (experimental data diamonds). Parameters of equation system (16) were estimated and simulation studies were performed (circle).
Table 4 summarizes the results of the nonlinear regression of the parameters.
Table 4.
Kinetic parameters determined so far.
| parameter | value | parameter | value |
|---|
| p1 | 1.61e-05 | p2 | 1.43 |
| p3 | 5.30e-06 | | |
| rmax1 | 1.55e+03 | KI | 115.4 |
| kmax2 | 10.8 | K22 | 0.034 |
From Equation (12) it can be seen that
p2 is related to reaction order (
δ,
α,
β) and the influence of FruR on the kinetic expressions (
κ2,
κ3). The latter two parameters are determined above via the NCA approach. From literature [
9], it is known that pyruvate kinase shows a sigmoidal behavior with respect to PEP, therefore we set
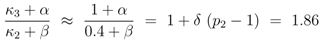
δ = 2. Rearranging Equation (12) and with results from above leads to:
Enzymes in the glycolysis are described with a hyperbolic behavior [
18] and we set
β = 1. As a result, the influence of the feedforward activation by fructose-1,6-bisphosphate can be calculated to
α = 1.53 . Taking into account that the sigmoidal behavior of the pyruvate kinase was described with
δ = 2 that corresponds to the number of domains of the system, the value for
α is in good agreement since it should also reflect the number of the domains (actually pyruvate kinase is a tetramer; however, the chosen Hill coefficients are only approximations and the simplest value was chosen; for
δ = 4,
α ≈ 3 is calculated).
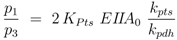
From Equations (10) and (12) the following estimation could be done:
Taking values for
KPts and
EIIA0 from literature [
2], the ratio between the PTS system constant and the pyruvate dehydrogenase constant could be calculated:
![Metabolites 02 00844 i057]()
. The values show a high capacity of the PTS chain in comparison with glycolytic fluxes. It is expected that sudden changes in the uptake rate should be seen immediately also in the degree of phosphorylation. This was demonstrated experimentally [
14]. The course of the metabolites and the enzymes are shown in
Figure 6. Based on the model structure and the estimated parameters, all enzymes and metabolites show an increasing behavior while PEP is nearly constant over the growth rate.
Figure 6.
Left (plot A): Course of the enzymes PfkA (solid), lumped glycolysis (dashed), and Pyk (dash-dotted) with the growth rate. Right (plot B): Course of the metabolites glucose-6-phosphate (solid), fructose-1,6-bisphosphate (dashed), PEP (dash-dotted), and pyruvate (dotted) with the growth rate.
2.4. Dynamic Model
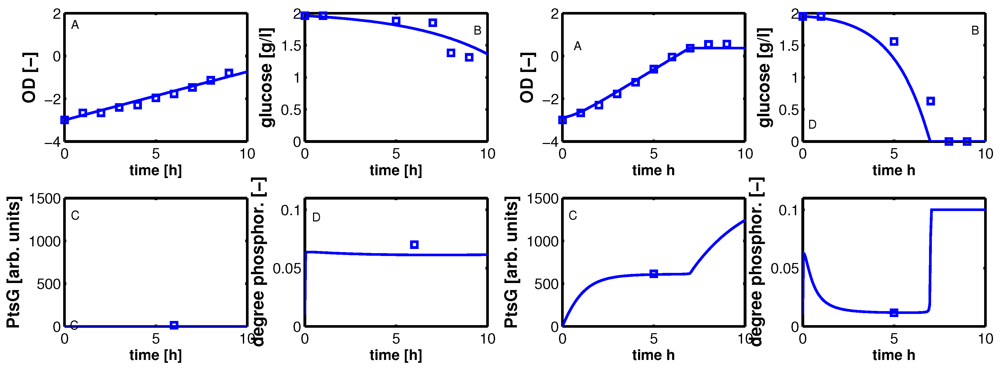
Having the model parameters for the uptake systems available, the complete system including PtsG induction kinetics (see Appendix) was simulated with fine-tuned parameters (empirical tuning of the parameters). First, time course data with simulated and experimental data are shown in
Figure 7 for selected values of IPTG.
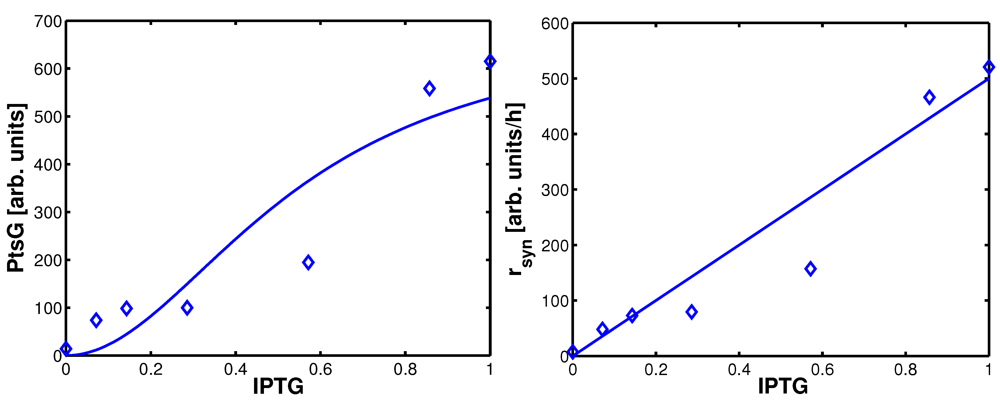
Figure 7.
Dynamic model simulation and comparison with experimental data. A: optical density, B: glucose in g/l, C: PtsG in arbitrary units, D: degree of phosphorylated EIIA (dimensionless). Left: IPTG 0 μM; Right IPTG 140 μM.
Shown are data for optical density (plot A), extracellular glucose concentration (plot B), PtsG (plot C), and EIIA phosphorylated (plot D) for no IPTG (left) and maximal IPTG concentration (right). The calculation of the optical density in plot A shows a very good agreement with the experimental data; glucose uptake for high concentrations of IPTG could not be reproduced accurately as the yield coefficients for each experiment were different and in the calculations, a mean value was used. Furthermore, the fit of the parameters for glucose uptake (
Figure 5) also shows differences between simulated and experimental values that can be seen here again. For a high value of IPTG, the value of PtsG measured in the exponential phase could be described as well as the degree of phosphorylation of EIIA.
Steady state values (taken in the exponential phase) are considered and compared with simulation results (
Figure 8). Plot A shows simulation results for growth on non-PTS (upper curve) and PTS (lower curve) carbohydrates. For small uptake rates, both curves converge. For large growth rates, the PTS reaches its capacity limit since the energy for the transport is generated in the glyoclysis itself.
For increasing values of IPTG, the system moves from one curve to the other, indicating a change of the uptake system based on the induction of PtsG: the degree of phosphorylation decreases while the growth rate increases. A comparison of the experimental data with the simulation data reveals differences in the growth rate. The first (experiment 1) and last (experiment 7) data point are fitted with high accuracy while in the other experiments larger deviations could be seen. As indicated before, the main reason for the deviations is most probably the variation in the yield biomass/glucose and the choice of simple rate laws.
Table 5 summarizes the simulated and the experimental data for growth rate and the two uptake rates. Plot B in
Figure 8 shows the relationship between PtsG and the degree of phosphorylation of EIIA.
Figure 8.
Left (plot A): Degree of phosphorylation of EIIA versus growth rate. Shown are simulation results for growth on non-PTS carbohydrates (upper solid line) and for growth on PTS carbohydrates (lower solid line). Values for the experiments 1–7 are taken in the exponential phase (squares). Simulation results for experiments 1–7 are shown with symbols (circles). Right (plot B): Degree of phosphorylation of EIIA versus level of PtsG. Values for the experiments 1–7 are taken in the exponential phase (diamonds). Simulation results for experiments 1–7 are shown with symbols (circles).
Table 5.
Summary of the simulation results. Comparison between measured quantities and simulated quantities for experiments 1–7. First column: growth rate μ. μ is given in 1/h. Second and third columns: uptake rates via non-PTS system and PTS system. The uptake rates are given in 103 μmol/ OD units h.
| IPTG | growth rate | | non-PTS uptake | | PTS uptake | |
|---|
| sim | ex | sim | ex | sim | ex |
|---|
| 1. | 0 | 0.23 | 0.23 | 1.76 | 1.67 | 0.00 | 0.00 |
| 2. | 10 | 0.24 | 0.35 | 1.35 | 2.10 | 0.50 | 0.42 |
| 3. | 20 | 0.27 | 0.44 | 1.12 | 2.00 | 0.94 | 1.15 |
| 4. | 40 | 0.33 | 0.49 | 0.85 | 1.77 | 1.69 | 1.76 |
| 5. | 80 | 0.43 | 0.51 | 0.56 | 1.25 | 2.75 | 2.37 |
| 6. | 120 | 0.50 | 0.54 | 0.43 | 0.00 | 3.47 | 3.82 |
| 7. | 140 | 0.53 | 0.55 | 0.36 | 0.56 | 3.74 | 3.34 |
2.5. Discussion
Mathematical modeling can be a powerful tool to analyze systems that are hardly observable. Here, we use a simple core model for glycolysis of
E. coli to predict semi-quantitatively the steady state behavior for central metabolites in dependence on the growth rate (for downloading all files and comments see information given in the Appendix). Glycolysis is an important reaction system since some of the metabolites such as fructose-1,6-bisphosphate, PEP and pyruvate are closely related to signalling units that trigger the important transcription factors FruR and Crp. While experimental data for metabolite concentrations [
19] and mathematical models [
18] are available for specific situations—normally covering one single growth rate—complete data sets for a broad range of growth rates are scarce. More complete models for central metabolsim were presented [
20,
21], however, a quantitative comparison with experimental data is missing. Therefore, these models are not suited for a fair comparison. In [
22] a detailed mathematical model similar to a model published by us [
14] was presented but failed to predict genetic modifications. A comparison of modeling approaches and a presentation of the current “state of the art” on this topic can be found in [
23]. To summarize, mathematical models to describe carbohydrate uptake and metabolism are available, but fail in reproducing experimental data or fail in predicting new experiments.
In previous studies, we already analyzed the input/output relationship to describe a characteristic curve that relates growth rate for a number of carbohydrates and the degree of phosphorylation of EIIA, an important metabolite of the PTS. Other groups focus on structural properties of the same system [
10] or on the relationship between control, metabolites and fluxes through the system [
20]. In this study, new experimental data is presented to extend our current model by taking into account the transcription factor activities, and experiments that are designed to modify the already available input/output characteristic curves in such a way that kinetic parameters can be estimated with higher accuracy are performed. Here, a strain is used that allows adjusting the level of the main glucose uptake system, namely PtsG, with IPTG as inducer. In this way, different amounts of the PtsG uptake system could be adjusted and data could be used to estimate parameters related to metabolites that could not be measured. In contrast to previous publications the parameter fitting procedure was modified: first the lumped parameters were estimated via nonlinear regression, finally all parameters were adjusted based on the estimation and literature data.
Results from NCA allow to determine the influence of transcription factor activities on a set of selected genes. Data that were used in a different study were complemented with new experiments. In this experiment, glucose was pulsed to a culture growing under glucose limitation. Glucose was immediately taken up and after 10 h glucose was depleted. Acetate is produced during growth on glucose and consumed after 15 h. The different energy sources lead to different transcription factor activities that could be estimated with NCA. Furthermore, the influence of each transcription factor on each gene is described with a coupling factor
κ. A crucial issue is the verification of the elements of the coupling matrix. In most studies—also in the first publication that introduces the method—the signs of the entries were not validated with entries of databases. In our previous study [
3] we already could show that an agreement for all entries is hardly possible but shows 70%–100% correct values. In the current study the error for transcription factor FruR is around 10%, that is, only one sign, here for the
icd gene (isocitrate dehydrogenase in the TCA) is different from the data base entry. The values for
pfkA,
eno,
gap, and
pyk are determined from the experiments and are taken into account in further parts of the study. Interestingly the values for
eno and
gap are similar and are integrated into a single value for the lumped glycolytic reaction
rgly.
A structural analysis of the core model including all regulatory features was performed to calculate the behaviour of the intracellular metabolites of the core model (glucose-6-phosphate, fructose-1,6-bisphosphate, PEP and pyruvate). While the signs for fructose-1,6-bisphosphate and pyruvate are fixed and show positive values, it is expected that both metabolites show increasing values if the uptake rate is increasing. In contrast, the signs of PEP and glucose-6-phosphate are not fixed. Since PEP is an important metabolite for the PTS and the PEP/pyruvate ratio determines the degree of phosphorylation, the behavior of PEP in dependence on the growth rate was further explored. In a previous study, we analyzed the robustness of a simplified version of the model and it turns out that a monotonous decreasing course of PEP is more favourable with respect to robustness [
11]. In this study, conditions for the extended model were derived allowing the course of PEP over the growth rate to show a maximum. These constraints are related to the regulatory properties on the transcriptional level (
κ2 and
κ3) and kinetic properties (
α,
β,
K20).
Based on the first “rough” estimation of the model parameters, the influence of the reversibility of the glycolytic reaction
rgly was studied with numerical simulations. Parameter estimation reveals that condition (6) was fulfilled. Doing so, the course of PEP depends on the value of
K20 (equilibrium constant of the reversible glycolytic reaction
rgly).
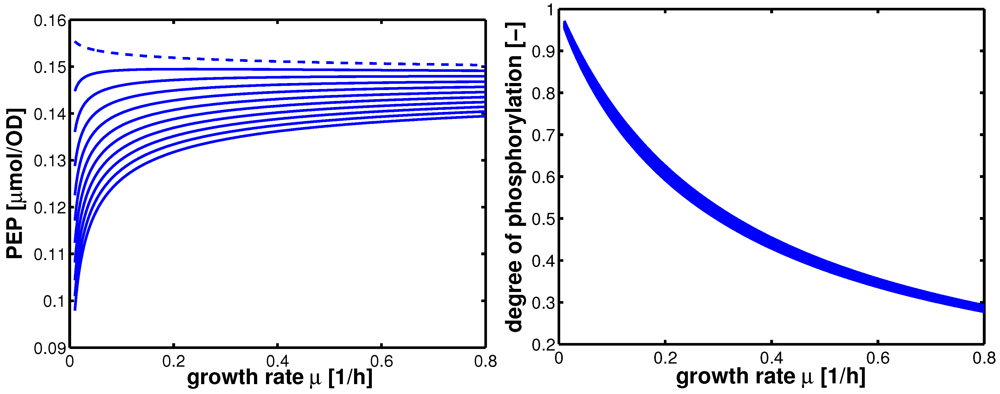
Figure 9 shows the course of PEP for different values of
K20 (plot A) and the course of phosphorylated EIIA. As can be seen in
Figure 9, an extremum is reached for a small value of
K20 in the range of the growth rate considered here. In all other cases, PEP is monotonously increasing. The course of phosphorylated EIIA shows a very low sensitivity with respect to
K20 (plot B). The same is true for fructose-1,6-bisphosphate (data not shown).
Figure 9.
Left (plot A): course of PEP for different values of K20 (dashed curve: K20 = 0). Right (plot B): course of phosphorylated EIIA for different values of K20. K20 was varied between 0.05 and 0.5.
Experimental data to verify the simulations are found. Several studies focus on single growth conditions or on specific stimulations of the system [
18,
19]. In [
24]
E. coli was starved for carbohydrates and nitrogen. This situation reflects a move from a high growth rate to a very low growth rate.
Figure 4 in [
24] shows time course data for PEP and fructose-1,6-bisphosphate for carbon starvation. After stimulation, PEP increases very fast up to a factor of 64 but then decreases, and after 8 hours the former steady state is almost reached; in contrast fructose-1,6-bisphosphate decreases fast and remains at the new steady state during the remaining time of the experiment. In [
25] several stimulations were performed and PEP was measured. For a classical experiment when
E. coli is growing on glucose and lactose, the dynamic of PEP could also be monitored. For both growth phases, the level of PEP is nearly constant. In an A-stat experiment different metabolites of central metabolism were monitored [
15]. Although the data are noisy, the level of fructose-1,6-bisphosphate and glyceraldehyde-3-phosphate show a monotone increasing correlation with the growth rate. To summarize, there is experimental evidence that the simulation results predicted using this model (see
Figure 6) reflect the true intracellular behavior.
With a newly designed strain that allows to adjust the level of PtsG, it was possible to “move” from one branch of the characteristic curve of phosphorylated EIIA (non-PTS case) to the other branch (PTS case). The experiments are designed such that glucose is taken up by the PTS and also by non-specific uptake systems. With the data of these experiments, it was possible to approach different points on the uptake kinetics for parameter estimation. While the data for the degree of phosphorylation were taken from previous experiments, the data with the new strain confirmed the relationship already published.
The approach shows that an understanding of the intracellular network is required to design and modify such network and offers new possibilities in medical and biotechnological applications.

 for the metabolites are calculated. Matrix D has the following entries:


 . The values show a high capacity of the PTS chain in comparison with glycolytic fluxes. It is expected that sudden changes in the uptake rate should be seen immediately also in the degree of phosphorylation. This was demonstrated experimentally [14]. The course of the metabolites and the enzymes are shown in Figure 6. Based on the model structure and the estimated parameters, all enzymes and metabolites show an increasing behavior while PEP is nearly constant over the growth rate.
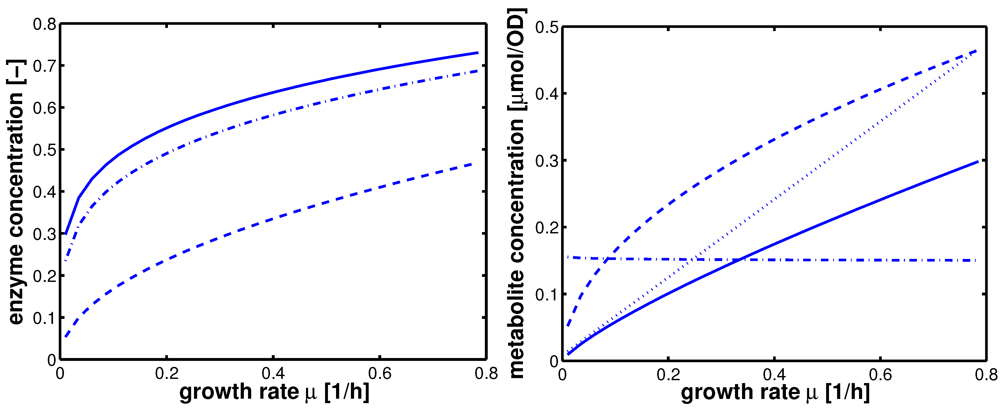


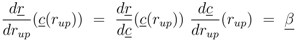
 denotes the Jacobian matrix (or elasticities) of the rates ri with respect to the concentrations cj:


 can be computed:


 and
and 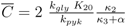 are positive constants.
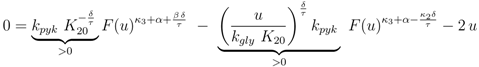
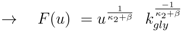
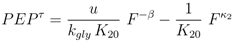
 . Furthermore for u = 0 the unique solution of Equation (53) is given by F(0) = 0, which implies PEP(0) = 0 since from 0 = u − rgly follows
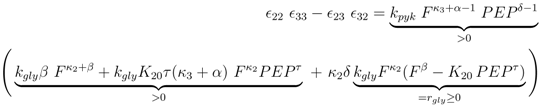
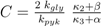
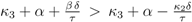
 for very small values of u (note that this does not hold for K20 = 0 and χ > 0, since in this case
  for all u > 0 according to Equation (47)). Thus in the case K20 > 0, independent of the value of χ, the function PEP(u) is at first increasing, and therefore expression (52) is at first positive. The behaviour of F(u) for u → ∞ can be derived from Equation (53) as well: in this case also F(u) → ∞ is mandatory to fulfill Equation (53).
 for χ > 0 and since PEP is not decreasing while f (u) ≤ C, the function f(u) is at first monotonously increasing and there even has to exist a û > 0 such that f (û) > C. Therefore the sign of expression (52) changes from positive to negative, which equals the existence of a strict local maximum in the course of PEP. In the case χ ≤ 0 the expressions F(u)χ and F(u)−β are non-increasing. Furthermore when f (u) = C also PEP(u) stops to increase. Therefore the function f(u) is bounded by C, and hence expression (52) is always positive, which shows that in this case one obtains a monotonously increasing function PFP(u). Overall, there is a strict local maximum in the course of PEP(u), while K20 > 0, is equivalent to (κ3 + α) − (κ2 + β) =: χ > 0.