Exometabolomics Approaches in Studying the Application of Lignocellulosic Biomass as Fermentation Feedstock

Abstract
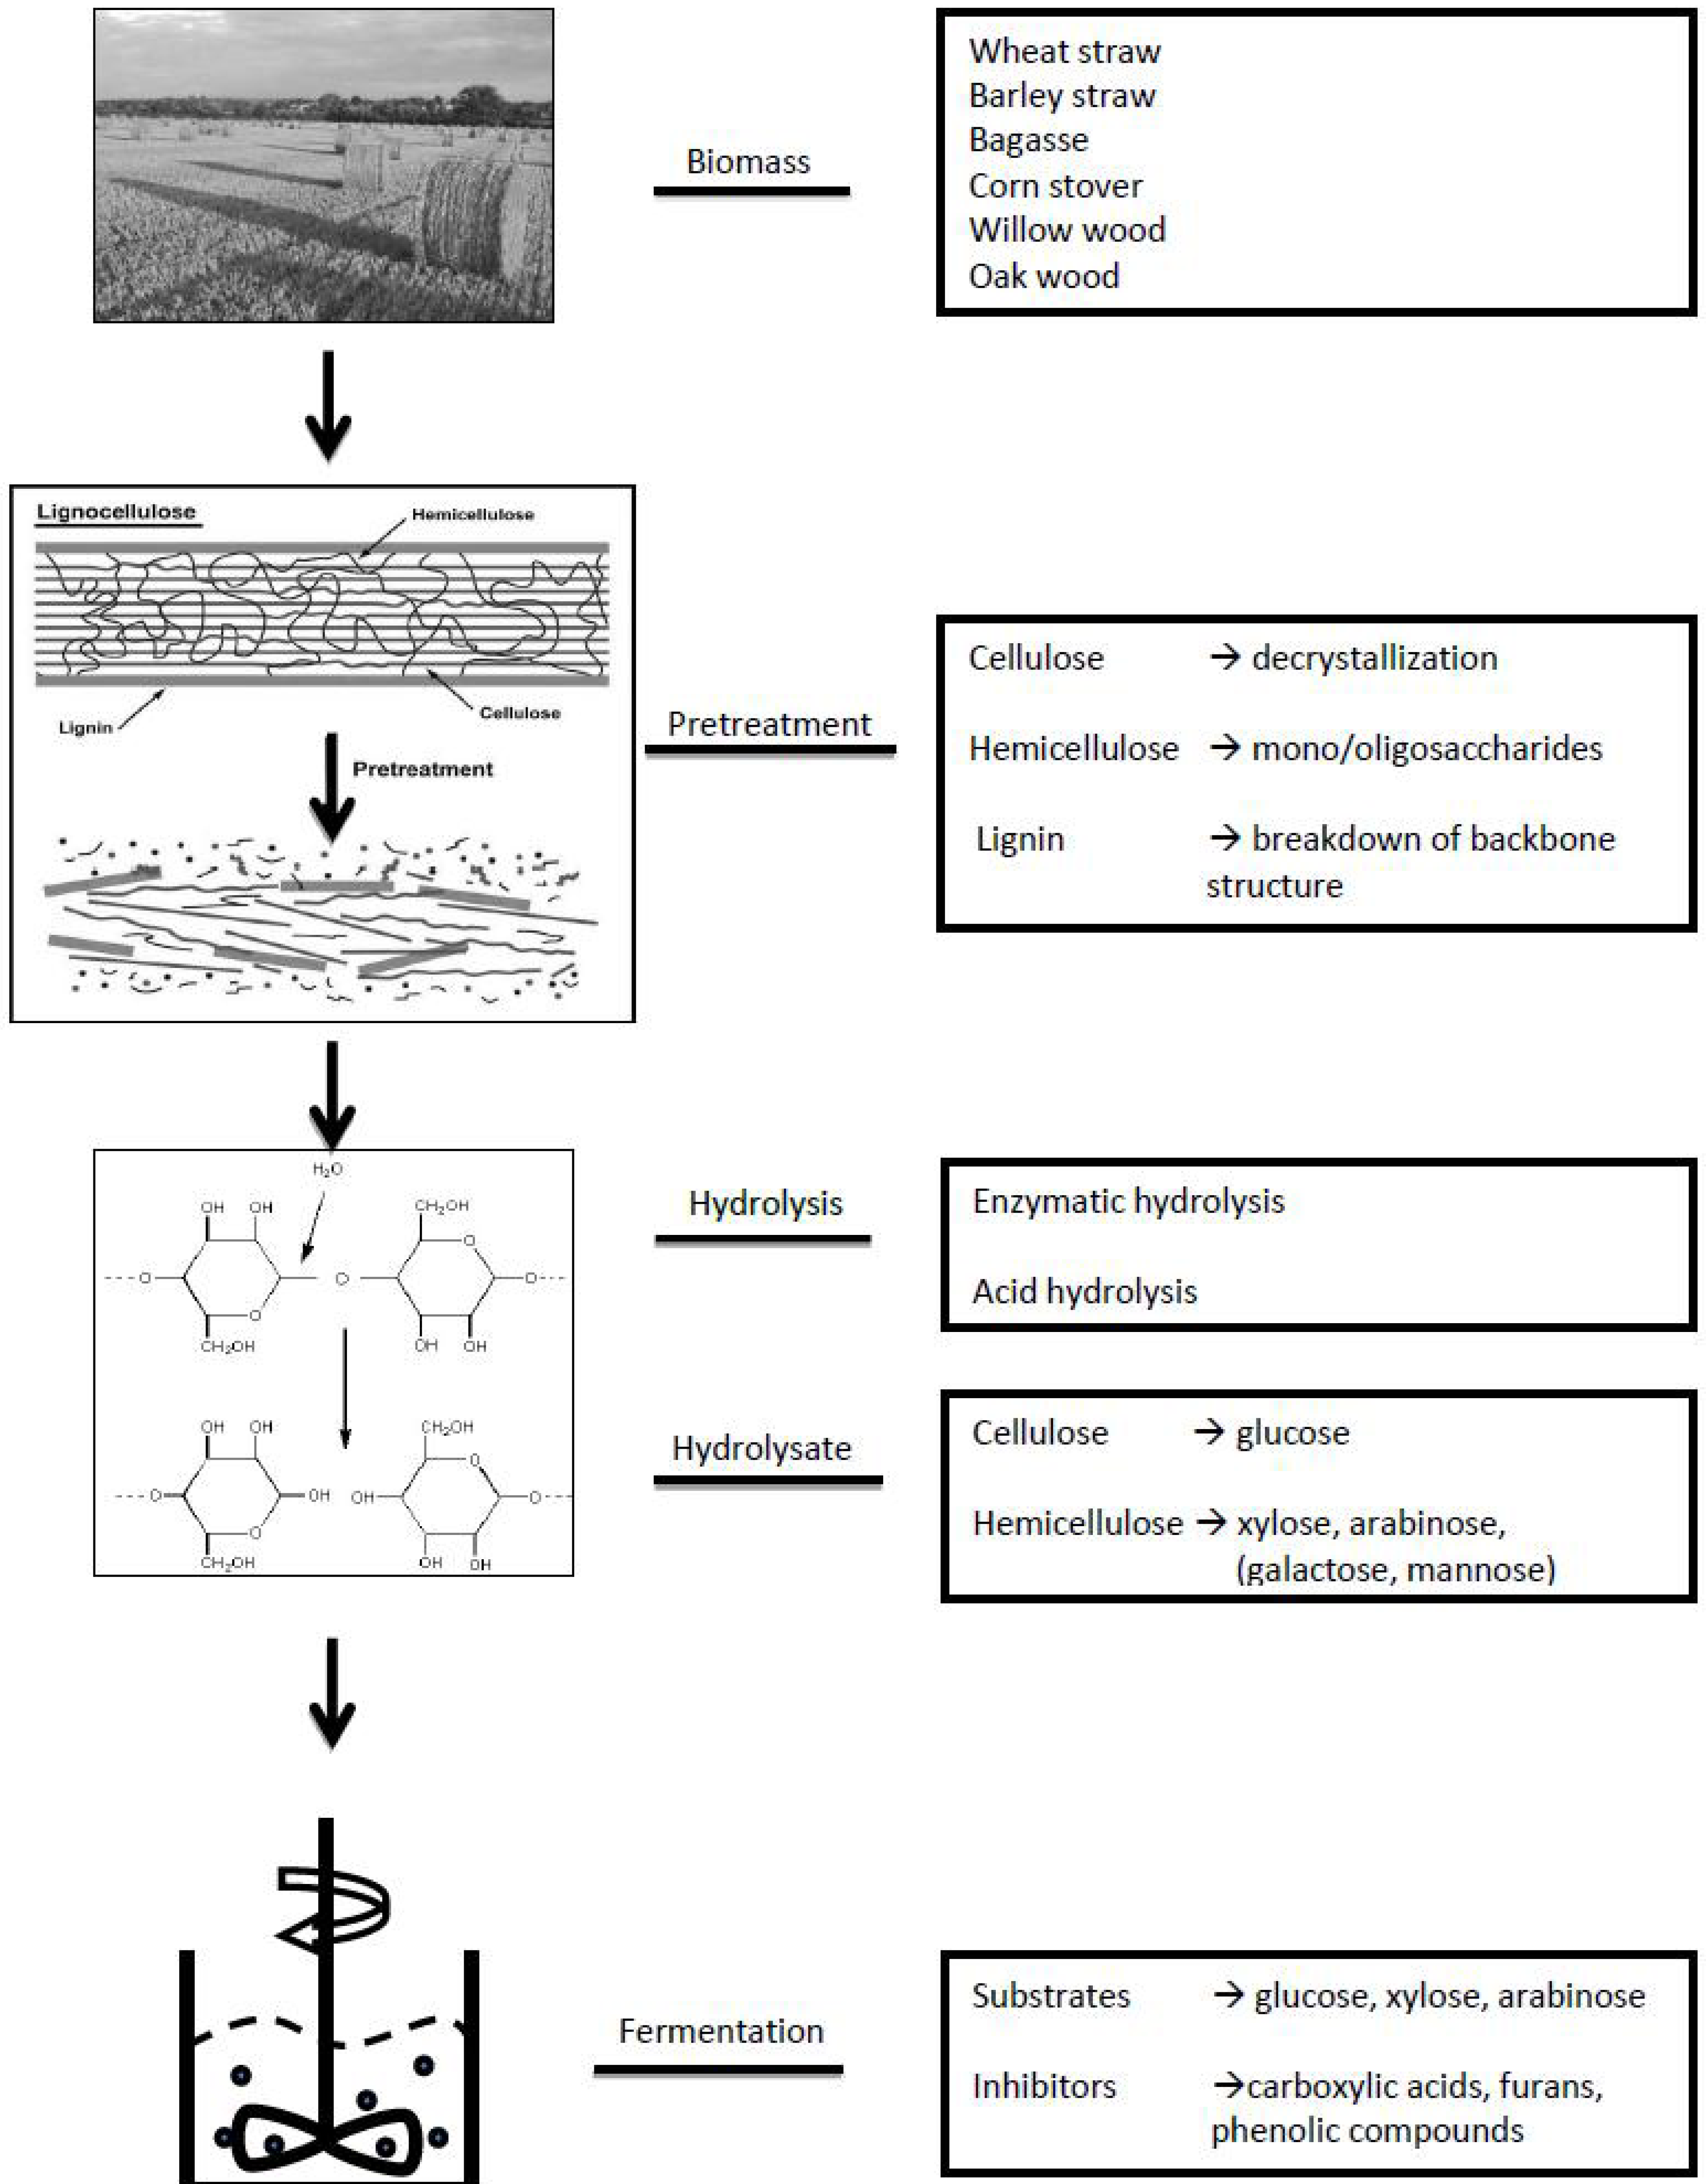
:1. Introduction

2. General Approach of Metabolomics Studies
3. Targeted approach: Applying targeted Metabolomics Approaches to Study the Sugar and Lignin Degradation Products in Lignocellulosic Biomass Hydrolysates
3.1. Analytical Methods for Studying Hydrolysate Composition
3.1.1. Small Carboxylic Acids and Furans

| Analytical method | extraction / derivatization | Detected compounds | Identification | quantification | reference |
|---|---|---|---|---|---|
| HPLC | no | formic, acetic acid, levulinic acid, lactic acid, glycolic acid, malic acid, citric acid, succinic acid, oxalic acid | no | yes | [49,50,51,55,58,59,60,61,62] |
| furfural, HMF furfuryl alcohol, 2,5-bis-hydroxymethylfuran | [49,55,58,60,61,63,64] | ||||
| RP-HPLC | precipitation-filtration, MTBE / no | formic acid, lactic acid, acetic acid, levulinic acid, furfural, HMF, phenolic compounds | partial | yes | [52] |
| MTBE / no | gallic acid, furfural, HMF, protocatechuic acid, vanillin, coniferyl alcohol, syringaldehyde, sinapic acid | partial /GC-MS | [51] | ||
| no | reference phenolic compounds | GC-MS | [50] | ||
| CE | no | formic acid, acetic acid, levulinic acid, glycolic acid, lactic acid, furfural, HMF | no | yes | [53,63,65] |
| GC-MS | solvent / no | acetic acid, furfural, acetamide | no | yes | [66] |
| MTBE / silylation | gallic acid, HMF, vanillin, protocatechuic acid, syringaldehyde | yes/partial | no | [51] | |
| DCM / EC-derivatization | levulinic acid, furfural, furfurylalcohol, 2-furanmethanol acetate, HMF, phenolic compounds | yes | [67] | ||
| SPE / silylation | phenolic compounds | [60,61] | |||
| EA / silylation | furfural, HMF, furfuryl alcohol, 2-furoic acid, phenolic compounds | [55] | |||
| phenolic compounds | no | [49] | |||
| phenolic compounds | yes | [57,59] | |||
| no / silylation | lignin derived monomer and dimers | [65] | |||
| LC-MS/MS | precipitation-filtration, MTBE / no | aliphatic acids, furans, phenolic compounds | yes | yes | [54,68] |
3.1.2. Phenolic (aromatic) Compounds
| p-hydroxyphenyl residue (H) | Detected in more than one study* | Detected in one study | hydrolysate | ref |
|---|---|---|---|---|
 | phenol 4-hydroxybenzaldehyde 4-hydroxybenzoic acid salicylic acid (2-hydroxybenzoic acid) 3,4-dihydroxybenzaldehyde benzoic acid catechol (1,2-dihydroxybenzene) p-coumaric acid (4-hydroxycinnamic acid) piceol (4-hydroxyacetophenone) | hydroquinone | spruce-dilute acid | [60] |
| 4-methoxyphenol
p-coumaryl alcohol Phloretic acid (3-(4-hydroxyphenyl)propionic acid) | wheat straw-steam explosion | [55] | ||
| o-cresol (2-methylphenol) gentisic acid (2,5-dihydroxybenzoic acid) protocatechuic acid (3,4-dihydroxybenzoic acid) | willow-acid steam | [57] | ||
| caffeic acid (3,4-dihydroxy cinnamic acid) | corn stover-dilute acid or ammonia fiber expansion | [54] | ||
| Guaiacyl residue (G) | ||||
 | guaiacol vanillin vanillic acid homovanillic acid ferulic acid (4-hydroxy-3-methoxycinnamic acid) 3-hydroxy-4-methoxycinnamic acid coniferyl aldehyde dihydroconiferyl alcohol acetovanillone (acetoguaiacone)G-CH2COCH3 | G-CHOHCOCH3 G-COCOCH3 G-CH2COCH2OH G-COCHOHCH3 | spruce-dilute acid | [60] |
| vanillyl alcohol G-CH2CH2COOH G-CHCHCHO | wheat straw-steam explosion | [55] | ||
| trans-isoeugenol | willow-acid steam | [57] | ||
| Syringyl residue (S) | ||||
 | syringaldehyde syringic acid | acetosyringone | wheat straw-alkaline wet oxidation | [61] |
| syringol S-CHCHCHO | wheat straw-steam explosion | [55] | ||
| Other structures | biphenyl-type dimer diarylpropane-type dimer pinoresinol-type dimer | Japanese beech-hot compressed water | [65] | |
| 4-hydroxycoumarin
o-toluic acid p-toluic acid | corn stover-dilute acid or ammonia fiber expansion | [54] | ||
3.2. Application of Targeted Approaches in Studying Biomass Hydrolysates
3.2.1. Inhibitor Identification
3.2.2. Pretreatment Condition Optimization
3.2.3. Monitoring Compound Dynamics during Detoxification and Fermentation
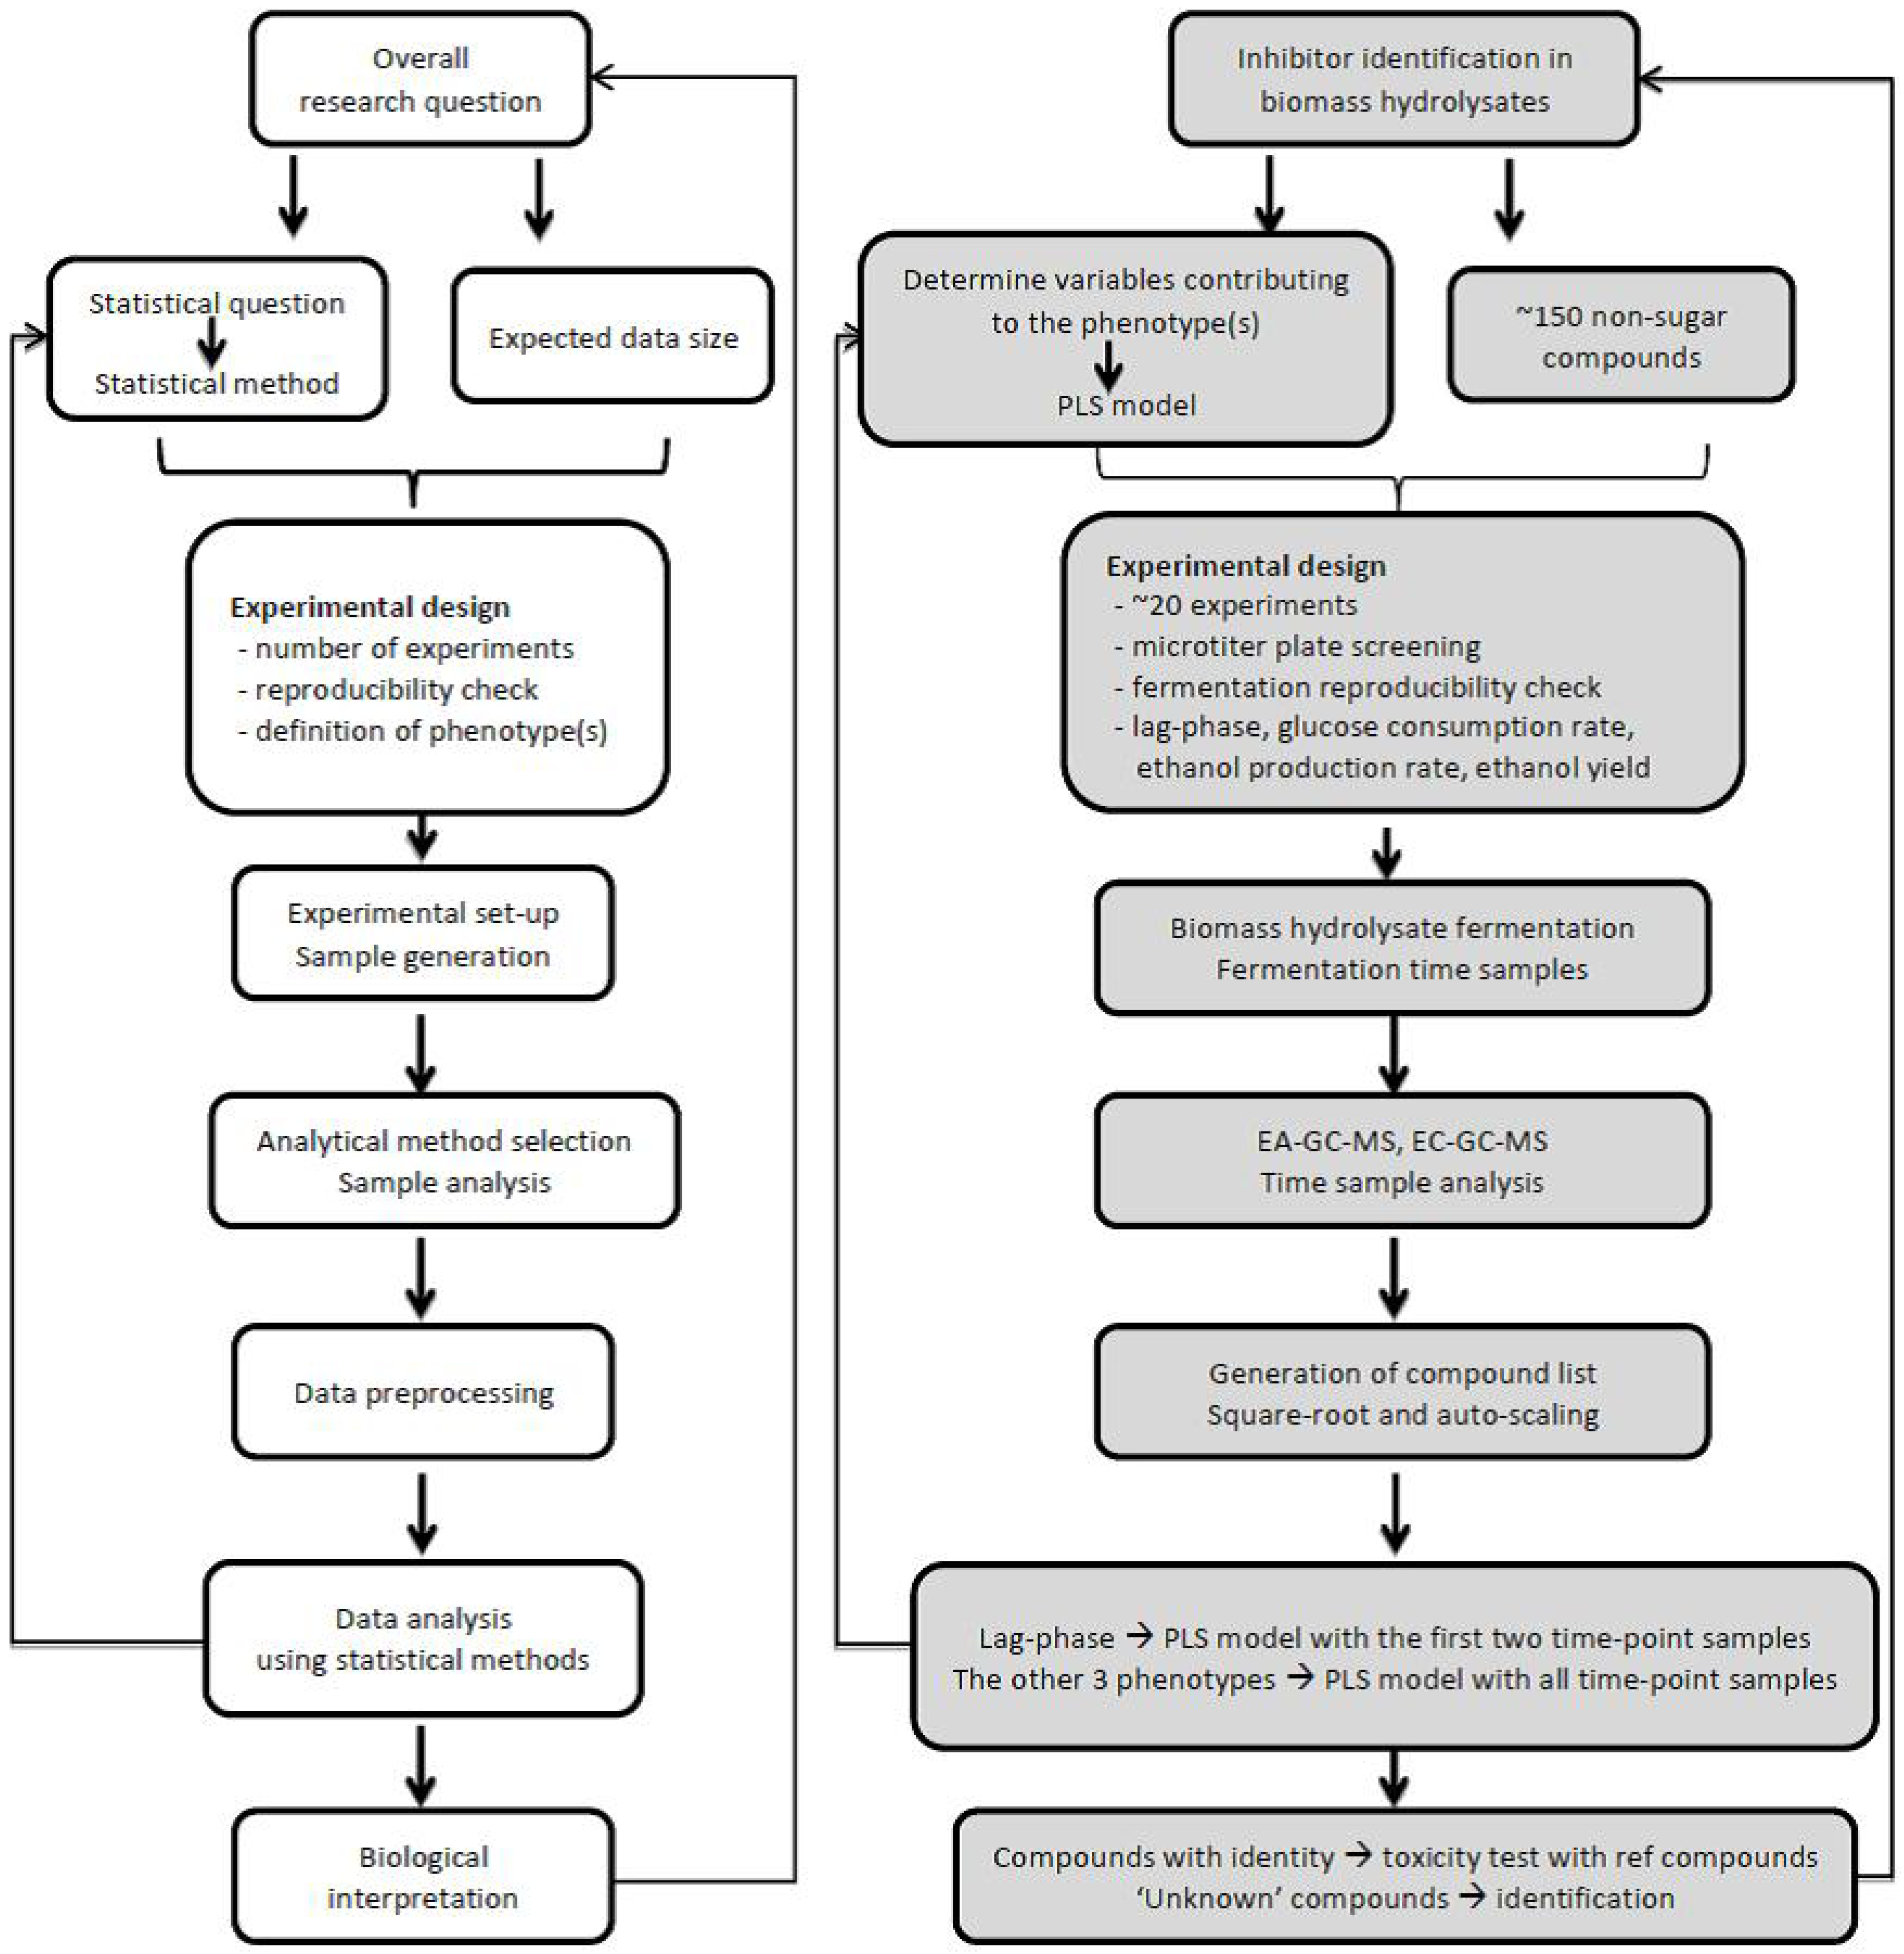
4. Non-Targeted Approach. Research Case: Applying Non-Targeted Metabolomics Approach to Study Inhibitors and Their Dynamics in Lignocellulosic Biomass Hydrolysates as Fermentation Media
4.1. Define Research Question
4.2. Experimental Design
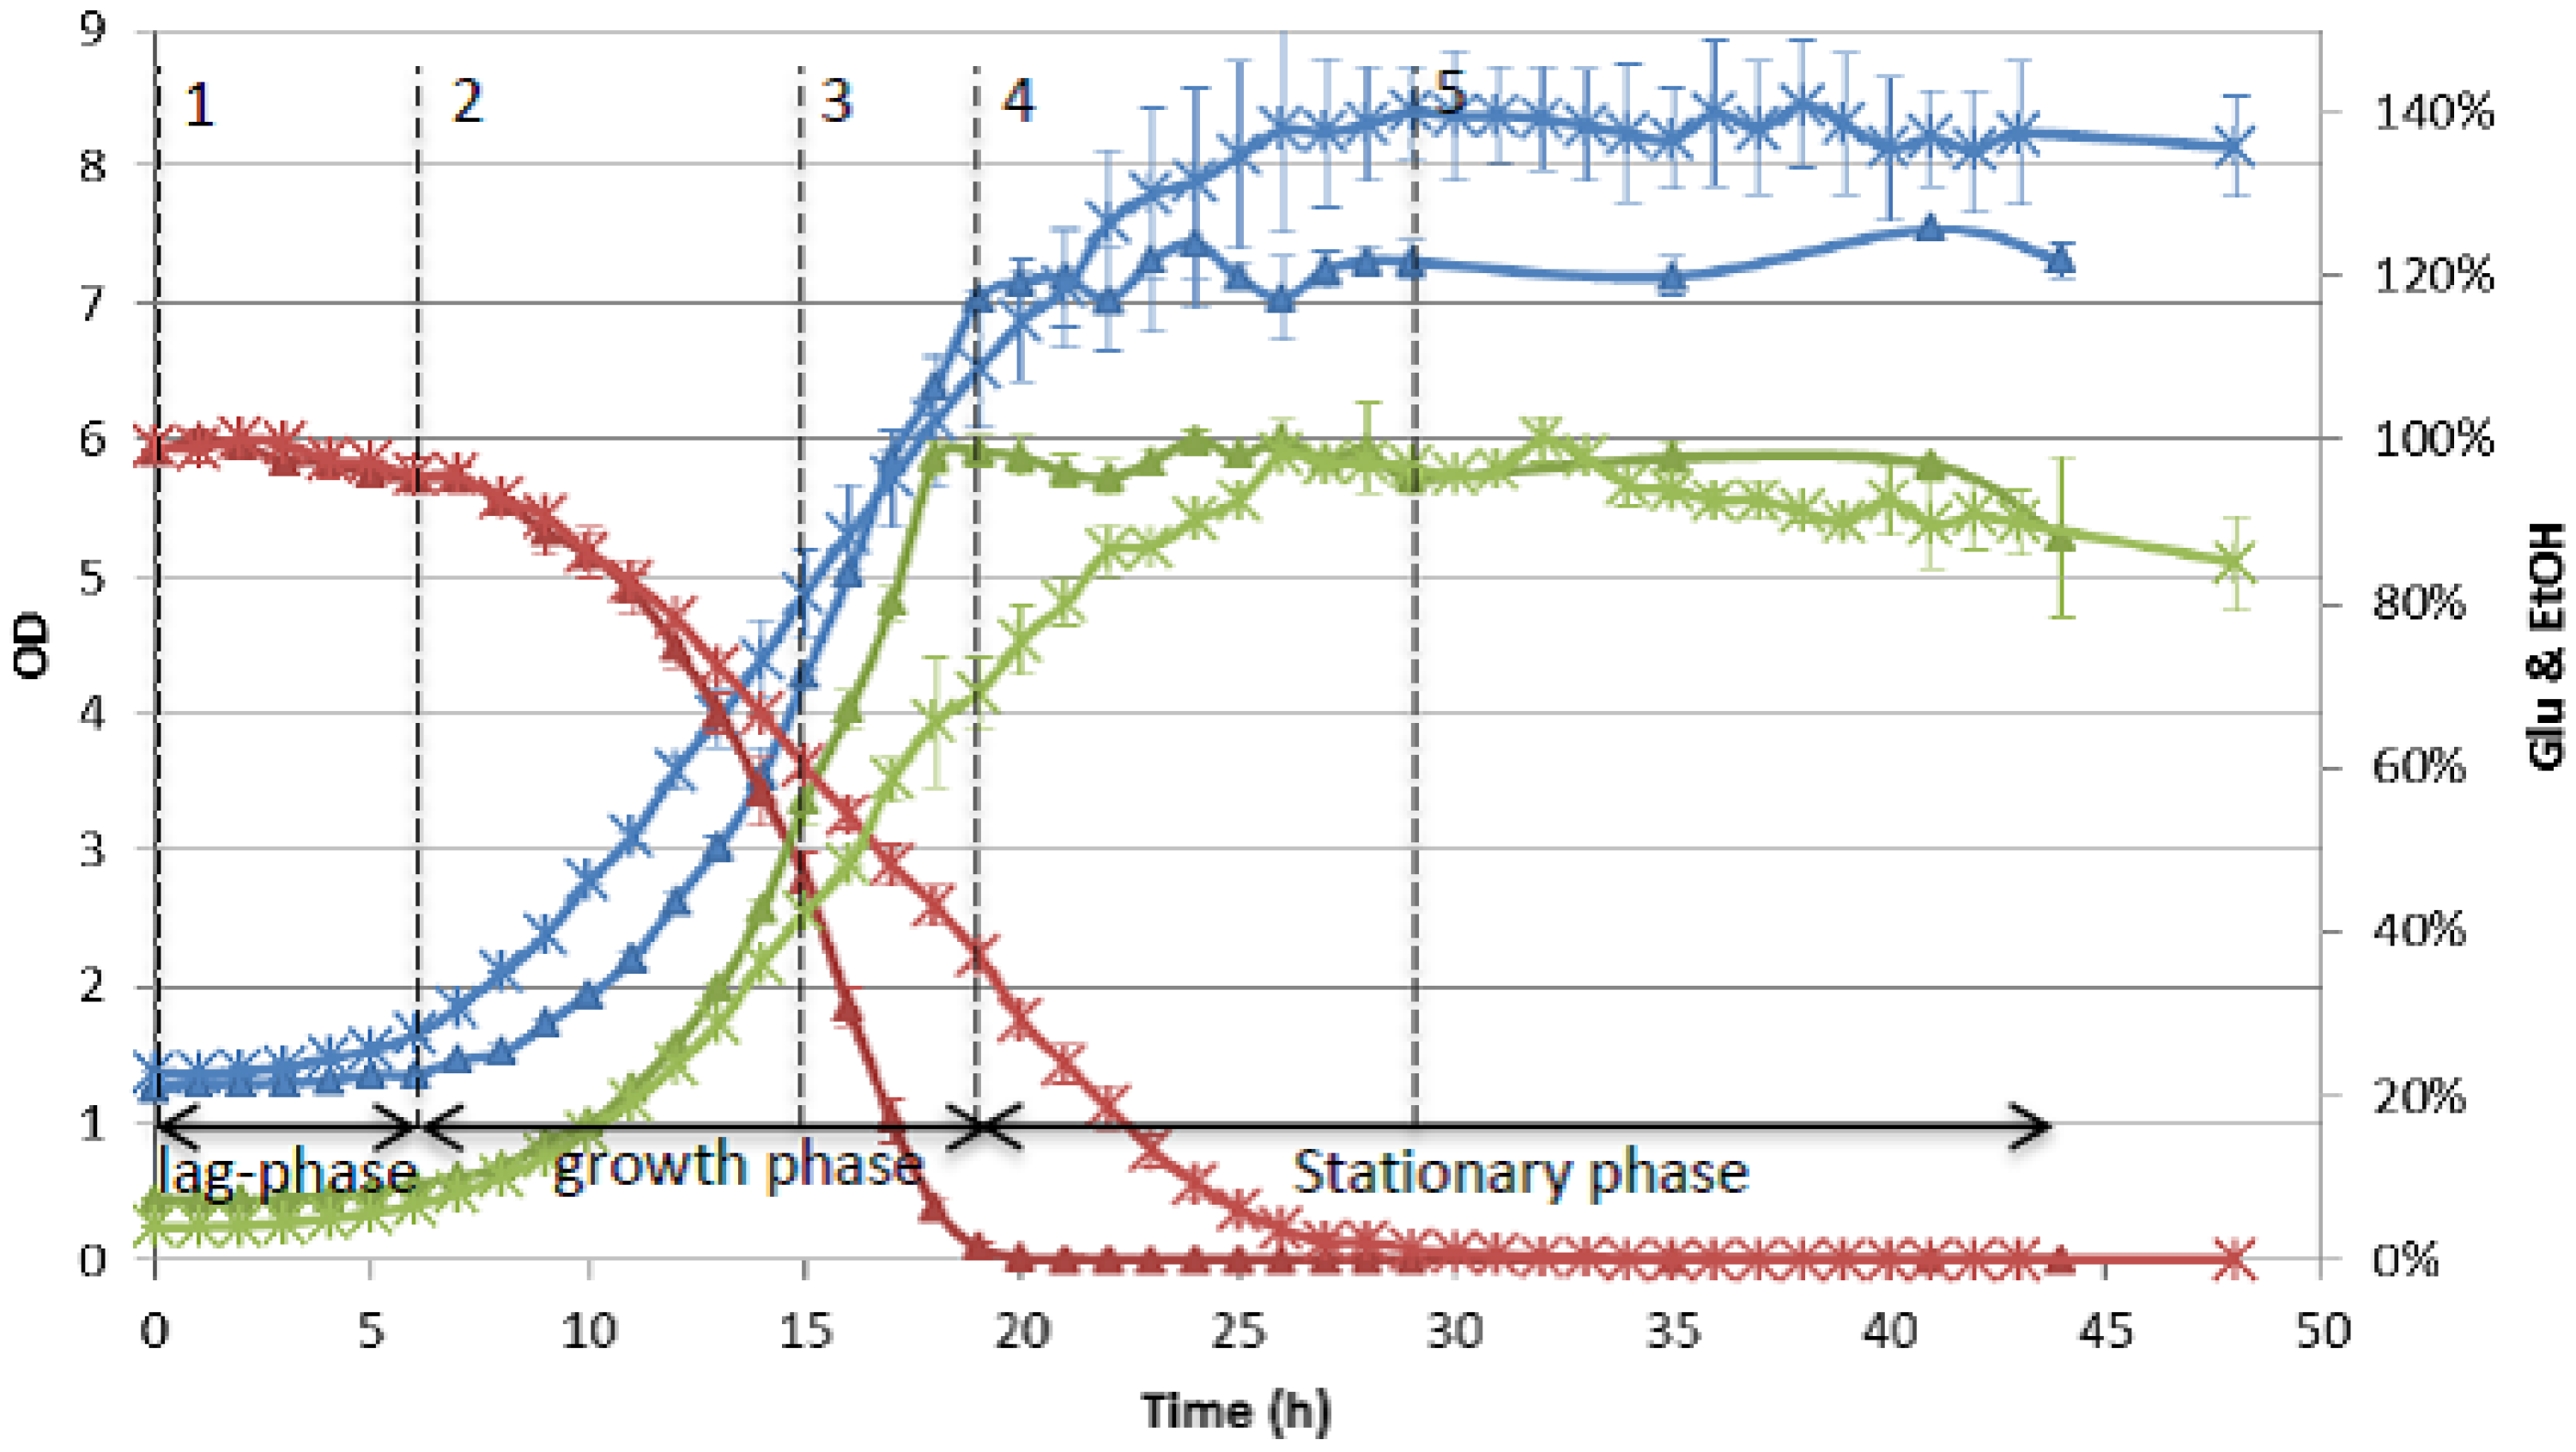
4.3. Sample Selection and Analysis
4.4. Data Analysis and Interpretation
5. Conclusions
Acknowledgments
Conflict of Interest
References
- Sun, Y.; Cheng, J. Hydrolysis of lignocellulosic materials for ethanol production: A review. Bioresource Technol. 2002, 83, 1–11. [Google Scholar] [CrossRef]
- Zhang, Y.H. Reviving the carbohydrate economy via multi-product lignocellulose biorefineries. J. Ind. Microbiol. Biot. 2008, 35, 367–375. [Google Scholar] [CrossRef]
- Hahn-Hägerdal, B.; Galbe, M.; Gorwa-Grauslund, M. Bio-ethanol -- the fuel of tomorrow from the residues of today. Trends Biotechnol. 2006, 24, 549–556. [Google Scholar] [CrossRef]
- Metzger, J.O.; Hüttermann, A. Sustainable global energy supply based on lignocellulosic biomass from afforestation of degraded areas. Naturwissenschaften 2009, 96, 279–288. [Google Scholar] [CrossRef]
- Carpita, N.C.; Gibeaut, D.M. Structural models of primary cell walls in flowering plants: consistency of molecular structure with the physical properties of the walls during growth. Plant J. 1993, 3, 1–30. [Google Scholar] [CrossRef]
- Sarkar, P.; Bosneaga, E.; Auer, M. Plant cell walls throughout evolution: Towards a molecular understanding of their design principles. J. Exp. Bot. 2009, 60, 3615–3635. [Google Scholar] [CrossRef]
- Mosier, N.; Wyman, C.; Dale, B.; Elander, R.; Lee, Y.Y.; Holtzapple, M.; Ladisch, M. Features of promising technologies for pretreatment of lignocellulosic biomass. Bioresource Technol. 2005, 96, 673–686. [Google Scholar] [CrossRef]
- Agbor, V.B.; Cicek, N.; Sparling, R.; Berlin, A.; Levin, D.B. Biomass pretreatment: Fundamentals toward application. Biotechnol. Adv. 2011, 29, 675–685. [Google Scholar] [CrossRef]
- Hendriks, A.T.W.M.; Zeeman, G. Pretreatments to enhance the digestibility of lignocellulosic biomass. Bioresource Technol. 2008, 100, 10–18. [Google Scholar] [CrossRef]
- Alvira, P.; Tomás-Pejó, E.; Ballesteros, M.; Negro, M.J. Pretreatment technologies for an efficient bioethanol production process based on enzymatic hydrolysis: A review. Bioresource Technol. 2010, 101, 4851–4861. [Google Scholar]
- Zha, Y.; Slomp, R.; Groenestijn, J.; Punt, P.J. Preparation and Evaluation of Lignocellulosic Biomass Hydrolysates for Growth by Ethanologenic Yeasts. In Microbial Metabolic Engineering: Methods and Protocols; Qiong, C., Ed.; Humana Press: New York, USA, 2012; pp. 245–259. [Google Scholar]
- Palmqvist, E.; Hahn-Hägerdal, B. Fermentation of lignocellulosic hydrolysates. II: Inhibitors and mechanisms of inhibition. Bioresource Technol. 2000, 74, 25–33. [Google Scholar] [CrossRef]
- Klinke, H.B.; Thomsen, A.B.; Ahring, B.K. Inhibition of ethanol-producing yeast and bacteria by degradation products produced during pre-treatment of biomass. Appl. Microbiol. Biot. 2004, 66, 10–26. [Google Scholar] [CrossRef]
- Fiehn, O. Metabolomics—the link between genotypes and phenotypes. Plant Mol. Biol. 2002, 48, 155–171. [Google Scholar] [CrossRef]
- Roessner, U.; Bowne, J. What is metabolomics all about? Biotechniques 2009, 46, 363–365. [Google Scholar] [CrossRef]
- Van der Werf, M.J.; Overkamp, K.M.; Muilwijk, B.; Coulier, L.; Hankemeier, T. Microbial metabolomics: Toward a platform with full metabolome coverage. Anal. Biochem. 2007, 370, 17–25. [Google Scholar] [CrossRef]
- Fukusaki, E.; Kobayashi, A. Plant metabolomics: potential for practical operation. J. Biosci. Bioeng. 2005, 100, 347–354. [Google Scholar] [CrossRef]
- Nicolaou, S.A.; Gaida, S.M.; Papoutsakis, E.T. A comparative view of metabolite and substrate stress and tolerance in microbial bioprocessing: From biofuels and chemicals, to biocatalysis and bioremediation. Metab. Eng. 2010, 12, 307–331. [Google Scholar] [CrossRef]
- Braaksma, M.; Bijlsma, S.; Coulier, L.; Punt, P.J.; van der Werf, M.J. Metabolomics as a tool for target identification in strain improvement: the influence of phenotype definition. Microbiology 2011, 157, 147–159. [Google Scholar] [CrossRef]
- Ding, M.; Tian, H.; Cheng, J.; Yuan, Y. Inoculum size-dependent interactive regulation of metabolism and stress response of Saccharomyces cerevisiae revealed by comparative metabolomics. J. Biotechnol. 2009, 144, 279–286. [Google Scholar] [CrossRef]
- van Ravenzwaay, B.; Cunha, G.C.; Leibold, E.; Looser, R.; Mellert, W.; Prokoudine, A.; Walk, T.; Wiemer, J. The use of metabolomics for the discovery of new biomarkers of effect. Toxicol. Lett. 2007, 172, 21–28. [Google Scholar] [CrossRef]
- Gu, H.; Pan, Z.; Xi, B.; Asiago, V.; Musselman, B.; Raftery, D. Principal component directed partial least squares analysis for combining nuclear magnetic resonance and mass spectrometry data in metabolomics: Application to the detection of breast cancer. Anal. Chim. Acta 2011, 686, 57–63. [Google Scholar] [CrossRef]
- Dunn, W.B.; Ellis, D.I. Metabolomics: Current analytical platforms and methodologies. TRAC-Trend Anal. Chem. 2005, 24, 285–294. [Google Scholar] [CrossRef]
- Mashego, M.; Rumbold, K.; De Mey, M.; Vandamme, E.; Soetaert, W.; Heijnen, J. Microbial metabolomics: past, present and future methodologies. Biotechnol. Lett. 2007, 29, 1–16. [Google Scholar]
- van der Werf, M.J.; Jellema, R.H.; Hankemeier, T. Microbial metabolomics: replacing trial-and-error by the unbiased selection and ranking of targets. J. Ind. Microbiol. Biot. 2005, 32, 234–252. [Google Scholar] [CrossRef]
- Villas-Bôas, S.G.; Noel, S.; Lane, G.A.; Attwood, G.; Cookson, A. Extracellular metabolomics: A metabolic footprinting approach to assess fiber degradation in complex media. Anal. Biochem. 2006, 349, 297–305. [Google Scholar] [CrossRef]
- Bino, R.J.; Hall, R.D.; Fiehn, O.; Kopka, J.; Saito, K.; Draper, J.; Nikolau, B.J.; Mendes, P.; Roessner-Tunali, U.; Beale, M.H.; Trethewey, R.N.; Lange, B.M.; Wurtele, E.S.; Sumner, L.W. Potential of metabolomics as a functional genomics tool. Trends Plant Sci. 2004, 9, 418–425. [Google Scholar] [CrossRef]
- Westerhuis, J.; Hoefsloot, H.; Smit, S.; Vis, D.; Smilde, A.; van Velzen, E.; van Duijnhoven, J.; van Dorsten, F. Assessment of PLSDA cross validation. Metabolomics 2008, 4, 81–89. [Google Scholar] [CrossRef]
- Rubingh, C.; Bijlsma, S.; Derks, E.; Bobeldijk, I.; Verheij, E.; Kochhar, S.; Smilde, A. Assessing the performance of statistical validation tools for megavariate metabolomics data. Metabolomics 2006, 2, 53–61. [Google Scholar] [CrossRef]
- Verouden, M.P.H.; Westerhuis, J.A.; van der Werf, M.J.; Smilde, A.K. Exploring the analysis of structured metabolomics data. Chemometr. Intell. Lab. 2009, 98, 88–96. [Google Scholar] [CrossRef]
- Gibon, Y.; Rolin, D. Aspects of Experimental Design for Plant Metabolomics Experiments and Guidelines for Growth of Plant Material. In Plant Metabolomics: Methods and Protocols; Hardy, N.W., Hall, R.D., Eds.; Humana Press: New York, USA, 2012; pp. 13–30. [Google Scholar]
- Kristal, B.; Shurubor, Y.; Paolucci, U.; Matson, W. Methodological Issues and Experimental Design Considerations in Metabolic Profile-Based Classifications. In Metabolome Analyses: Strategies for Systems Biology; Vaidyanathan, S., Harrigan, G.G., Goodacre, R., Eds.; Springer: New York, USA, 2005; pp. 173–194. [Google Scholar]
- Qualley, A.V.; Dudareva, N. Metabolomics of Plant Volatiles. In Plant Systems Biology; Belostotsky, D.A., Ed.; Humana Press: New York, USA, 2009; pp. 329–343. [Google Scholar]
- Schauer, N.; Fernie, A.R. Plant metabolomics: towards biological function and mechanism. Trends Plant Sci. 2006, 11, 508–516. [Google Scholar] [CrossRef]
- Lee, Y.C. Carbohydrate analyses with high-performance anion-exchange chromatography. J. Chromatogr. A 1996, 720, 137–149. [Google Scholar] [CrossRef]
- Bowman, M.J.; Dien, B.S.; Hector, R.E.; Sarath, G.; Cotta, M.A. Liquid chromatography–mass spectrometry investigation of enzyme-resistant xylooligosaccharide structures of switchgrass associated with ammonia pretreatment, enzymatic saccharification, and fermentation. Bioresource Technol. 2012, 110, 437–447. [Google Scholar] [CrossRef]
- Roessner, U.; Nahid, A.; Chapman, B.; Hunter, A.; Bellgard, M. Metabolomics – The Combination of Analytical Biochemistry, Biology, and Informatics. In Comprehensive Biotechnology, 2nd; Moo-Young, M., Ed.; Academic Press: Burlington, Canada, 2011; pp. 447–459. [Google Scholar]
- van den Berg, R.; Hoefsloot, H.C.J.; Westerhuis, J.; Smilde, A.; van der Werf, M.J. Centering, scaling, and transformations: improving the biological information content of metabolomics data. BMC Genomics 2006, 7, 142. [Google Scholar]
- Daffertshofer, A.; Lamoth, C.J.C.; Meijer, O.G.; Beek, P.J. PCA in studying coordination and variability: a tutorial. Clin. Biomech. 2004, 19, 415–428. [Google Scholar] [CrossRef]
- Krishnan, A.; Williams, L.J.; McIntosh, A.R.; Abdi, H. Partial Least Squares (PLS) methods for neuroimaging: A tutorial and review. Neuroimage 2011, 56, 455–475. [Google Scholar] [CrossRef]
- Lutz, U.; Lutz, R.W.; Lutz, W.K. Metabolic profiling of glucuronides in human urine by LC-MS/MS and partial least-squares discriminant analysis for classification and prediction of gender. Anal. Chem. 2006, 78, 4564–4571. [Google Scholar] [CrossRef]
- Thissen, U.; Coulier, L.; Overkamp, K.M.; Jetten, J.; van der Werff, B.J.C.; van de Ven, T.; van der Werf, M.J. A proper metabolomics strategy supports efficient food quality improvement: A case study on tomato sensory properties. Food Qual. Prefer. 2011, 22, 499–506. [Google Scholar] [CrossRef]
- Gruben, B.S. General introduction. PhD thesis: Novel transcriptional activators of Aspergillus involved in plant biomass utilization 2012, 3–49. [Google Scholar]
- Taherzadeh, M.J.; Karimi, K. Fermentation Inhibitors in Ethanol Processes and Different Strategies to Reduce Their Effects. In Biofuels: Alternative Feedstocks and Conversion Processes; Pandey, A., Larroche, C., Ricke, S.C., Dussap, C.-G., Gnansounou, E., Eds.; Academic Press: Waltham, Massachusetts, USA, 2011; pp. 287–311. [Google Scholar]
- Almeida, J.R.M.; Modig, T.; Petersson, A.; Hähn-Hägerdal, B.; Lidén, G.; Gorwa-Grauslund, M.F. Increased tolerance and conversion of inhibitors in lignocellulosic hydrolysates by Saccharomyces cerevisiae. J. Chem. Technol. Biot. 2007, 82, 340–349. [Google Scholar] [CrossRef]
- Ando, S.; Arai, I.; Kiyoto, K.; Hanai, S. Identification of aromatic monomers in steam-exploded poplar and their influences on ethanol fermentation by Saccharomyces cerevisiae. J. Ferment. Technol. 1986, 64, 567–570. [Google Scholar] [CrossRef]
- Nichols, N.N.; Sharma, L.N.; Mowery, R.A.; Chambliss, C.K.; Van Walsum, G.P.; Dien, B.S.; Iten, L.B. Fungal metabolism of fermentation inhibitors present in corn stover dilute acid hydrolysate. Enzyme Microb. Tech. 2008, 42, 624–630. [Google Scholar] [CrossRef]
- Raj, A.; Krishna Reddy, M.M.; Chandra, R. Identification of low molecular weight aromatic compounds by gas chromatography–mass spectrometry (GC–MS) from kraft lignin degradation by three Bacillus sp. Int. Biodeter. Biodegr. 2007, 59, 292–296. [Google Scholar] [CrossRef]
- Koo, B.W.; Park, N.; Jeong, H.S.; Choi, J.W.; Yeo, H.; Choi, I.G. Characterization of by-products from organosolv pretreatments of yellow poplar wood (Liriodendron tulipifera) in the presence of acid and alkali catalysts. J. Ind. Eng. Chem. 2011, 17, 18–24. [Google Scholar] [CrossRef]
- Larsson, S.; Quintana-Sáinz, A.; Reimann, A.; Nilvebrant, N.O.; Jönsson, L.J. Influence of lignocellulose-derived aromatic compounds on oxygen-limited growth and ethanolic fermentation by Saccharomyces cerevisiae. Appl. Biochem. Biotech. 2000, 84–86, 617–632. [Google Scholar]
- Ranatunga, T.D.; Jervis, J.; Helm, R.F.; McMillan, J.D.; Hatzis, C. Identification of inhibitory components toxic toward Zymomonas mobilis CP4(pZB5) xylose fermentation. Appl. Biochem. Biotech. 1997, 67, 185–198. [Google Scholar] [CrossRef]
- Chen, S.F.; Mowery, R.A.; Castleberry, V.A.; van, W.G.; Chambliss, C.K. High-performance liquid chromatography method for simultaneous determination of aliphatic acid, aromatic acid and neutral degradation products in biomass pretreatment hydrolysates. J. Chromatogr. A 2006, 1104, 54–61. [Google Scholar] [CrossRef]
- Vaher, M.; Helmja, K.; Käsper, A.; Kurašin, M.; Väljamäe, P.; Kudrjašova, M.; Koel, M.; Kaljurand, M. Capillary electrophoretic monitoring of hydrothermal pre-treatment and enzymatic hydrolysis of willow: Comparison with HPLC and NMR. Catal. Today. in press.
- Chundawat, S.P.S.; Vismeh, R.; Sharma, L.N.; Humpula, J.F.; da Costa Sousa, L.; Chambliss, C.K.; Jones, A.D.; Balan, V.; Dale, B.E. Multifaceted characterization of cell wall decomposition products formed during ammonia fiber expansion (AFEX) and dilute acid based pretreatments. Bioresource Technol. 2010, 101, 8429–8438. [Google Scholar]
- Heer, D.; Sauer, U. Identification of furfural as a key toxin in lignocellulosic hydrolysates and evolution of a tolerant yeast strain. Microbial Biotechnology 2008, 1, 497–506. [Google Scholar] [CrossRef]
- Kolb, M.; Sieber, V.; Amann, M.; Faulstich, M.; Schieder, D. Removal of monomer delignification products by laccase from Trametes versicolor. Bioresource Technol. 2012, 104, 298–304. [Google Scholar] [CrossRef]
- Jönsson, L.J.; Palmqvist, E.; Nilvebrant, N.-O.; Hahn-Hägerdal, B. Detoxification of wood hydrolysates with laccase and peroxidase from the white-rot fungus Trametes versicolor. Appl. Microbiol. Biotechnol. 1998, 49, 691–697. [Google Scholar] [CrossRef]
- Huang, H.; Guo, X.; Li, D.; Liu, M.; Wu, J.; Ren, H. Identification of crucial yeast inhibitors in bio-ethanol and improvement of fermentation at high pH and high total solids. Bioresource Technol. 2011, 102, 7486–7493. [Google Scholar]
- Klinke, H.B.; Olsson, L.; Thomsen, A.B.; Ahring, B.K. Potential inhibitors from wet oxidation of wheat straw and their effect on ethanol production of Saccharomyces cerevisiae: Wet oxidation and fermentation by yeast. Biotechnol. Bioeng. 2003, 81, 738–747. [Google Scholar]
- Larsson, S.; Reimann, A.; Nilvebrant, N.-.; Jönsson, L.J. Comparison of different methods for the detoxification of lignocellulose hydrolyzates of spruce. Appl. Biochem. Biotech. 1999, 77, 91–103. [Google Scholar] [CrossRef]
- Klinke, H.B.; Ahring, B.K.; Schmidt, A.S.; Thomsen, A.B. Characterization of degradation products from alkaline wet oxidation of wheat straw. Bioresource Technol. 2002, 82, 15–26. [Google Scholar] [CrossRef]
- Panagiotopoulos, I.A.; Bakker, R.R.; de Vrije, T.; Koukios, E.G. Effect of pretreatment severity on the conversion of barley straw to fermentable substrates and the release of inhibitory compounds. Bioresource Technol. 2011, 102, 11204–11211. [Google Scholar] [CrossRef]
- Larsson, S.; Palmqvist, E.; Hahn-Hägerdal, B.; Tengborg, C.; Stenberg, K.; Zacchi, G.; Nilvebrant, N.-O. The generation of fermentation inhibitors during dilute acid hydrolysis of softwood. Enzyme Microb. Technol. 1999, 24, 151–159. [Google Scholar] [CrossRef]
- Liu, Z.L.; Slininger, P.J.; Dien, B.S.; Berhow, M.A.; Kurtzman, C.P.; Gorsich, S.W. Adaptive response of yeasts to furfural and 5-hydroxymethylfurfural and new chemical evidence for HMF conversion to 2,5-bis-hydroxymethylfuran. J. Ind. Microbiol. Biot. 2004, 31, 345–352. [Google Scholar]
- Lu, X.; Yamauchi, K.; Phaiboonsilpa, N.; Saka, S. Two-step hydrolysis of Japanese beech as treated by semi-flow hot-compressed water. J. Wood Sci. 2009, 55, 367–375. [Google Scholar] [CrossRef]
- Humpula, J.F.; Chundawat, S.P.S.; Vismeh, R.; Jones, A.D.; Balan, V.; Dale, B.E. Rapid quantification of major reaction products formed during thermochemical pretreatment of lignocellulosic biomass using GC–MS. J. Chromatogr. B 2011, 879, 1018–1022. [Google Scholar] [CrossRef]
- Zha, Y.; Muilwijk, B.; Coulier, L.; Punt, P. Inhibitory Compounds in Lignocellulosic Biomass Hydrolysates during Hydrolysate Fermentation Processes. J. Bioprocess Biotechniq. 2012, 2. [Google Scholar] [CrossRef]
- Sharma, L.N.; Becker, C.; Chambliss, K.C. Analytical Characterization of Fermentation Inhibitors in Biomass Pretreatment Samples Using Liquid Chromatography, UV-Visible Spectroscopy, and Tandem Mass Spectrometry. In Biofuels: Methods and Protocols; Mielenz, J.R., Ed.; Humana Press: New York, USA, 2009; pp. 125–143. [Google Scholar]
- Delgenes, J.P.; Moletta, R.; Navarro, J.M. Effects of lignocellulose degradation products on ethanol fermentations of glucose and xylose by Saccharomyces cerevisiae, Zymomonas mobilis, Pichia stipitis, and Candida shehatae. Enzyme Microb. Technol. 1996, 19, 220–225. [Google Scholar] [CrossRef]
- Palmqvist, E.; Hahn-Hägerdal, B. Fermentation of lignocellulosic hydrolysates. I: inhibition and detoxification. Bioresource Technol. 2000, 74, 17–24. [Google Scholar] [CrossRef]
- Alriksson, B.; Cavka, A.; Jönsson, L.J. Improving the fermentability of enzymatic hydrolysates of lignocellulose through chemical in-situ detoxification with reducing agents. Bioresource Technol. 2011, 102, 1254–1263. [Google Scholar] [CrossRef]
- Huang, X.; Wang, Y.; Liu, W.; Bao, J. Biological removal of inhibitors leads to the improved lipid production in the lipid fermentation of corn stover hydrolysate by Trichosporon cutaneum. Bioresource Technol. 2011, 102, 9705–9709. [Google Scholar] [CrossRef]
- Miyafuji, H.; Danner, H.; Neureiter, M.; Thomasser, C.; Bvochora, J.; Szolar, O.; Braun, R. Detoxification of wood hydrolysates with wood charcoal for increasing the fermentability of hydrolysates. Enzyme Microb. Technol. 2003, 32, 396–400. [Google Scholar] [CrossRef]
- Millati, R.; Niklasson, C.; Taherzadeh, M.J. Effect of pH, time and temperature of overliming on detoxification of dilute-acid hydrolyzates for fermentation by Saccharomyces cerevisiae. Process Biochem. 2002, 38, 515–522. [Google Scholar] [CrossRef]
- Zhu, J.; Yong, Q.; Xu, Y.; Yu, S. Detoxification of corn stover prehydrolyzate by trialkylamine extraction to improve the ethanol production with Pichia stipitis CBS 5776. Bioresource Technol. 2011, 102, 1663–1668. [Google Scholar] [CrossRef]
- Martinez, A.; Rodriguez, M.E.; York, S.W.; Preston, J.F.; Ingram, L.O. Effects of Ca(OH)2 treatments (“overliming”) on the composition and toxicity of bagasse hemicellulose hydrolysates. Biotechnol. Bioeng. 2000, 69, 526–536. [Google Scholar] [CrossRef]
- Moreno, A.D.; Ibarra, D.; Fernández, J.L.; Ballesteros, M. Different laccase detoxification strategies for ethanol production from lignocellulosic biomass by the thermotolerant yeast Kluyveromyces marxianus CECT 10875. Bioresource Technol. 2012, 106, 101–109. [Google Scholar] [CrossRef]
- Pienkos, P.T.; Zhang, M. Role of pretreatment and conditioning processes on toxicity of lignocellulosic biomass hydrolysates. Cellulose 2009, 16, 743–762. [Google Scholar] [CrossRef]
- Taherzadeh, M.J.; Gustafsson, L.; Niklasson, C.; Lidén, G. Conversion of furfural in aerobic and anaerobic batch fermentation of glucose by Saccharomyces cerevisiae. J. Biosci. Bioeng. 1999, 87, 169–174. [Google Scholar] [CrossRef]
- Rumbold, K.; van Buijsen, H.J.J.; Gray, V.M.; van Groenestijn, J.W.; Overkamp, K.M.; Slomp, R.S.; van, d.W.; Punt, P.J. Microbial renewable feedstock utilization: A substrate-oriented approach. Bioengineered Bugs 2010, 1, 359–366. [Google Scholar] [CrossRef]
- Thomsen, M.H.; Thygesen, A.; Thomsen, A.B. Identification and characterization of fermentation inhibitors formed during hydrothermal treatment and following SSF of wheat straw. Appl. Microbiol. Biotechnol. 2009, 83, 447–455. [Google Scholar] [CrossRef]
- Chen, M.; Zhao, J.; Xia, L. Comparison of four different chemical pretreatments of corn stover for enhancing enzymatic digestibility. Biomass Bioenergy 2009, 33, 1381–1385. [Google Scholar] [CrossRef]
- Laser, M.; Schulman, D.; Allen, S.G.; Lichwa, J.; Antal, M.J.; Lynd, L.R. A comparison of liquid hot water and steam pretreatments of sugar cane bagasse for bioconversion to ethanol. Bioresource Technol. 2002, 81, 33–44. [Google Scholar] [CrossRef]
- Rabelo, S.C.; Filho, R.M.; Costa, A.C. A comparison between lime and alkaline hydrogen peroxide pretreatments of sugarcane bagasse for ethanol production. Appl. Biochem. Biotechnol. 2008, 148, 45–58. [Google Scholar] [CrossRef]
- Talebnia, F.; Karakashev, D.; Angelidaki, I. Production of bioethanol from wheat straw: An overview on pretreatment, hydrolysis and fermentation. Bioresource Technol. 2010, 101, 4744–4753. [Google Scholar] [CrossRef]
- Cardona, C.A.; Quintero, J.A.; Paz, I.C. Production of bioethanol from sugarcane bagasse: Status and perspectives. Bioresource Technol. 2010, 101, 4754–4766. [Google Scholar] [CrossRef]
- Hashaikeh, R.; Fang, Z.; Butler, I.S.; Hawari, J.; Kozinski, J.A. Hydrothermal dissolution of willow in hot compressed water as a model for biomass conversion. Fuel 2007, 86, 1614–1622. [Google Scholar] [CrossRef]
- Smit, S.; van Breemen, M.J.; Hoefsloot, H.C.J.; Smilde, A.K.; Aerts, J.M.F.G.; de Koster, C.G. Assessing the statistical validity of proteomics based biomarkers. Anal. Chim. Acta 2007, 592, 210–217. [Google Scholar] [CrossRef]
© 2013 by the authors; licensee MDPI, Basel, Switzerland. This article is an open access article distributed under the terms and conditions of the Creative Commons Attribution license (http://creativecommons.org/licenses/by/3.0/).
Share and Cite
Zha, Y.; Punt, P.J. Exometabolomics Approaches in Studying the Application of Lignocellulosic Biomass as Fermentation Feedstock. Metabolites 2013, 3, 119-143. https://doi.org/10.3390/metabo3010119
Zha Y, Punt PJ. Exometabolomics Approaches in Studying the Application of Lignocellulosic Biomass as Fermentation Feedstock. Metabolites. 2013; 3(1):119-143. https://doi.org/10.3390/metabo3010119
Chicago/Turabian StyleZha, Ying, and Peter J. Punt. 2013. "Exometabolomics Approaches in Studying the Application of Lignocellulosic Biomass as Fermentation Feedstock" Metabolites 3, no. 1: 119-143. https://doi.org/10.3390/metabo3010119