Novel Strategy for Non-Targeted Isotope-Assisted Metabolomics by Means of Metabolic Turnover and Multivariate Analysis

Abstract
:
1. Introduction
2. Results and Discussion
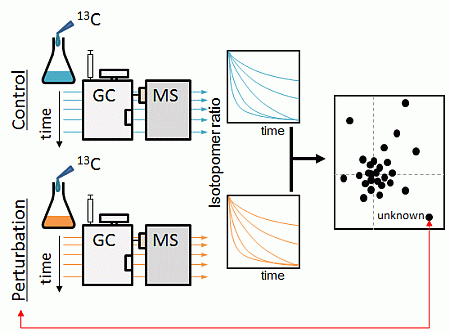
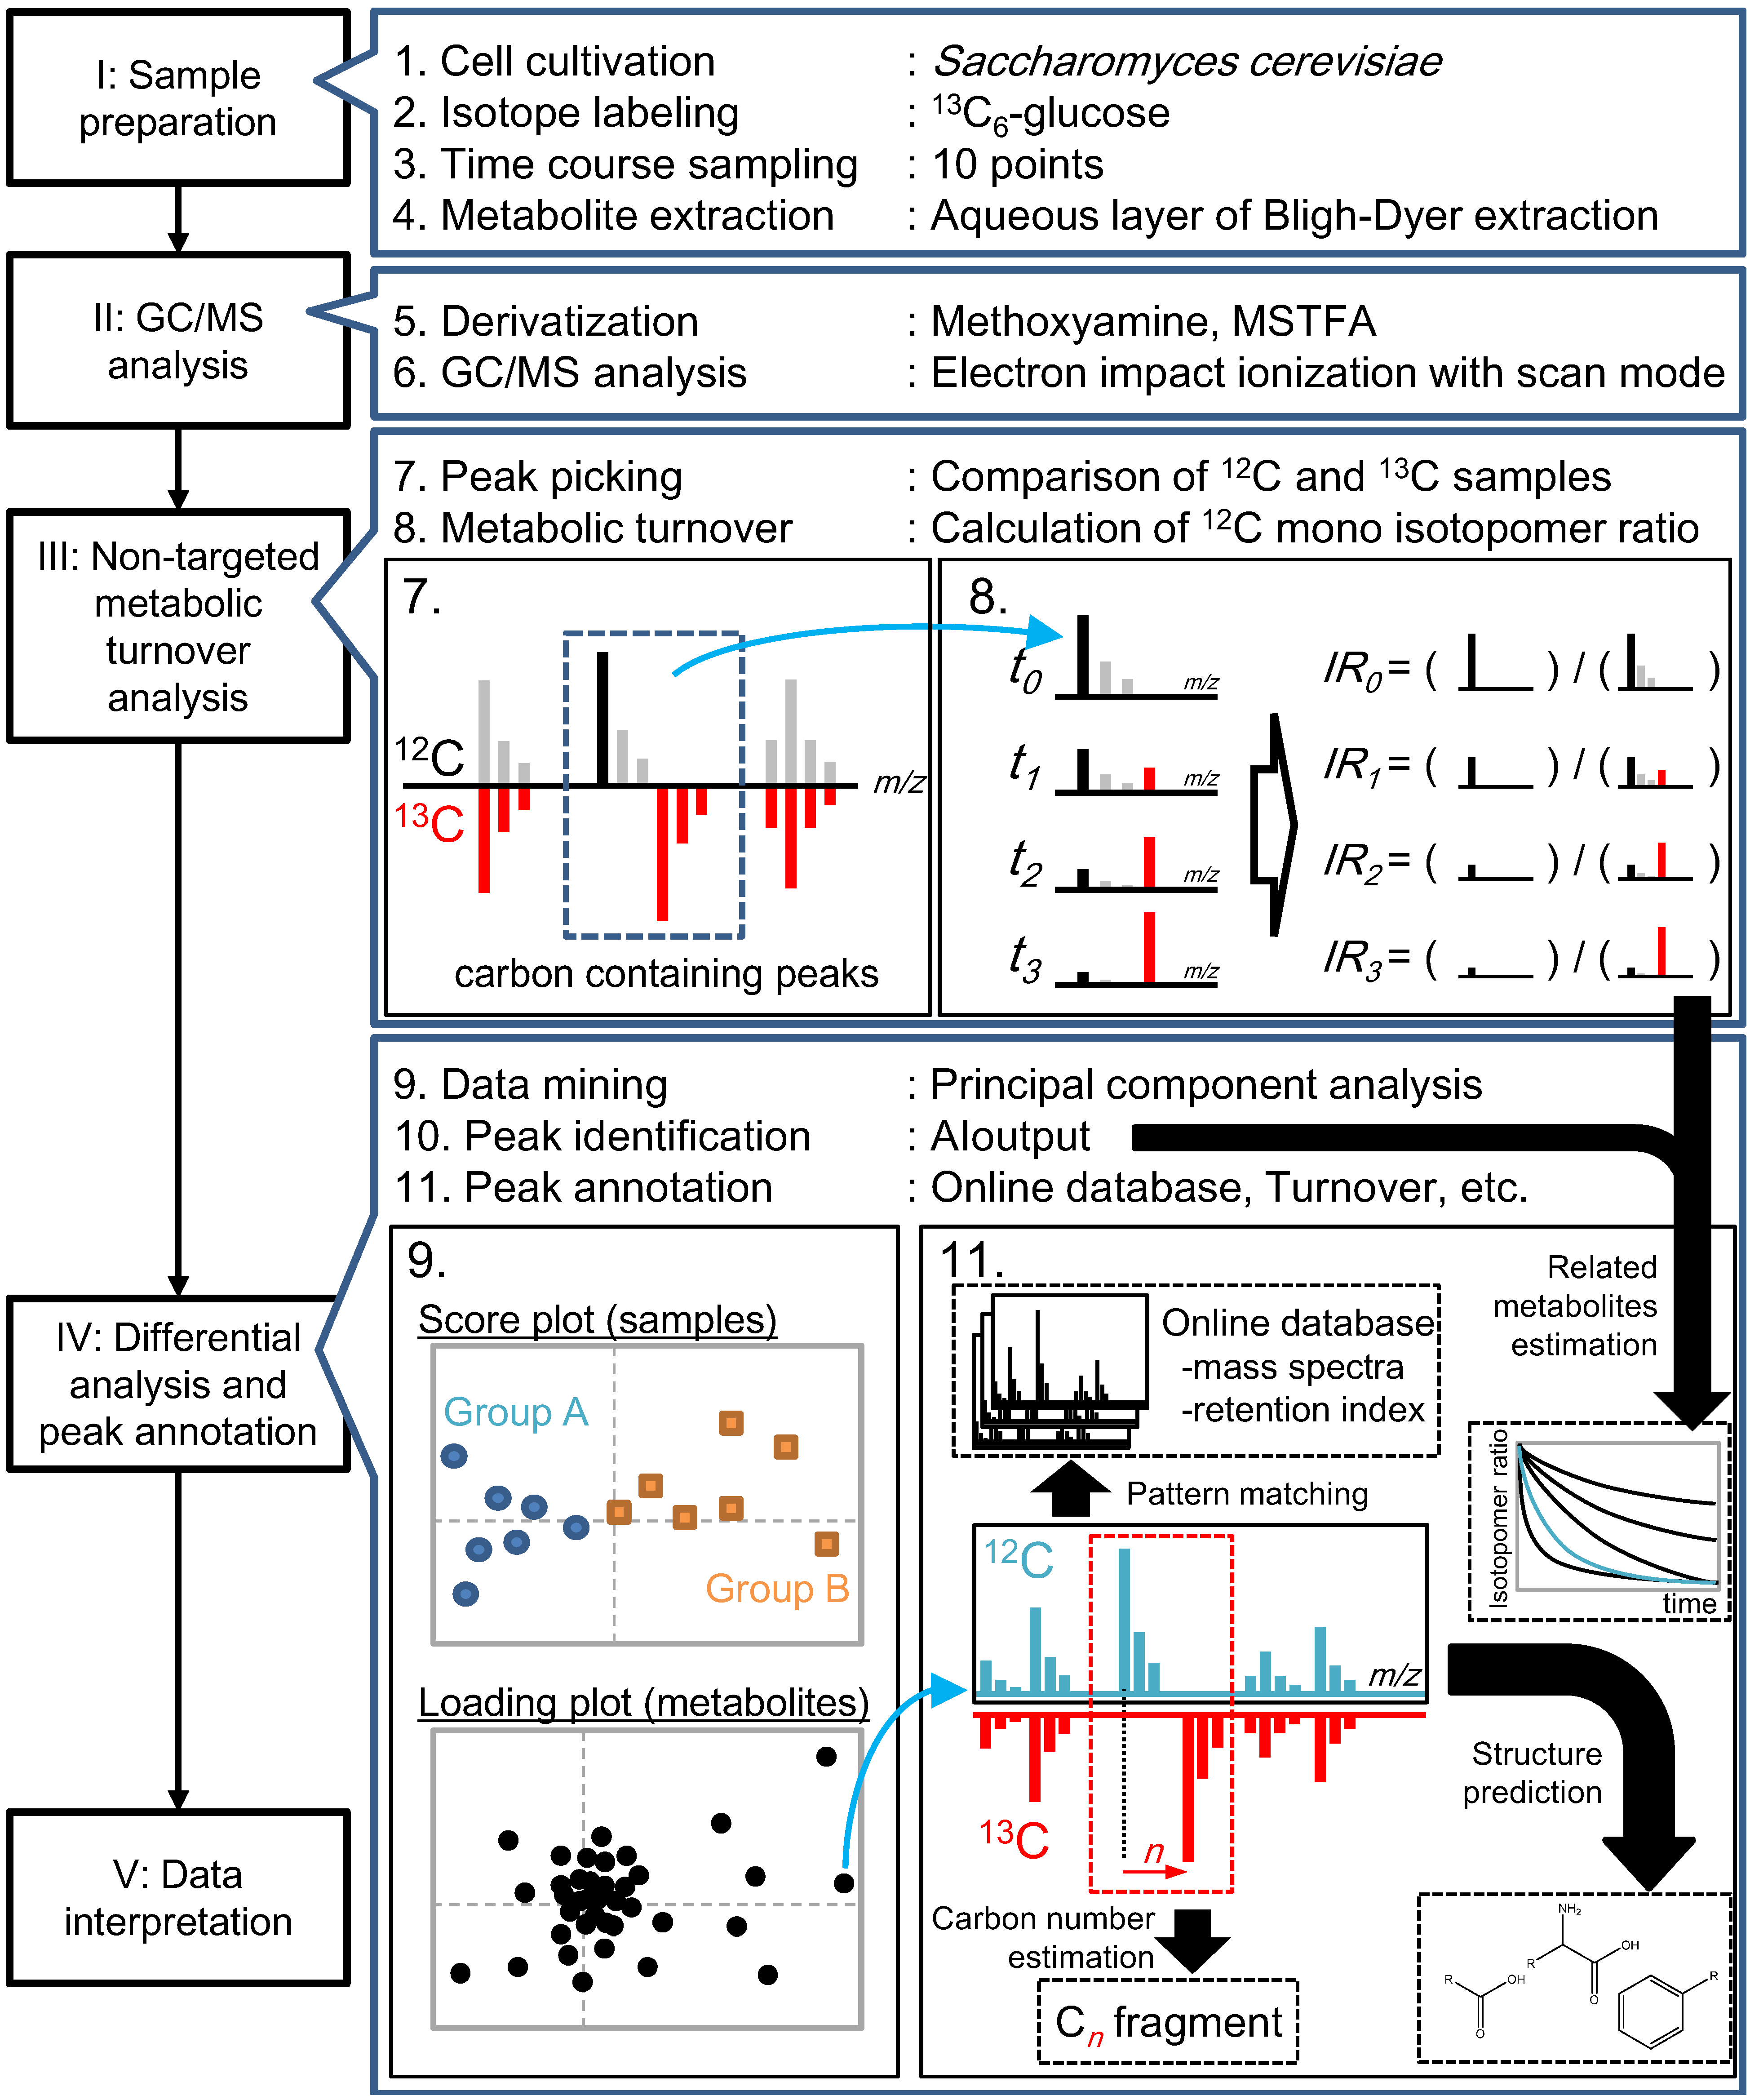
2.1. Strategy Overview
2.2. Non-Targeted Metabolic Turnover Analysis


| Peak No. | RT * (s) | RI ** | Fragment (m/z) | Automatically Identified Name *** | |
|---|---|---|---|---|---|
| 12C | 13C | ||||
| Peak-01 | 222.0 | - | 171 | 172 | |
| Peak-02 | 282.3 | 1043.8 | 174 | 177 | Pyruvate + Oxalacetic acid::C00022 + C00036 |
| Peak-03 | 318.6 | 1094.2 | 116 | 118 | Alanine_2TMS::C00041 |
| Peak-04 | 332.3 | 1115.3 | 102 | 103 | Glycine_2TMS::C00037 |
| Peak-05 | 365.0 | 1165.8 | 130 | 133 | 2-Aminobutyric acid::C02261 |
| Peak-06 | 393.0 | 1207.3 | 144 | 148 | Valine_2TMS::C00183 |
| Peak-07 | 420.0 | 1252.8 | 116 | 118 | Serine_2TMS::C00065 |
| Peak-08 | 441.0 | 1286.2 | 158 | 163 | Isoleucine_2TMS::C00407 |
| Peak-09 | 442.6 | 1288.6 | 117 | 119 | Threonine_2TMS::C00188 |
| Peak-10 | 446.4 | 1294.5 | 142 | 146 | Proline_2TMS::C00148 |
| Peak-11 | 449.4 | 1299.1 | 174 | 175 | Glycine_3TMS::C00037 |
| Peak-12 | 453.3 | 1306.2 | 247 | 251 | Succinic acid (or aldehyde)::C00042 |
| Peak-13 | 474.0 | 1343.8 | 245 | 249 | Fumaric acid::C00122 |
| Peak-14 | 477.0 | 1349.2 | 204 | 206 | Serine_3TMS::C00065 |
| Peak-15 | 480.0 | 1354.4 | 188 | 190 | Alanine_3TMS::C00041 |
| Peak-16 | 491.4 | 1374.2 | 218 | 221 | Threonine_3TMS::C00188 |
| Peak-17 | 516.0 | 1418.5 | 160 | 163 | |
| Peak-18 | 526.2 | 1438.3 | 218 | 221 | Homoserine_3TMS::C00263 |
| Peak-19 | 538.8 | 1462.1 | 232 | 234 | |
| Peak-20 | 546.0 | 1475.6 | 233 | 236 | Malic acid::C00149 |
| Peak-21 | 550.8 | 1484.4 | 188 | 193 | |
| Peak-22 | 558.0 | 1497.5 | 112 | 118 | |
| Peak-23 | 562.8 | 1507.2 | 232 | 235 | Aspartic acid_3TMS::C00049 |
| Peak-24 | 565.8 | 1513.5 | 176 | 180 | Methionine_2TMS::C00073 |
| Peak-25 | 568.8 | 1519.7 | 156 | 160 | Pyroglutamic acid::C01879 |
| Peak-26 | 571.8 | 1525.9 | 174 | 178 | 4-Aminobutyric acid::C00334 |
| Peak-27 | 574.2 | 1530.8 | 155 | 159 | |
| Peak-28 | 576.6 | 1535.8 | 227 | 231 | |
| Peak-29 | 589.2 | 1561.3 | 247 | 251 | |
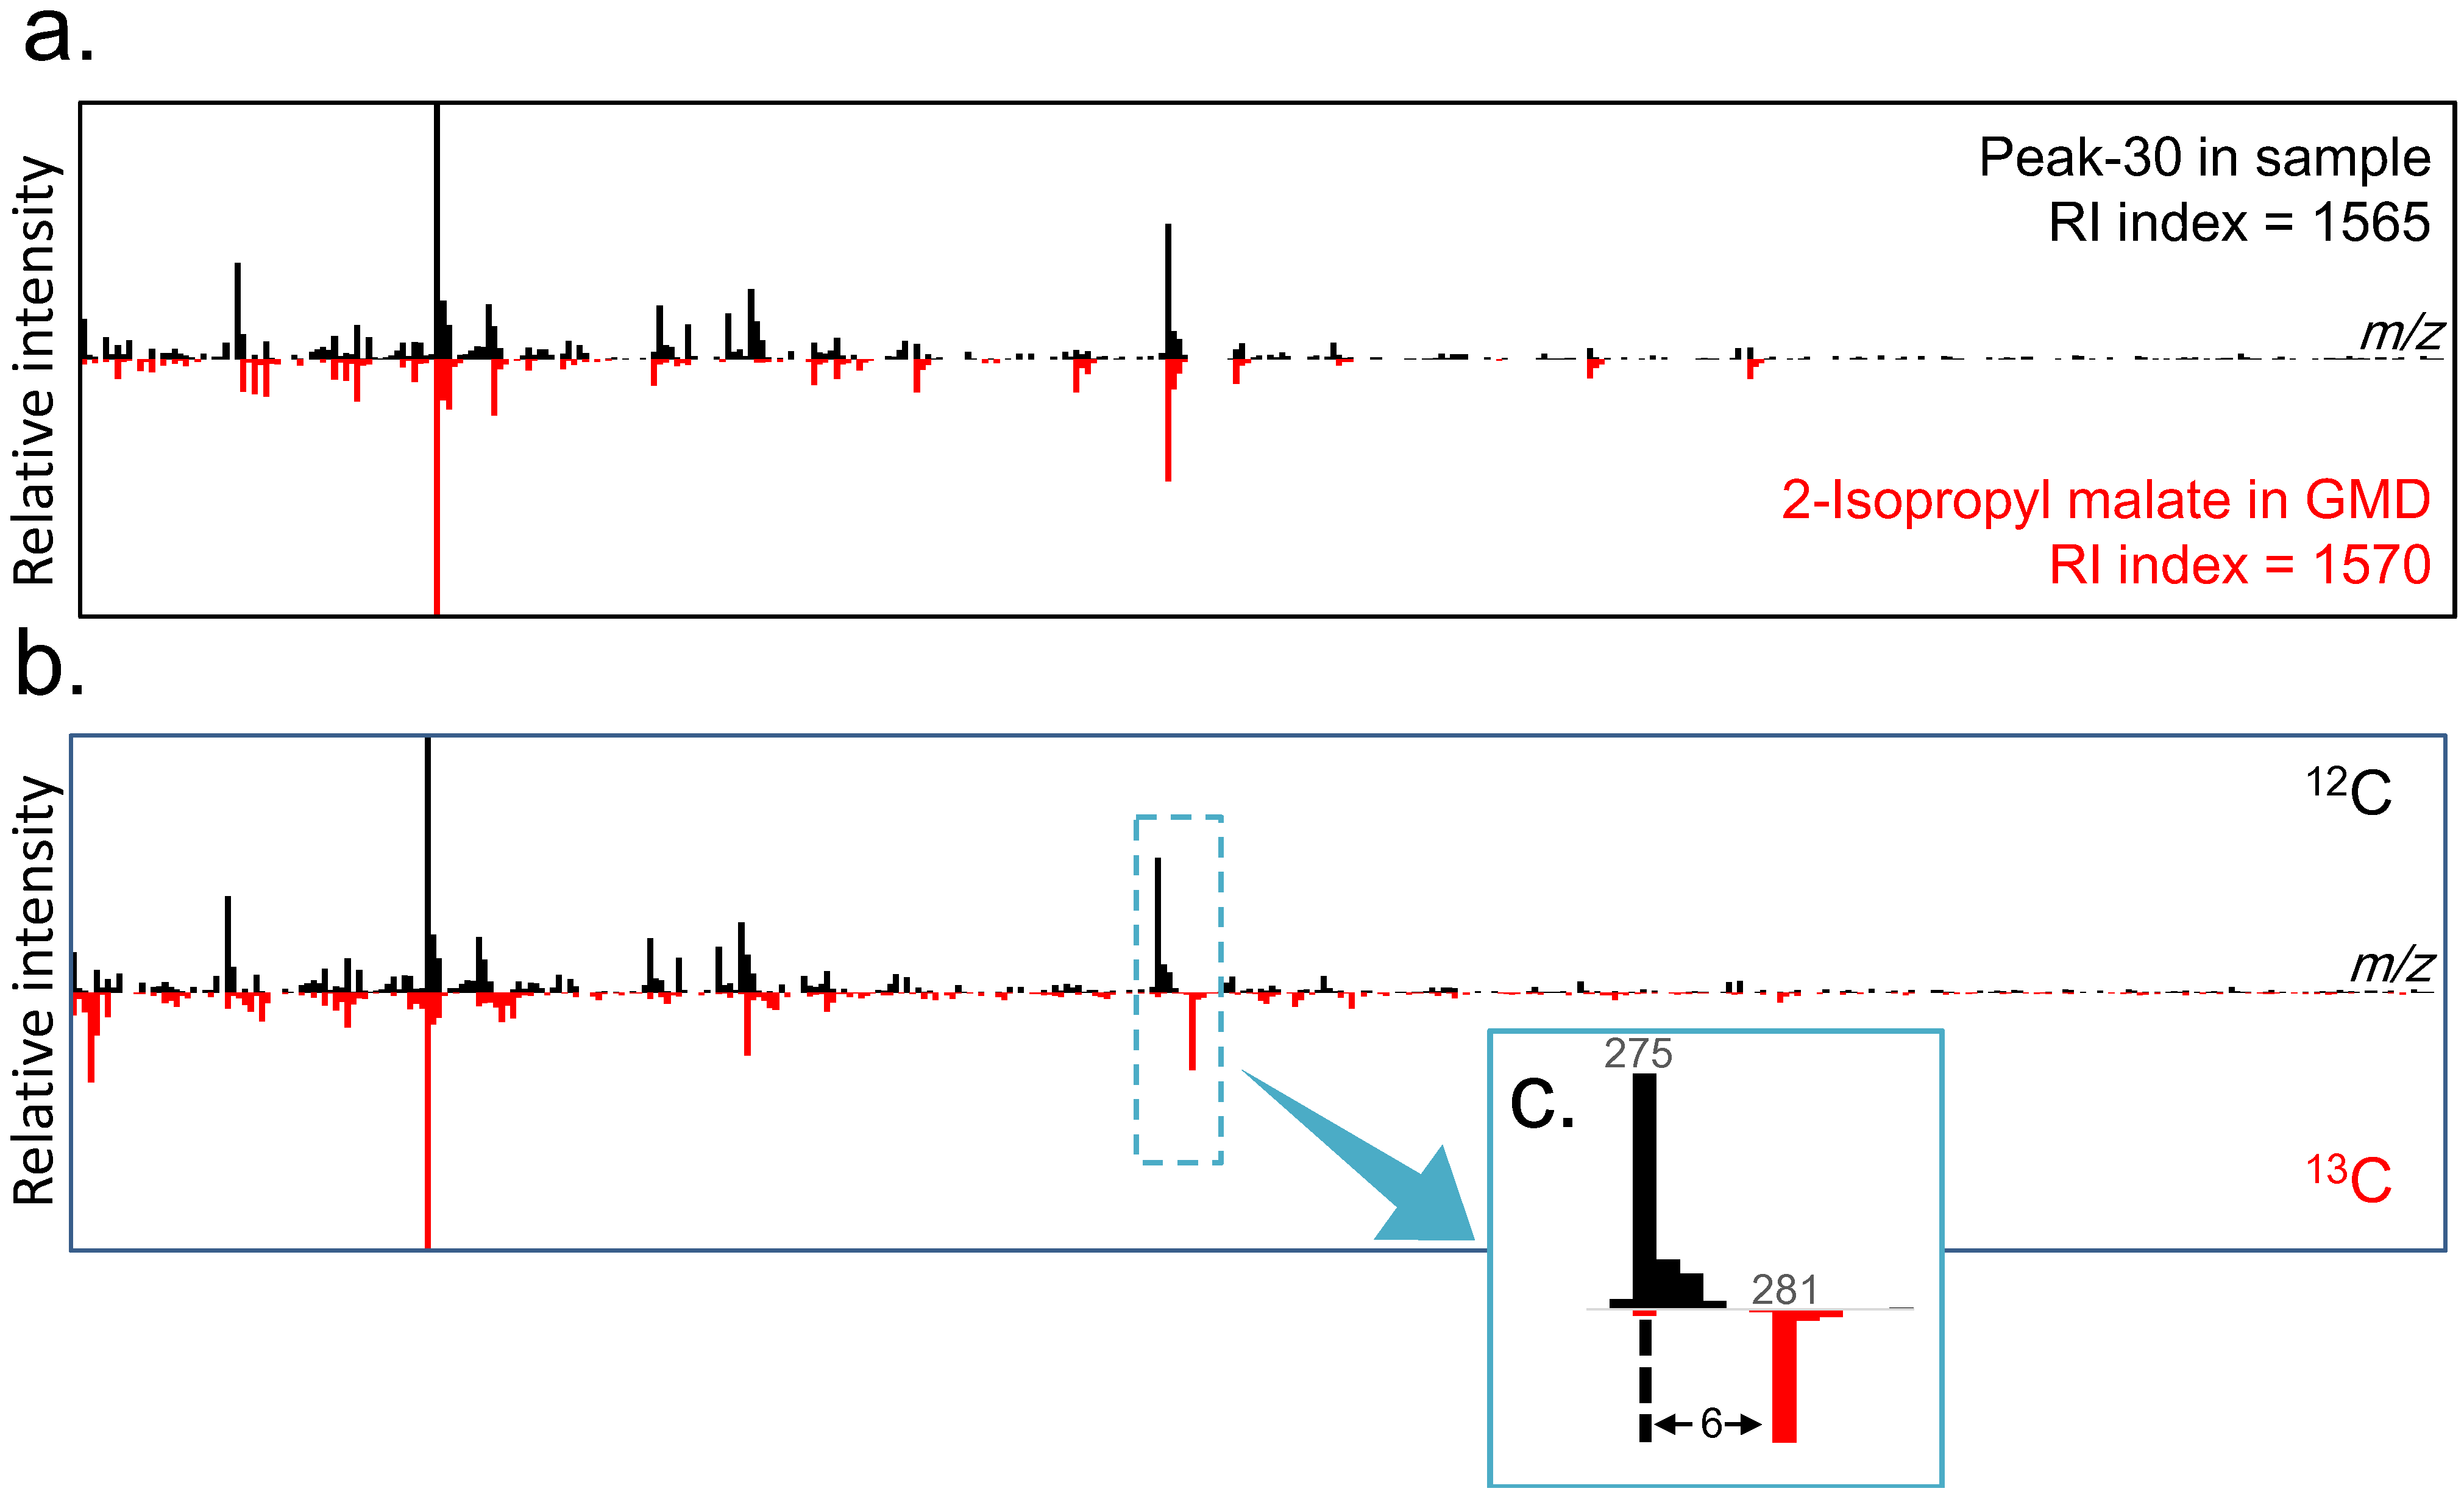
| Peak-30 | 591.0 | 1564.8 | 275 | 281 | |
| Peak-31 | 600.6 | 1583.9 | 227 | 231 | |
| Peak-32 | 609.0 | 1600.3 | 142 | 146 | |
| Peak-33 | 612.0 | 1606.9 | 246 | 250 | Glutamic acid_3TMS::C00302 |
| Peak-34 | 619.8 | 1624.1 | 192 | 200 | Phenylalanine_2TMS::C00079 |
| Peak-35 | 628.6 | 1643.1 | 116 | 118 | |
| Peak-36 | 631.8 | 1650.0 | 275 | 279 | |
| Peak-37 | 634.3 | 1655.3 | 234 | 238 | |
| Peak-38 | 636.6 | 1660.3 | 116 | 118 | Asparagine_3TMS::C00152 |
| Peak-39 | 639.0 | 1665.4 | 290 | 293 | |
| Peak-40 | 647.4 | 1683.0 | 275 | 279 | |
| Peak-41 | 653.7 | 1696.2 | 173 | 177 | |
| Peak-42 | 661.7 | 1714.4 | 227 | 231 | |
| Peak-43 | 664.4 | 1720.4 | 205 | 207 | |
| Peak-44 | 667.0 | 1726.5 | 274 | 280 | |
| Peak-45 | 672.0 | 1737.9 | 231 | 235 | |
| Peak-46 | 677.7 | 1750.8 | 217 | 220 | |
| Peak-47 | 683.4 | 1763.6 | 156 | 160 | Glutamine_3TMS::C00064 |
| Peak-48 | 699.6 | 1799.5 | 273 | 278 | Citric acid + Isocitric acid::C00158+C00311 |
| Peak-49 | 701.4 | 1803.8 | 142 | 146 | Ornithine::C00077 |
| Peak-50 | 706.8 | 1817.0 | 117 | 119 | |
| Peak-51 | 719.7 | 1847.9 | 174 | 175 | Lysine_3TMS::C00047 |
| Peak-52 | 723.6 | 1857.2 | 319 | 323 | Allose_1_Major::C01487 |
| Peak-53 | 737.1 | 1888.9 | 205 | 207 | |
| Peak-54 | 740.4 | 1896.5 | 319 | 323 | Glucose_2_Minor::C00031 |
| Peak-55 | 745.2 | 1908.5 | 174 | 175 | Lysine_4TMS::C00047 |
| Peak-56 | 747.5 | 1914.3 | 319 | 323 | |
| Peak-57 | 749.4 | 1919.2 | 254 | 259 | Histidine_3TMS::C00135 |
| Peak-58 | 753.8 | 1930.3 | 218 | 220 | |
| Peak-59 | 757.7 | 1940.3 | 217 | 220 | |
| Peak-60 | 762.6 | 1952.5 | 204 | 206 | |
| Peak-61 | 782.9 | 2003.1 | 204 | 206 | |
| Peak-62 | 807.8 | 2068.6 | 204 | 206 | |
| Peak-63 | 837.0 | 2147.1 | 326 | 331 | |
| Peak-64 | 871.7 | 2243.7 | 144 | 148 | |
| Peak-65 | 981.4 | 2578.0 | 217 | 220 | |
| Peak-66 | 1015.6 | 2691.5 | 204 | 206 | |
| Peak-67 | 1021.5 | 2711.8 | 361 | 367 | Trehalose::C01083 |
| Peak-68 | 1057.4 | 2837.7 | 361 | 367 | Melibiose_1_Major::C05402 |
| Peak-69 | 1074.6 | 2899.1 | 204 | 206 | |
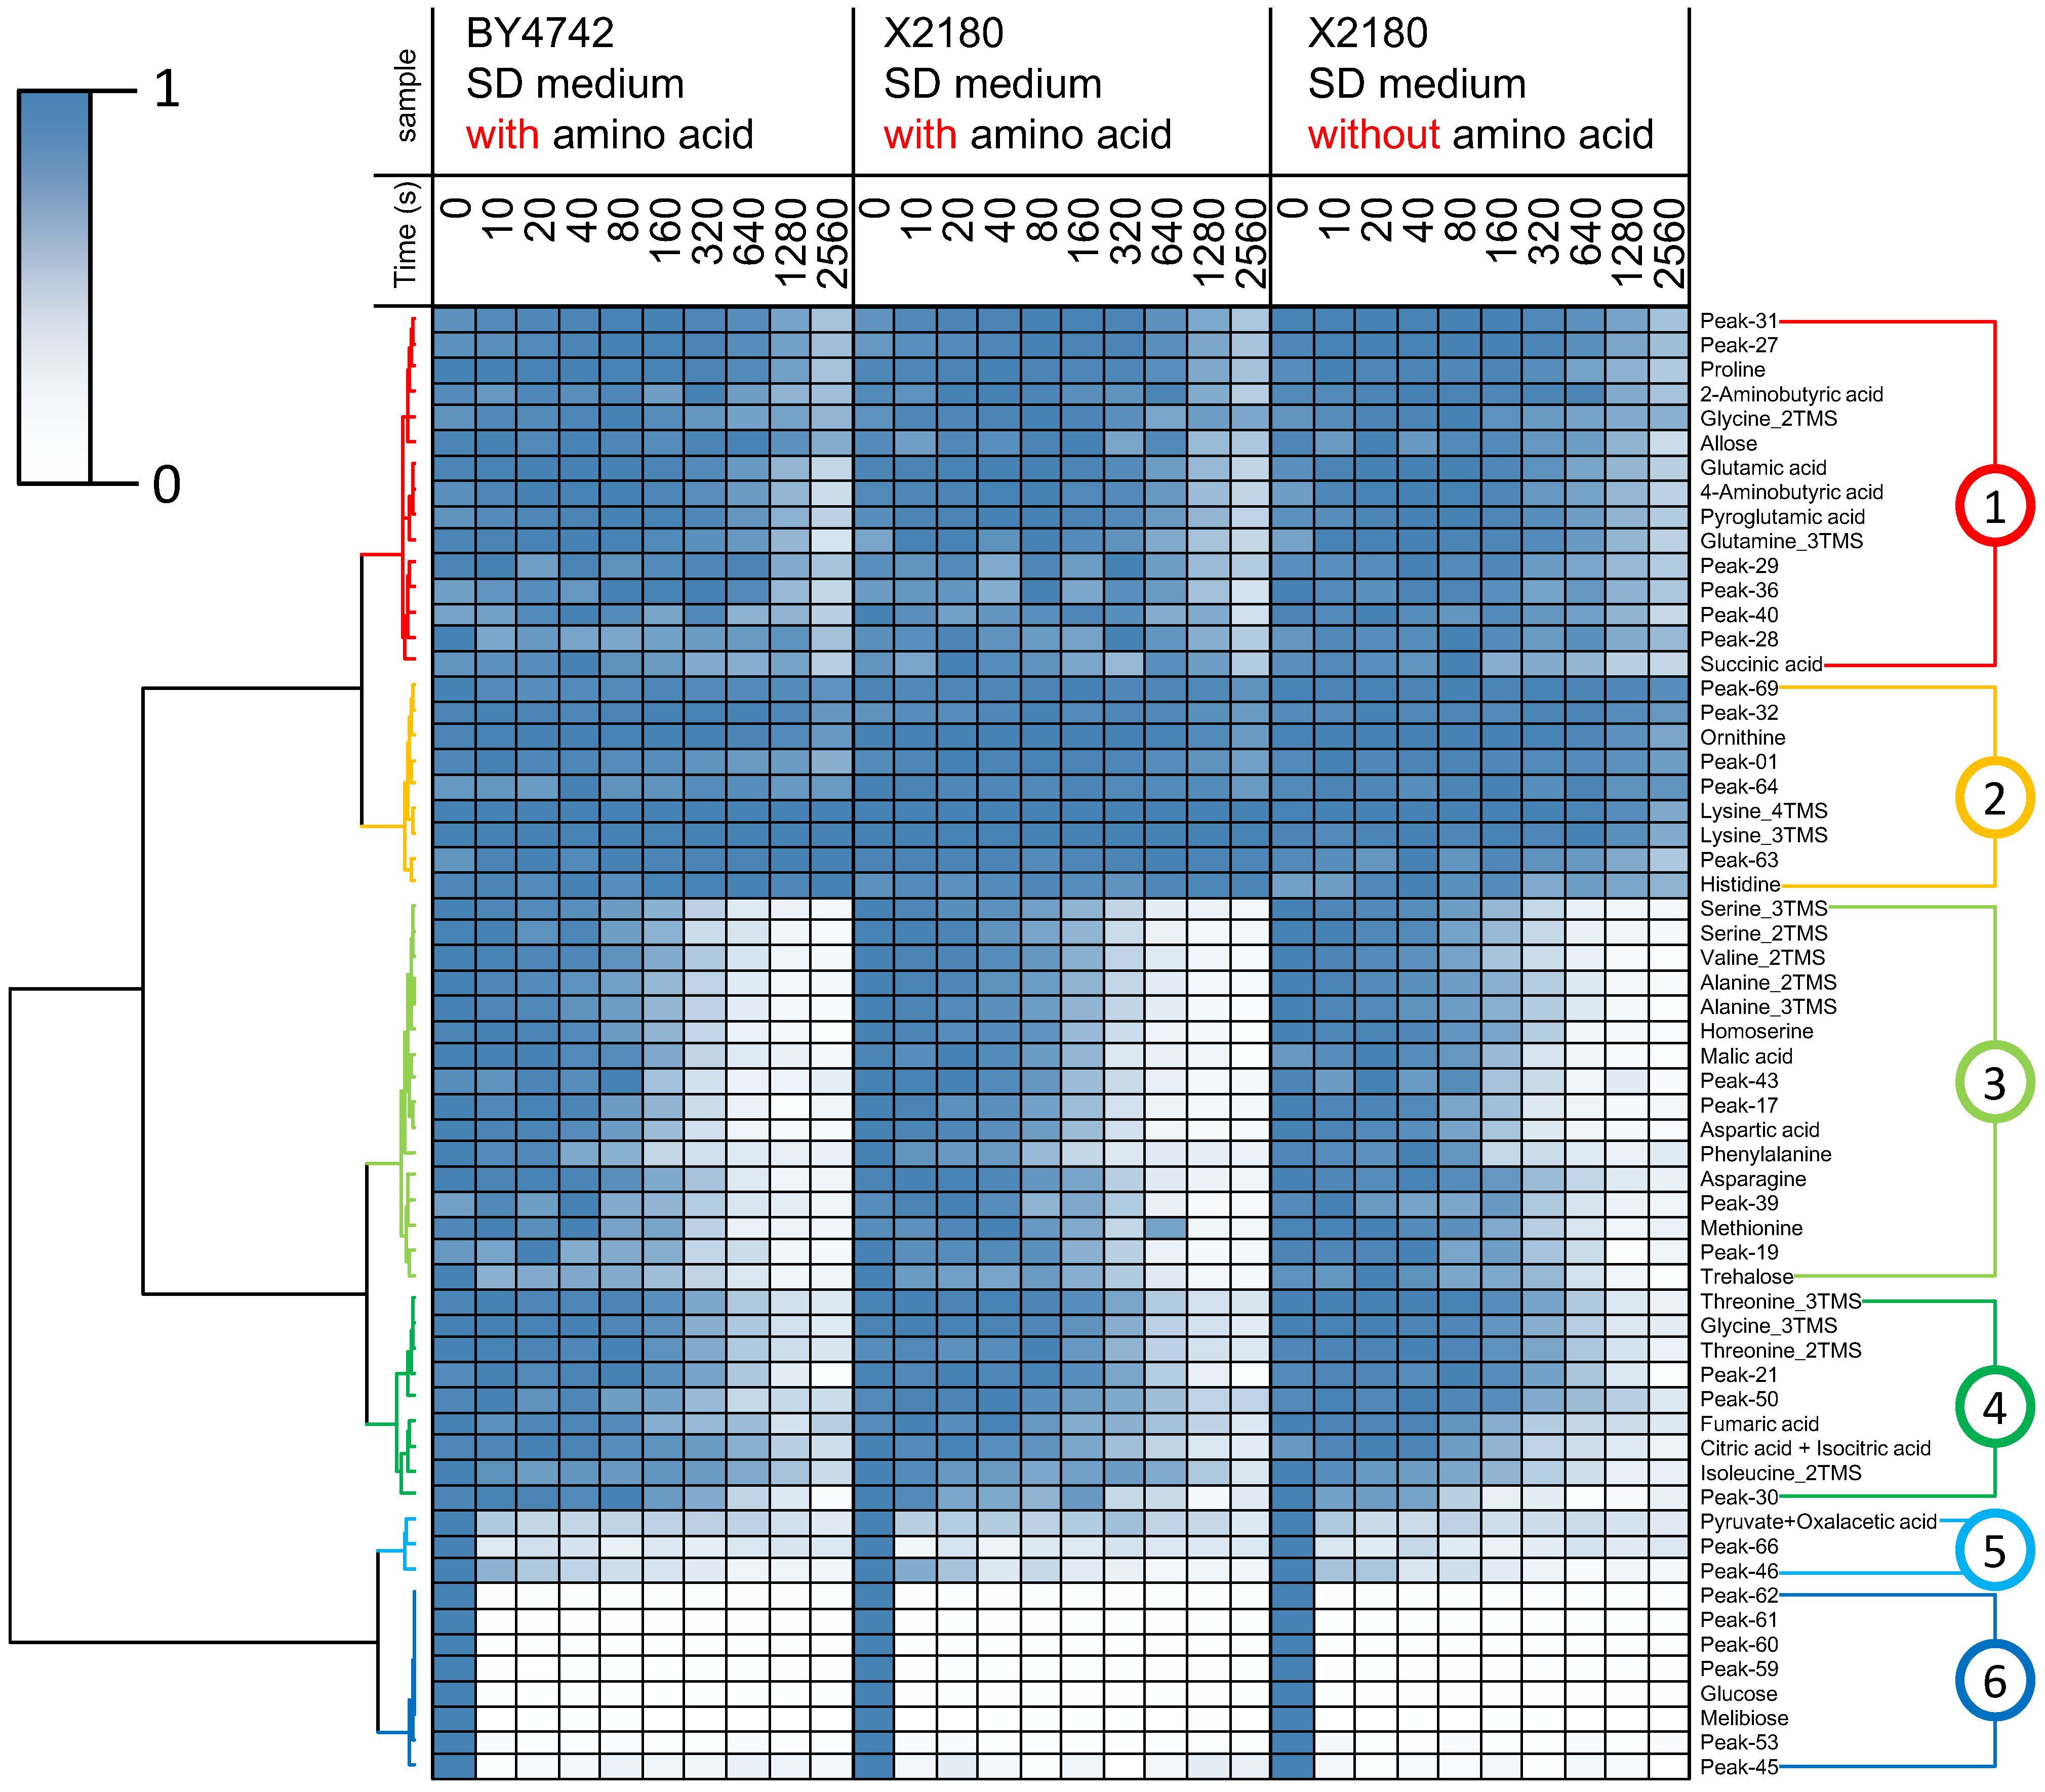
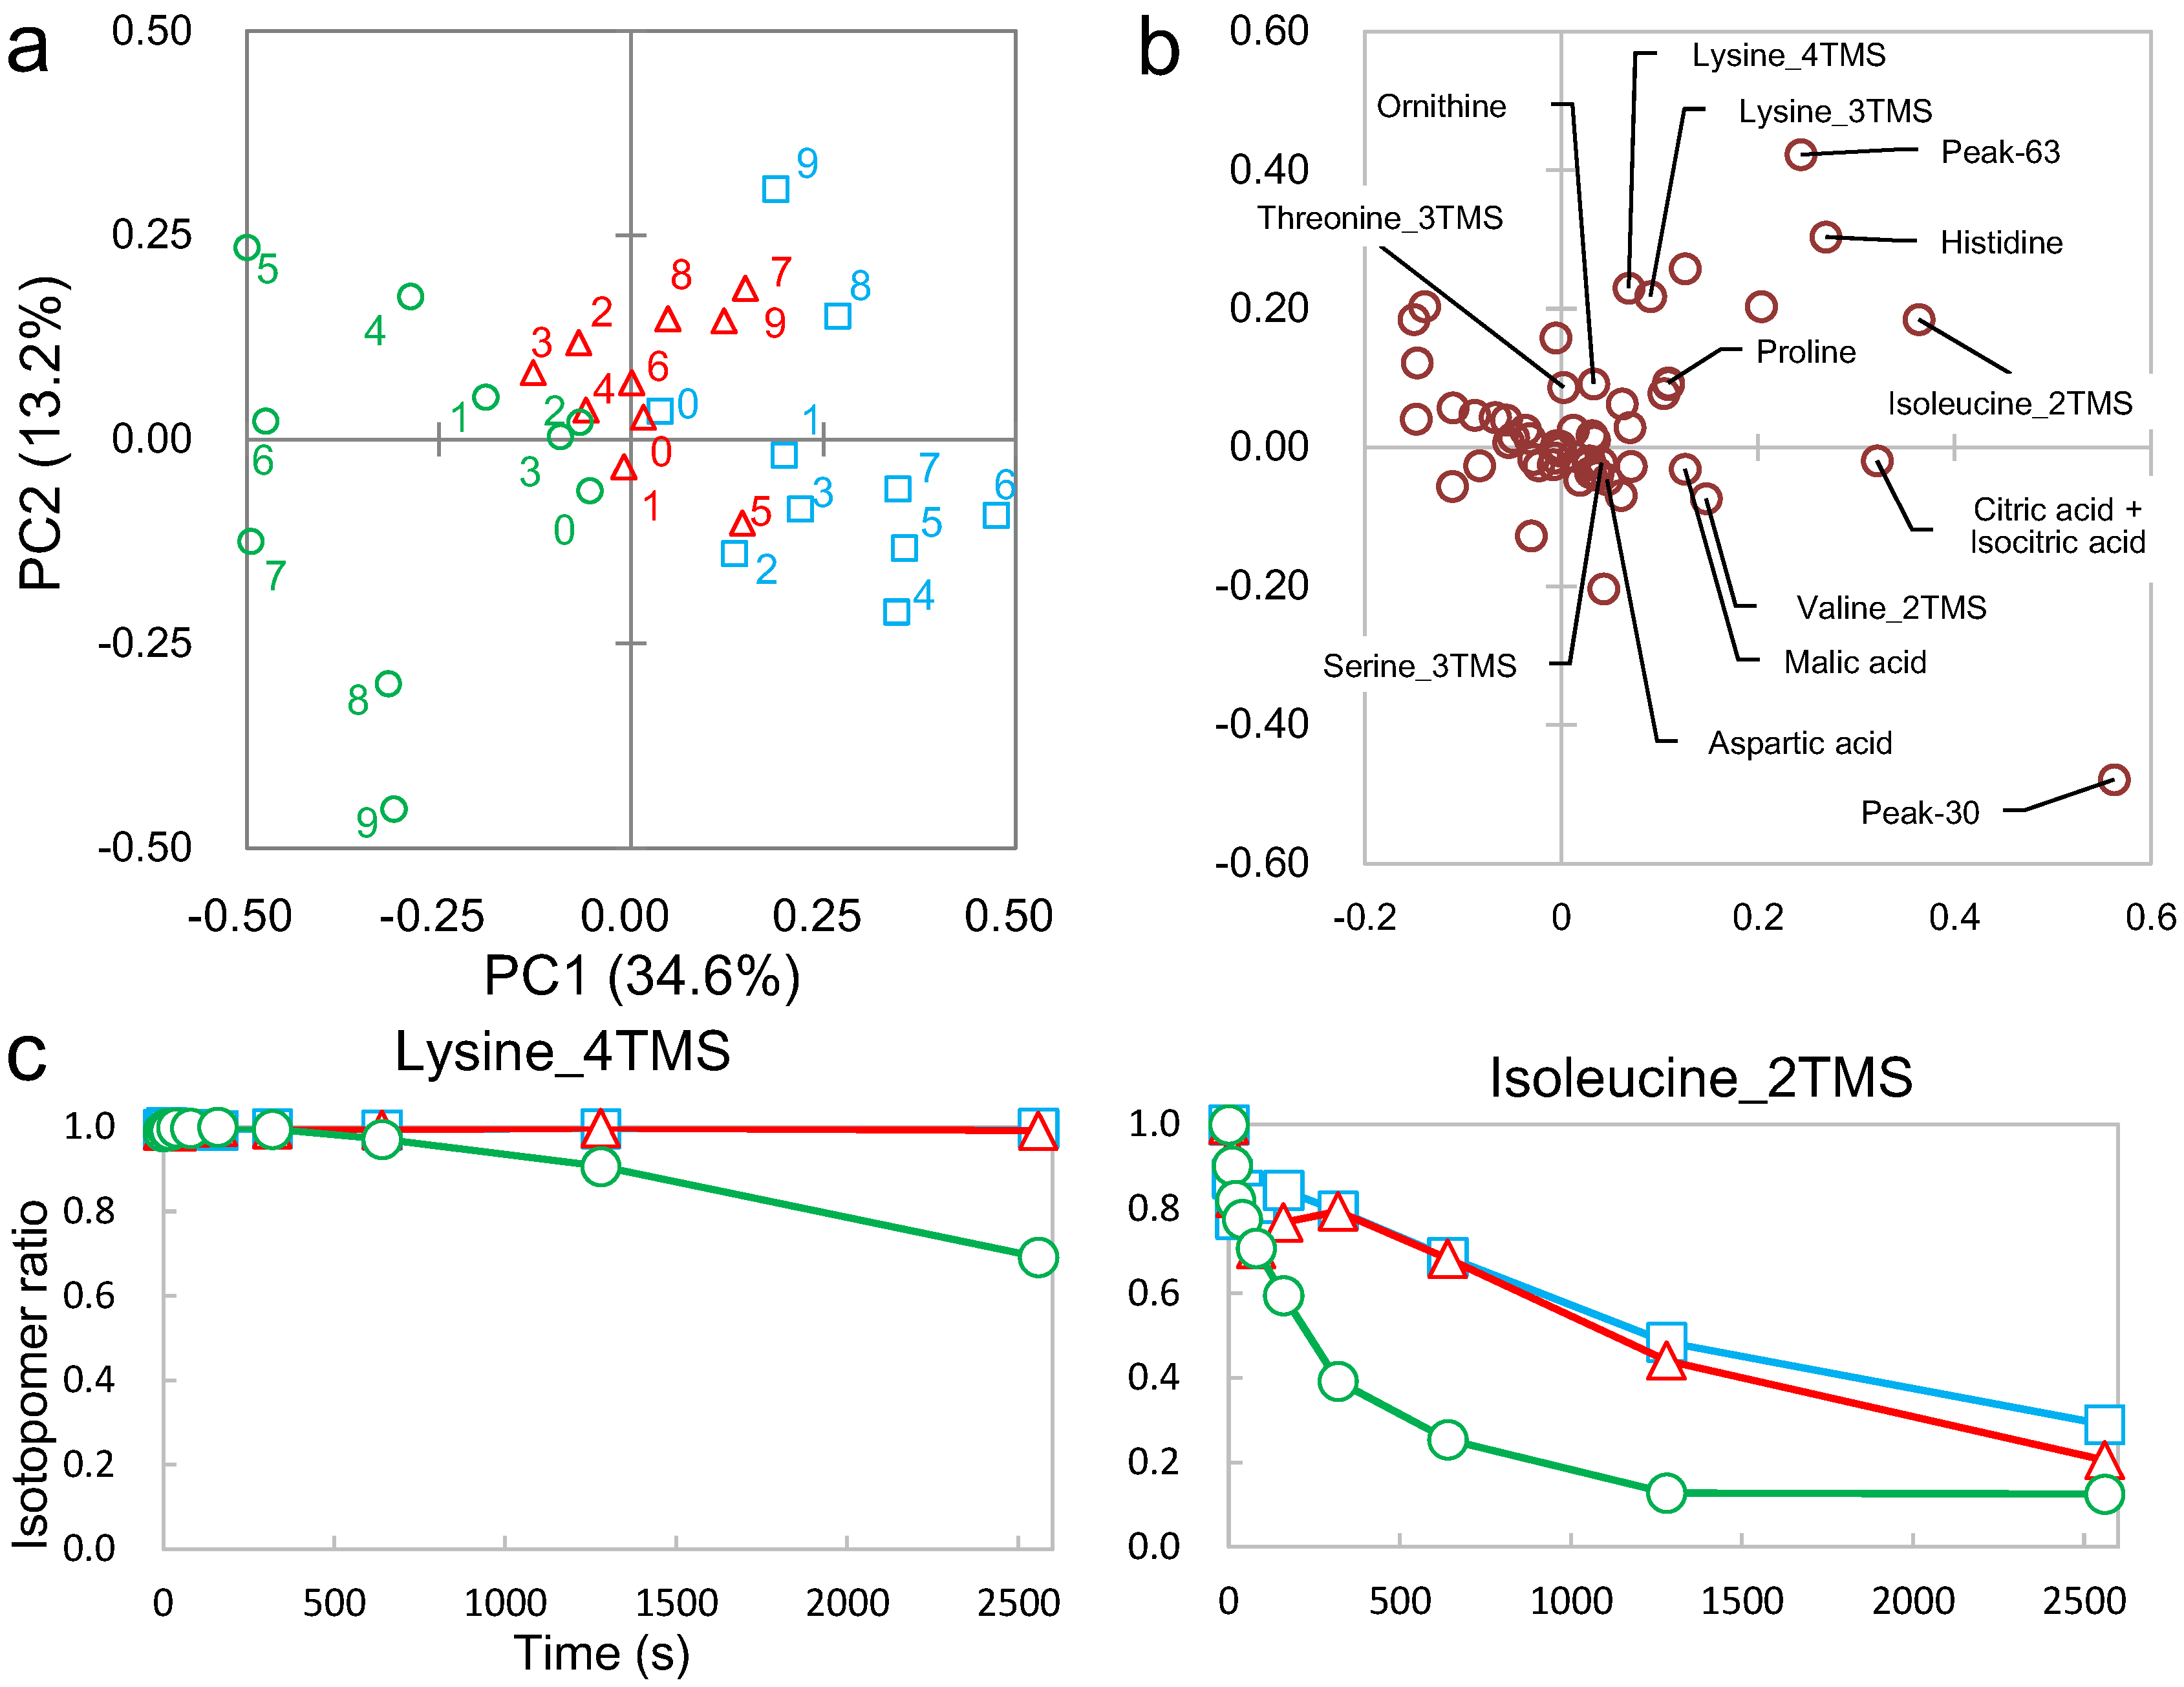
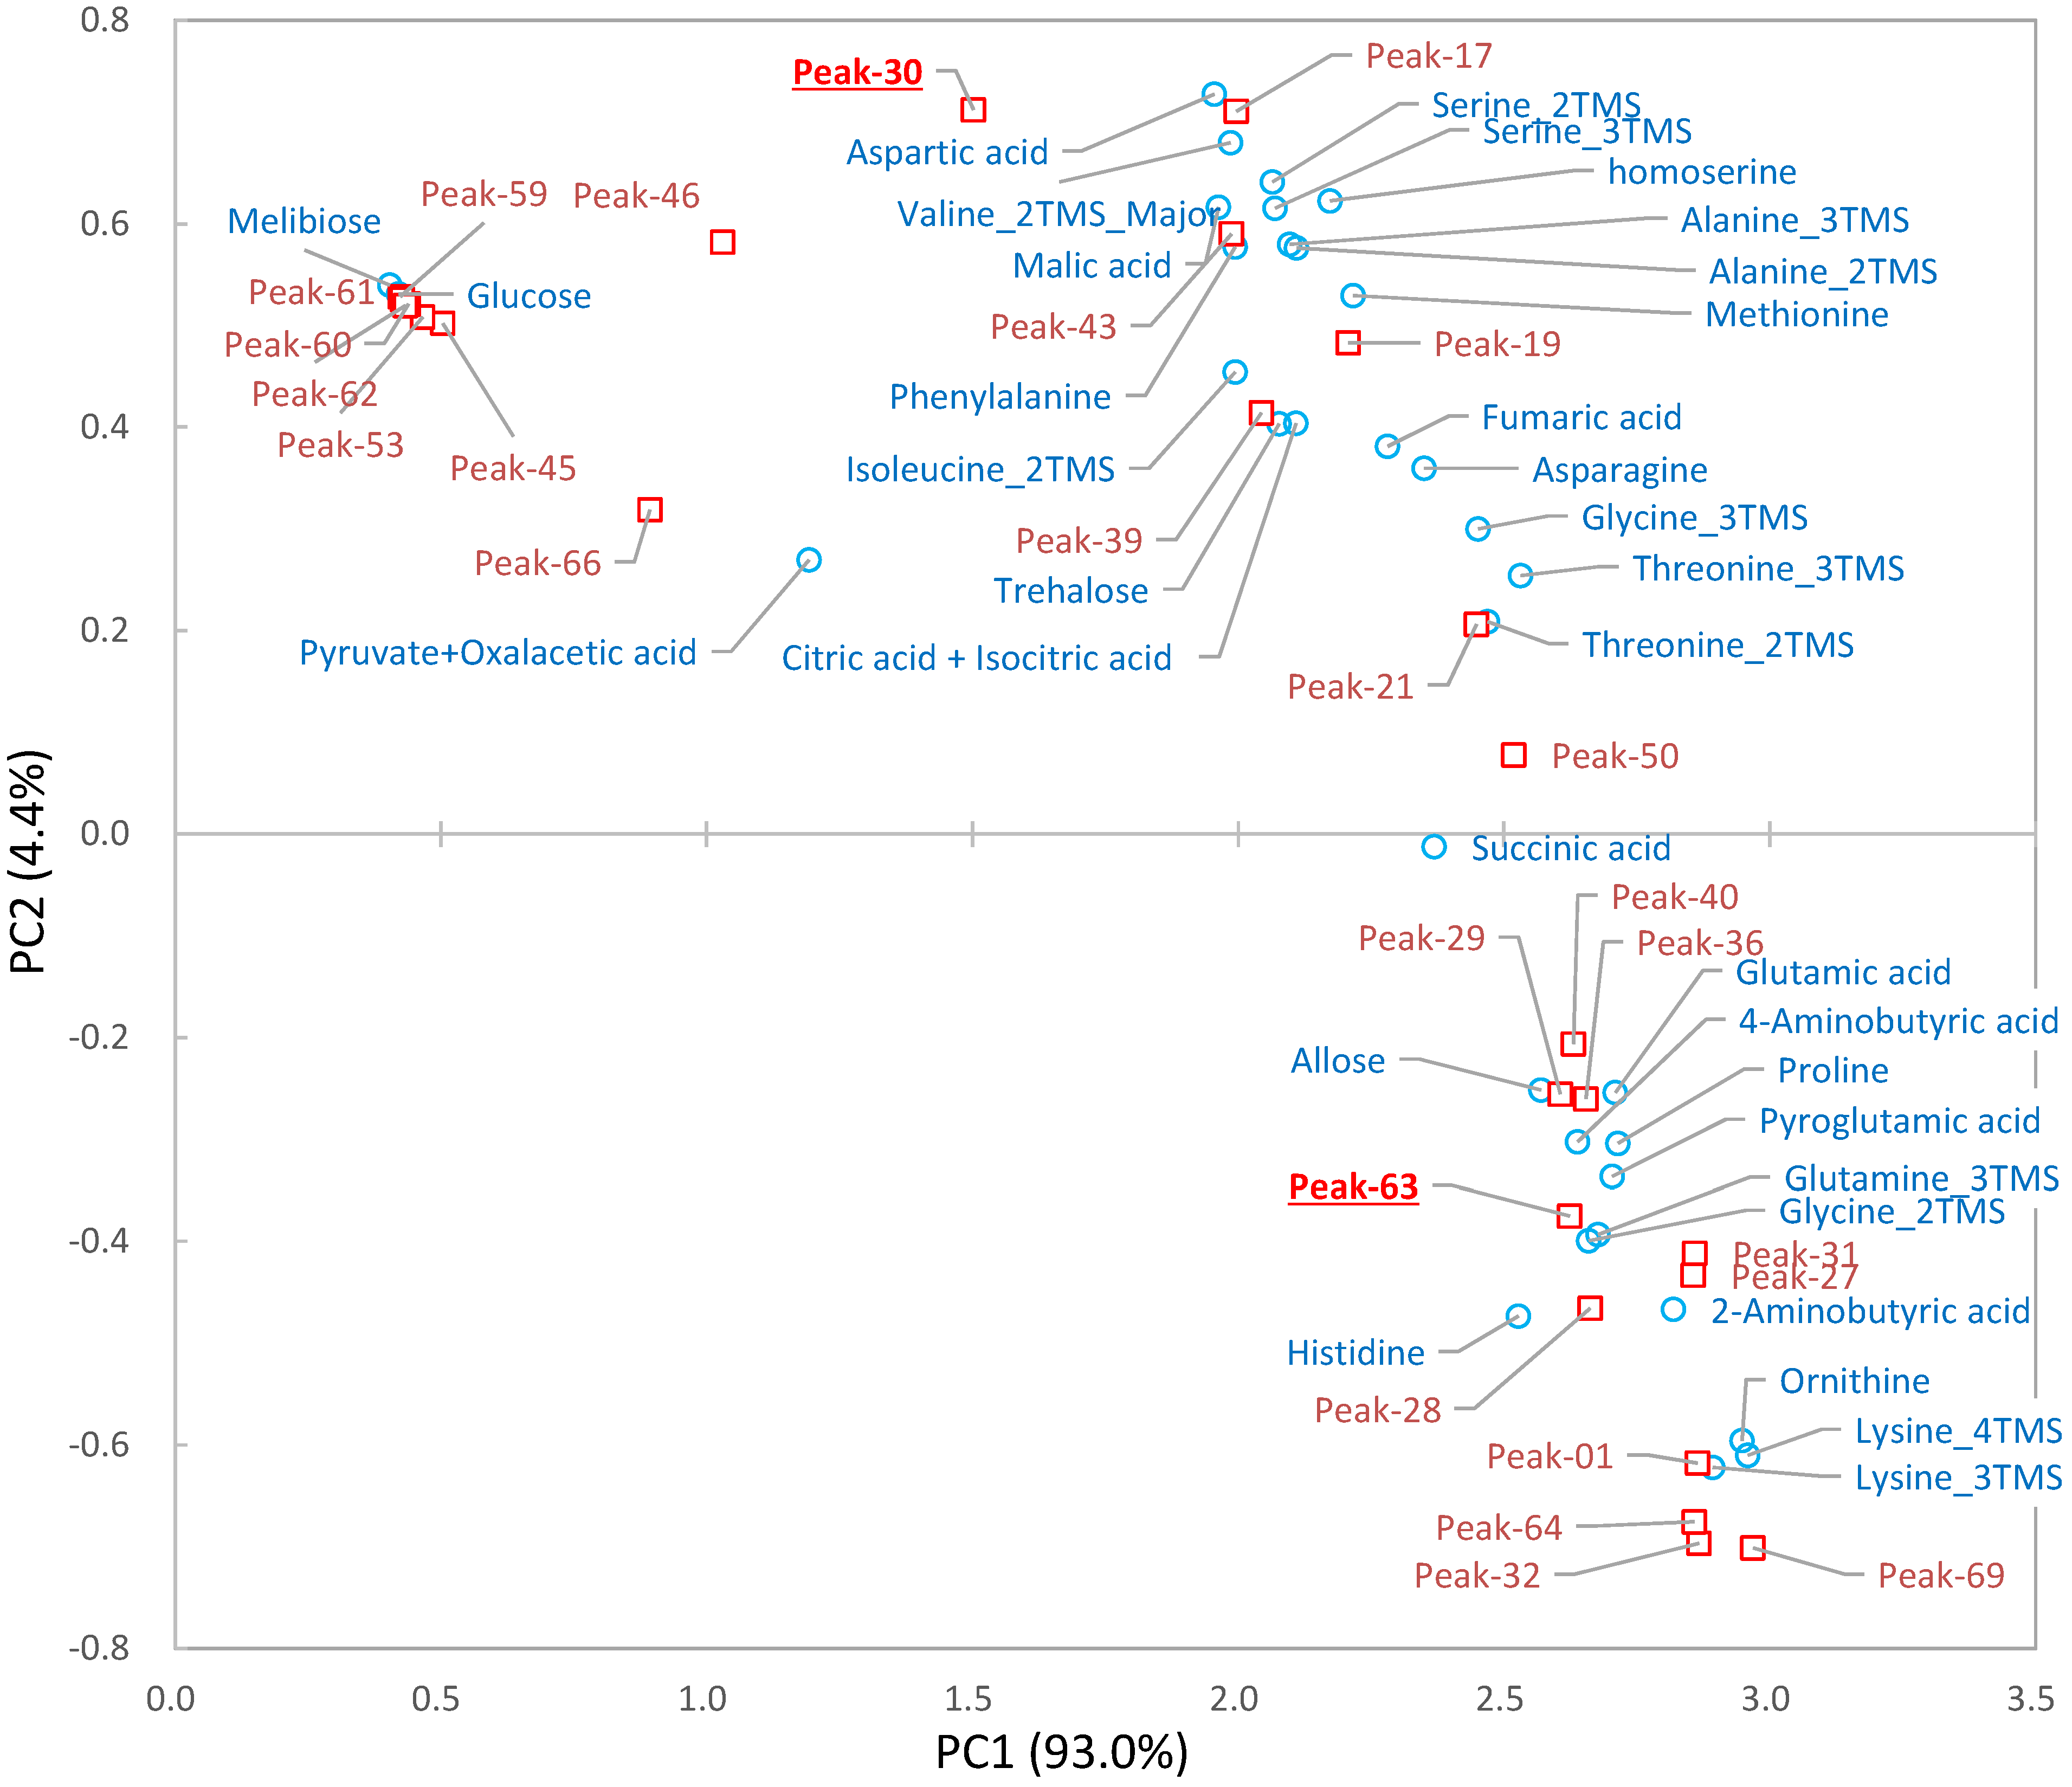
2.3. Differential Analysis and Peak Annotation


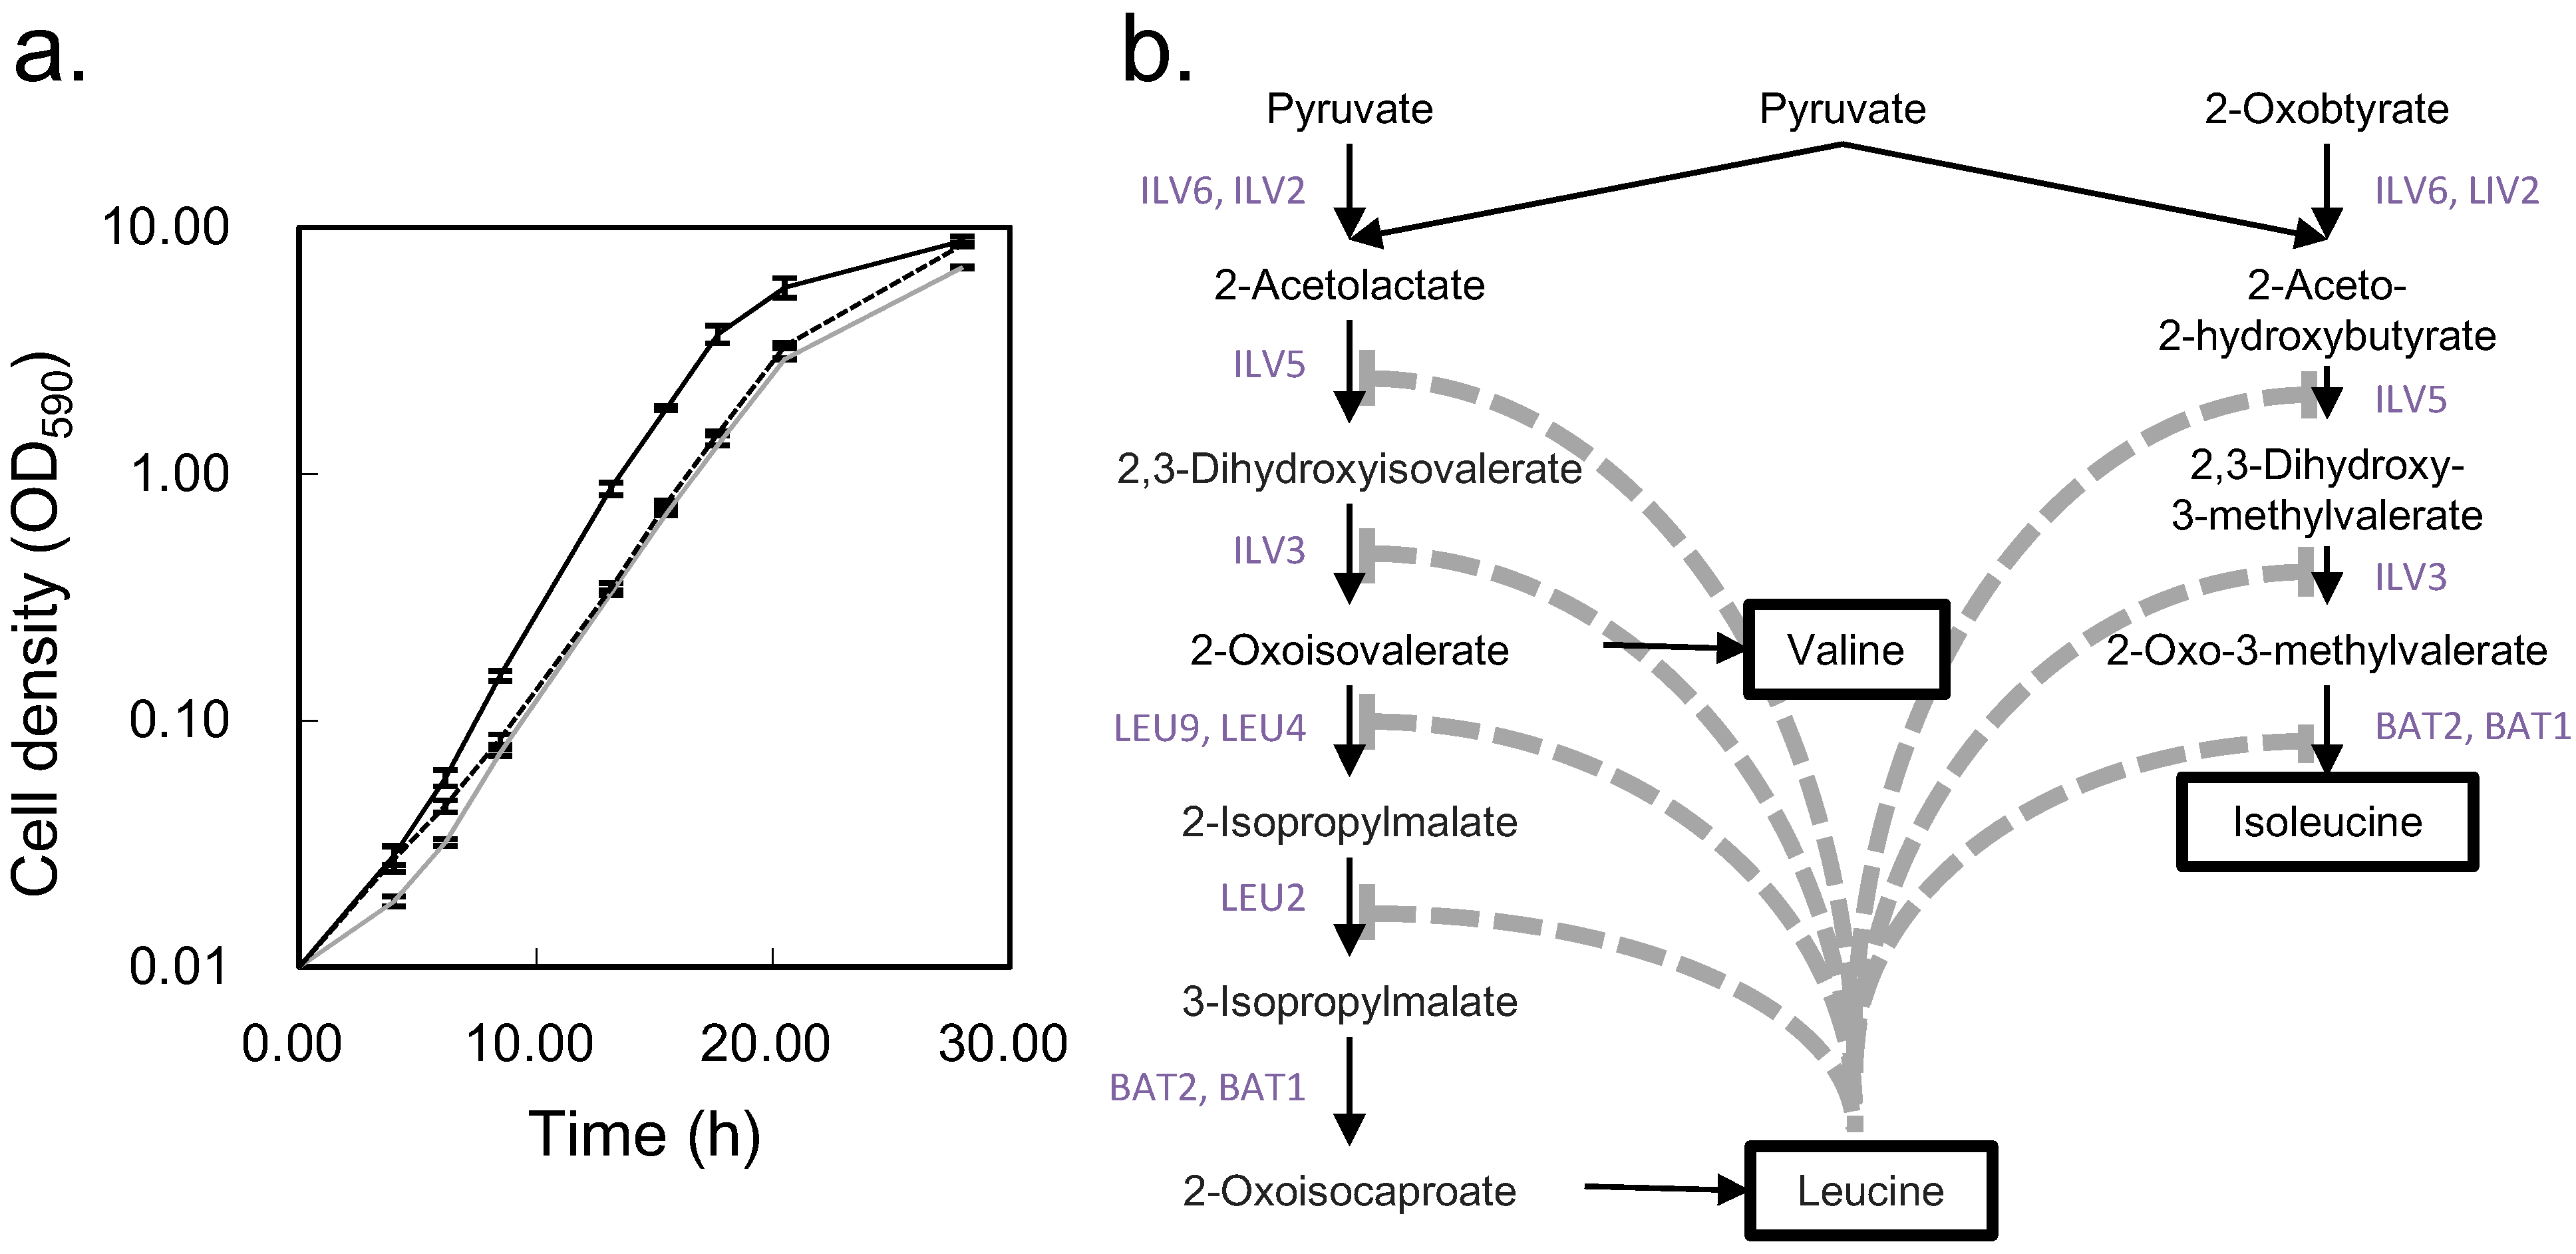
2.4. Biological Discussion from the Results

3. Experimental Section
3.1. Reagents
3.2. Yeast Cultivation
3.3. Metabolite Extraction
3.4. Metabolites Derivatization
3.5. GC/MS Analysis
3.6. Data Analysis
4. Conclusions
Supplementary Files
Supplementary File 1Acknowledgments
Author Contributions
Conflicts of Interest
References
- Calvin, M.; Benson, A.A. The path of carbon in photosynthesis. Science 1948, 107, 476–480. [Google Scholar]
- Entner, N.; Doudroff, M. Glucose and gluconic acid oxidation of Pseudomonas saccharophila. J. Biol. Chem. 1952, 196, 853–862. [Google Scholar]
- Evans, M.C.; Buchanan, B.B.; Arnon, D.I. A new ferredoxin-dependent carbon reduction cycle in a photosynthetic bacterium. Proc. Natl. Acad. Sci. USA 1966, 55, 928–934. [Google Scholar] [CrossRef]
- Weinman, E.O.; Strisower, E.H.; Chaikoff, I.L. onversion of fatty acids to carbohydrate; application of isotopes to this problem and role of the Krebs cycle as a synthetic pathway. Physiol. Rev. 1957, 37, 252–272. [Google Scholar]
- Kato, H.; Izumi, Y.; Hasunuma, T.; Matsuda, F.; Kondo, A. Widely targeted metabolic profiling analysis of yeast central metabolites. J. Biosci. Bioeng. 2012, 113, 665–673. [Google Scholar]
- You, L.; Zhang, B.; Tang, Y. Application of stable isotope-assisted metabolomics for cell metabolism studies. Metabolites 2014, 4, 142–165. [Google Scholar] [CrossRef]
- Härtel, T.; Eylert, E.; Schulz, C.; Petruschka, L.; Gierok, P.; Grubmüller, S.; Lalk, M.; Eisenreich, W.; Hammerschmidt, S. Characterization of central carbon metabolism of Streptococcus pneumoniae by isotopologue profiling. J. Biol. Chem. 2012, 287, 4260–4274. [Google Scholar]
- Fan, T.W.-M.; Lorkiewicz, P.K.; Sellers, K.; Moseley, H.N.B.; Higashi, R.M.; Lane, A.N. Stable isotope-resolved metabolomics and applications for drug development. Pharmacol. Ther. 2012, 133, 366–391. [Google Scholar]
- Creek, D.J.; Chokkathukalam, A.; Jankevics, A.; Burgess, K.E.V.; Breitling, R.; Barrett, M.P. Stable isotope-assisted metabolomics for network-wide metabolic pathway elucidation. Anal. Chem. 2012, 84, 8442–8447. [Google Scholar]
- Baran, R.; Bowen, B.P.; Bouskill, N.J.; Brodie, E.L.; Yannone, S.M.; Northen, T.R. Metabolite identification in Synechococcus sp. PCC 7002 using untargeted stable isotope assisted metabolite profiling. Anal. Chem. 2010, 82, 9034–9042. [Google Scholar] [CrossRef]
- Eylert, E.; Herrmann, V.; Jules, M.; Gillmaier, N.; Lautner, M.; Buchrieser, C.; Eisenreich, W.; Heuner, K. Isotopologue profiling of Legionella pneumophila: Role of serine and glucose as carbon substrates. J. Biol. Chem. 2010, 285, 22232–22243. [Google Scholar]
- Hiller, K.; Metallo, C.M.; Kelleher, J.K.; Stephanopoulos, G. Nontargeted elucidation of metabolic pathways using stable-isotope tracers and mass spectrometry. Anal. Chem. 2010, 82, 6621–6628. [Google Scholar]
- Stephanopoulos, G. Metabolic fluxes and metabolic engineering. Metab. Eng. 1999, 1, 1–11. [Google Scholar]
- Huang, X.; Chen, Y.-J.; Cho, K.; Nikolskiy, I.; Crawford, P.A.; Patti, G.J. X13CMS: Global tracking of isotopic labels in untargeted metabolomics. Anal. Chem. 2014, 86, 1632–1639. [Google Scholar]
- Chokkathukalam, A.; Jankevics, A.; Creek, D.J.; Achcar, F.; Barrett, M.P.; Breitling, R. mzMatch-ISO: An R tool for the annotation and relative quantification of isotope-labelled mass spectrometry data. Bioinformatics 2013, 29, 281–283. [Google Scholar]
- Zhang, S.; Bryant, D.A. The tricarboxylic acid cycle in cyanobacteria. Science 2011, 334, 1551–1553. [Google Scholar]
- Nakahigashi, K.; Toya, Y.; Ishii, N.; Soga, T.; Hasegawa, M.; Watanabe, H.; Takai, Y. Systematic phenome analysis of Escherichia coli multiple-knockout mutants reveals hidden reactions in central carbon metabolism. Mol. Syst. Biol. 2009, 5, 1–14. [Google Scholar]
- Clasquin, M.F.; Melamud, E.; Singer, A.; Gooding, J.R.; Xu, X.; Dong, A.; Cui, H.; Campagna, S.R.; Savchenko, A.; Yakunin, A.F.; et al. Riboneogenesis in yeast. Cell 2011, 145, 969–980. [Google Scholar]
- Young, J.D.; Shastri, A.A.; Stephanopoulos, G.; Morgan, J.A. Mapping photoautotrophic metabolism with isotopically nonstationary 13C flux analysis. Metab. Eng. 2011, 13, 656–665. [Google Scholar]
- Hasunuma, T.; Harada, K.; Miyazawa, S.-I.; Kondo, A.; Fukusaki, E.; Miyake, C. Metabolic turnover analysis by a combination of in vivo 13C-labelling from 13CO2 and metabolic profiling with CE-MS/MS reveals rate-limiting steps of the C3 photosynthetic pathway in Nicotiana tabacum leaves. J. Exp. Bot. 2010, 61, 1041–1051. [Google Scholar]
- Harada, K.; Fukusaki, E.; Bamba, T.; Sato, F.; Kobayashi, A. In vivo 15N-enrichment of metabolites in suspension cultured cells and its application to metabolomics. Biotechnol. Prog. 2006, 22, 1003–1011. [Google Scholar]
- Ito, T.; Sugimoto, M.; Toya, Y.; Ano, Y.; Kurano, N.; Soga, T.; Tomita, M. Time-resolved metabolomics of a novel trebouxiophycean alga using 13CO2 feeding. J. Biosci. Bioeng. 2013, 116, 408–415. [Google Scholar]
- Tsugawa, H.; Tsujimoto, Y.; Arita, M.; Bamba, T.; Fukusaki, E. GC/MS based metabolomics: Development of a data mining system for metabolite identification by using soft independent modeling of class analogy (SIMCA). BMC Bioinform. 2011, 12, 131. [Google Scholar] [CrossRef]
- Kopka, J.; Schauer, N.; Krueger, S.; Birkemeyer, C.; Usadel, B.; Bergmüller, E.; Dörmann, P.; Weckwerth, W.; Gibon, Y.; Stitt, M.; et al. [email protected]: The Golm Metabolome Database. Bioinformatics 2005, 21, 1635–1638. [Google Scholar]
- Horai, H.; Arita, M.; Kanaya, S.; Nihei, Y.; Ikeda, T.; Suwa, K.; Ojima, Y.; Tanaka, K.; Tanaka, S.; Aoshima, K.; et al. MassBank: A public repository for sharing mass spectral data for life sciences. J. Mass Spectrom. 2010, 45, 703–714. [Google Scholar]
- Hummel, J.; Strehmel, N.; Selbig, J.; Walther, D.; Kopka, J. Decision tree supported substructure prediction of metabolites from GC-MS profiles. Metabolomics 2010, 6, 322–333. [Google Scholar] [CrossRef]
- Yamamoto, H.; Fujimori, T.; Sato, H.; Ishikawa, G.; Kami, K.; Ohashi, Y. Statistical hypothesis testing of factor loading in principal component analysis and its application to metabolite set enrichment analysis. BMC Bioinform. 2014, 15, 51. [Google Scholar] [CrossRef]
- Nakayama, Y.; Putri, S.P.; Bamba, T.; Fukusaki, E. Metabolic distance estimation based on principle component analysis of metabolic turnover. J. Biosci. Bioeng. 2004, 118, 350–355. [Google Scholar]
- Sumner, L.W.; Amberg, A.; Barrett, D.; Beale, M.H.; Beger, R.; Daykin, C.A.; Fan, T.W.-M.; Fiehn, O.; Goodacre, R.; Griffin, J.L.; et al. Proposed minimum reporting standards for chemical analysis Chemical Analysis Working Group (CAWG) Metabolomics Standards Initiative (MSI). Metabolomics 2007, 3, 211–221. [Google Scholar] [CrossRef]
- EUROpean Saccharomyces Cerevisiae ARchive for Functional Analysis. Available online: http://web.uni-frankfurt.de/fb15/mikro/euroscarf/index.html (accessed on 20 August 2014).
- Jones, E.W.; Fink, G.R. The Molecular Biology of the Yeast Saccharomyces: Metabolism and Gene Expression; Strathern, J.N., Jones, E.W., Broach, J.R., Eds.; Cold Spring Harbor Laboratory Press: Woodbury, NY, USA, 1982; pp. 181–299. [Google Scholar]
- Niederberger, P.; Miozzari, G.; Hütter, R. Biological role of the general control of amino acid biosynthesis in Saccharomyces cerevisiae. Mol. Cell. Biol. 1981, 1, 584–593. [Google Scholar]
- Yuan, J.; Fowler, W.U.; Kimball, E.; Lu, W.; Rabinowitz, J.D. Kinetic flux profiling of nitrogen assimilation in Escherichia coli. Nat. Chem. Biol. 2006, 2, 529–530. [Google Scholar]
- Yuan, J.; Bennett, B.D.; Rabinowitz, J.D. Kinetic flux profiling for quantitation of cellular metabolic fluxes. Nat. Protoc. 2008, 3, 1328–1340. [Google Scholar]
- Kawase, N.; Tsugawa, H.; Bamba, T.; Fukusaki, E. Different-batch metabolome analysis of Saccharomyces cerevisiae based on gas chromatography/mass spectrometry. J. Biosci. Bioeng. 2014, 117, 248–255. [Google Scholar]
- Lommen, A. MetAlign: Interface-driven, versatile metabolomics tool for hyphenated full-scan mass spectrometry data preprocessing. Anal. Chem. 2009, 81, 3079–3086. [Google Scholar]
© 2014 by the authors; licensee MDPI, Basel, Switzerland. This article is an open access article distributed under the terms and conditions of the Creative Commons Attribution license (http://creativecommons.org/licenses/by/3.0/).
Share and Cite
Nakayama, Y.; Tamada, Y.; Tsugawa, H.; Bamba, T.; Fukusaki, E. Novel Strategy for Non-Targeted Isotope-Assisted Metabolomics by Means of Metabolic Turnover and Multivariate Analysis. Metabolites 2014, 4, 722-739. https://doi.org/10.3390/metabo4030722
Nakayama Y, Tamada Y, Tsugawa H, Bamba T, Fukusaki E. Novel Strategy for Non-Targeted Isotope-Assisted Metabolomics by Means of Metabolic Turnover and Multivariate Analysis. Metabolites. 2014; 4(3):722-739. https://doi.org/10.3390/metabo4030722
Chicago/Turabian StyleNakayama, Yasumune, Yoshihiro Tamada, Hiroshi Tsugawa, Takeshi Bamba, and Eiichiro Fukusaki. 2014. "Novel Strategy for Non-Targeted Isotope-Assisted Metabolomics by Means of Metabolic Turnover and Multivariate Analysis" Metabolites 4, no. 3: 722-739. https://doi.org/10.3390/metabo4030722