Identifying Biomarkers of Wharton’s Jelly Mesenchymal Stromal Cells Using a Dynamic Metabolic Model: The Cell Passage Effect


Abstract
:1. Introduction
2. Results and Discussion
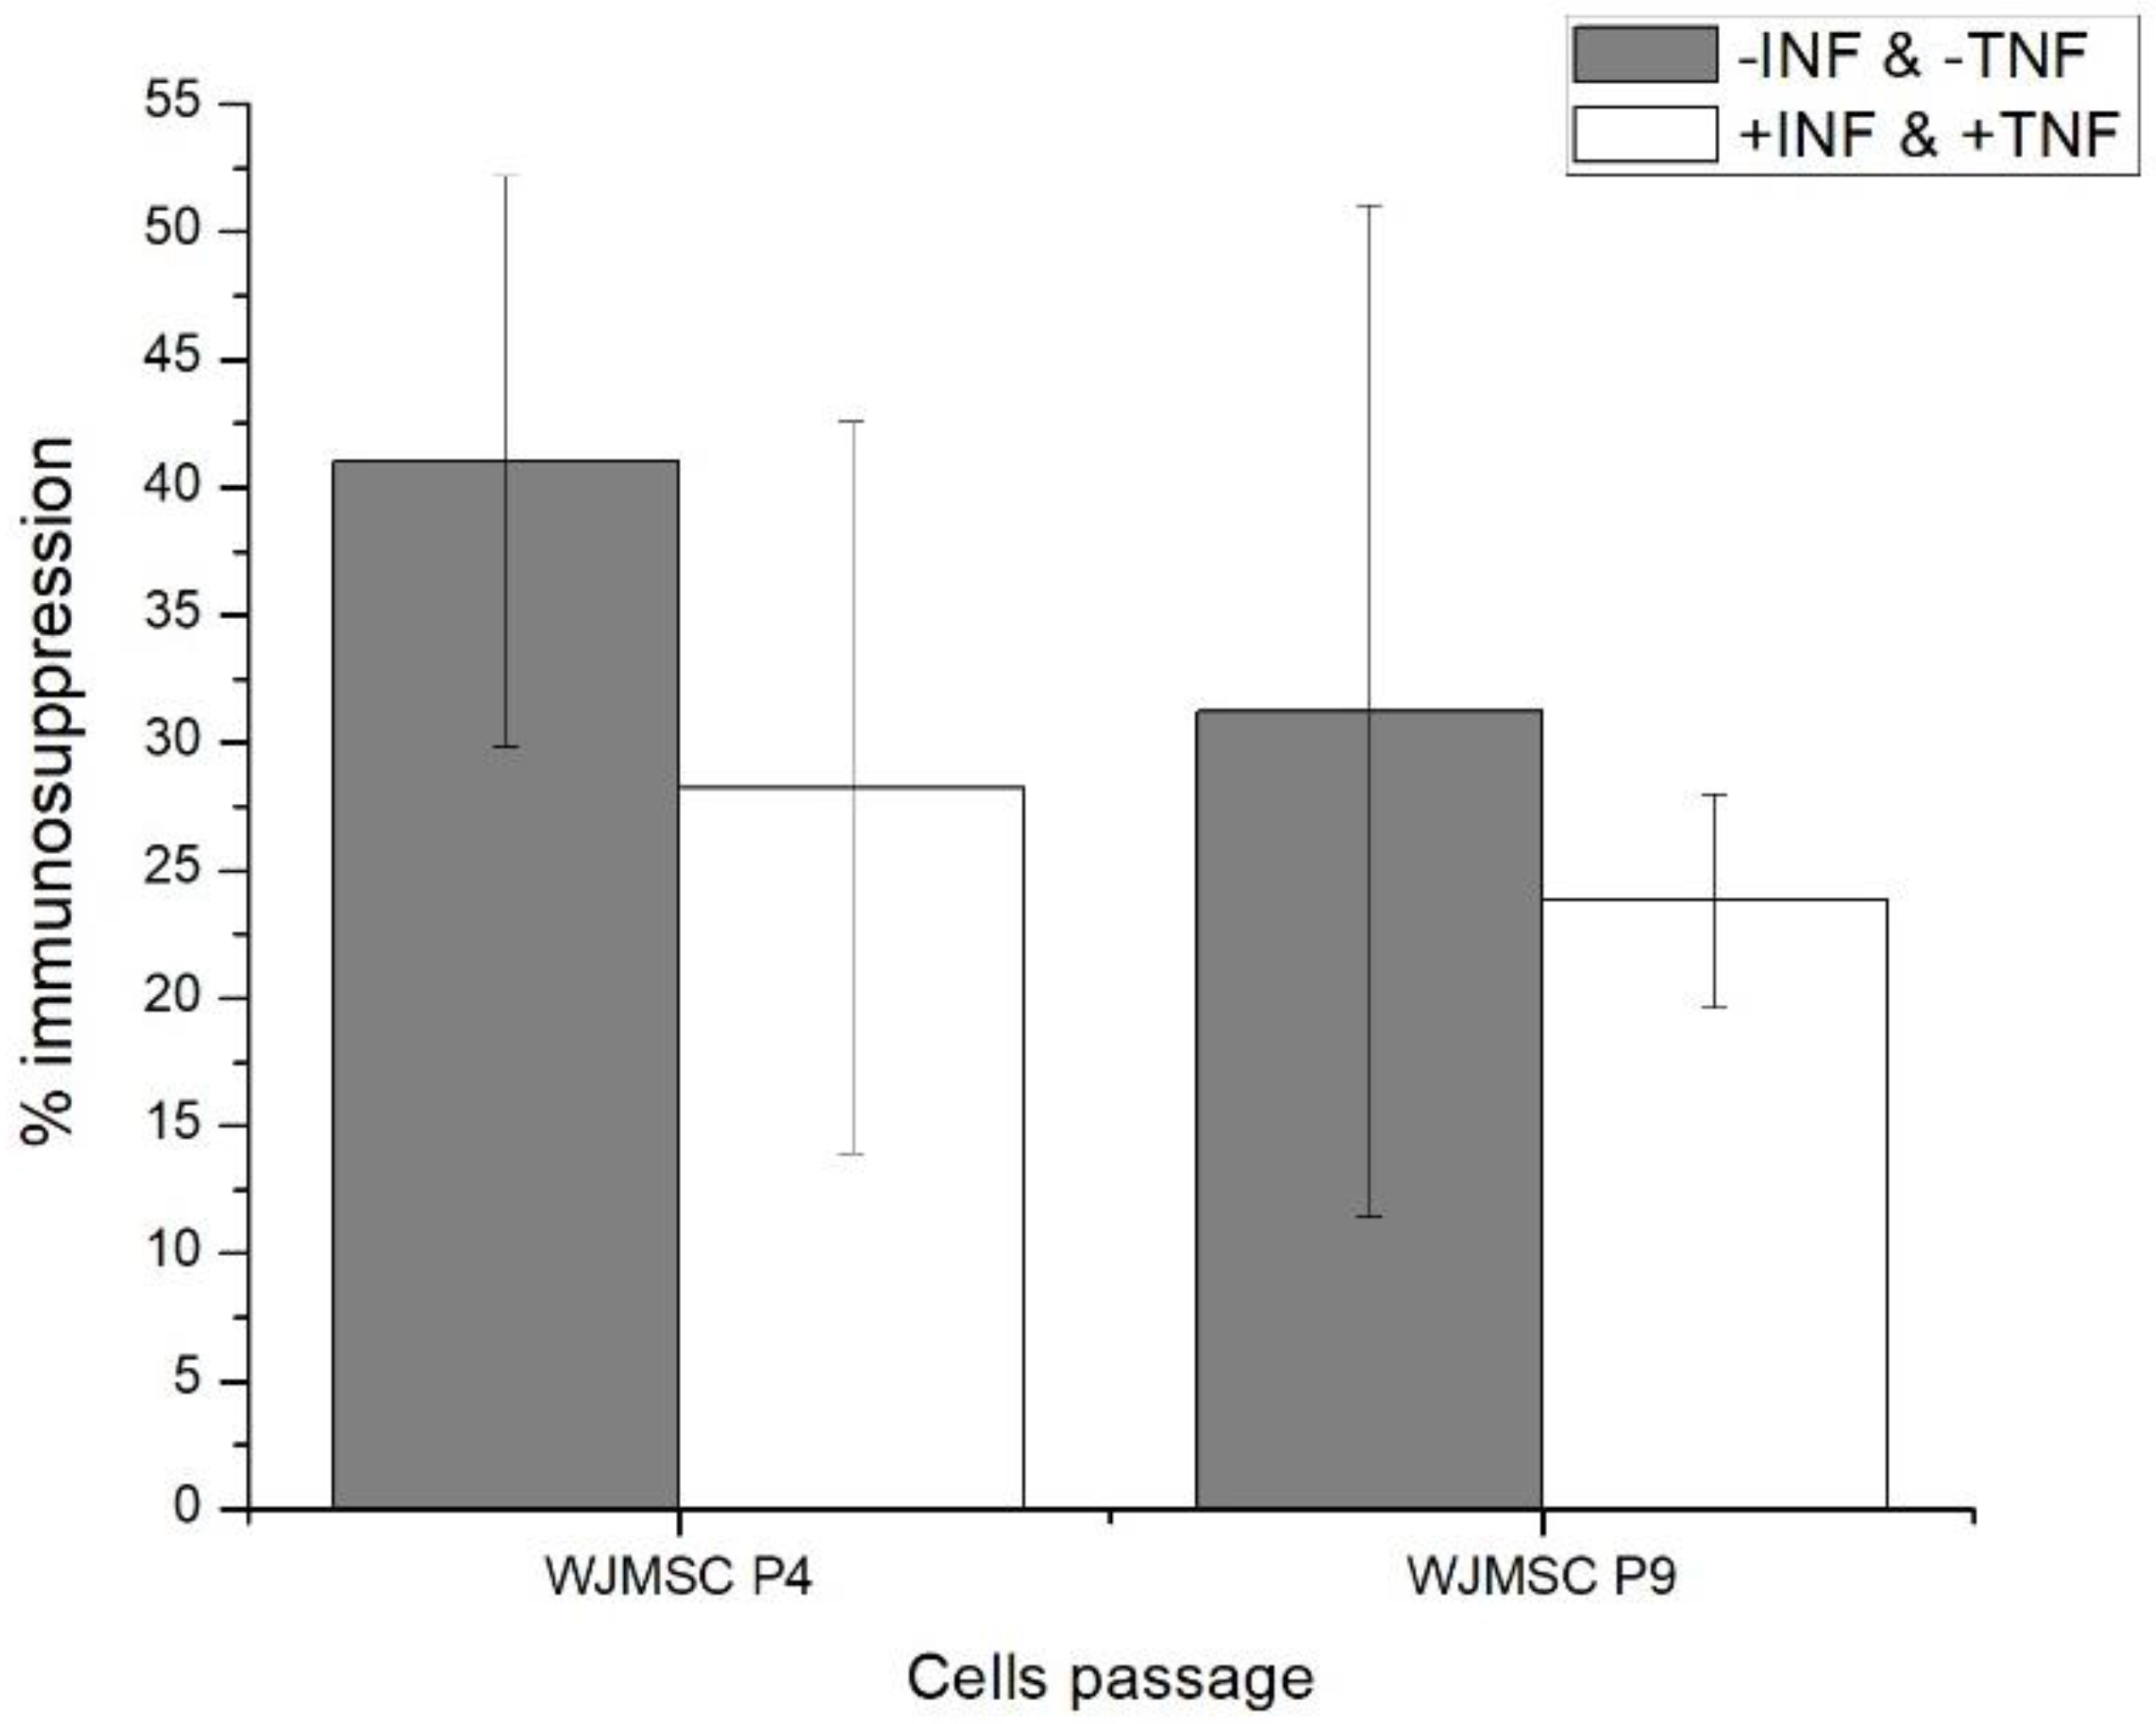
2.1. Fourth (P4) and Ninth (P9) Passage WJMSC Cells Exhibit Non-Significantly Different Low Immunosuppressive Phenotypes
2.2. WJMSC P4 and P9 Cells Show Distinct Metabolic Behaviour
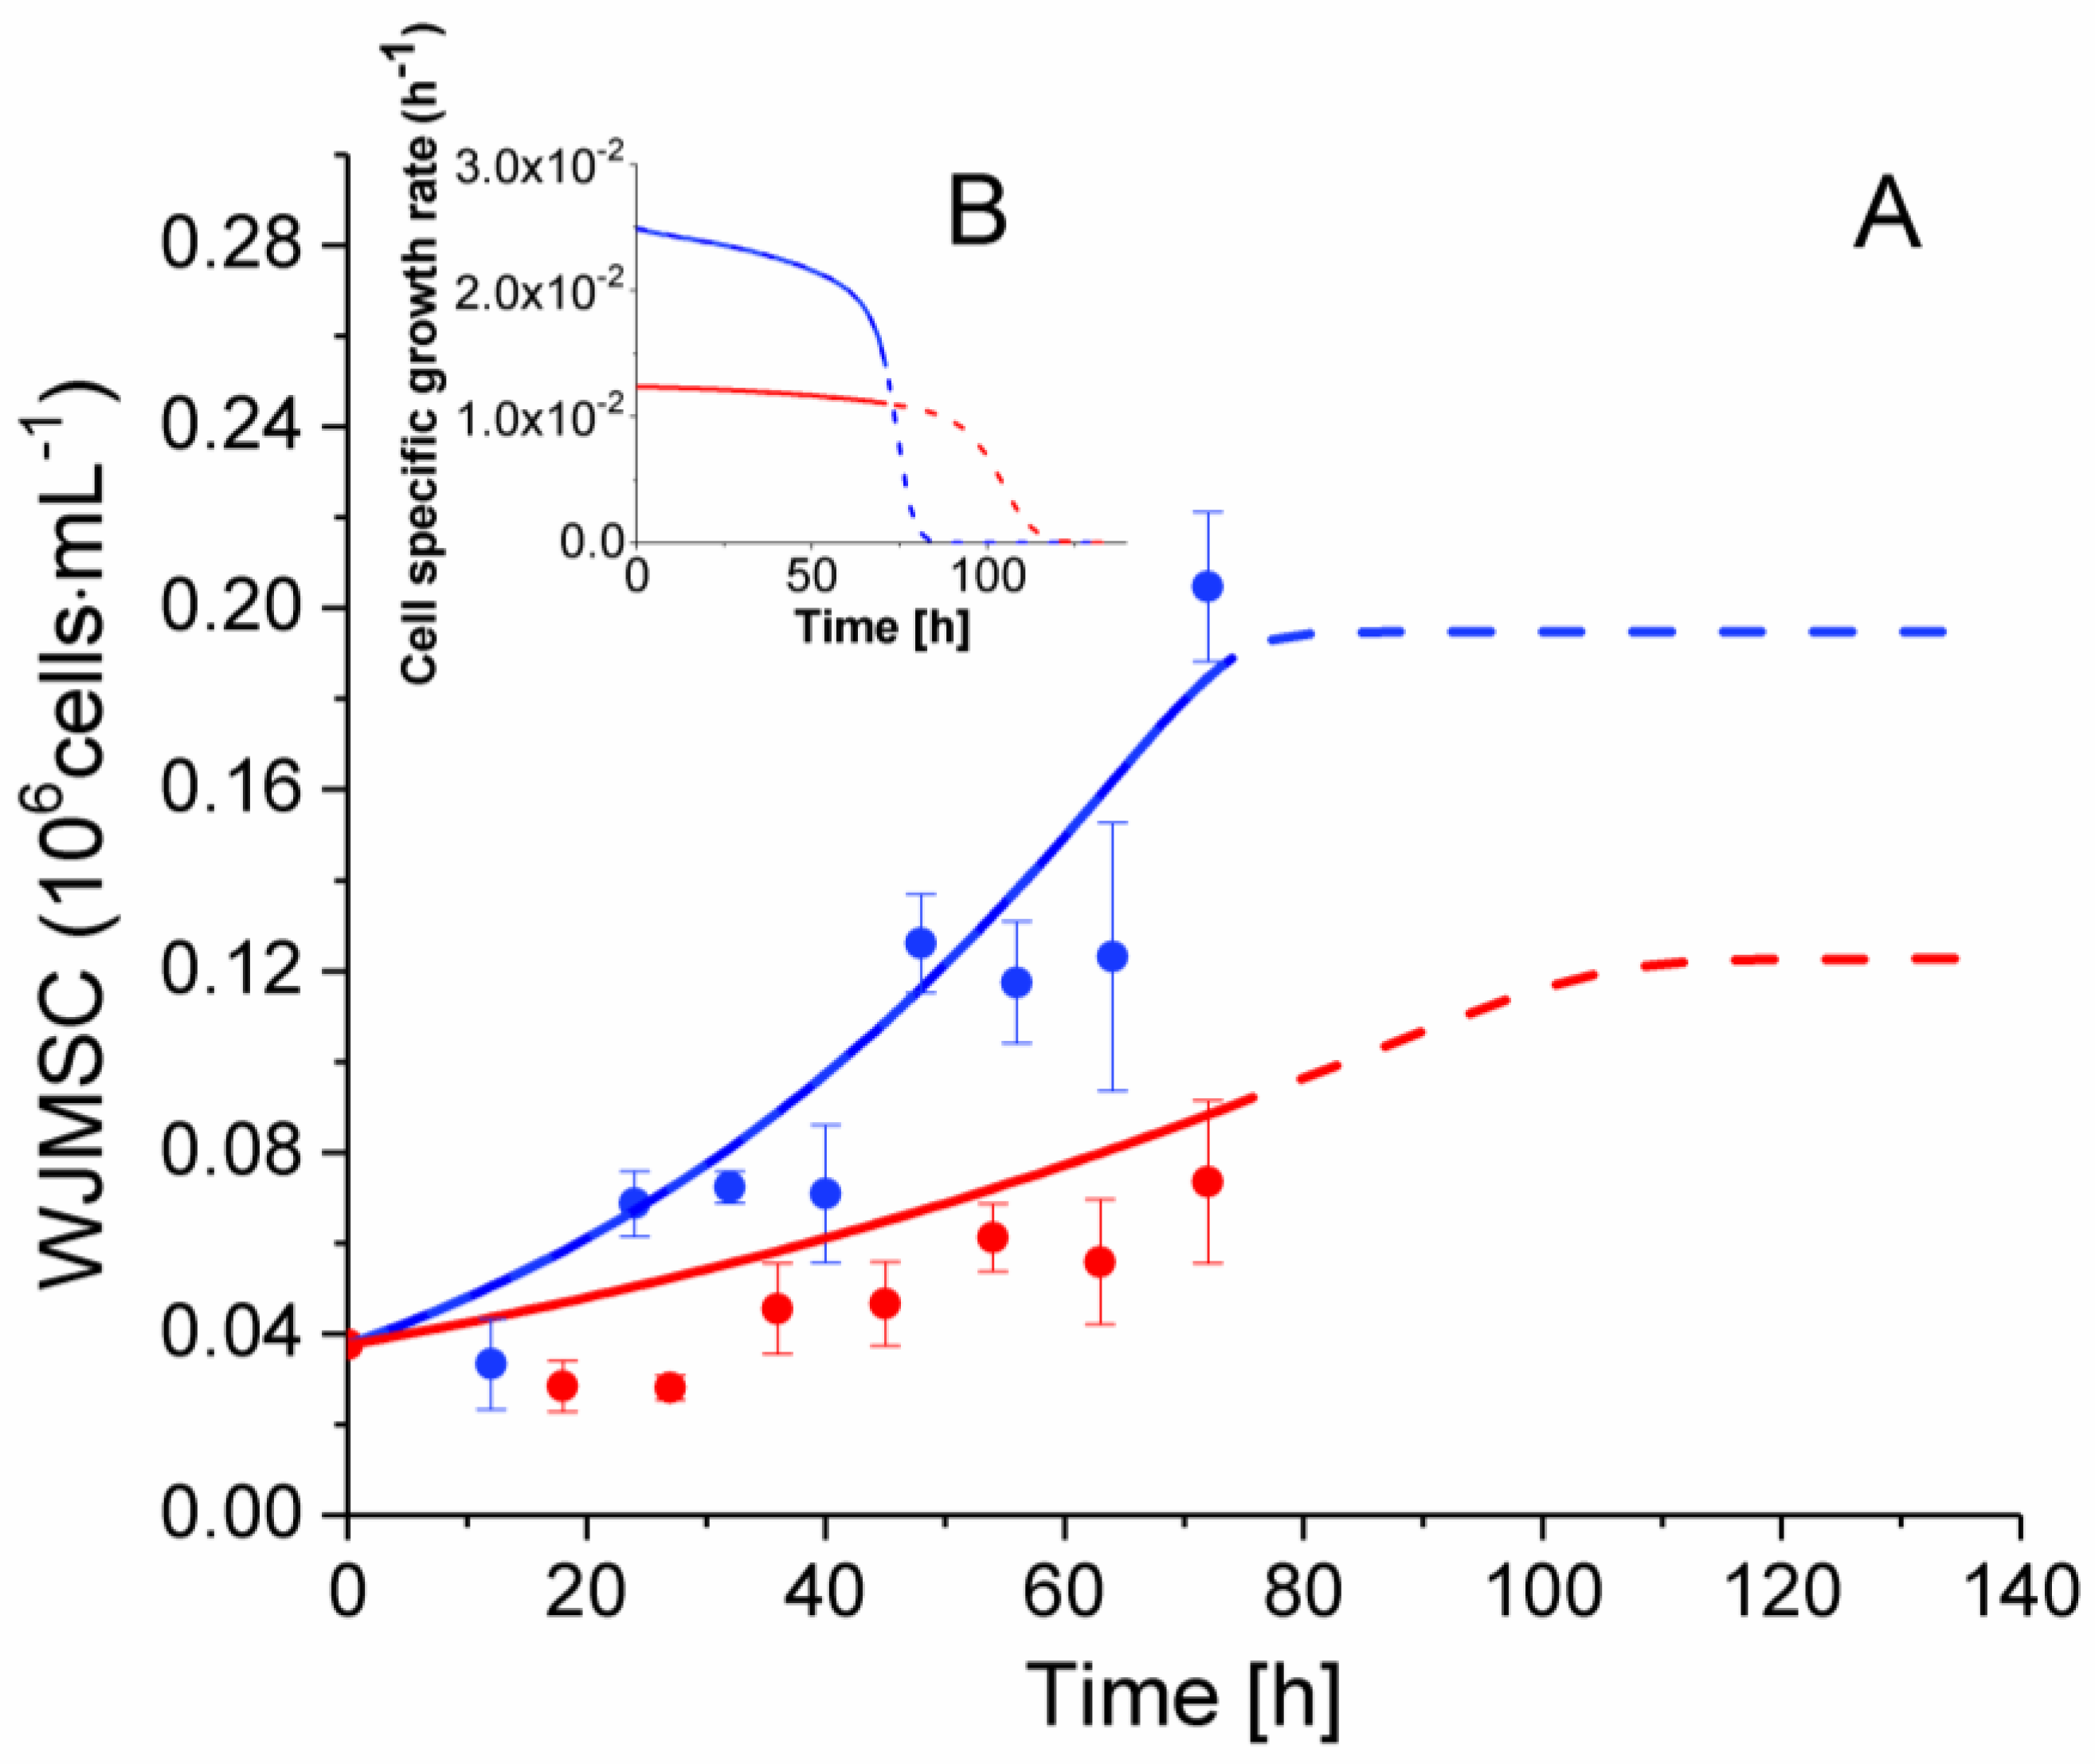
2.3. P4 Cells Present a Faster Doubling Time than Late P9 Passage Cells
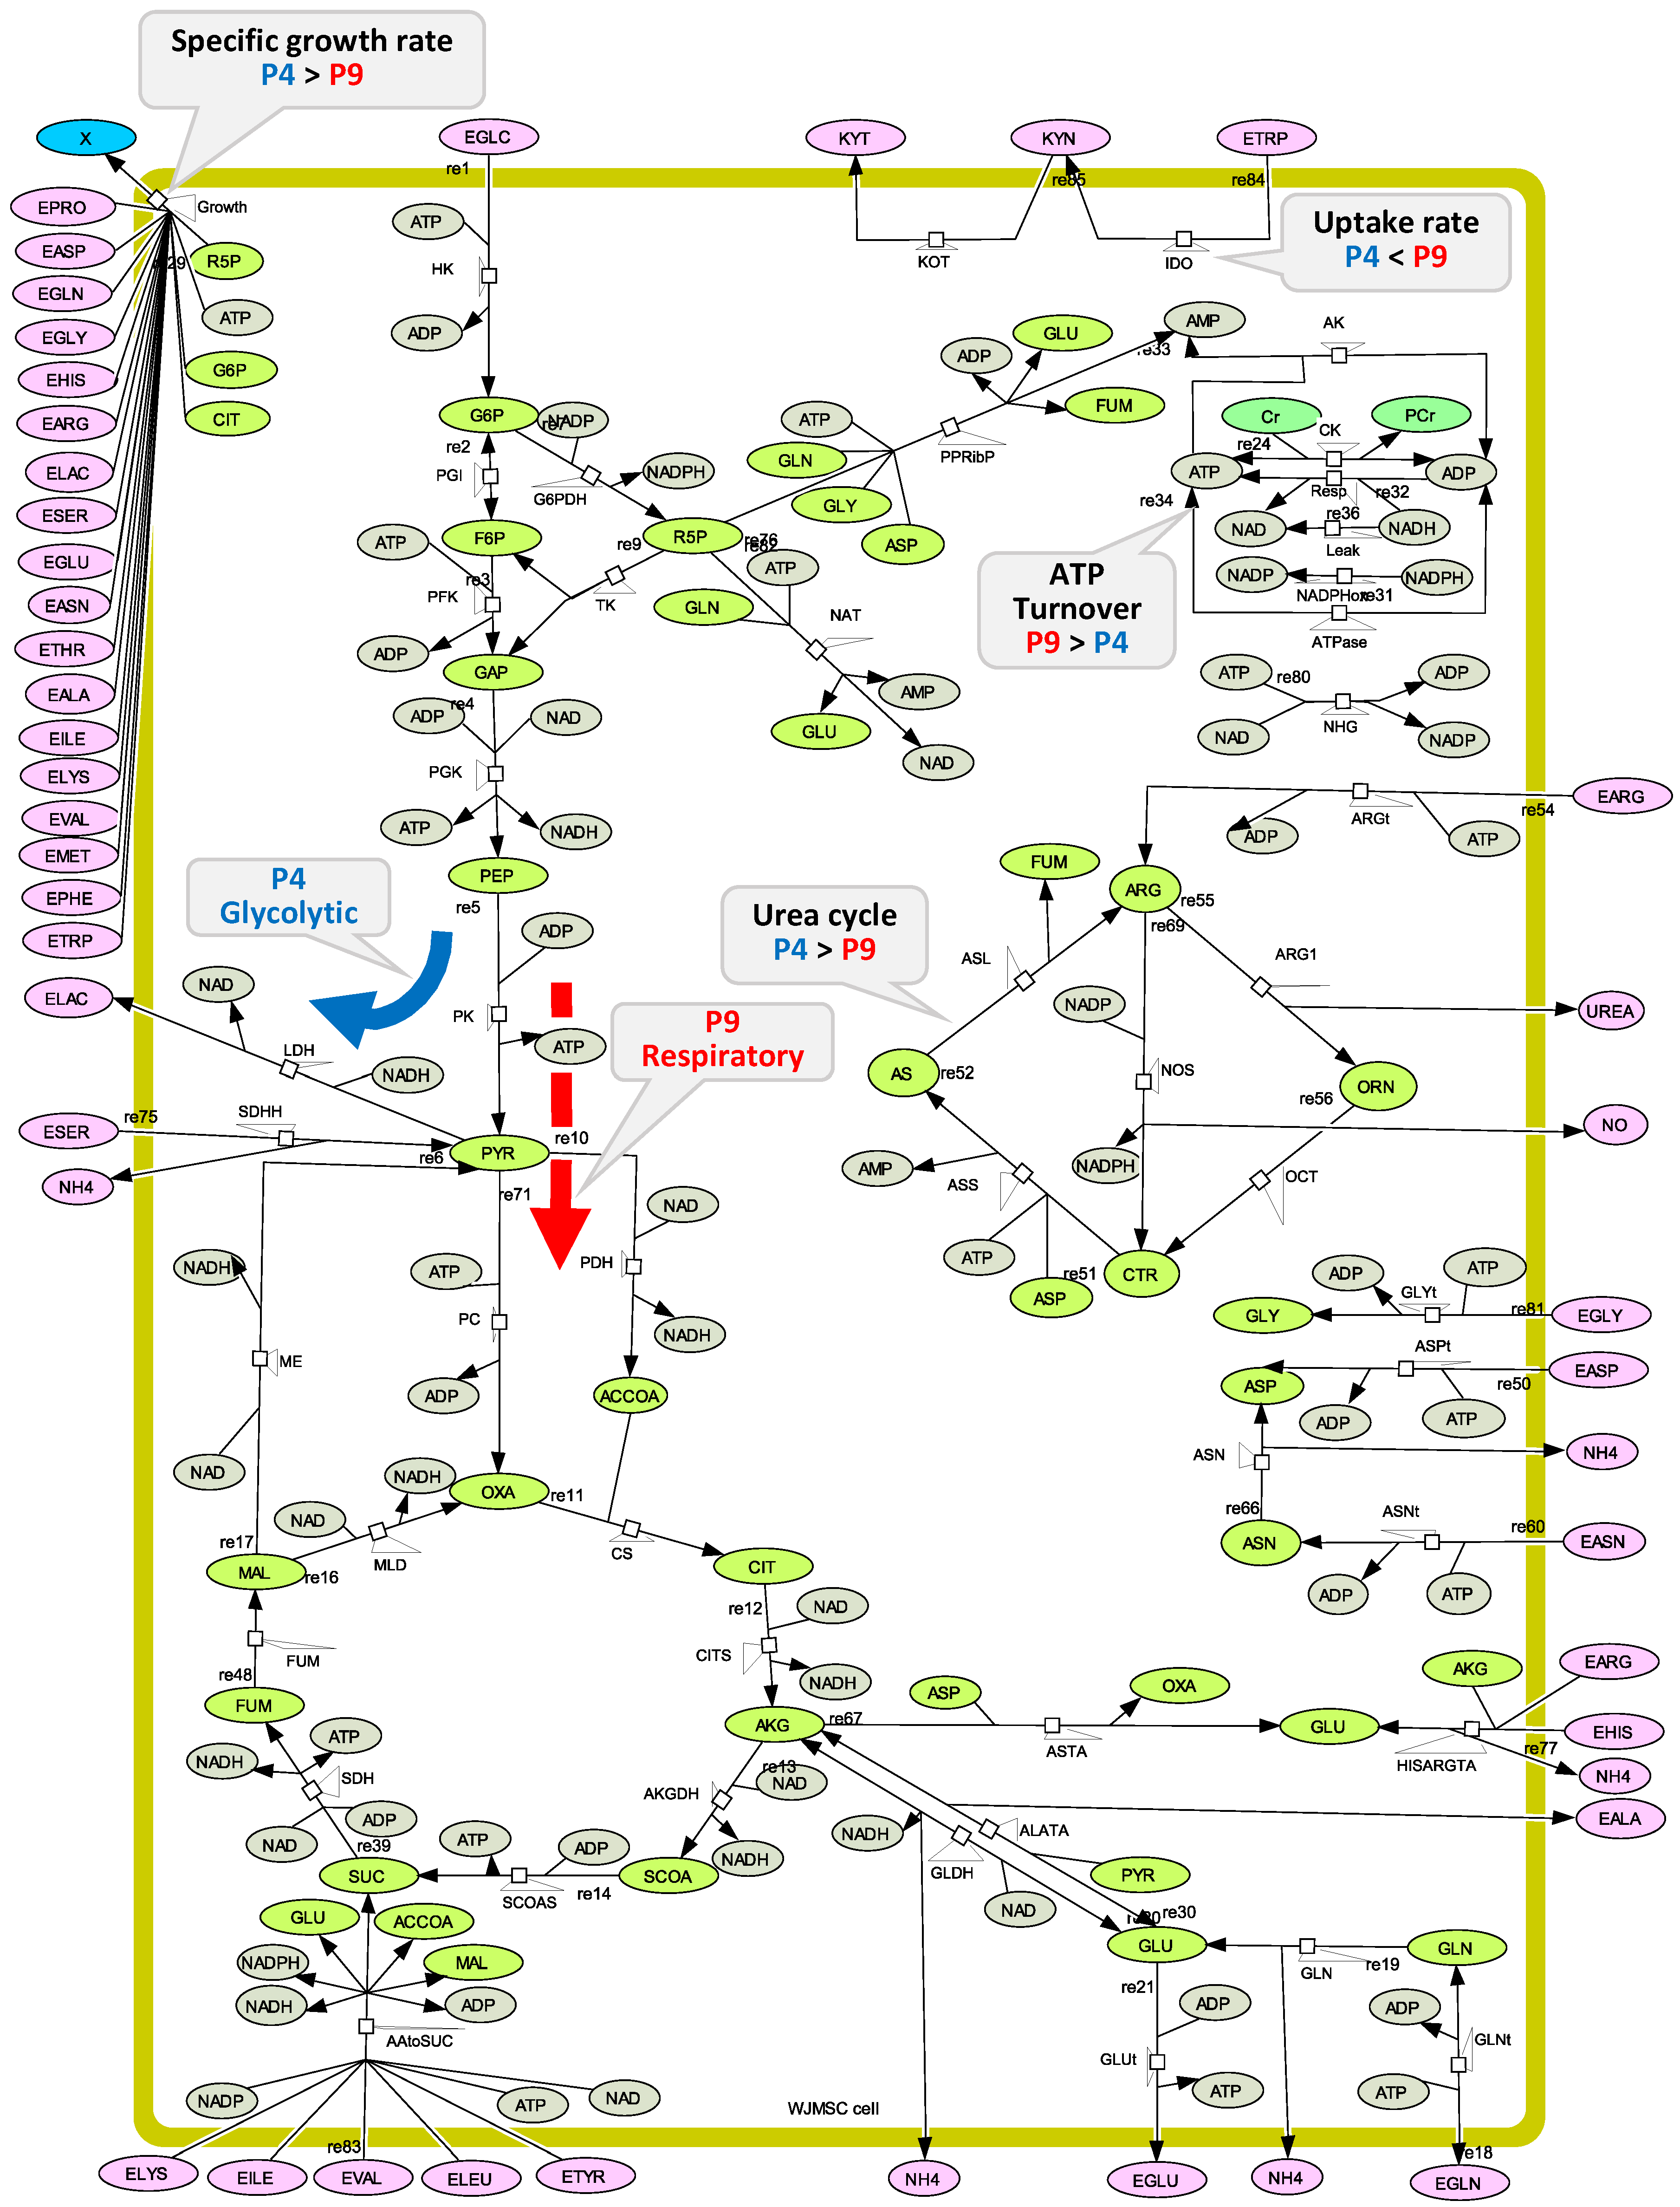
2.4. P4 Cells Present a More Active Metabolism Than P9 Passage Cells
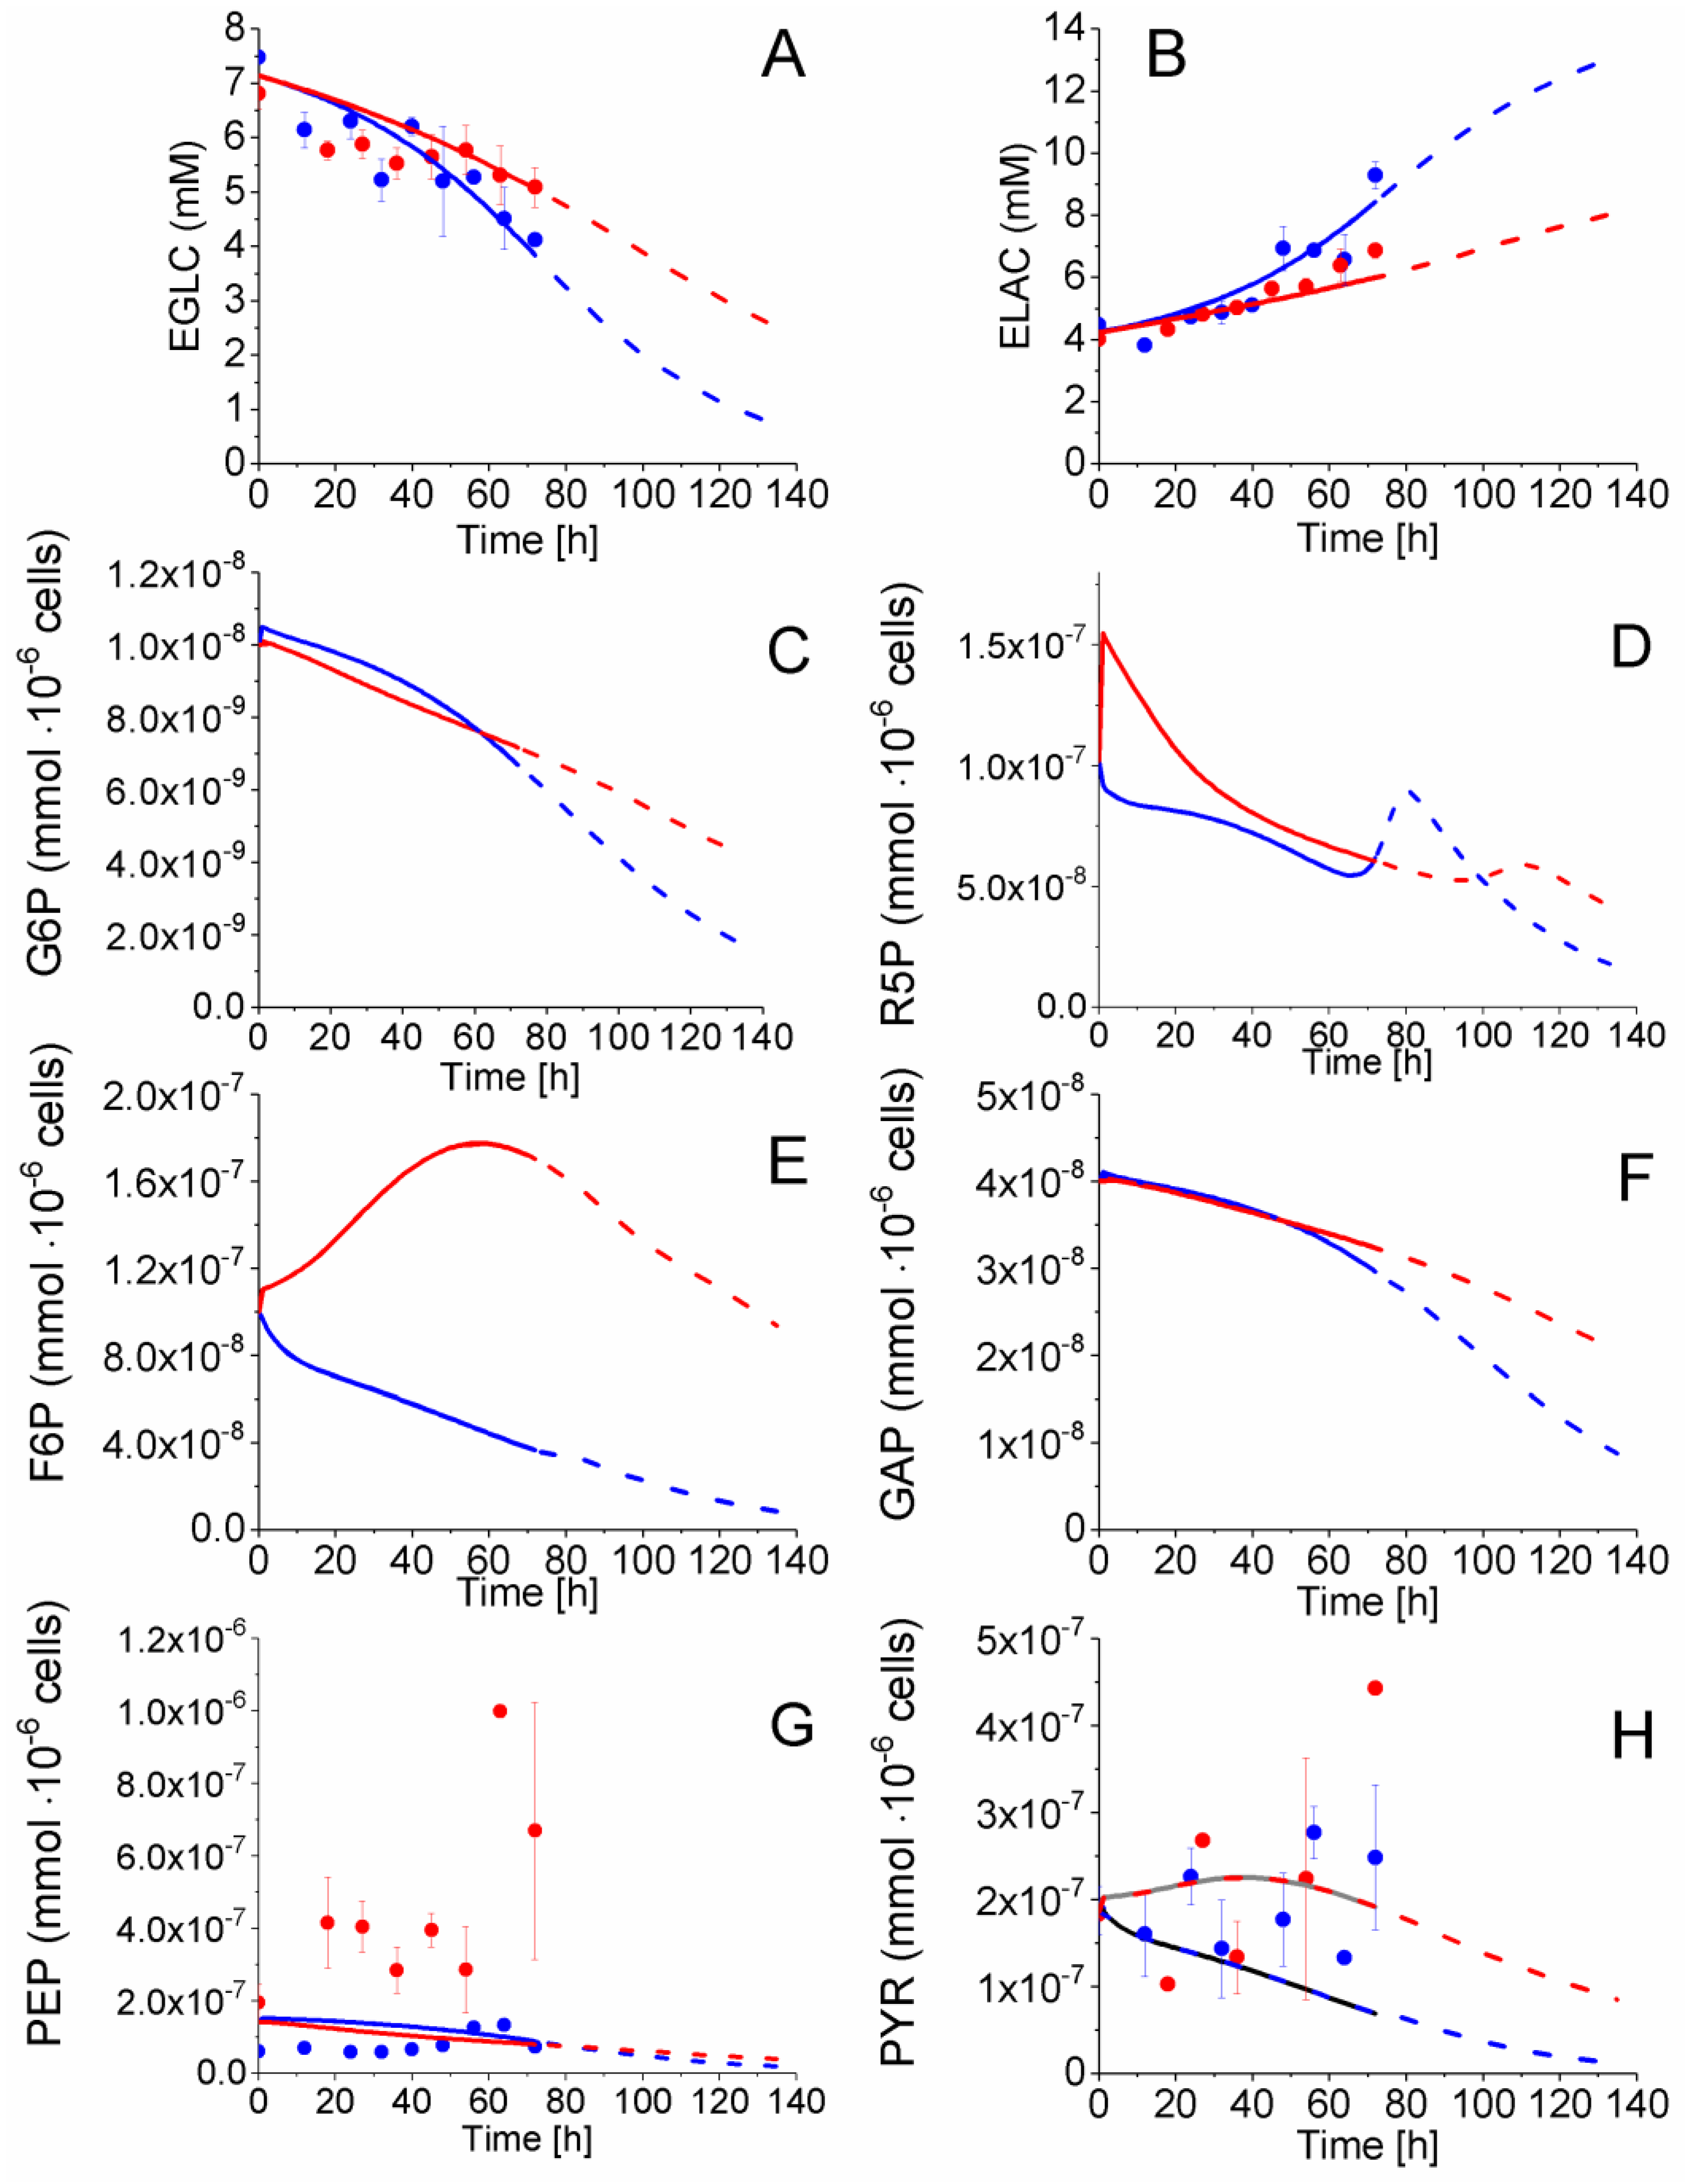
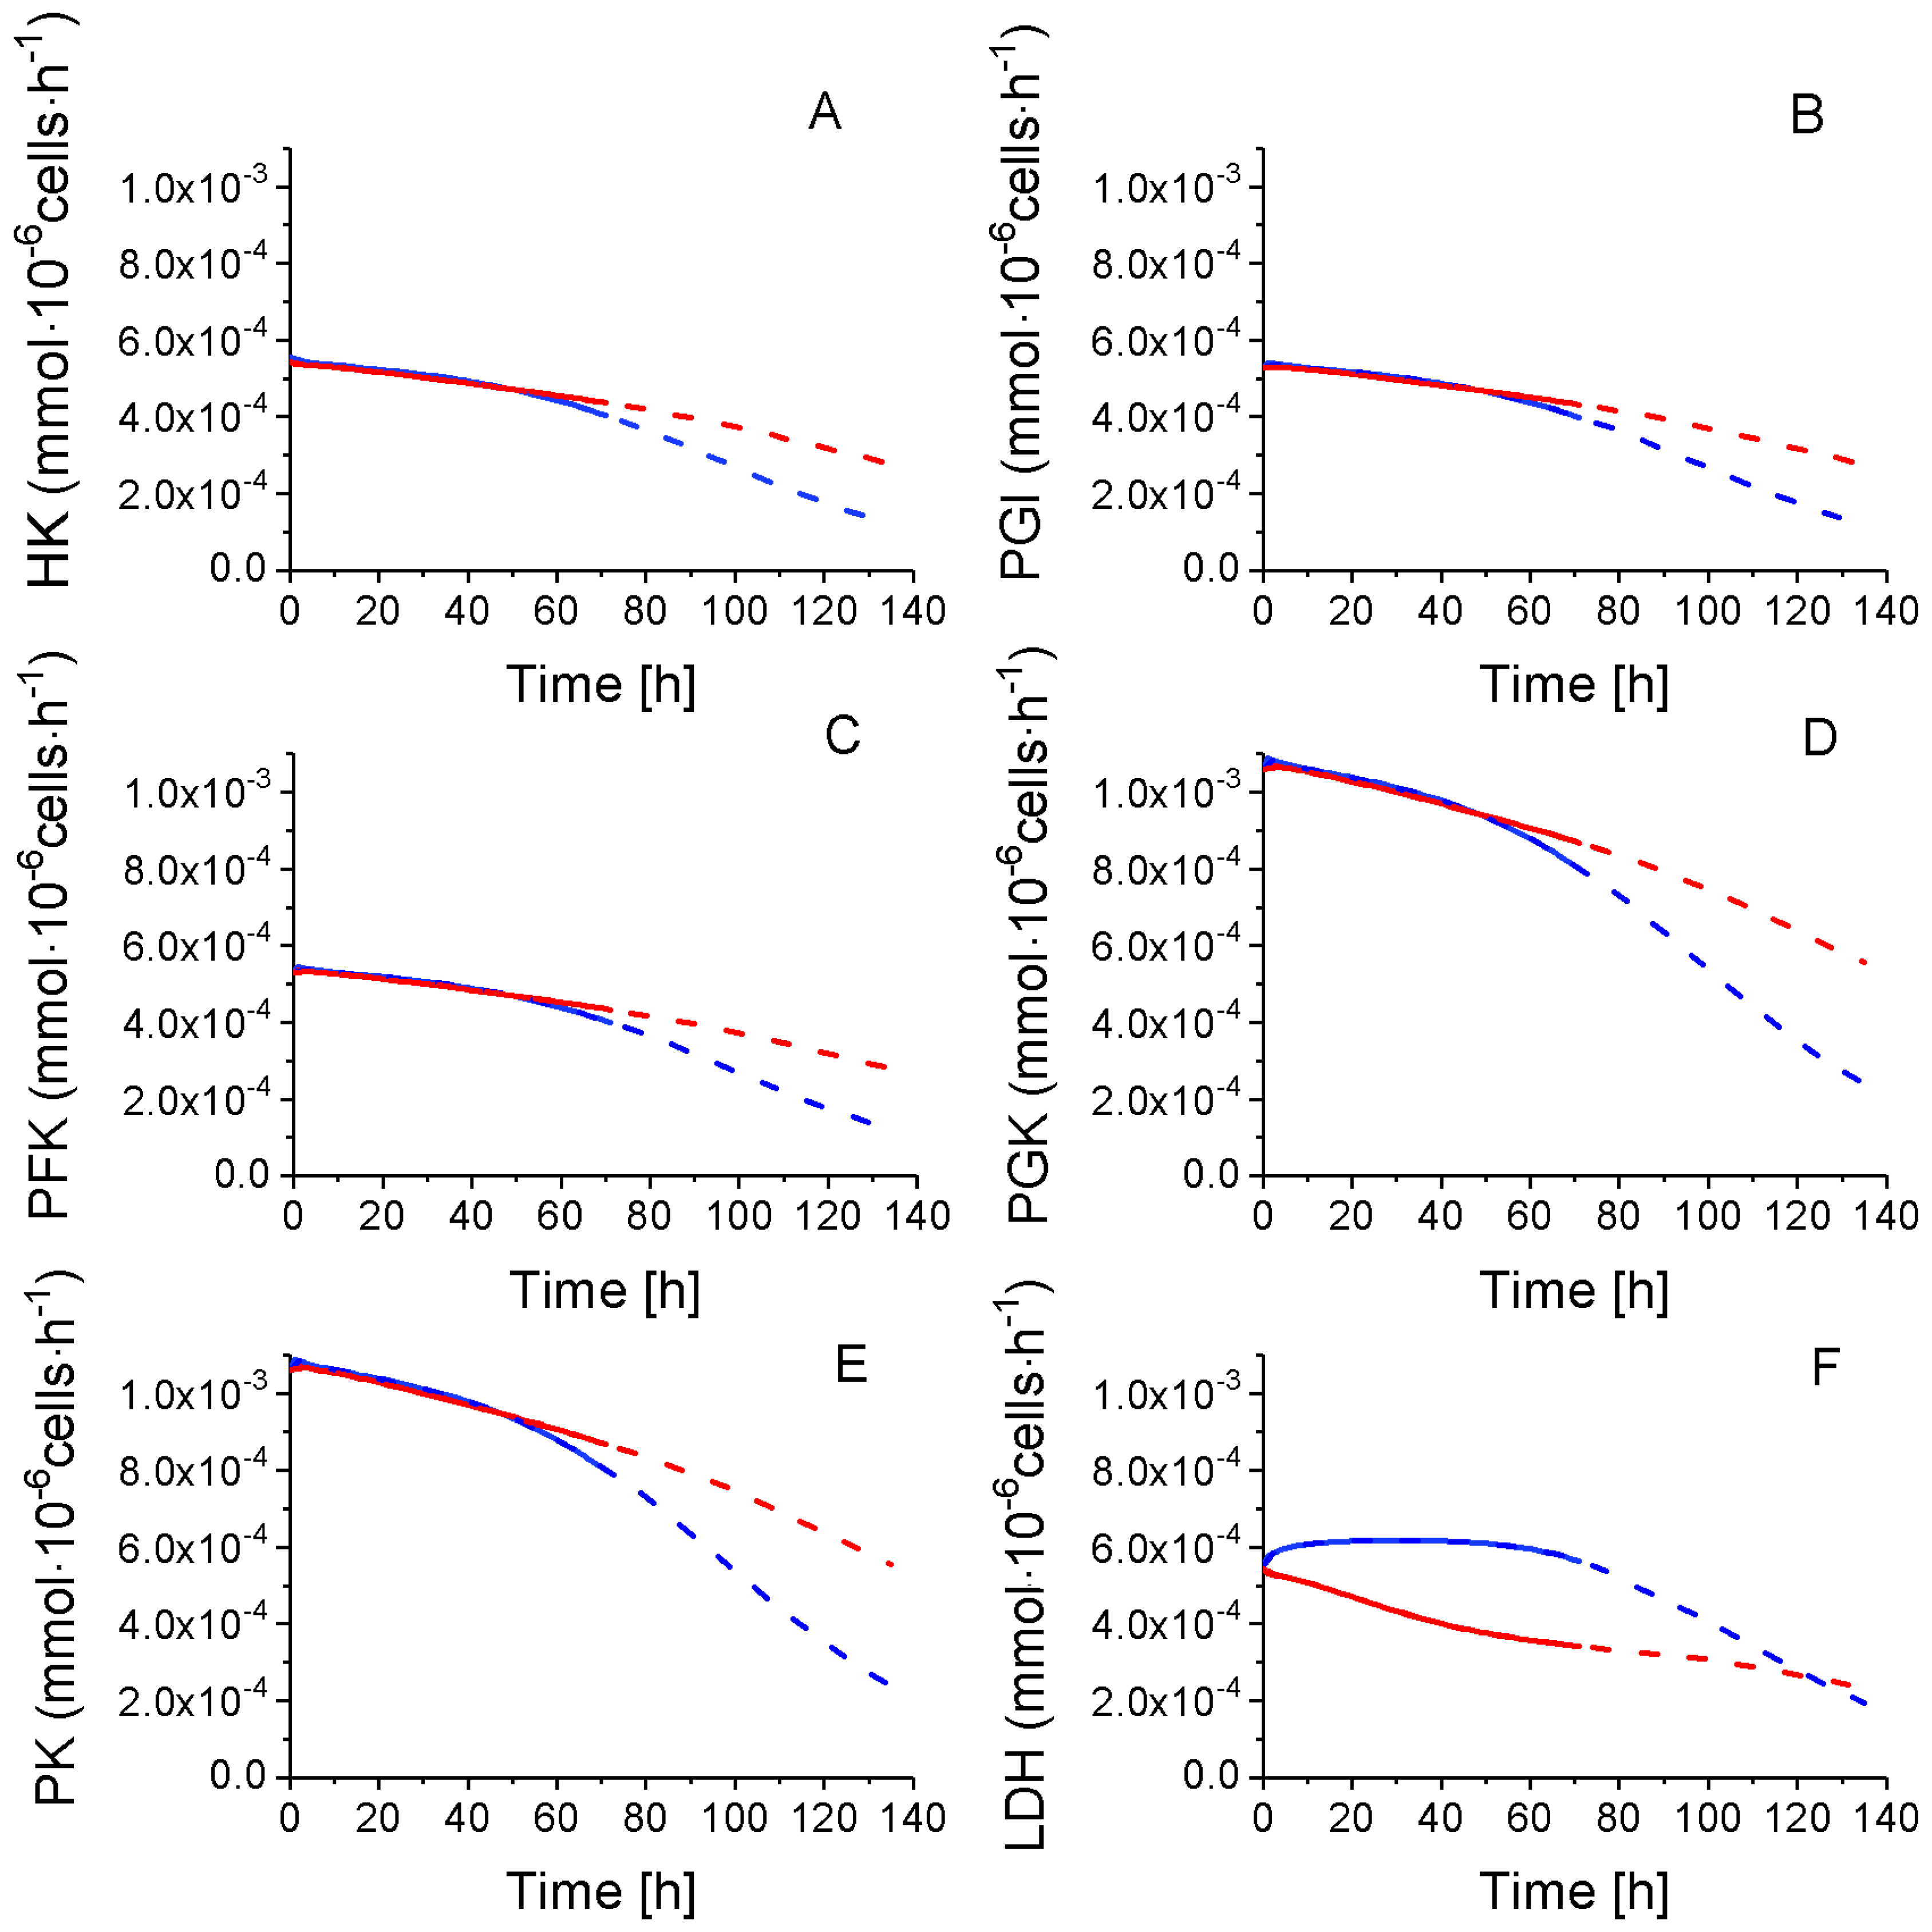
2.4.1. Glycolysis Pathway
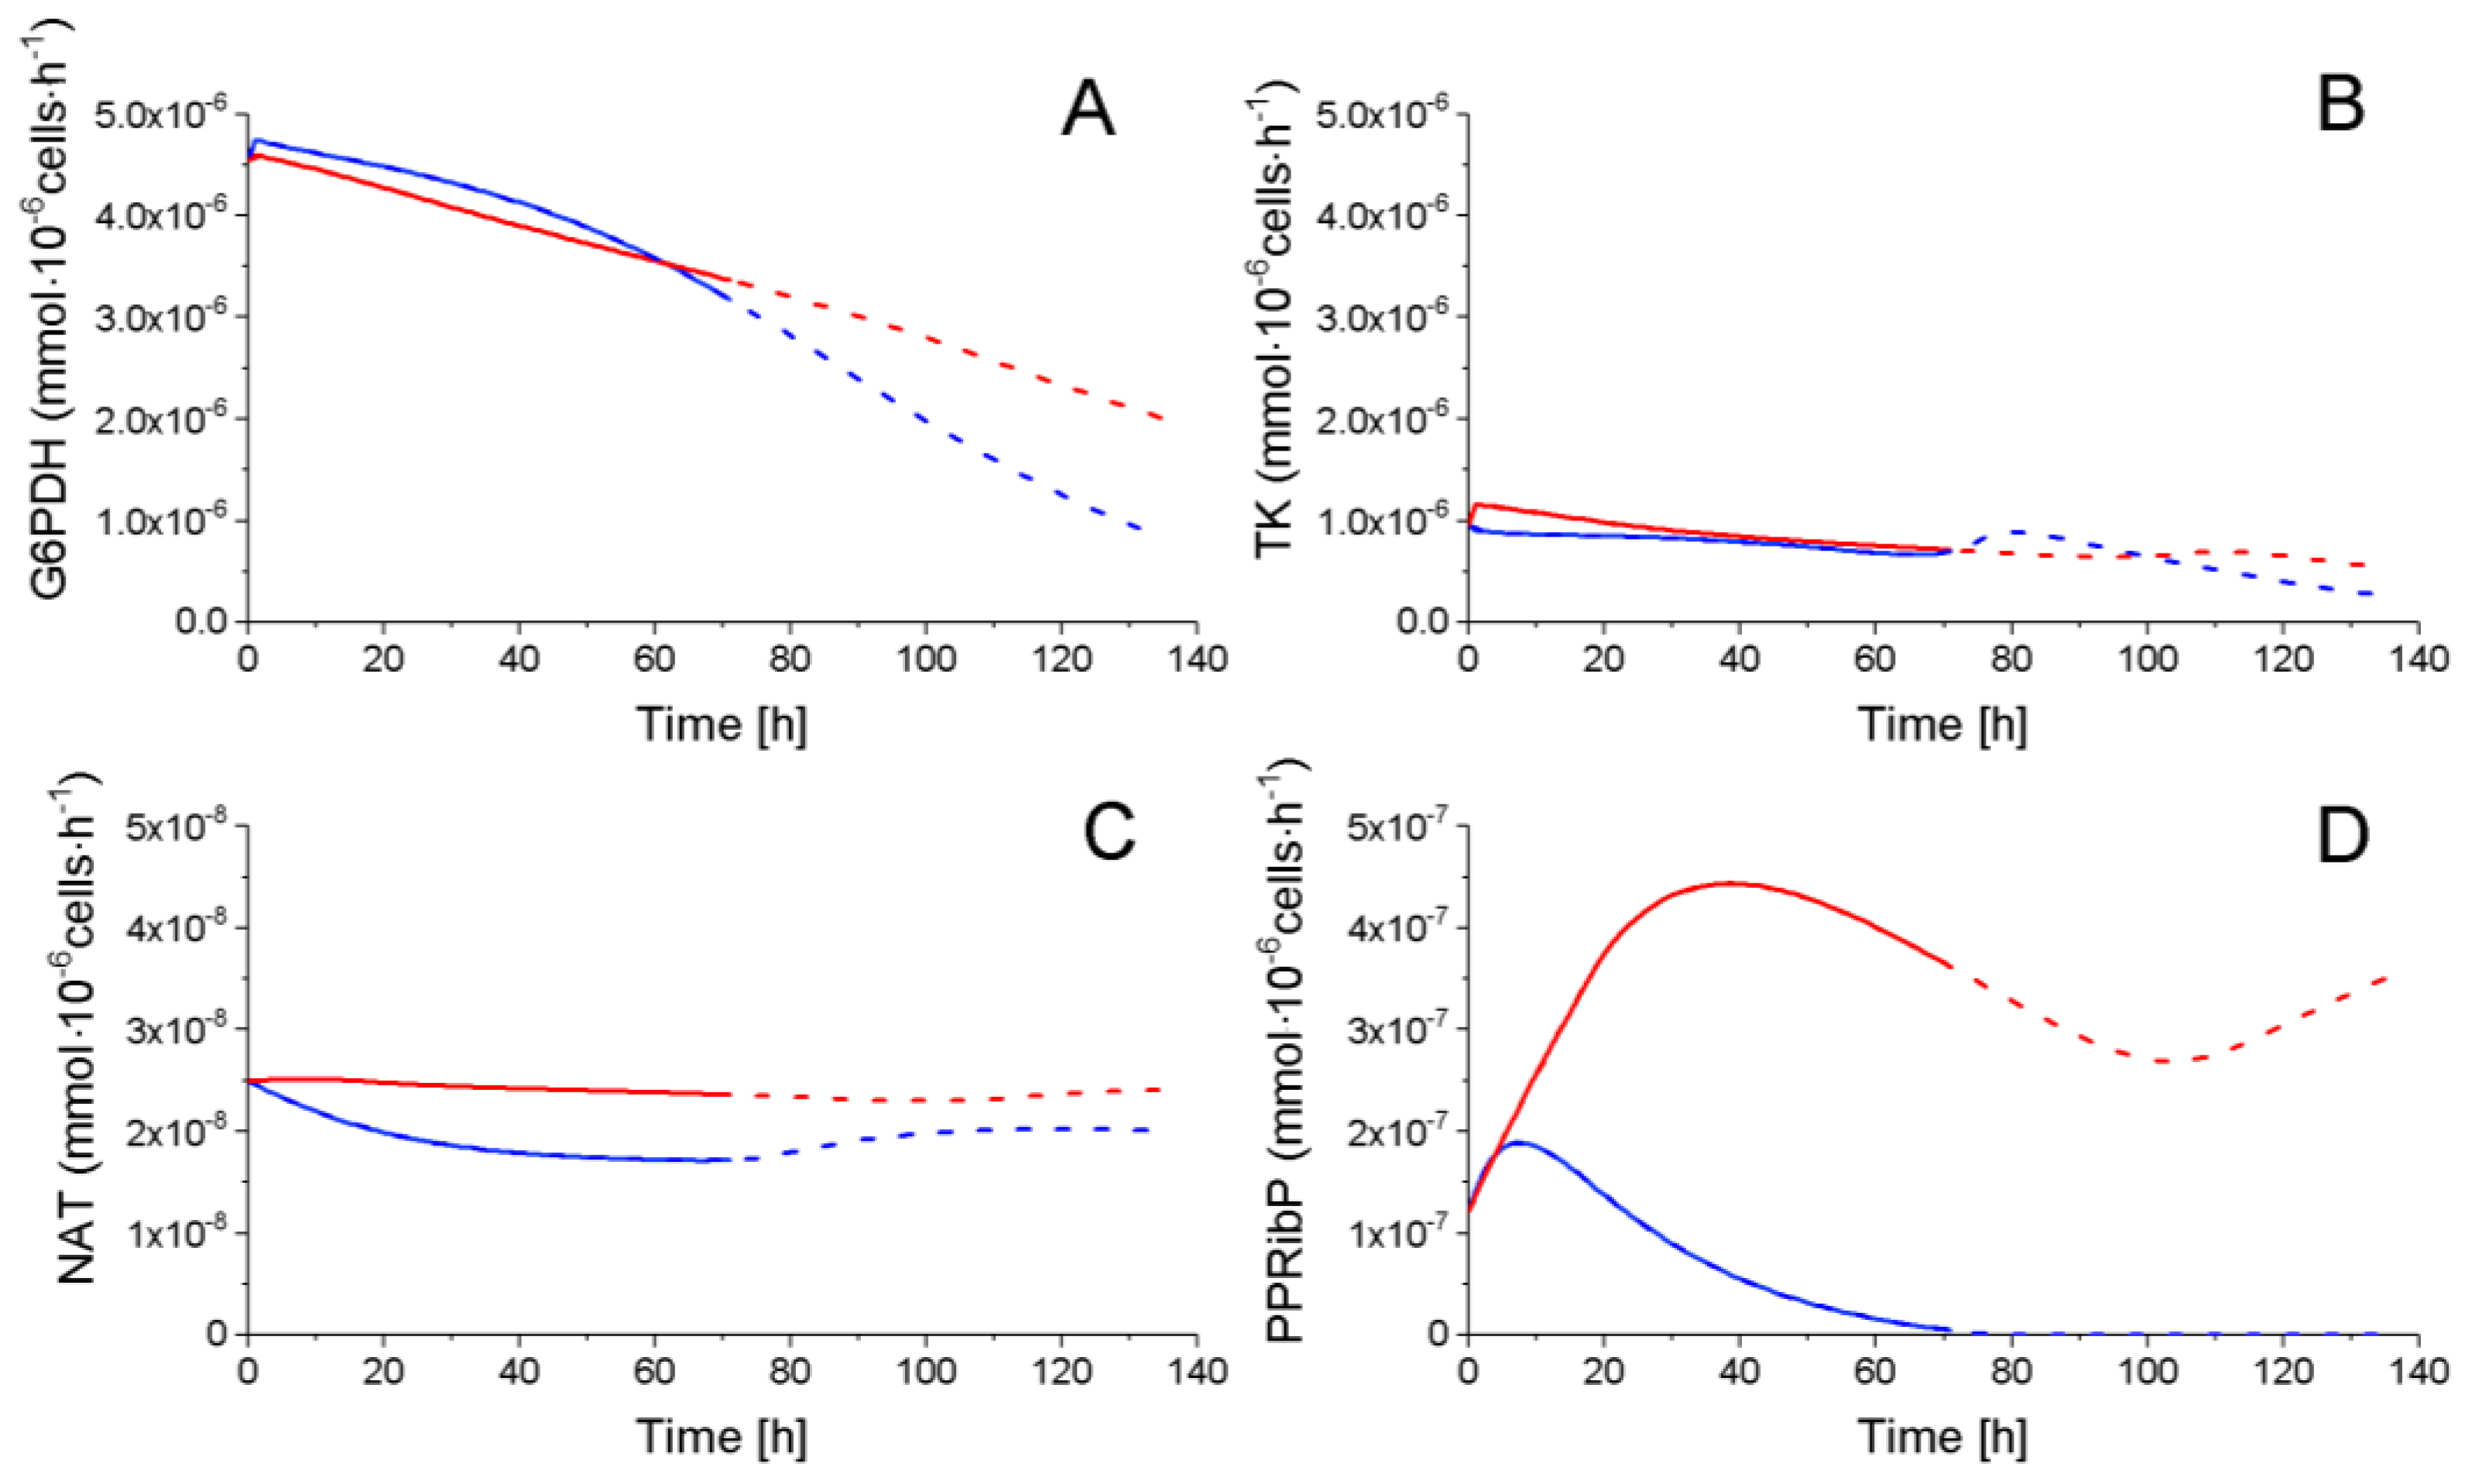
2.4.2. The Pentose Phosphate Pathway Is More Solicited in P9 Cells
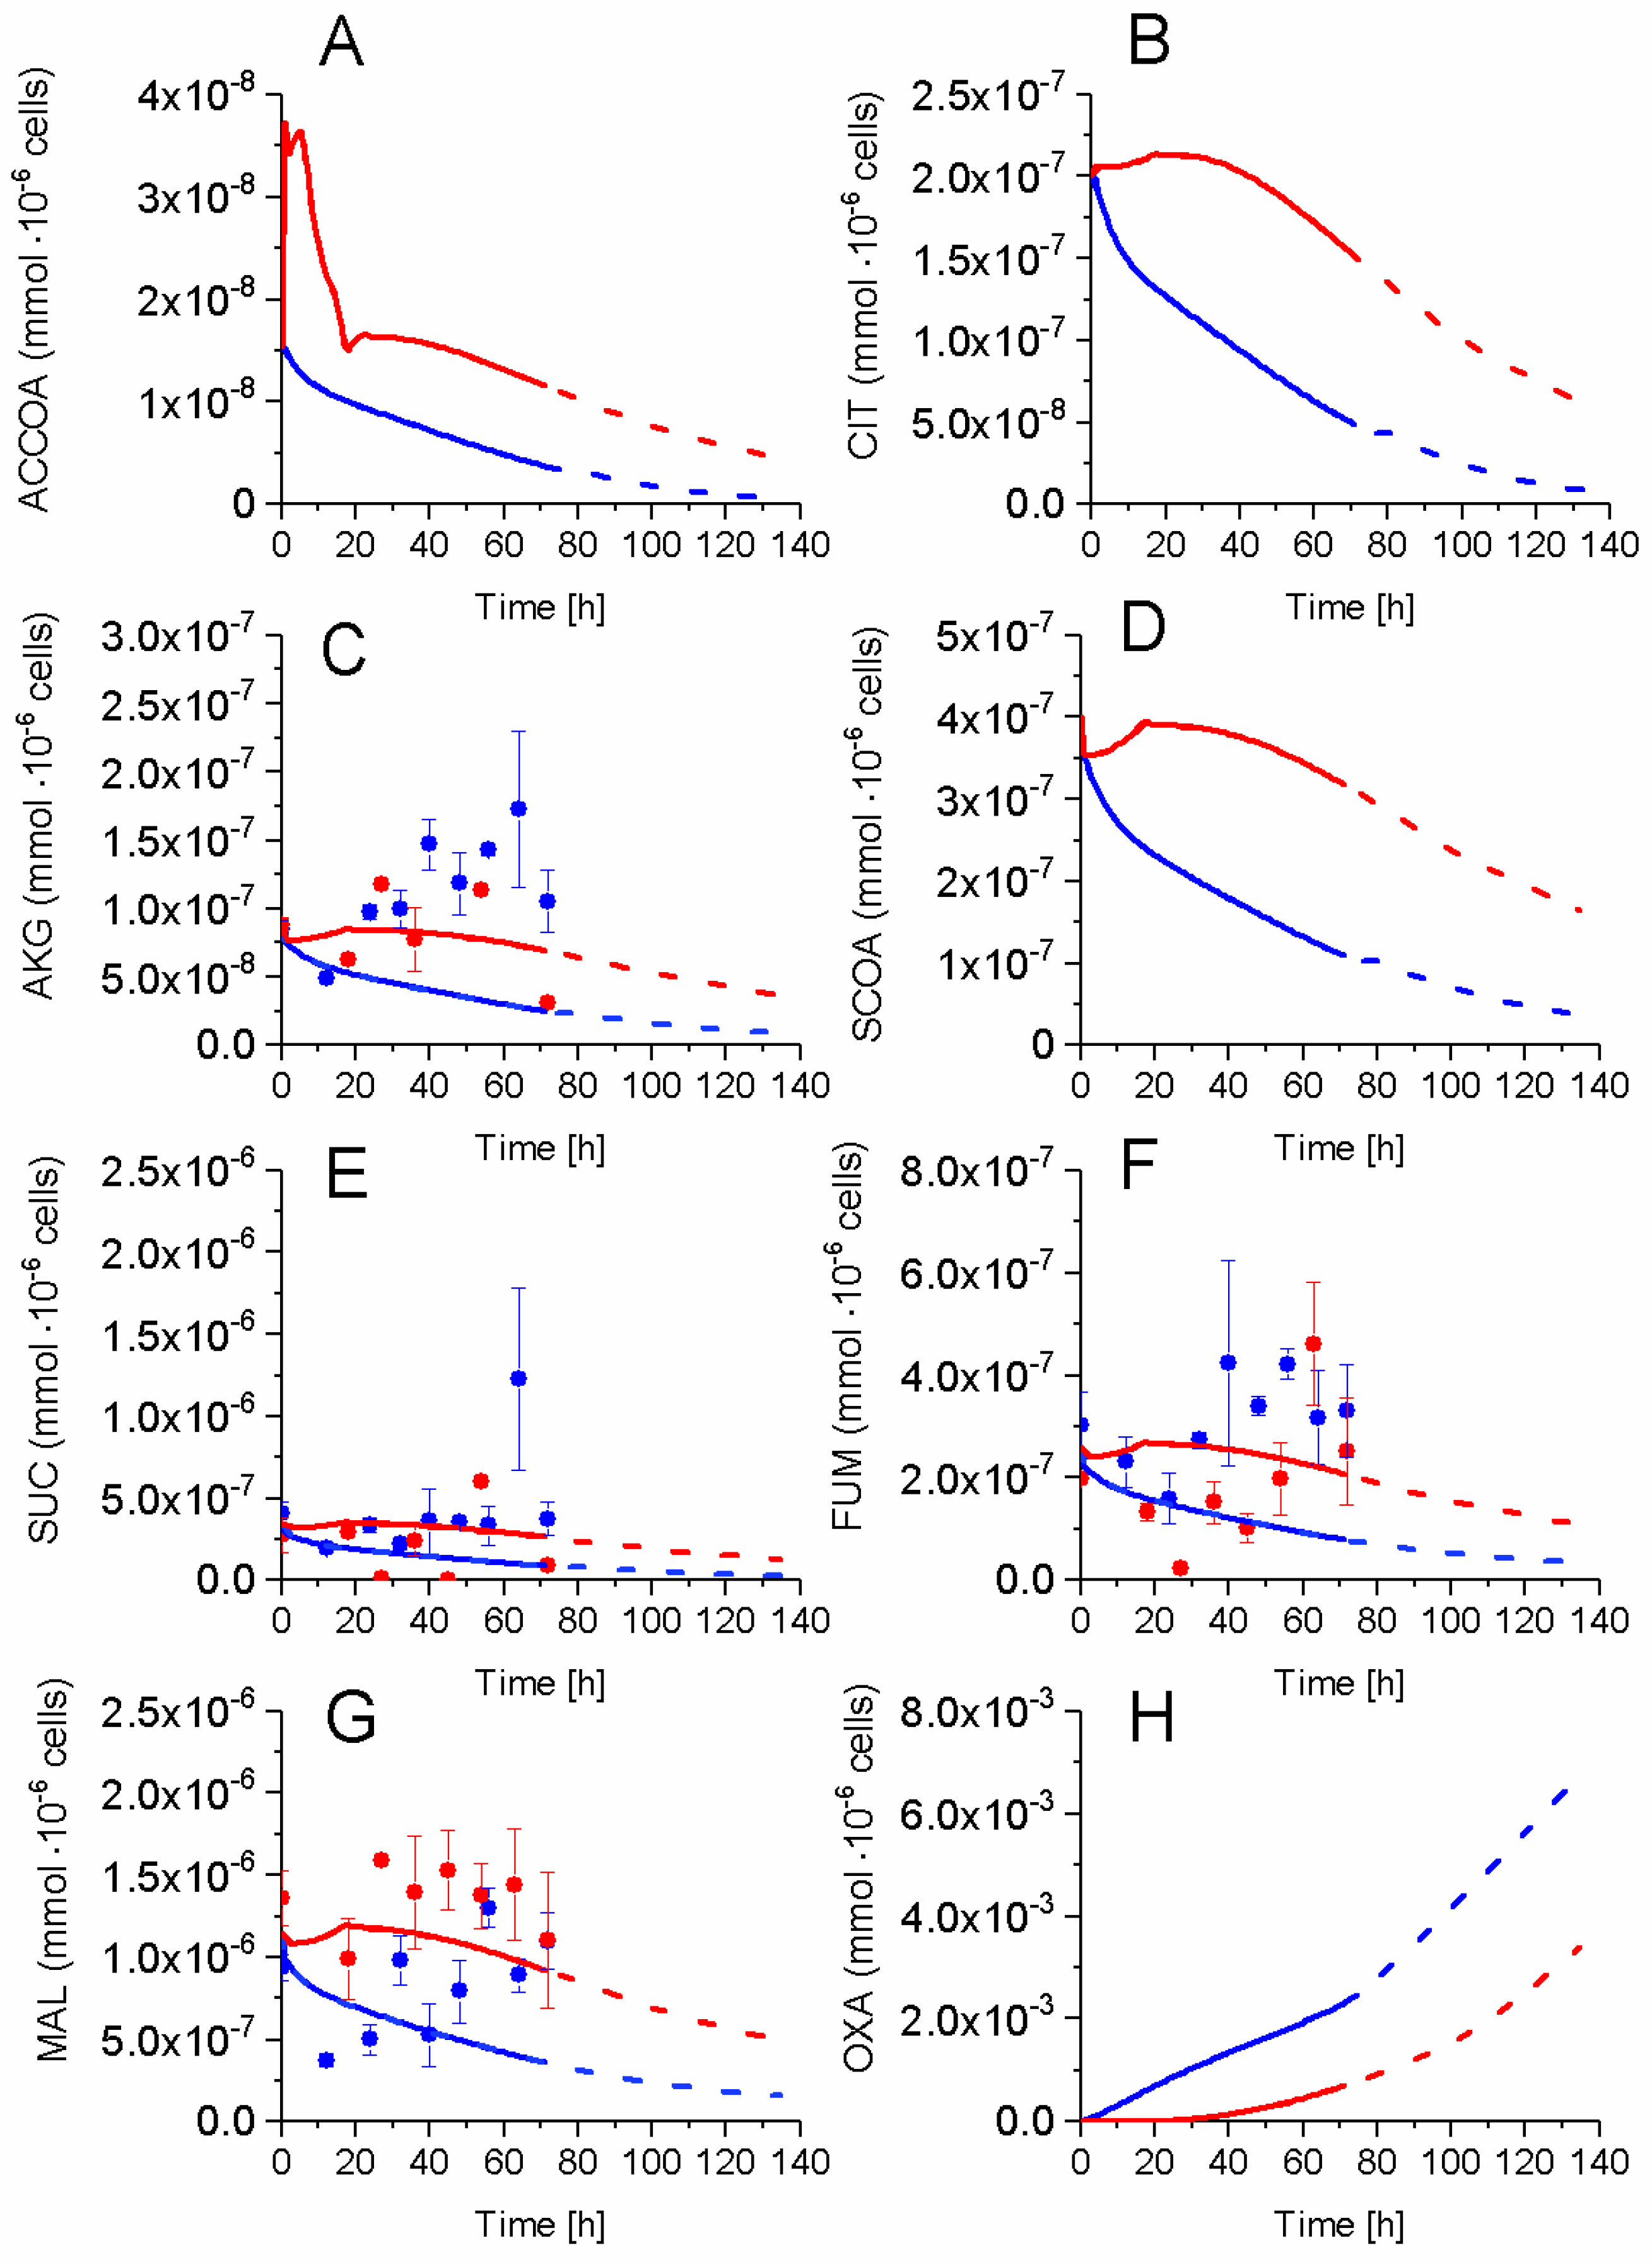
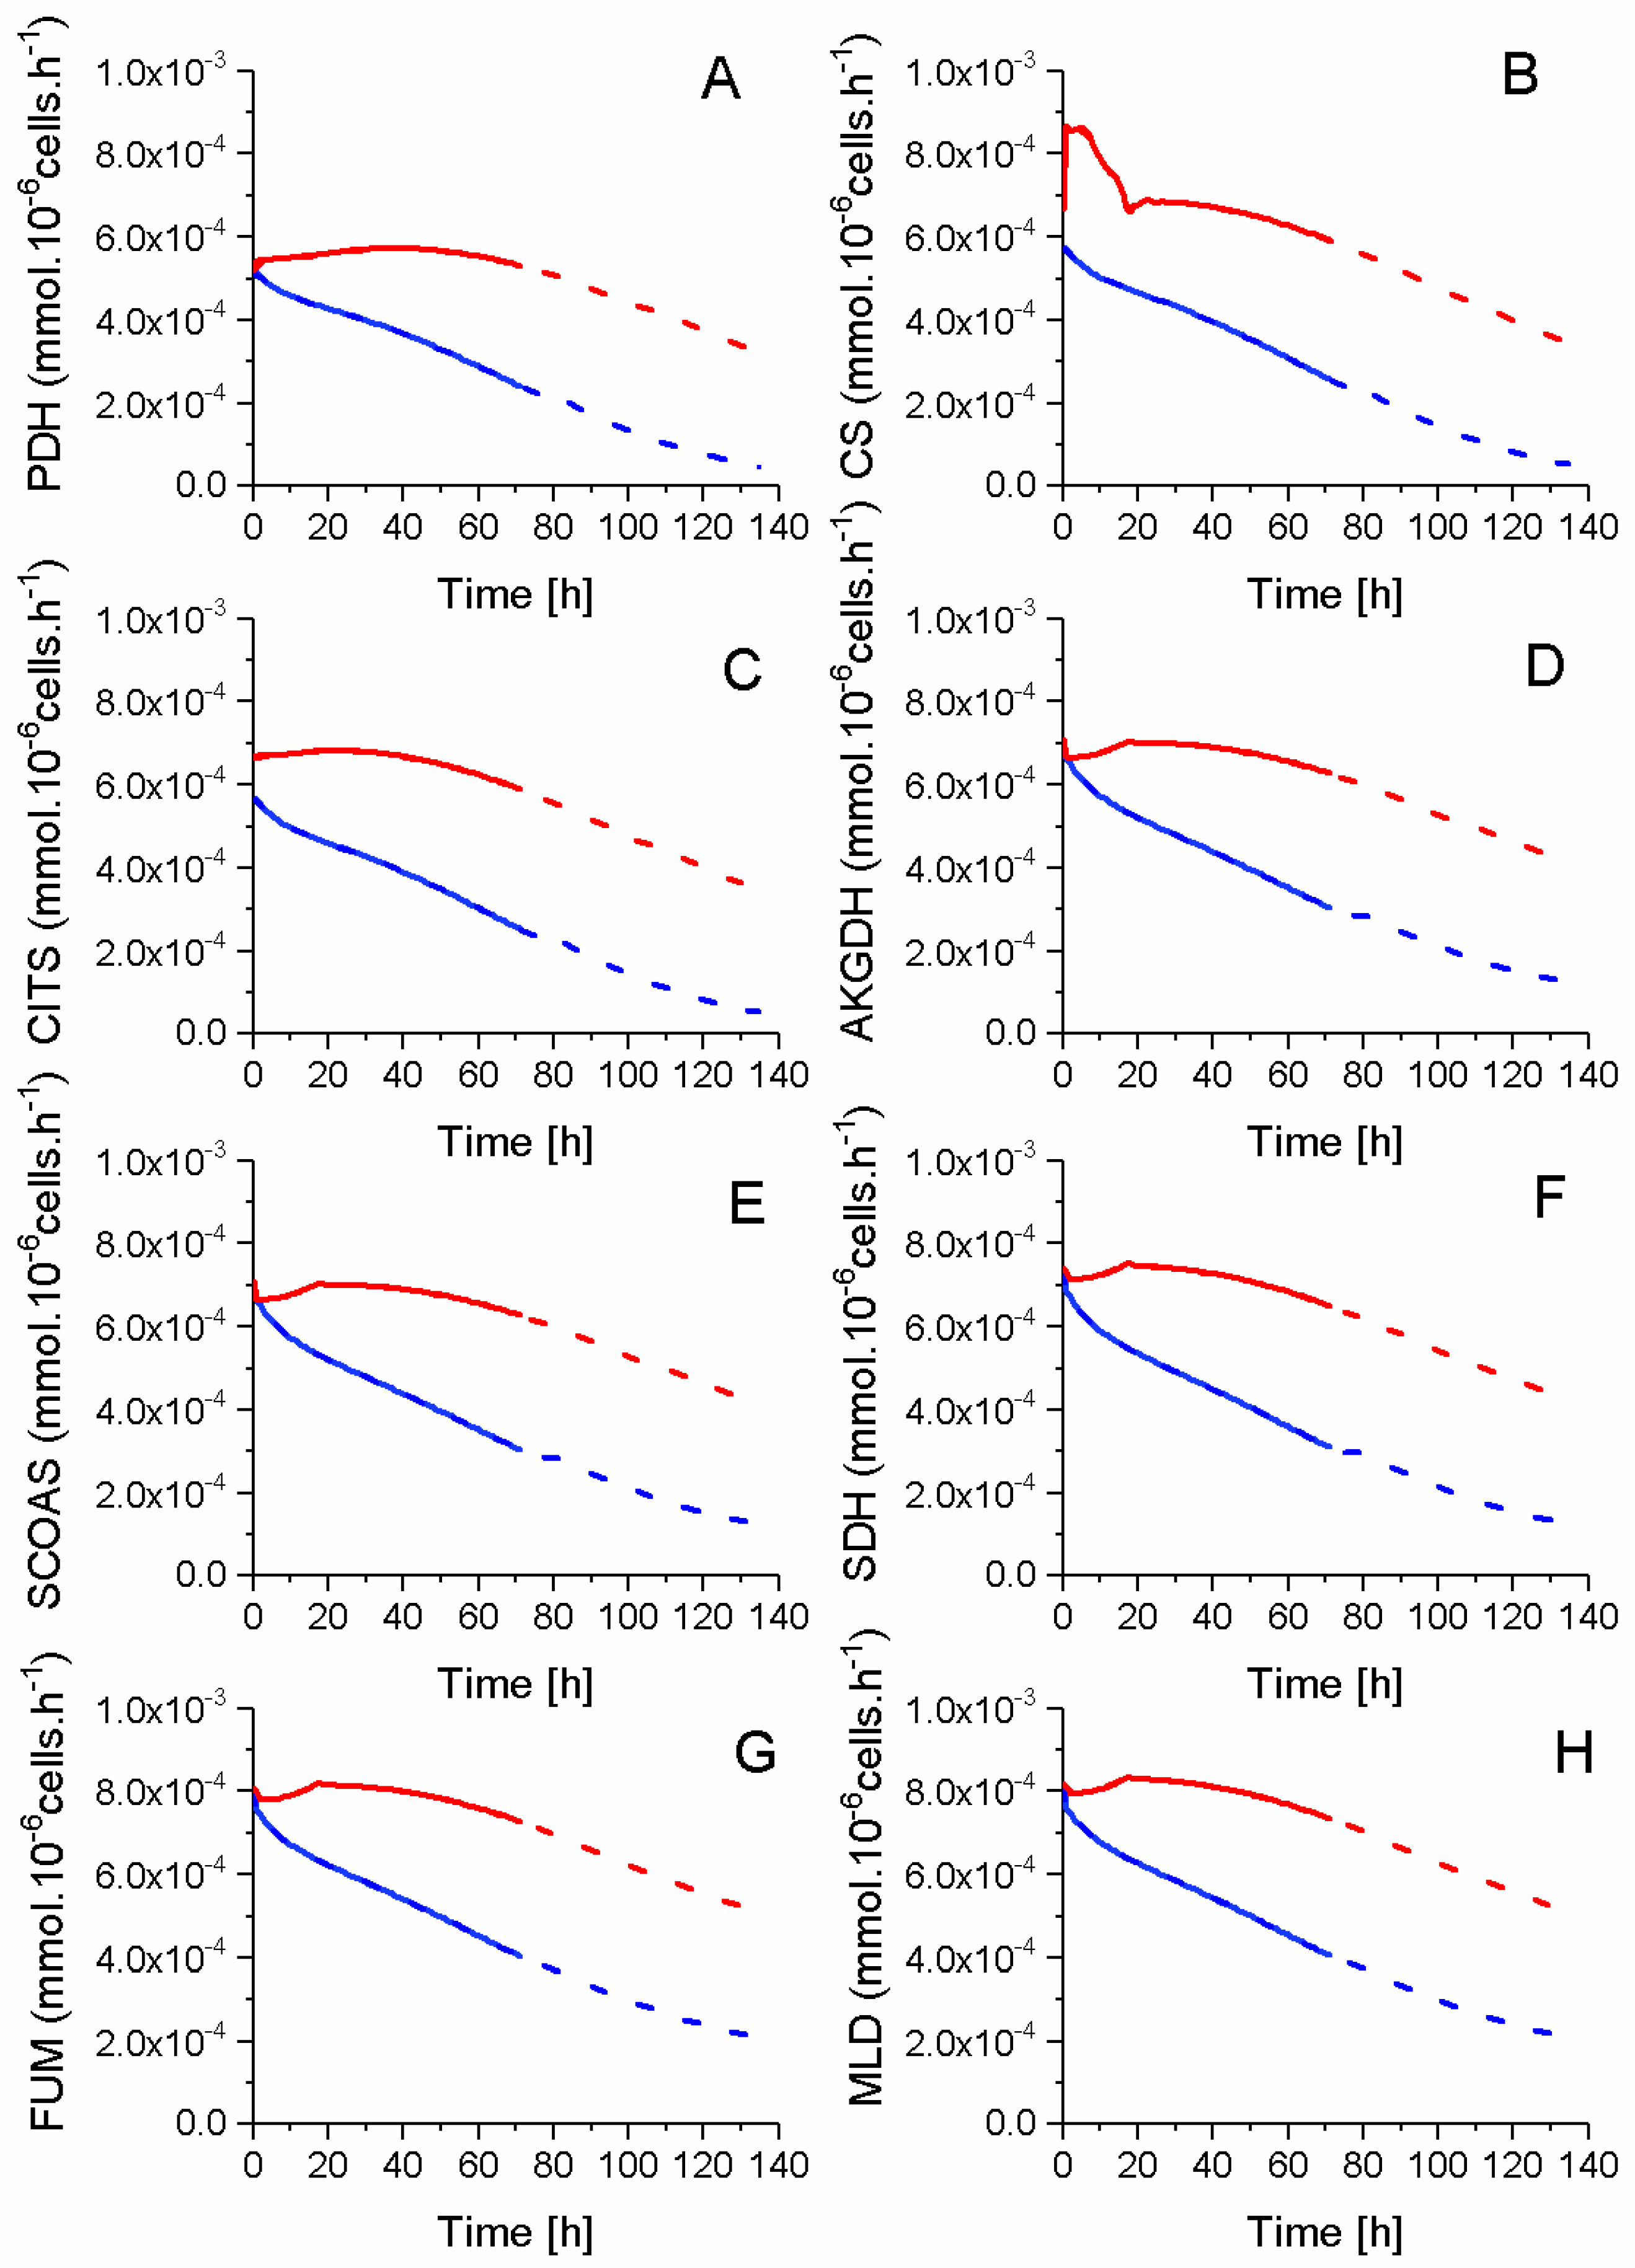
2.5. P9 Cells Maintain a Higher TCA Activity
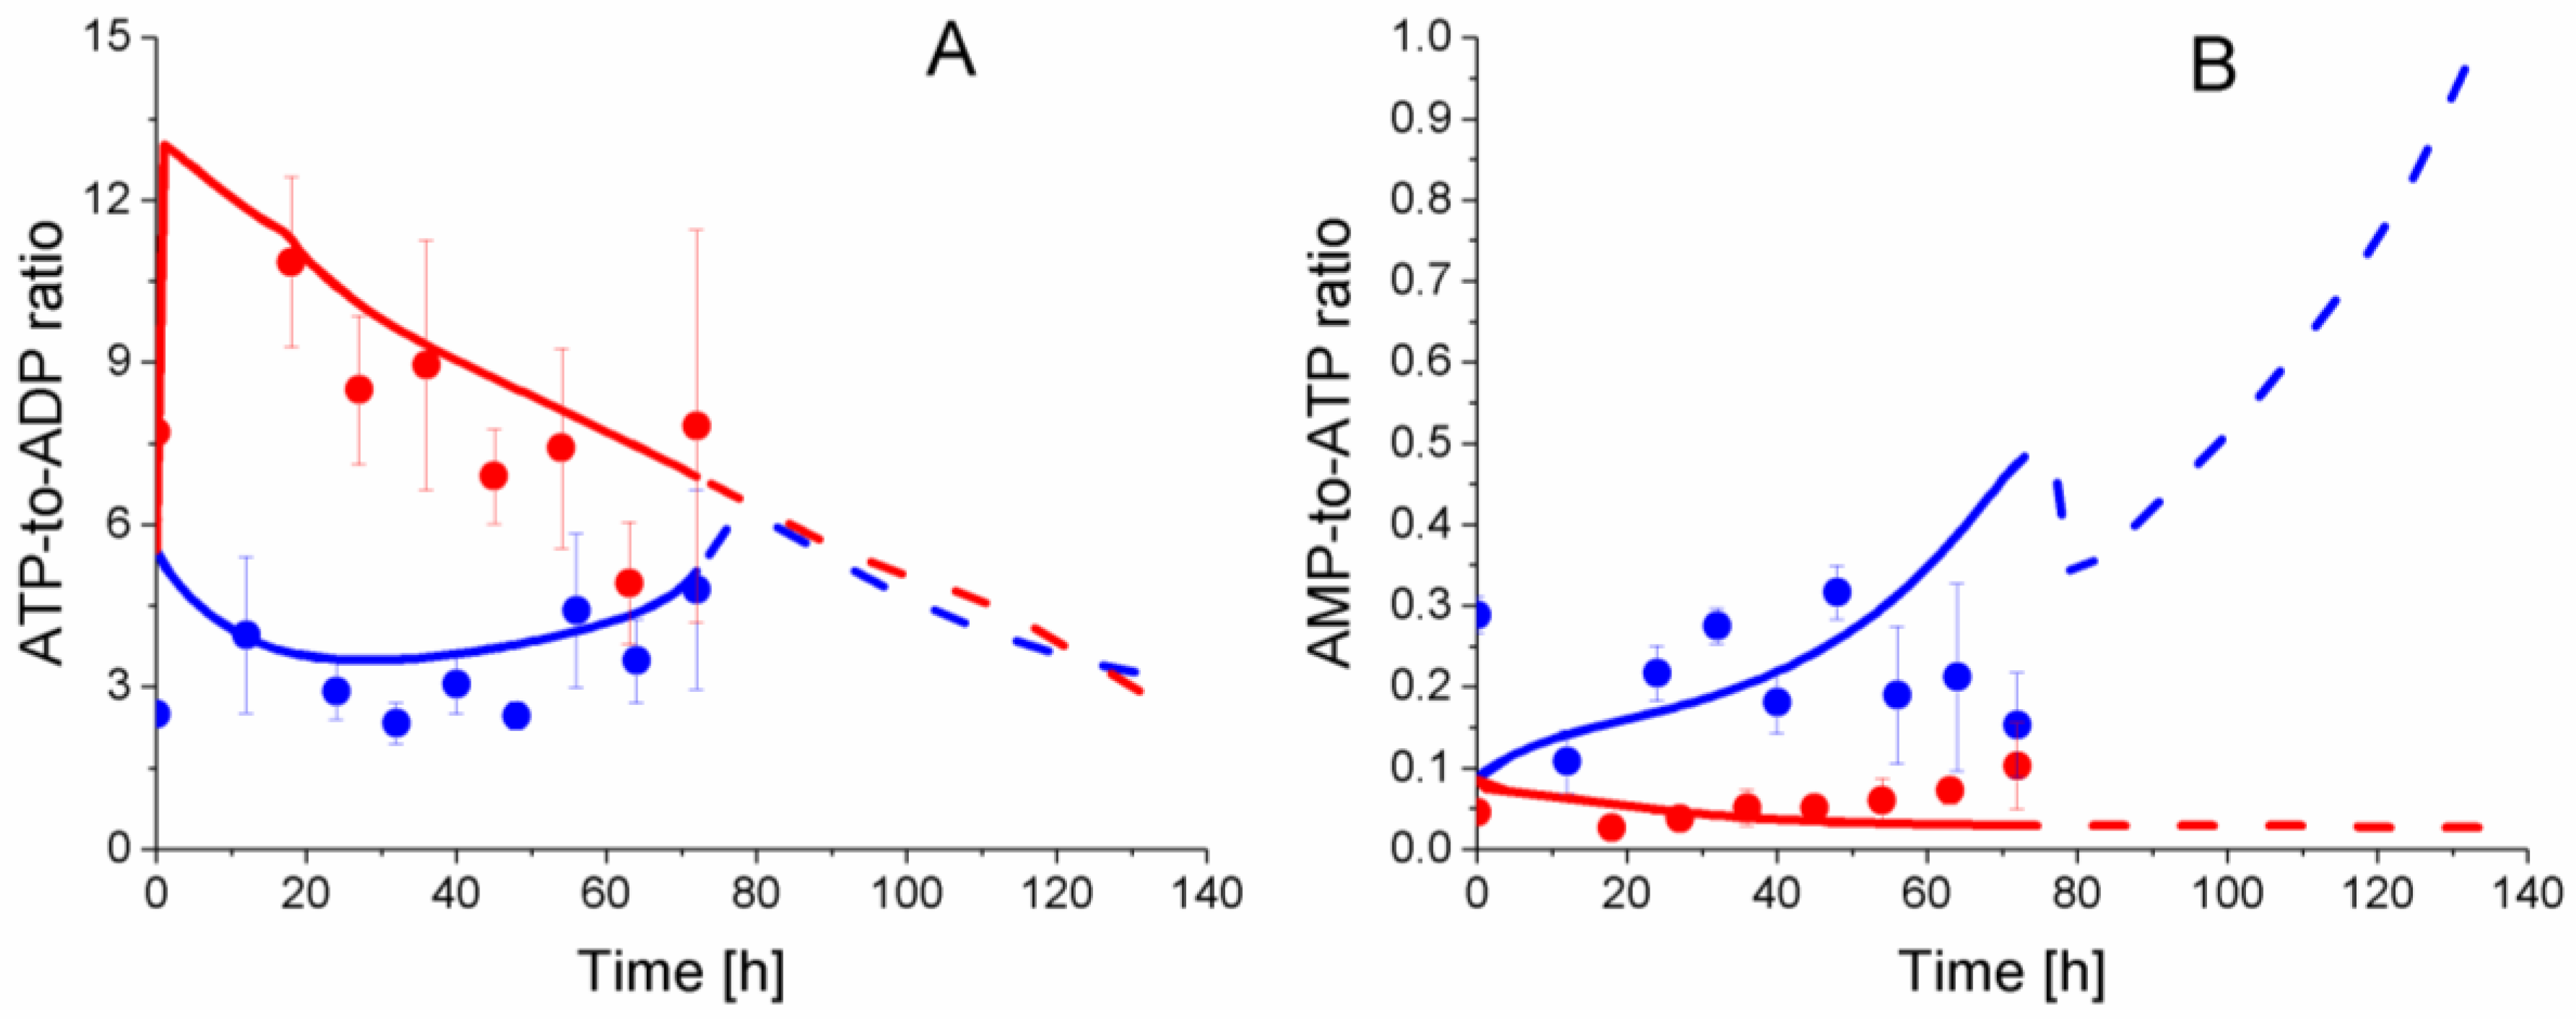
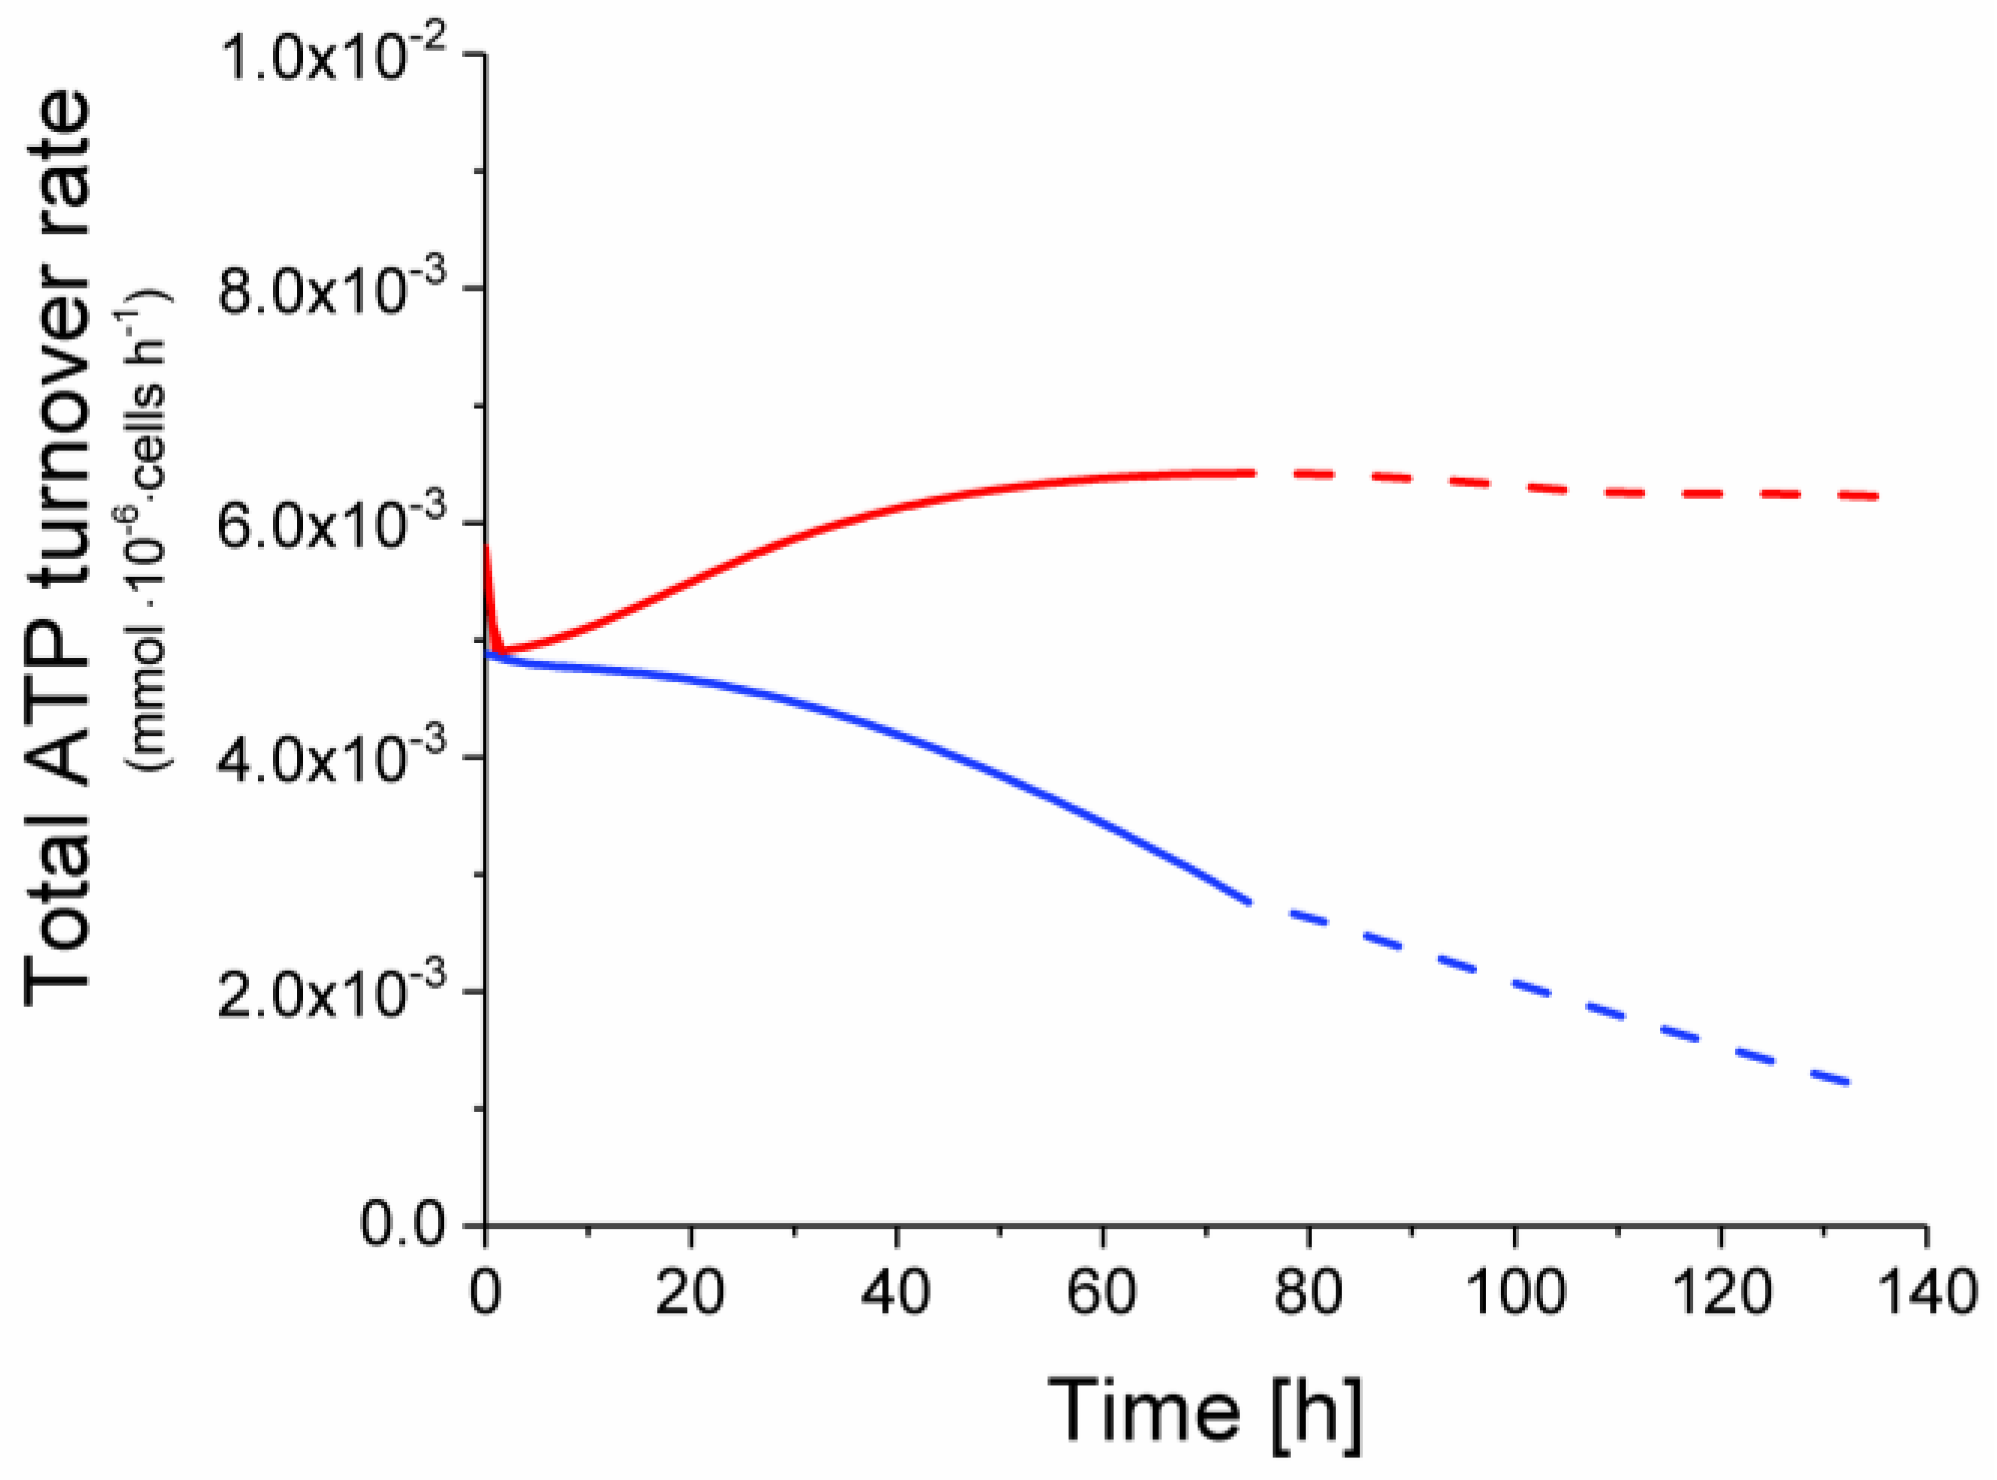
2.6. P9 Cells Exhibit a Higher ATP Turnover Rate than P4 Cells
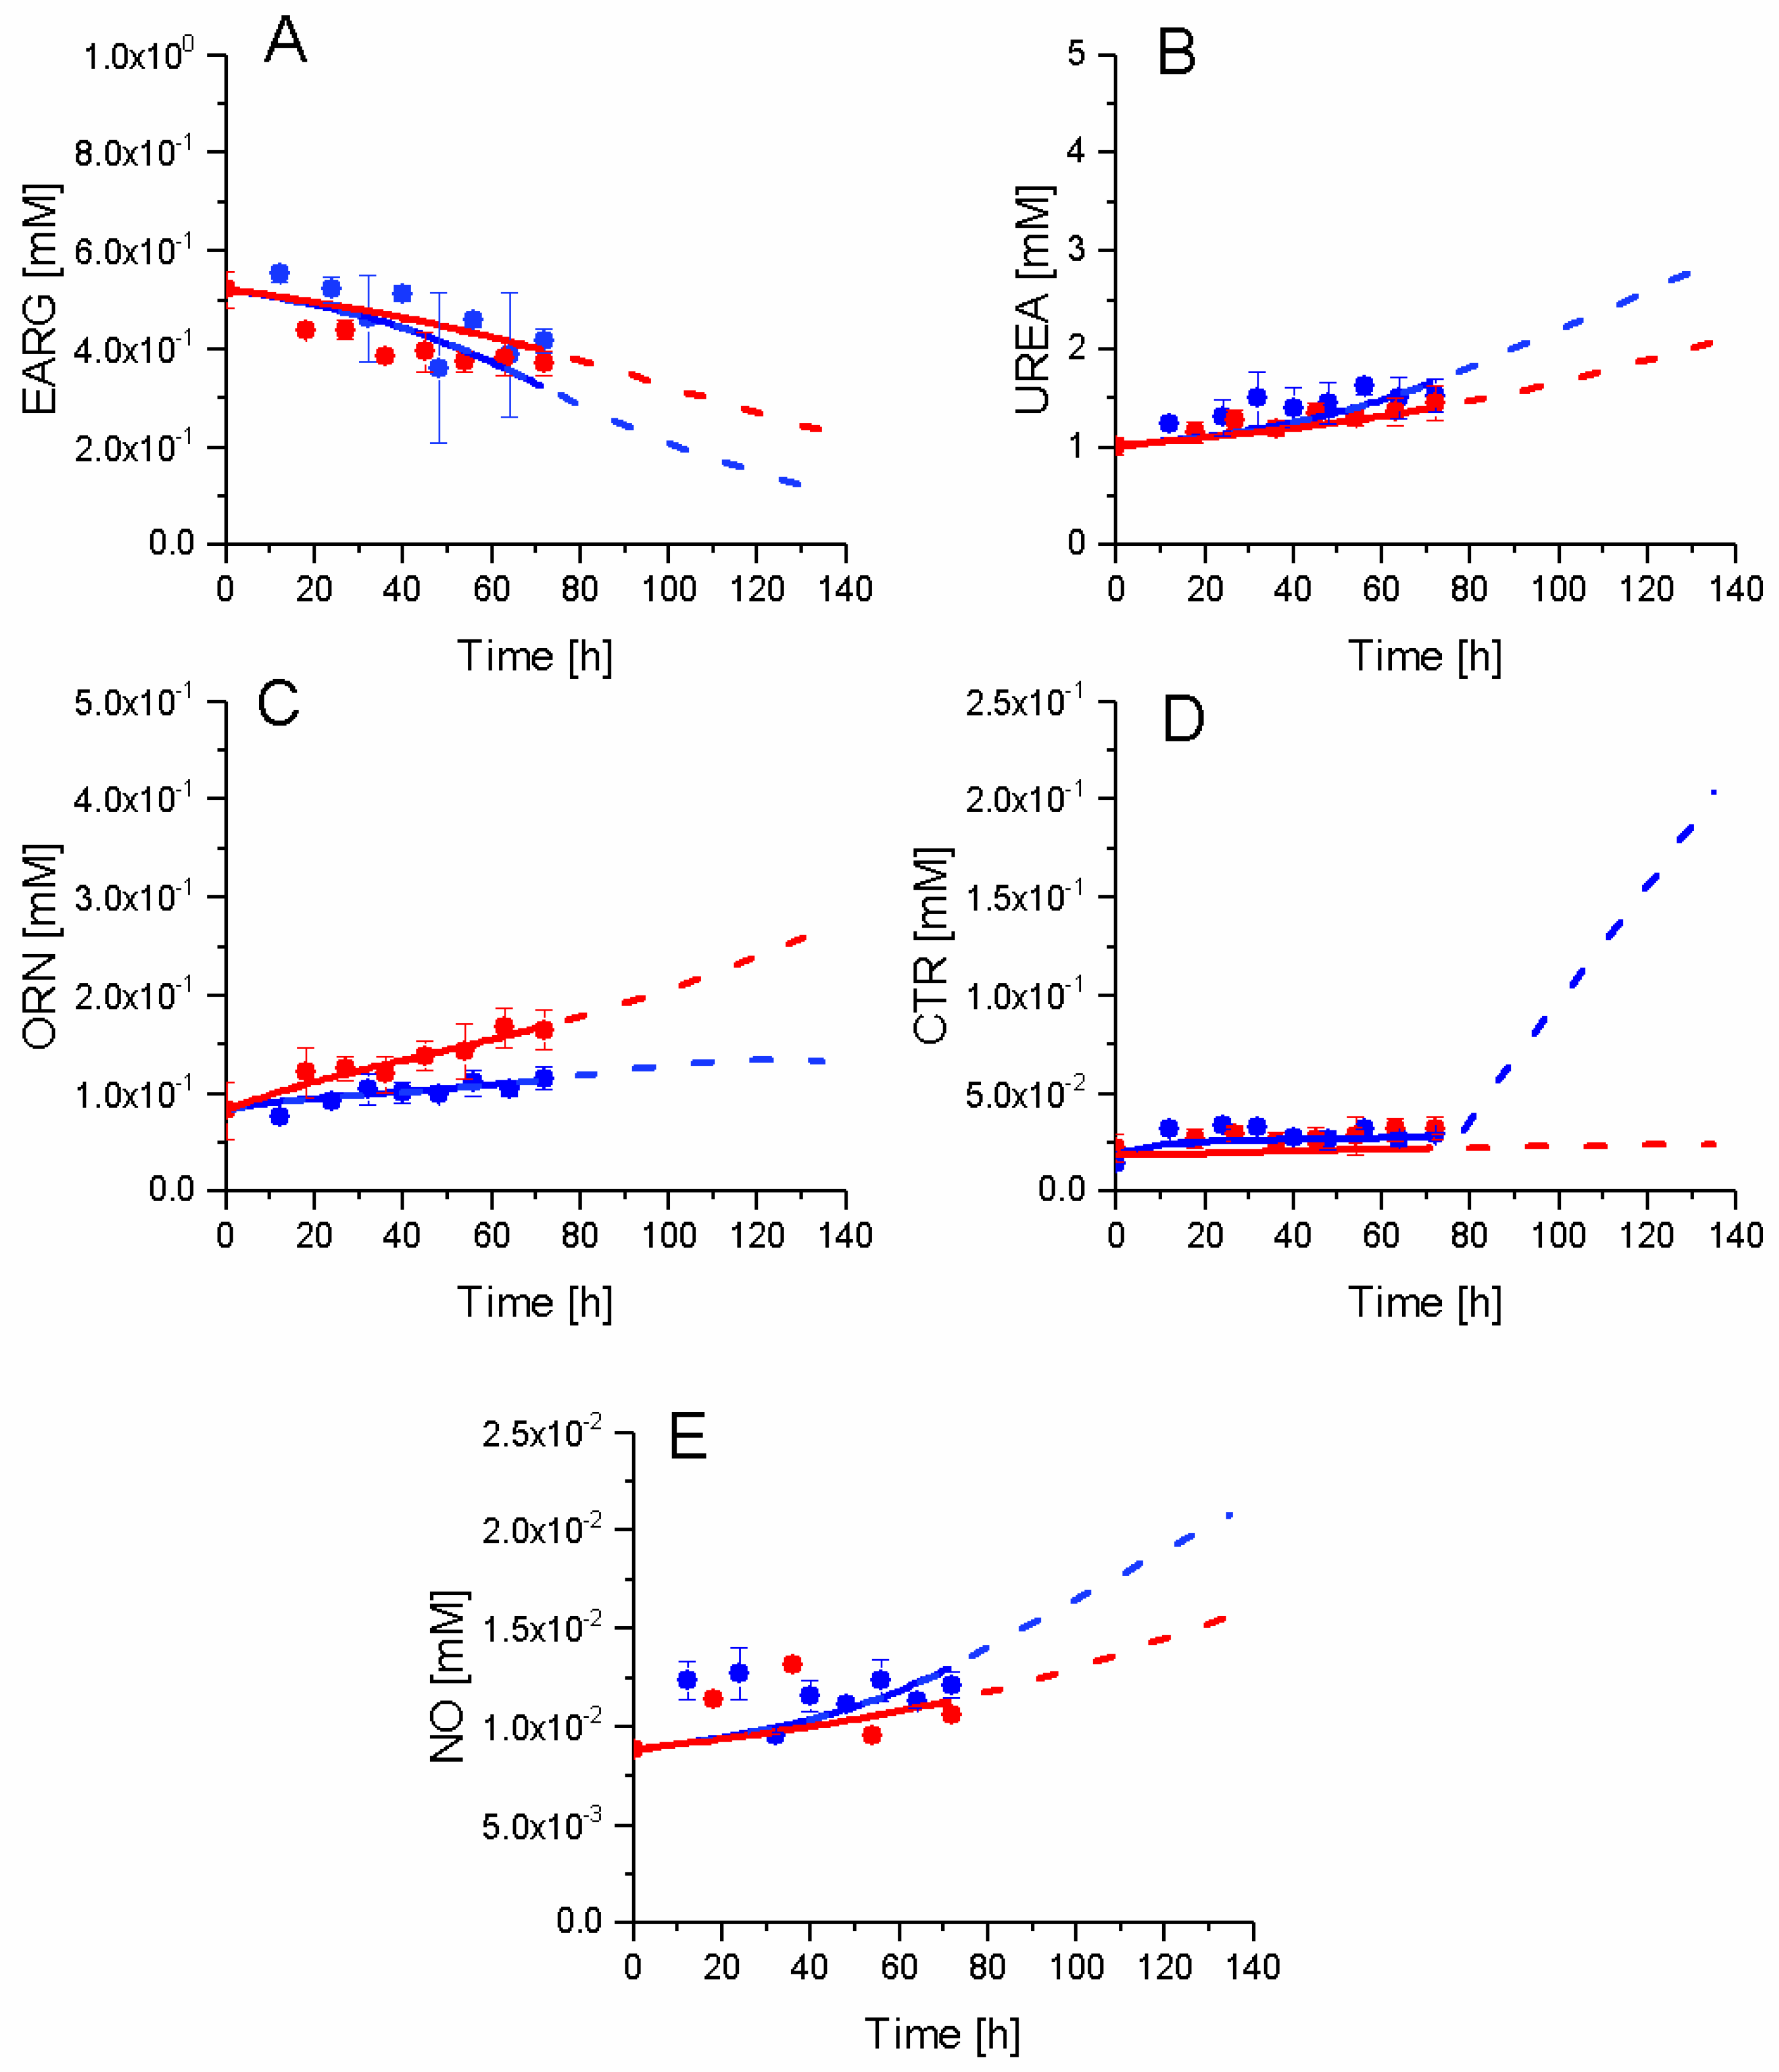
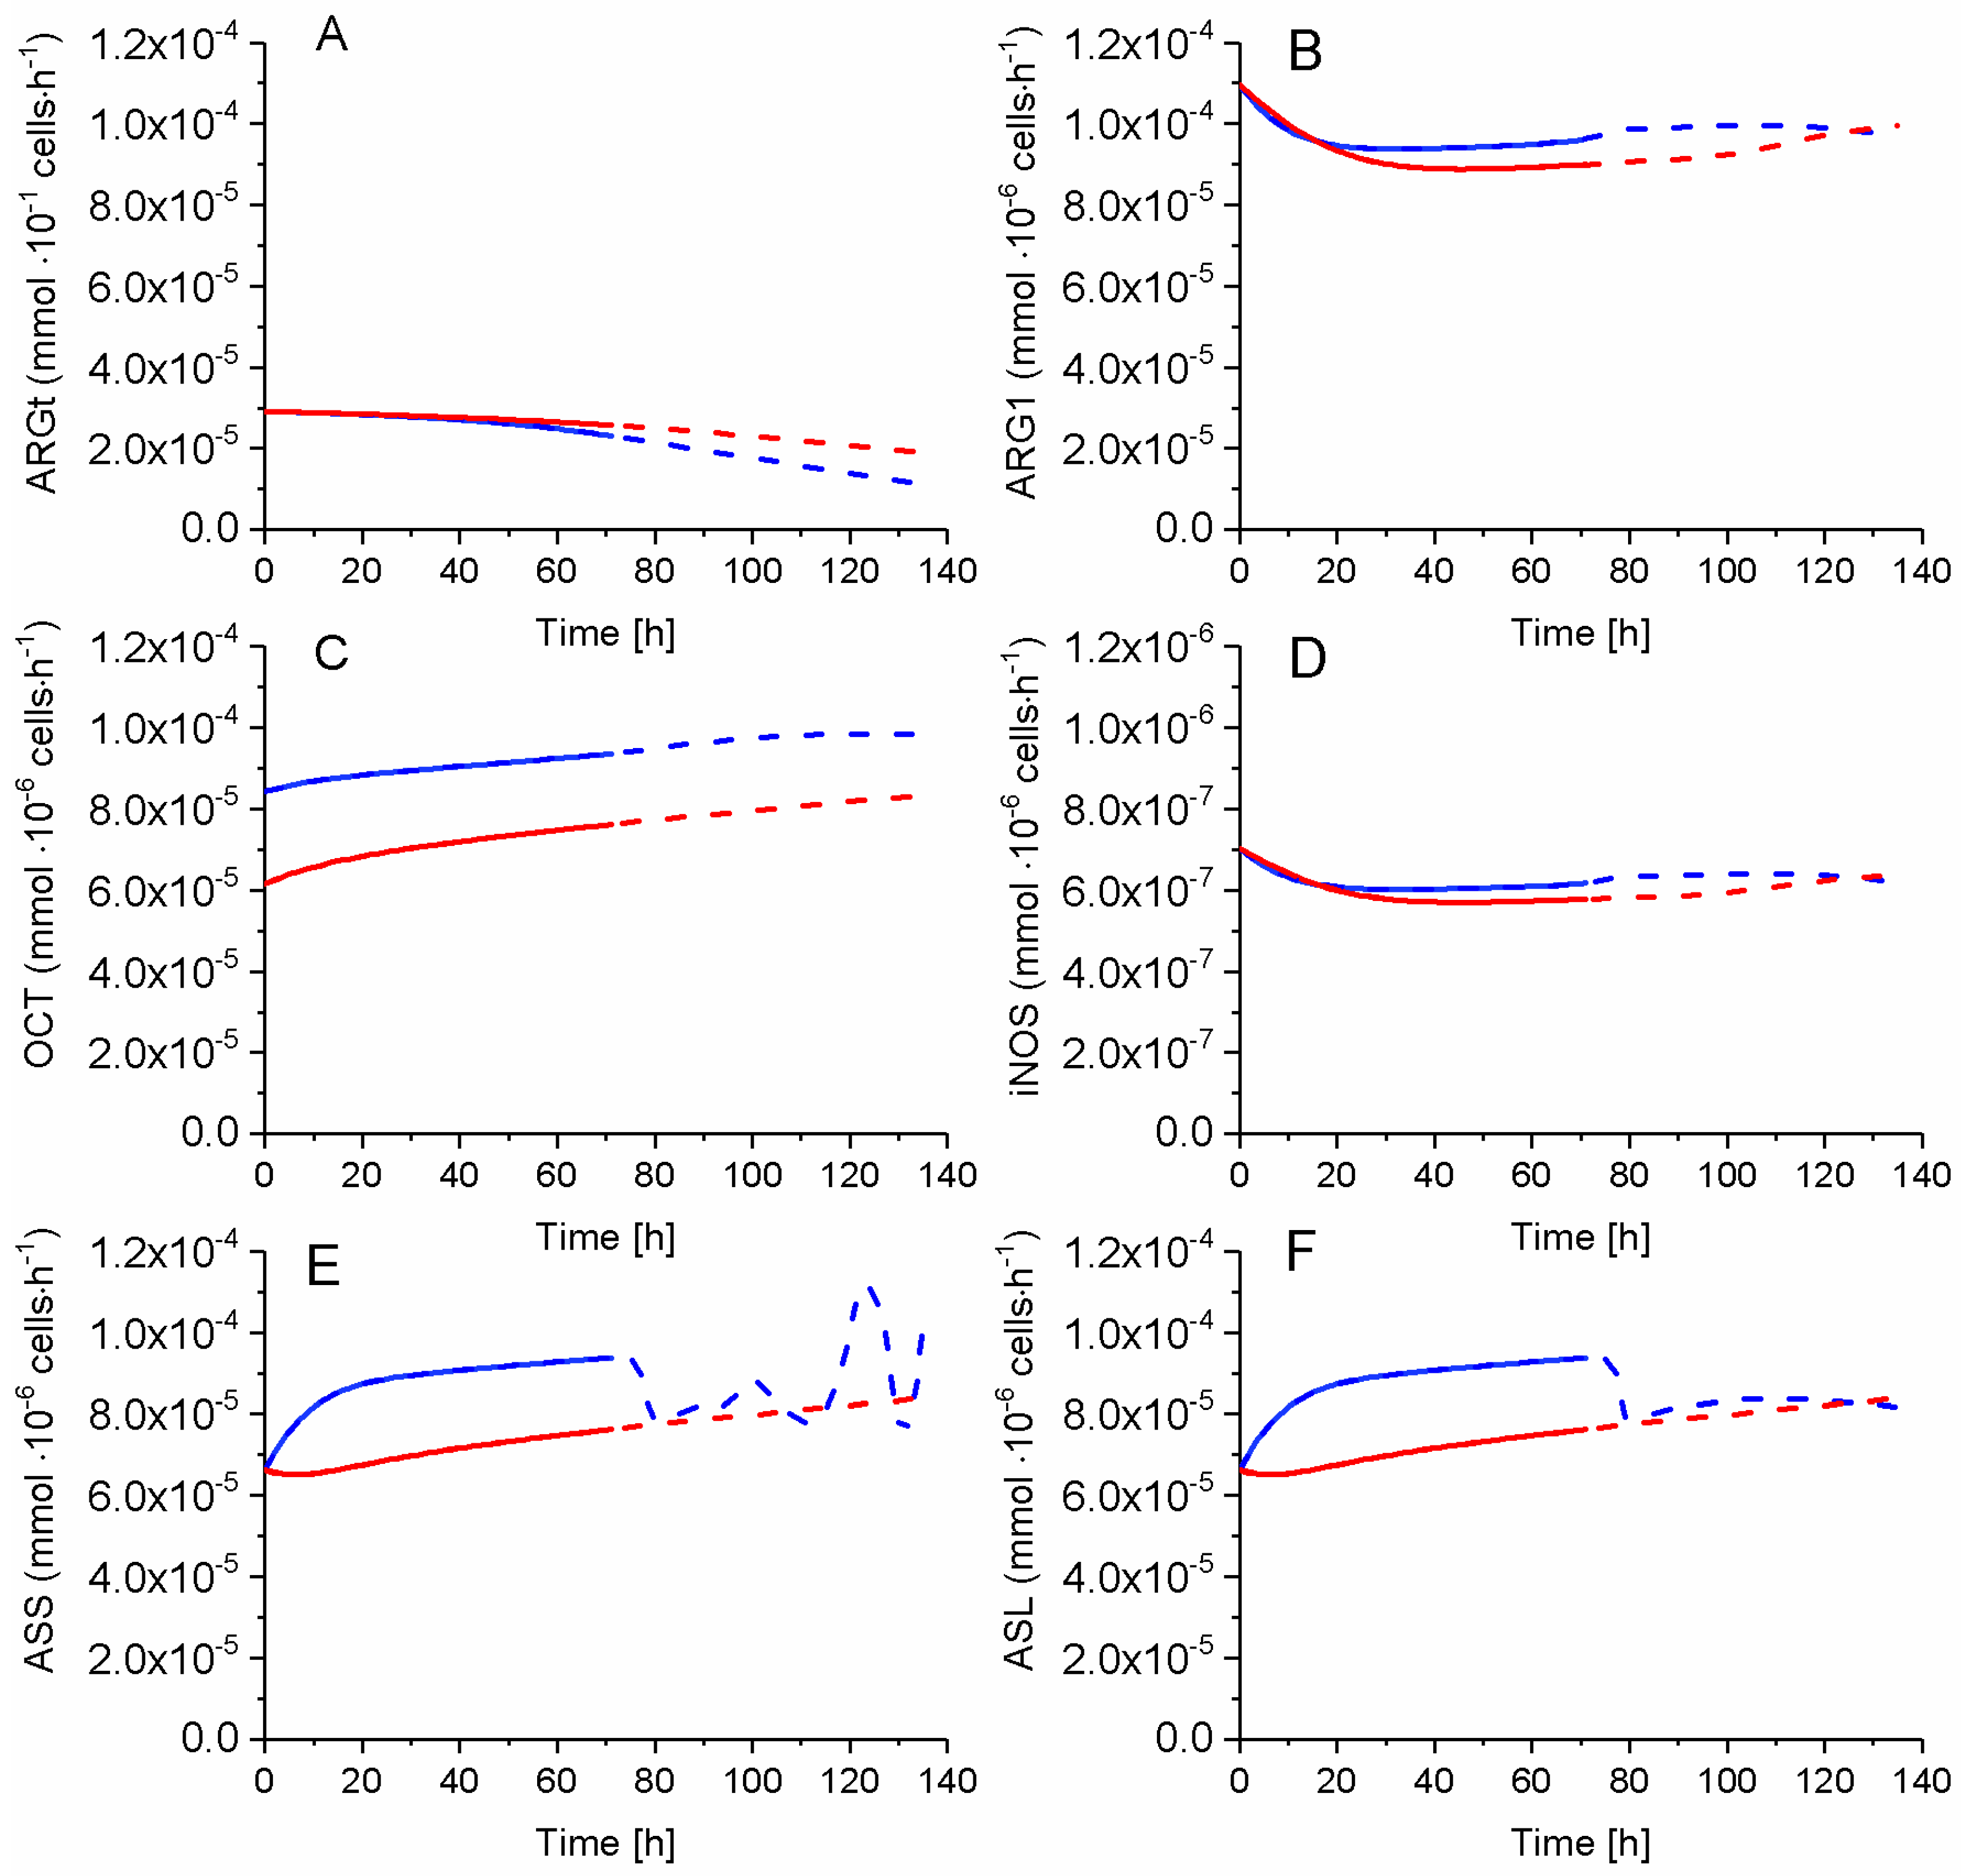
2.7. P4 Cells Show a Higher Urea Cycle Activity
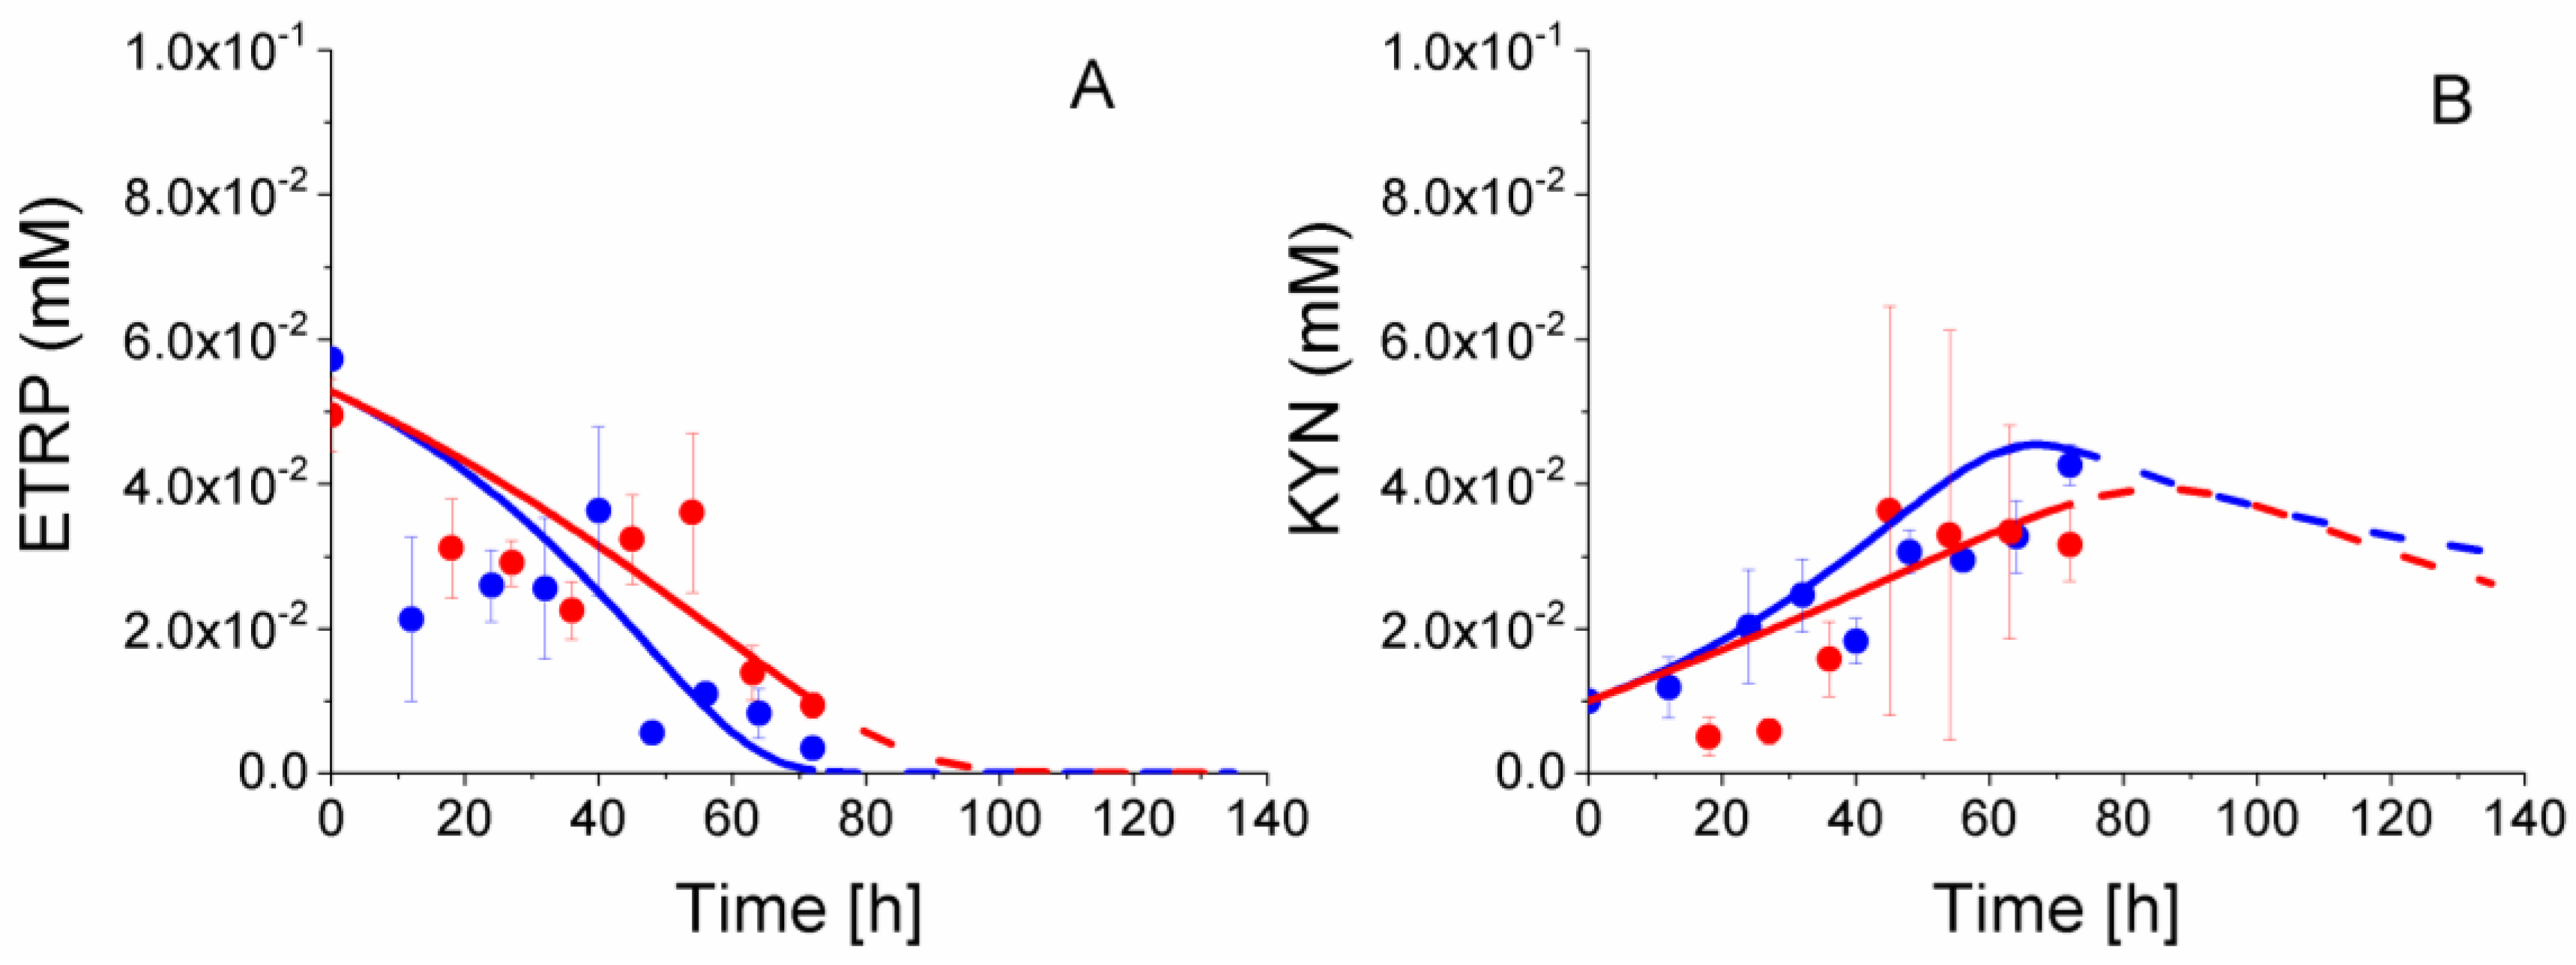
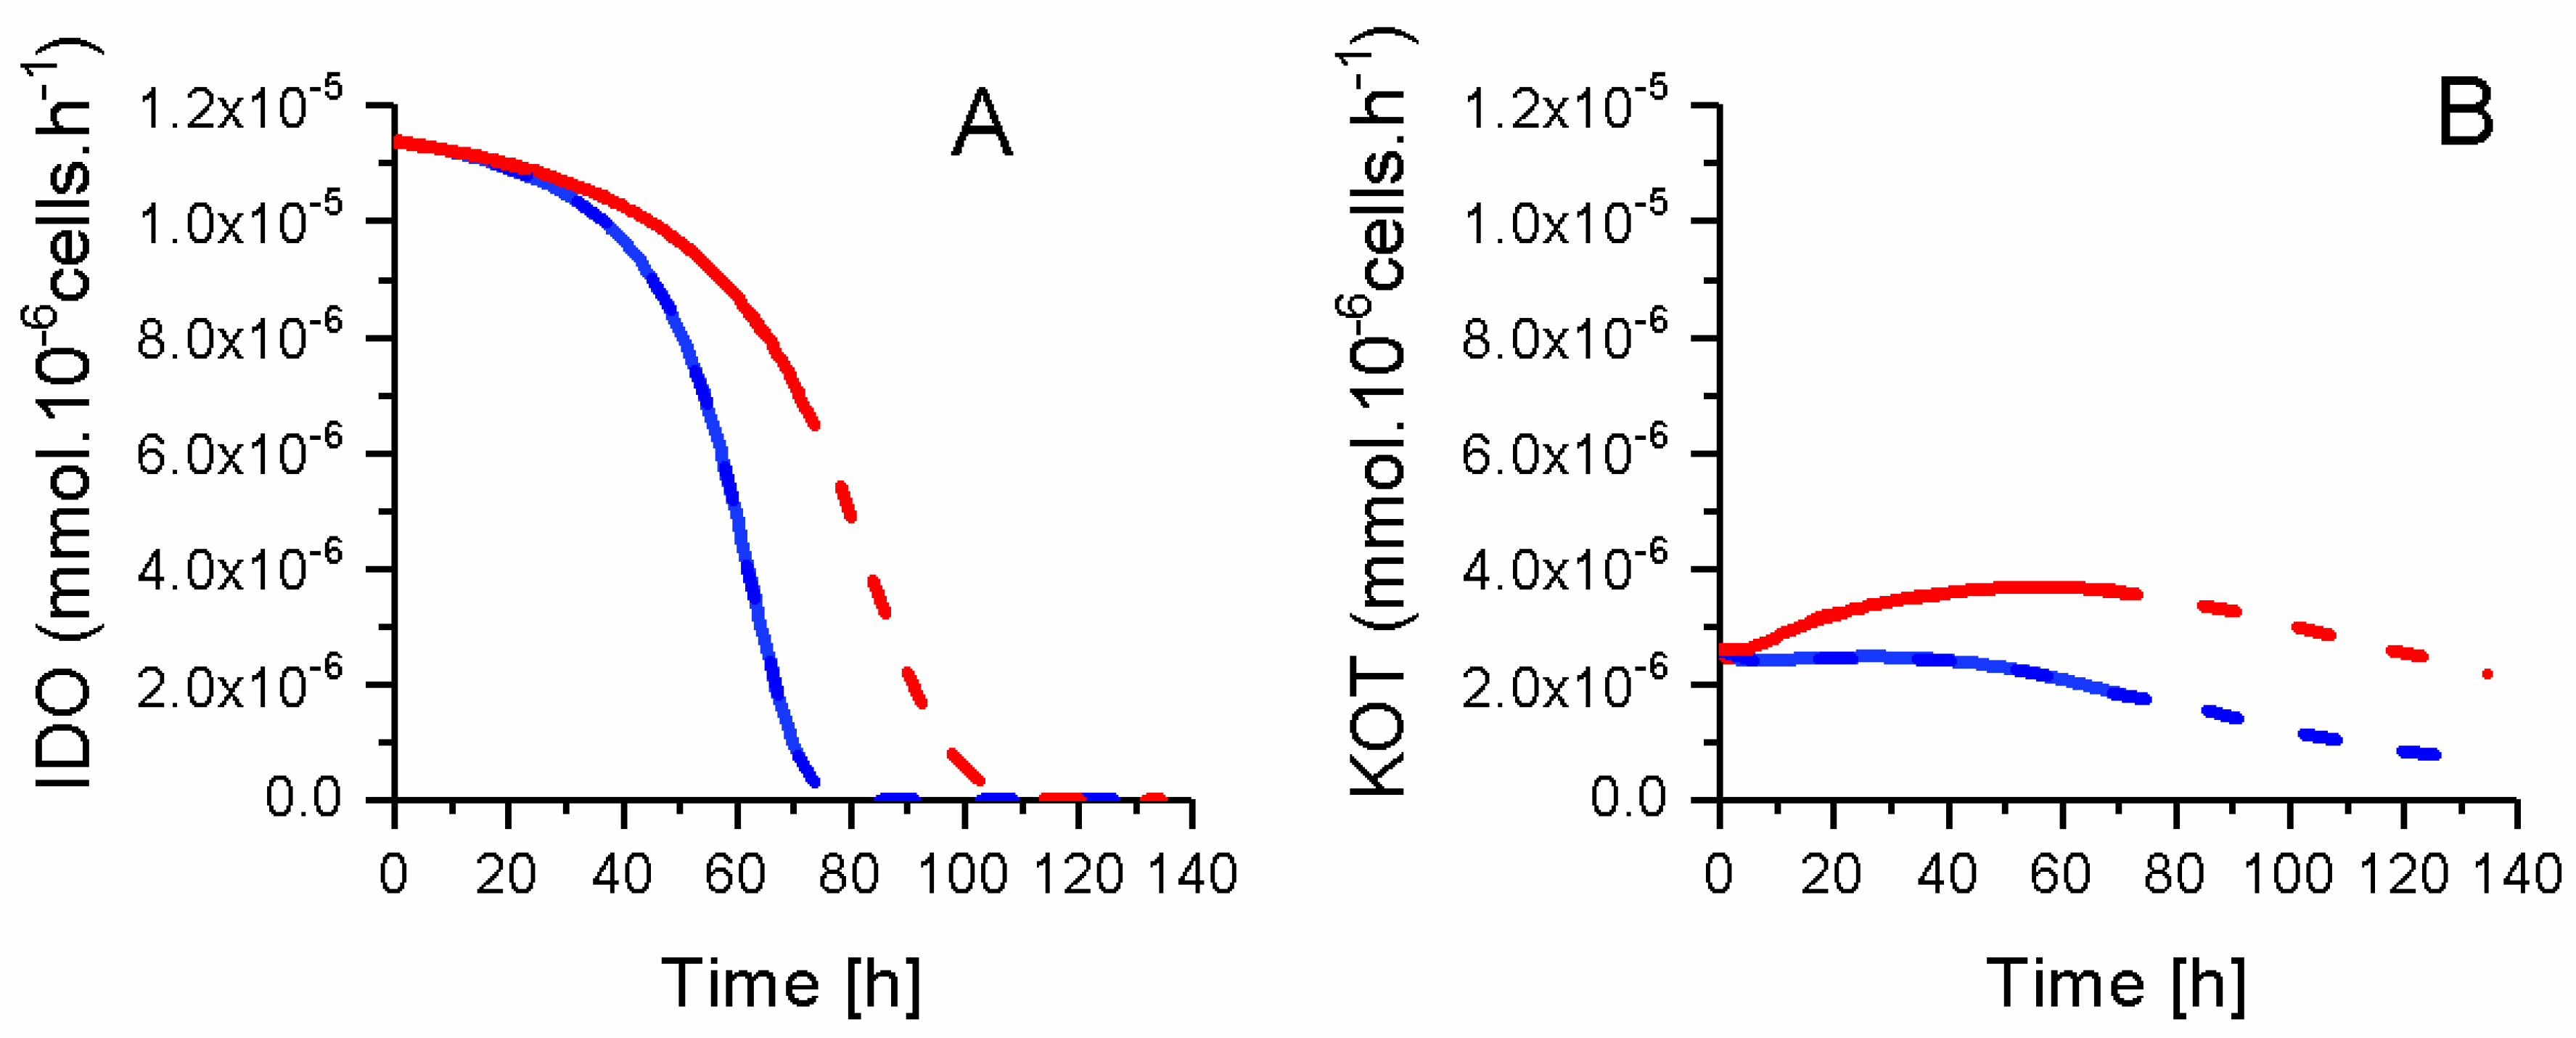
2.8. P4 Cells Consume Less Tryptophan
3. Materials and Methods
3.1. Wharton’s Jelly Mesenchymal Stem Cells Culture
3.2. Mixed Lymphocyte Reaction (Mlr) Method
3.3. Intracellular Metabolites Extraction
3.4. Nucleotide Concentration
3.5. Organic Acid Concentration
3.6. Extracellular Amino Acid Concentration
3.7. Extracellular Nitric-Oxide Analysis
3.8. Metabolic Model Structure
4. Conclusions
Supplementary Materials
Acknowledgments
Author Contributions
Conflicts of Interest
Appendix A. Kinetic Description of the Metabolic Fluxes
Appendix B. Model Structure and Parameters Value Calibration
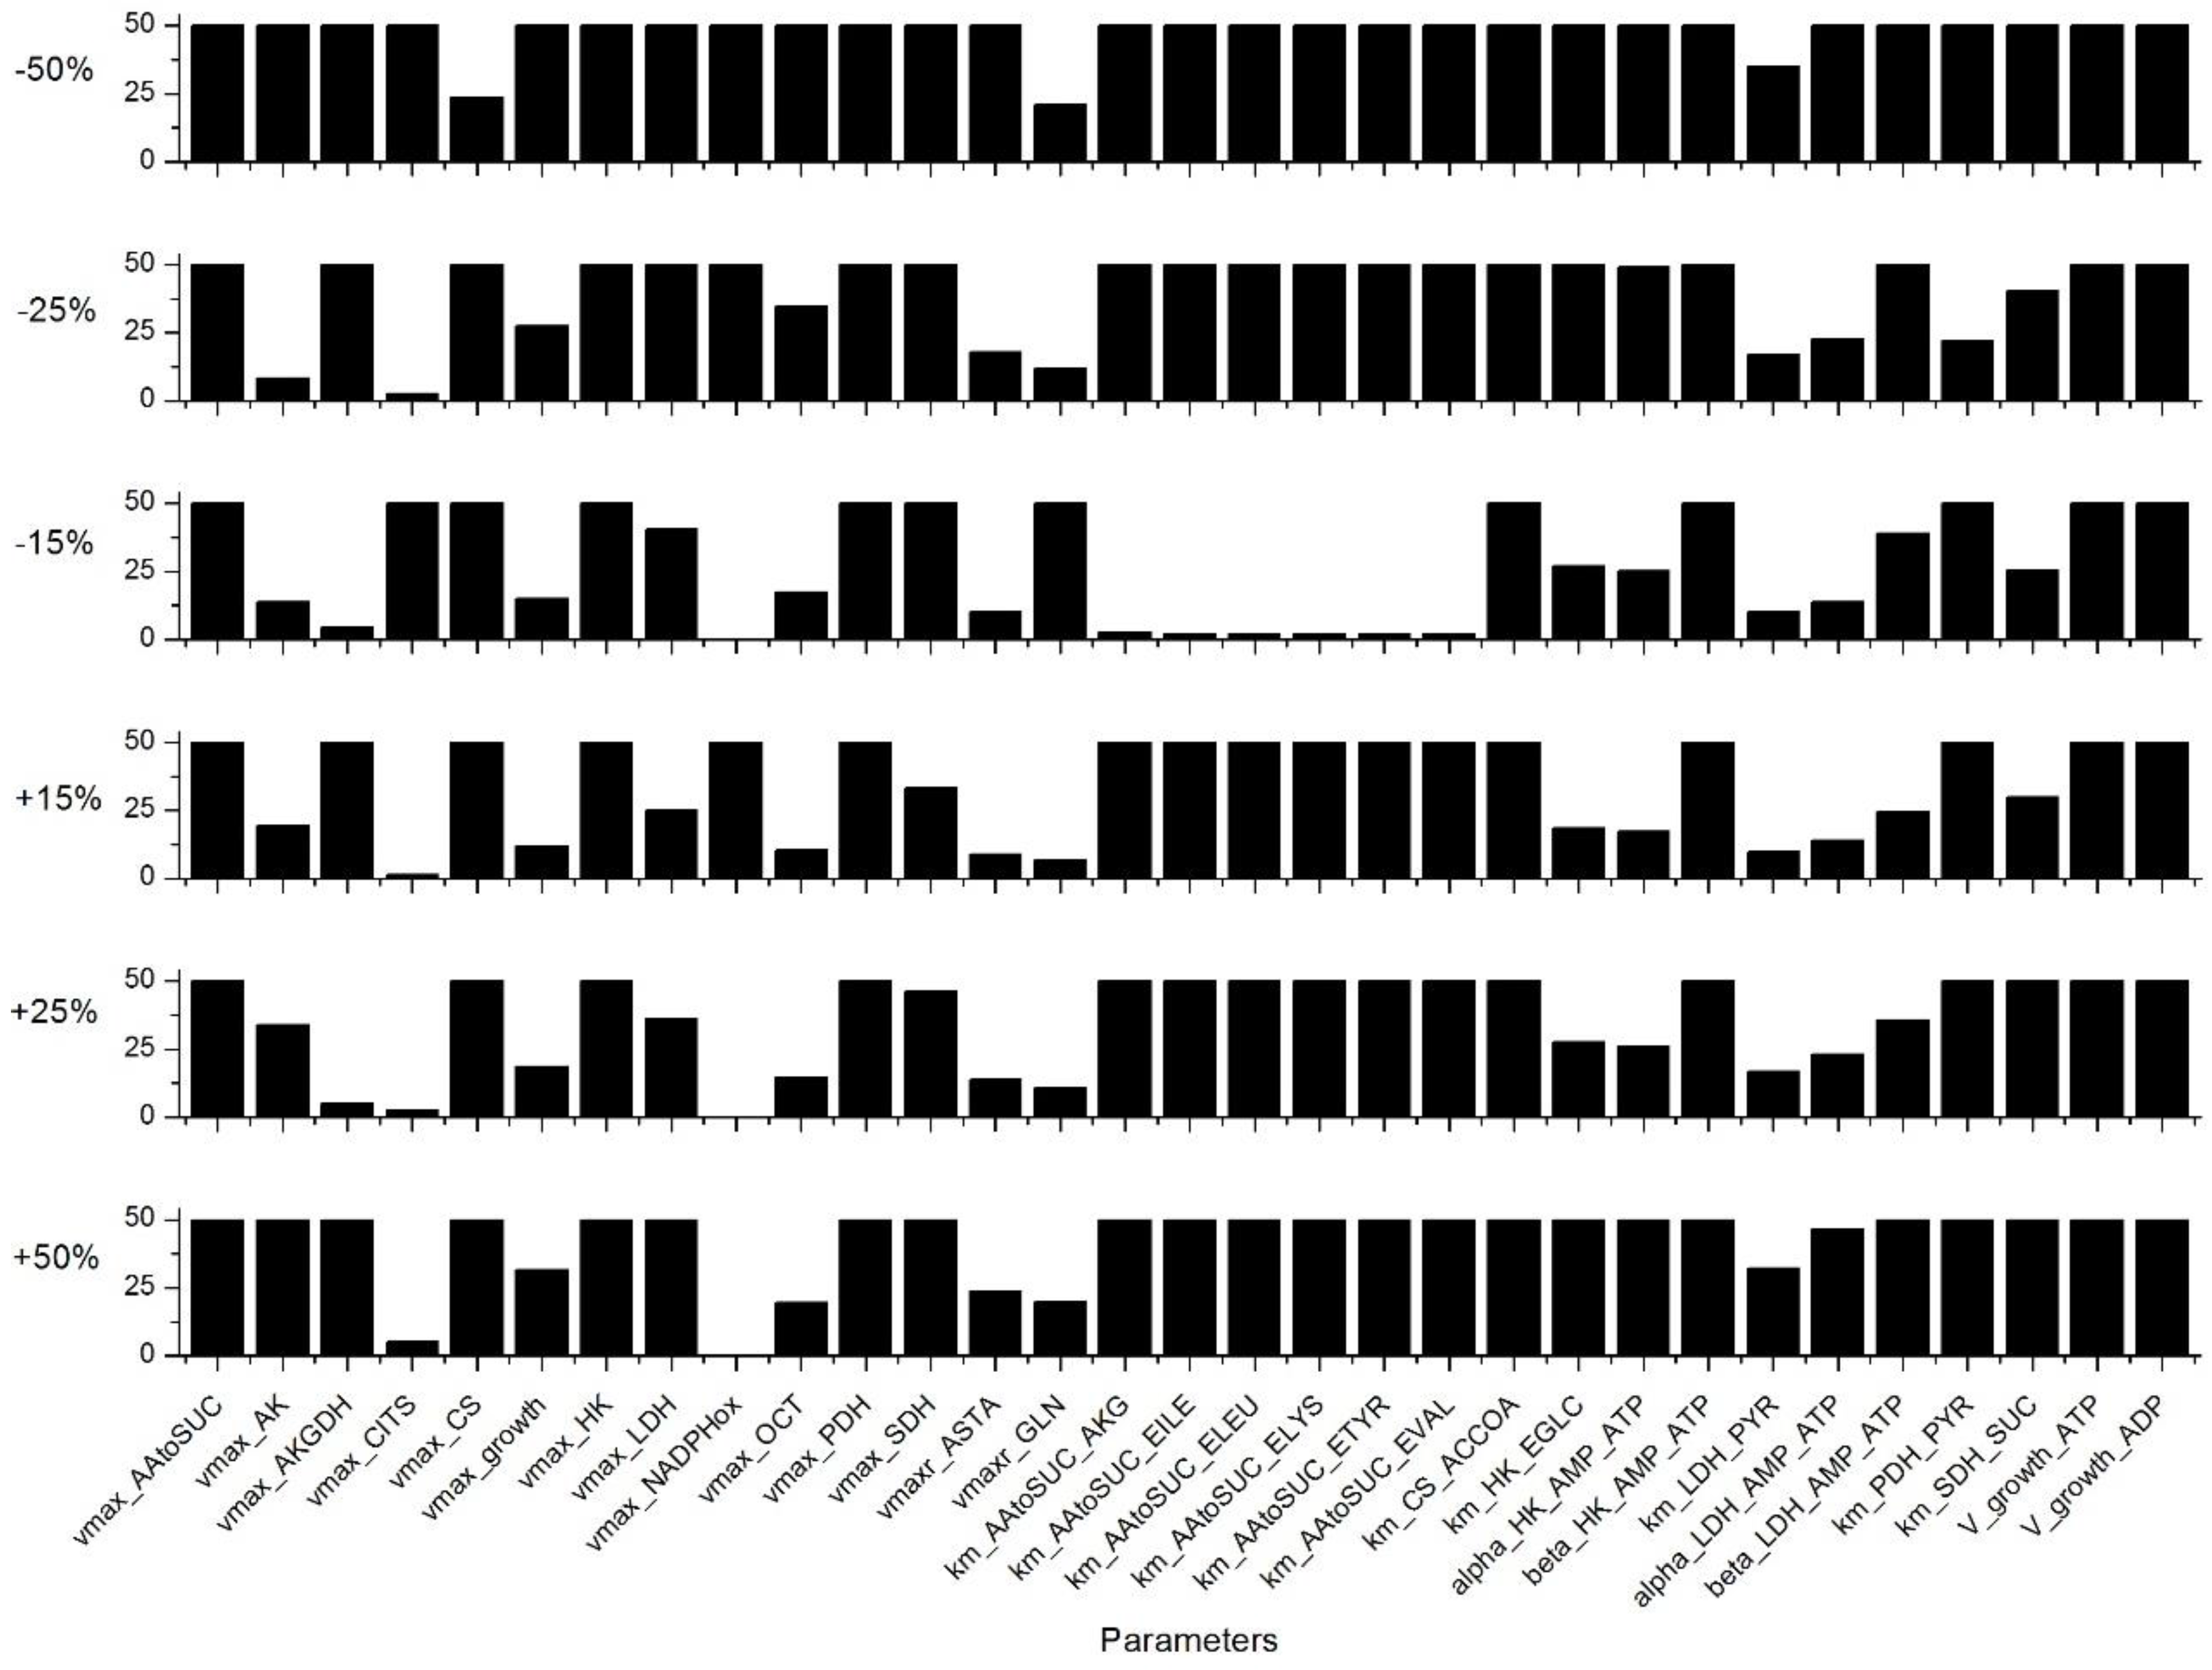
Appendix C. Sensitivity Analysis
References
- Steinman, L. Multiple sclerosis: A coordinated immunological attack against myelin in the central nervous system. Cell 1996, 85, 299–302. [Google Scholar] [CrossRef]
- Ferrara, J.L.; Levine, J.E.; Reddy, P.; Holler, E. Graft-versus-host disease. Lancet 2009, 373, 1550–1561. [Google Scholar] [CrossRef]
- Serafini, P.; Borrello, I.; Bronte, V. Myeloid Suppressor Cells in Cancer: Recruitment, Phenotype, Properties, and Mechanisms of Immune Suppression. Semin. Cancer Biol. 2006, 16, 53–65. [Google Scholar] [CrossRef] [PubMed]
- Italiani, P.; Boraschi, D. From monocytes to m1/m2 macrophages: Phenotypical vs. Functional differentiation. Front. Immunol. 2014, 5, 514. [Google Scholar] [CrossRef] [PubMed]
- Munn, D.H.; Shafizadeh, E.; Attwood, J.T.; Bondarev, I.; Pashine, A.; Mellor, A.L. Inhibition of t cell proliferation by macrophage tryptophan catabolism. J. Exp. Med. 1999, 189, 1363–1372. [Google Scholar] [CrossRef] [PubMed]
- Mellor, A.L.; Munn, D.H. Tryptophan catabolism and t-cell tolerance: Immunosuppression by starvation? Immunol. Today 1999, 20, 469–473. [Google Scholar] [CrossRef]
- Gabrilovich, D.I.; Nagaraj, S. Myeloid-derived suppressor cells as regulators of the immune system. Nat. Rev. Immunol. 2009, 9, 162–174. [Google Scholar] [CrossRef] [PubMed]
- Bronte, V.; Zanovello, P. Regulation of immune responses by l-arginine metabolism. Nat. Rev. Immunol. 2005, 5, 641–654. [Google Scholar] [CrossRef] [PubMed]
- Bogdan, C. Nitric oxide and the immune response. Nat. Immunol. 2001, 2, 907–916. [Google Scholar] [CrossRef] [PubMed]
- Le Blanc, K.; Ringden, O. Immunomodulation by mesenchymal stem cells and clinical experience. J. Int. Med. 2007, 262, 509–525. [Google Scholar] [CrossRef] [PubMed]
- Meisel, R.; Zibert, A.; Laryea, M.; Göbel, U.; Däubener, W.; Dilloo, D. Human bone marrow stromal cells inhibit allogeneic t-cell responses by indoleamine 2,3-dioxygenase–mediated tryptophan degradation. Blood 2004, 103, 4619–4621. [Google Scholar] [CrossRef] [PubMed]
- Chen, M.-Y.; Lie, P.-C.; Li, Z.-L.; Wei, X. Endothelial differentiation of wharton’s jelly–derived mesenchymal stem cells in comparison with bone marrow–derived mesenchymal stem cells. Exp. Hematol. 2009, 37, 629–640. [Google Scholar] [CrossRef] [PubMed]
- Prasanna, S.J.; Gopalakrishnan, D.; Shankar, S.R.; Vasandan, A.B. Pro-inflammatory cytokines, ifnγ and tnfα, influence immune properties of human bone marrow and wharton jelly mesenchymal stem cells differentially. PLoS ONE 2010, 5, e9016. [Google Scholar] [CrossRef] [PubMed]
- Zhou, C.; Yang, B.; Tian, Y.; Jiao, H.; Zheng, W.; Wang, J.; Guan, F. Immunomodulatory effect of human umbilical cord wharton’s jelly-derived mesenchymal stem cells on lymphocytes. Cell. Immunol. 2011, 272, 33–38. [Google Scholar] [CrossRef] [PubMed]
- Majumdar, M.K.; Keane-Moore, M.; Buyaner, D.; Hardy, W.B.; Moorman, M.A.; McIntosh, K.R.; Mosca, J.D. Characterization and functionality of cell surface molecules on human mesenchymal stem cells. J. Biomed. Sci. 2003, 10, 228–241. [Google Scholar] [CrossRef] [PubMed]
- William, T.T.; Pendleton, J.D.; Beyer, W.M.; Egalka, M.C.; Guinan, E.C. Suppression of allogeneic t-cell proliferation by human marrow stromal cells: Implications in transplantation. Transplantation 2003, 75, 389–397. [Google Scholar]
- Le Blanc, K.; Tammik, C.; Rosendahl, K.; Zetterberg, E.; Ringdén, O. Hla expression and immunologic propertiesof differentiated and undifferentiated mesenchymal stem cells. Exp. Hematol. 2003, 31, 890–896. [Google Scholar] [CrossRef]
- Wang, S.; Qu, X.; Zhao, R.C. Clinical applications of mesenchymal stem cells. J. Hematol. Oncol. 2012, 5, 19. [Google Scholar] [CrossRef] [PubMed]
- Galipeau, J. The mesenchymal stromal cells dilemma—Does a negative phase iii trial of random donor mesenchymal stromal cells in steroid-resistant graft-versus-host disease represent a death knell or a bump in the road? Cytotherapy 2013, 15, 2–8. [Google Scholar] [CrossRef] [PubMed]
- Menard, C.; Pacelli, L.; Bassi, G.; Dulong, J.; Bifari, F.; Bezier, I.; Zanoncello, J.; Ricciardi, M.; Latour, M.; Bourin, P. Clinical-grade mesenchymal stromal cells produced under various good manufacturing practice processes differ in their immunomodulatory properties: Standardization of immune quality controls. Stem Cell Dev. 2013, 22, 1789–1801. [Google Scholar] [CrossRef] [PubMed] [Green Version]
- Ho, A.; Wagner, W.; Franke, W. Heterogeneity of mesenchymal stromal cell preparations. Cytotherapy 2008, 10, 320–330. [Google Scholar] [CrossRef] [PubMed]
- Phinney, D.G.; Sensebé, L. Mesenchymal stromal cells: Misconceptions and evolving concepts. Cytotherapy 2013, 15, 140–145. [Google Scholar] [CrossRef] [PubMed]
- Weiss, M.L.; Anderson, C.; Medicetty, S.; Seshareddy, K.B.; Weiss, R.J.; VanderWerff, I.; Troyer, D.; McIntosh, K.R. Immune properties of human umbilical cord wharton’s jelly-derived cells. Stem Cells 2008, 26, 2865–2874. [Google Scholar] [CrossRef] [PubMed]
- Krampera, M.; Galipeau, J.; Shi, Y.; Tarte, K.; Sensebe, L. Immunological characterization of multipotent mesenchymal stromal cells—the international society for cellular therapy (ISCT) working proposal. Cytotherapy 2013, 15, 1054–1061. [Google Scholar] [CrossRef] [PubMed] [Green Version]
- Bara, J.J.; Richards, R.G.; Alini, M.; Stoddart, M.J. Concise review: Bone marrow-derived mesenchymal stem cells change phenotype following in vitro culture: Implications for basic research and the clinic. Stem Cells 2014, 32, 1713–1723. [Google Scholar] [CrossRef] [PubMed]
- Fiehn, O. Metabolomics–the link between genotypes and phenotypes. Plant Mol. Biol. 2002, 48, 155–171. [Google Scholar] [CrossRef] [PubMed]
- Hammami, I.; Chen, J.; Bronte, V.; DeCrescenzo, G.; Jolicoeur, M. l-glutamine is a key parameter in the immunosuppression phenomenon. Biochem. Biophys. Res. Commun. 2012, 425, 724–729. [Google Scholar] [CrossRef] [PubMed]
- Ghorbaniaghdam, A.; Henry, O.; Jolicoeur, M. A kinetic-metabolic model based on cell energetic state: Study of cho cell behavior under na-butyrate stimulation. Bioproces. Biosyst. Eng. 2013, 36, 469–487. [Google Scholar] [CrossRef] [PubMed]
- Fouladiha, H.; Marashi, S.A.; Shokrgozar, M.A.; Farokhi, M.; Atashi, A. Applications of a metabolic network model of mesenchymal stem cells for controlling cell proliferation and differentiation. Cytotechnology 2018, 70, 331–338. [Google Scholar] [CrossRef] [PubMed]
- Ghorbaniaghdam, A.; Chen, J.; Henry, O.; Jolicoeur, M. Analyzing clonal variation of monoclonal antibody-producing cho cell lines using an in silico metabolomic platform. PLoS ONE 2014, 9, e090832. [Google Scholar] [CrossRef] [PubMed]
- Robitaille, J.; Chen, J.K.; Jolicoeur, M. A single dynamic metabolic model can describe mab producing cho cell batch and fed-batch cultures on different culture media. PLoS ONE 2015, 10, e136815. [Google Scholar] [CrossRef] [PubMed]
- Nolan, R.P.; Lee, K. Dynamic model of cho cell metabolism. Metab. Eng. 2011, 13, 108–124. [Google Scholar] [CrossRef] [PubMed]
- Kang, T.J.; Yeom, J.-E.; Lee, H.J.; Rho, S.H.; Han, H.; Chae, G.-T. Growth kinetics of human mesenchymal stem cells from bone marrow and umbilical cord blood. Acta Haematol. 2004, 112, 230–233. [Google Scholar] [CrossRef] [PubMed]
- Moya, A.; Paquet, J.; Deschepper, M.; Larochette, N.; Oudina, K.; Denoeud, C.; Bensidhoum, M.; Logeart-Avramoglou, D.; Petite, H. Human mesenchymal stem cell failure to adapt to glucose shortage and rapidly use intracellular energy reserves through glycolysis explains poor cell survival after implantation. Stem Cells 2017, 36, 363–376. [Google Scholar] [CrossRef] [PubMed]
- Liu, Y.; Munoz, N.; Bunnell, B.A.; Logan, T.M.; Ma, T. Density-dependent metabolic heterogeneity in human mesenchymal stem cells. Stem Cells 2015, 33, 3368–3381. [Google Scholar] [CrossRef] [PubMed]
- Sheikholeslami, Z.; Jolicoeur, M.; Henry, O. Probing the metabolism of an inducible mammalian expression system using extracellular isotopomer analysis. J. Biotechnol 2013, 164, 469–478. [Google Scholar] [CrossRef] [PubMed]
- Ahn, W.S.; Antoniewicz, M.R. Metabolic flux analysis of cho cells at growth and non-growth phases using isotopic tracers and mass spectrometry. Metab. Eng. 2011, 13, 598–609. [Google Scholar] [CrossRef] [PubMed]
- Templeton, N.; Dean, J.; Reddy, P.; Young, J.D. Peak antibody production is associated with increased oxidative metabolism in an industrially relevant fed-batch cho cell culture. Biotechnol. Bioeng. 2013, 110, 7. [Google Scholar] [CrossRef] [PubMed]
- Hammami, I.; Chen, J.; Murschel, F.; Bronte, V.; De Crescenzo, G.; Jolicoeur, M. Immunosuppressive activity enhances central carbon metabolism and bioenergetics in myeloid-derived suppressor cells in vitro models. BMC Cell Biol. 2012, 13, 1. [Google Scholar] [CrossRef] [PubMed]
- Estrada, J.; Albo, C.; Benguria, A.; Dopazo, A.; Lopez-Romero, P.; Carrera-Quintanar, L.; Roche, E.; Clemente, E.; Enriquez, J.; Bernad, A. Culture of human mesenchymal stem cells at low oxygen tension improves growth and genetic stability by activating glycolysis. Cell Death Differ. 2012, 19, 743. [Google Scholar] [CrossRef] [PubMed]
- Kondoh, H.; Lleonart, M.E.; Nakashima, Y.; Yokode, M.; Tanaka, M.; Bernard, D.; Gil, J.; Beach, D. A high glycolytic flux supports the proliferative potential of murine embryonic stem cells. Antioxid. Redox Signal. 2007, 9, 293–299. [Google Scholar] [CrossRef] [PubMed]
- Hardie, D.G.; Hawley, S.A. Amp-activated protein kinase: The energy charge hypothesis revisited. Bioessays 2001, 23, 1112–1119. [Google Scholar] [CrossRef] [PubMed]
- Hardie, D.G.; Carling, D. The amp-activated protein kinase. FEBS J. 1997, 246, 259–273. [Google Scholar]
- Hardie, D.G.; Hawley, S.A.; Scott, J.W. Amp-activated protein kinase–development of the energy sensor concept. J. Physiol. 2006, 574, 7–15. [Google Scholar] [CrossRef] [PubMed]
- Rodriguez, P.C.; Quiceno, D.G.; Ochoa, A.C. L-arginine availability regulates t-lymphocyte cell-cycle progression. Blood 2007, 109, 1568–1573. [Google Scholar] [CrossRef] [PubMed]
- Sato, K.; Ozaki, K.; Oh, I.; Meguro, A.; Hatanaka, K.; Nagai, T.; Muroi, K.; Ozawa, K. Nitric oxide plays a critical role in suppression of t-cell proliferation by mesenchymal stem cells. Blood 2007, 109, 228–234. [Google Scholar] [CrossRef] [PubMed]
- Fallarino, F.; Grohmann, U.; Vacca, C.; Orabona, C.; Spreca, A.; Fioretti, M.C.; Puccetti, P. T cell apoptosis by kynurenines. In Developments in Tryptophan and Serotonin Metabolism; Springer: Boston, MA, USA, 2003; pp. 183–190. [Google Scholar]
- Kimball, E.; Rabinowitz, J.D. Identifying decomposition products in extracts of cellular metabolites. Anal. Biochem. 2006, 358, 273–280. [Google Scholar] [CrossRef] [PubMed]
- Preinerstorfer, B.; Schiesel, S.; Lämmerhofer, M.; Lindner, W. Metabolic profiling of intracellular metabolites in fermentation broths from β-lactam antibiotics production by liquid chromatography–tandem mass spectrometry methods. J. Chromatogr. A 2010, 1217, 312–328. [Google Scholar] [CrossRef] [PubMed]
- Dell’mour, M.; Jaitz, L.; Oburger, E.; Puschenreiter, M.; Koellensperger, G.; Hann, S. Hydrophilic interaction lc combined with electrospray ms for highly sensitive analysis of underivatized amino acids in rhizosphere research. J. Sep. Sci. 2010, 33, 911–922. [Google Scholar] [CrossRef] [PubMed]
- Morris, S.M., Jr. Regulation of enzymes of the urea cycle and arginine metabolism. Annu. Rev. Nutr. 2002, 22, 87–105. [Google Scholar] [CrossRef] [PubMed]
- Sheikh, K.; Förster, J.; Nielsen, L.K. Modeling hybridoma cell metabolism using a generic genome-scale metabolic model of mus musculus. Biotechnol. Progress 2005, 21, 112–121. [Google Scholar] [CrossRef] [PubMed]
- Crabtree, B.; Newsholme, E.A. A quantitative approach to metabolic control. Curr. Top Cell Regul. 1985, 25, 21–76. [Google Scholar] [PubMed]
- Crabtree, B.; Newsholme, E.A. A method for testing the stability of a steady-state system during the calculation of a response to large changes in regulator concentrations. FEBS Lett. 1991, 280, 329–331. [Google Scholar] [CrossRef]
- Dash, R.K.; Li, Y.; Kim, J.; Saidel, G.M.; Cabrera, M.E. Modeling cellular metabolism and energetics in skeletal muscle: Large-scale parameter estimation and sensitivity analysis. IEEE Trans. Biomed. Eng. 2008, 55, 1298–1318. [Google Scholar] [CrossRef] [PubMed]
- Cloutier, M.; Perrier, M.; Jolicoeur, M. Dynamic flux cartography of hairy roots primary metabolism. Phytochemistry 2007, 68, 2393–2404. [Google Scholar] [CrossRef] [PubMed]
- Hundal, H.; Rennie, M.; Watt, P. Characteristics of acidic, basic and neutral amino acid transport in the perfused rat hindlimb. J. Physiol. 1989, 408, 93–114. [Google Scholar] [CrossRef] [PubMed]
- Rizzi, M.; Baltes, M.; Theobald, U.; Reuss, M. In vivo analysis of metabolic dynamics in saccharomyces cerevisiae: Ii. Mathematical model. Biotechnol. Bioeng. 1997, 55, 592–608. [Google Scholar] [CrossRef]


 Lactate production,
  TCA feeding,
  pentose phosphate pathways (PPP) feeding.
Lactate production, TCA feeding, pentose phosphate pathways (PPP) feeding.
pentose phosphate pathways (PPP) feeding.
Lactate production, TCA feeding, pentose phosphate pathways (PPP) feeding.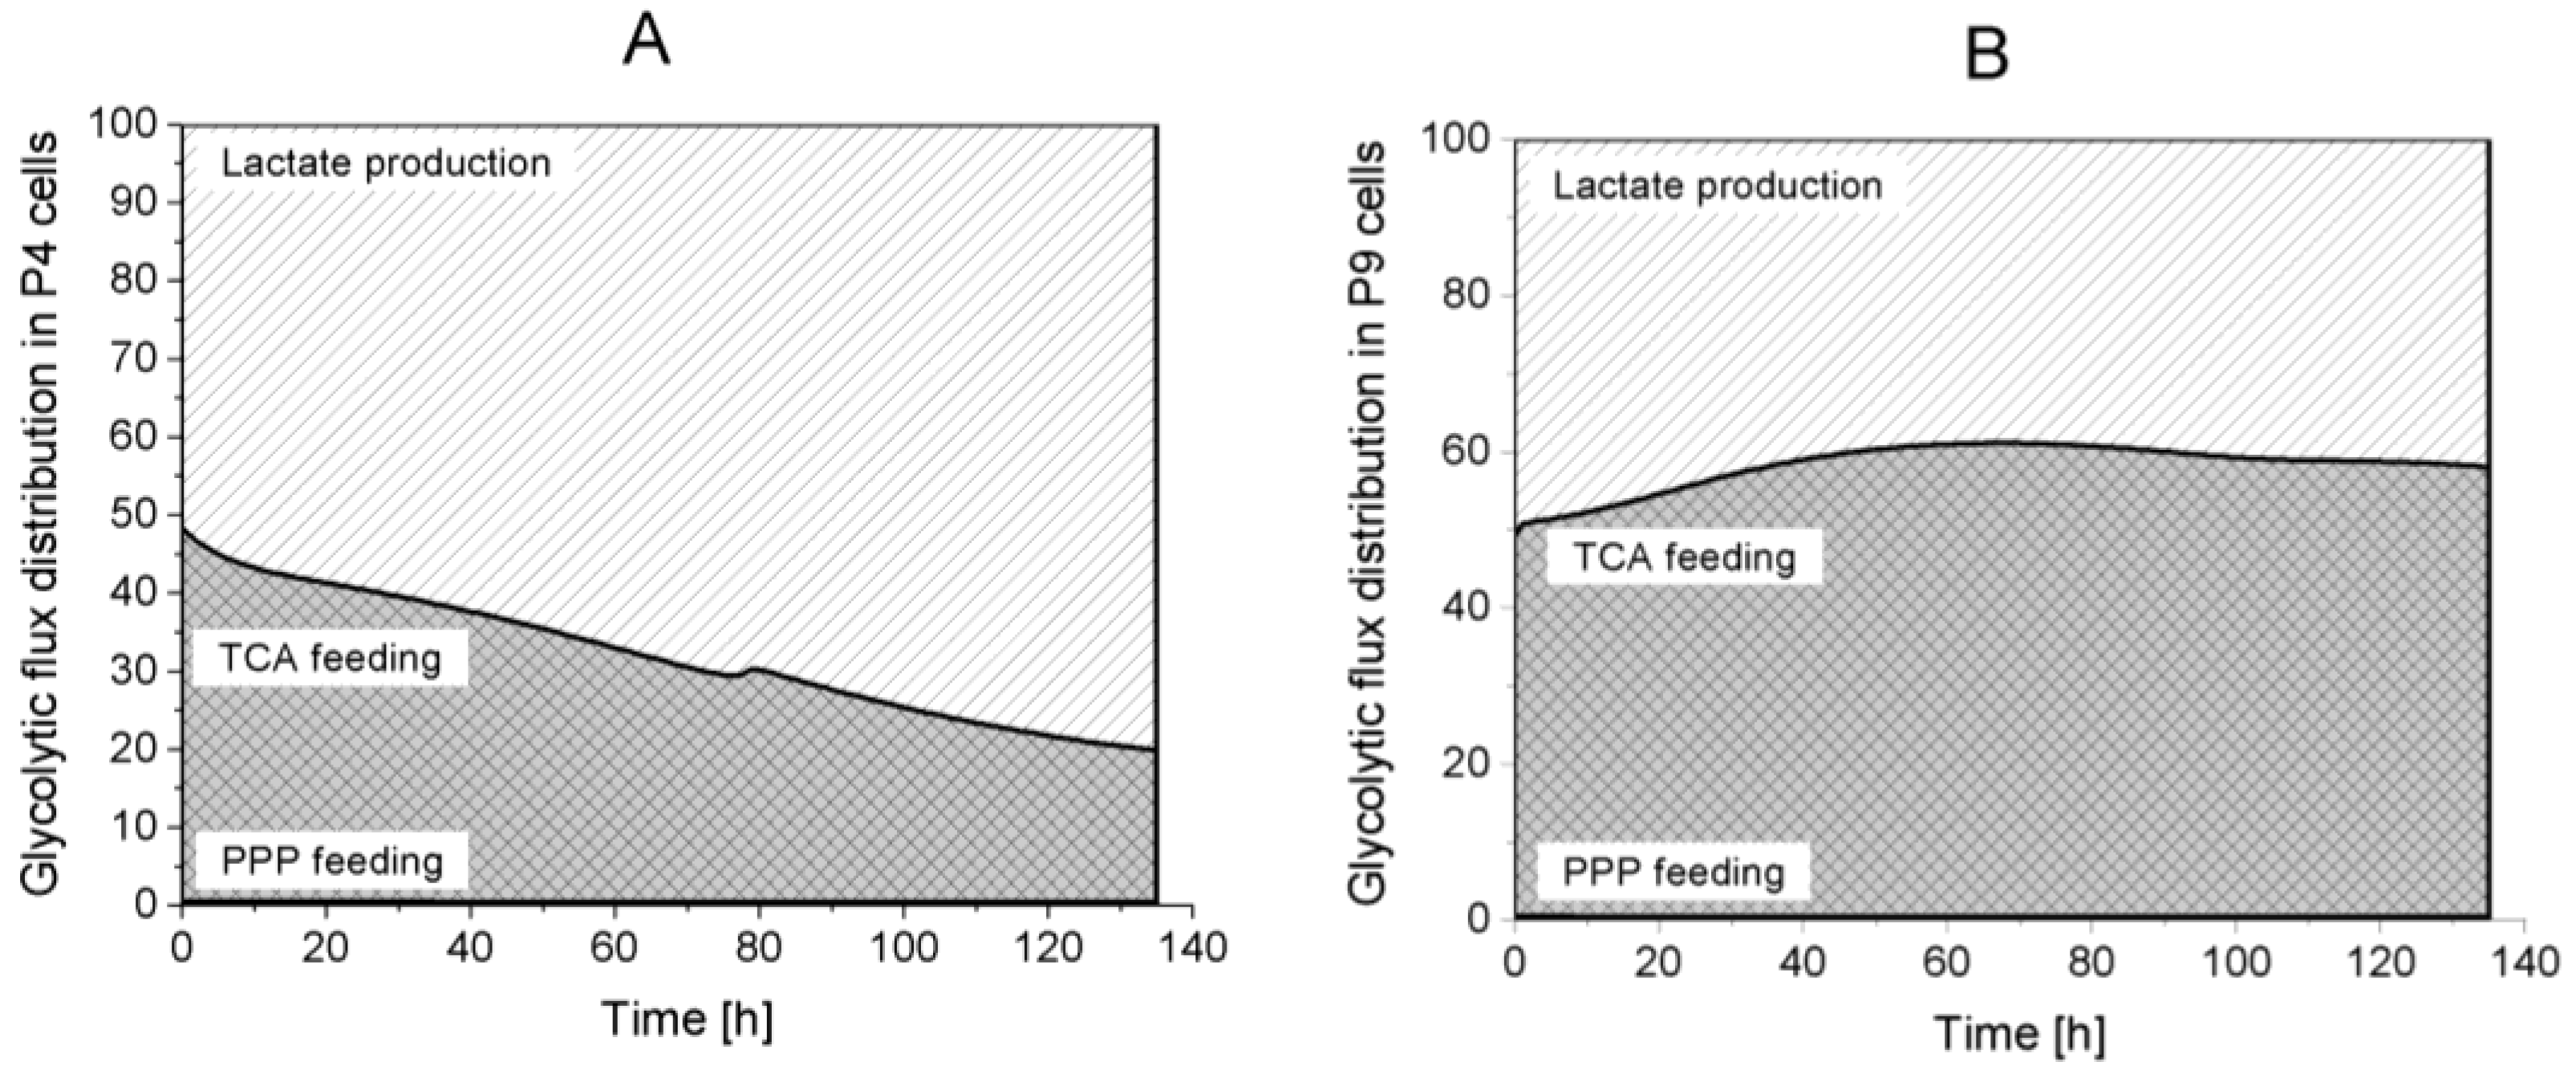

 Returned to Glycolysis,
  Feeding cell synthesis,
  Feeding nucleotides synthesis.
Returned to Glycolysis, Feeding cell synthesis, Feeding nucleotides synthesis.
Feeding nucleotides synthesis.
Returned to Glycolysis, Feeding cell synthesis, Feeding nucleotides synthesis.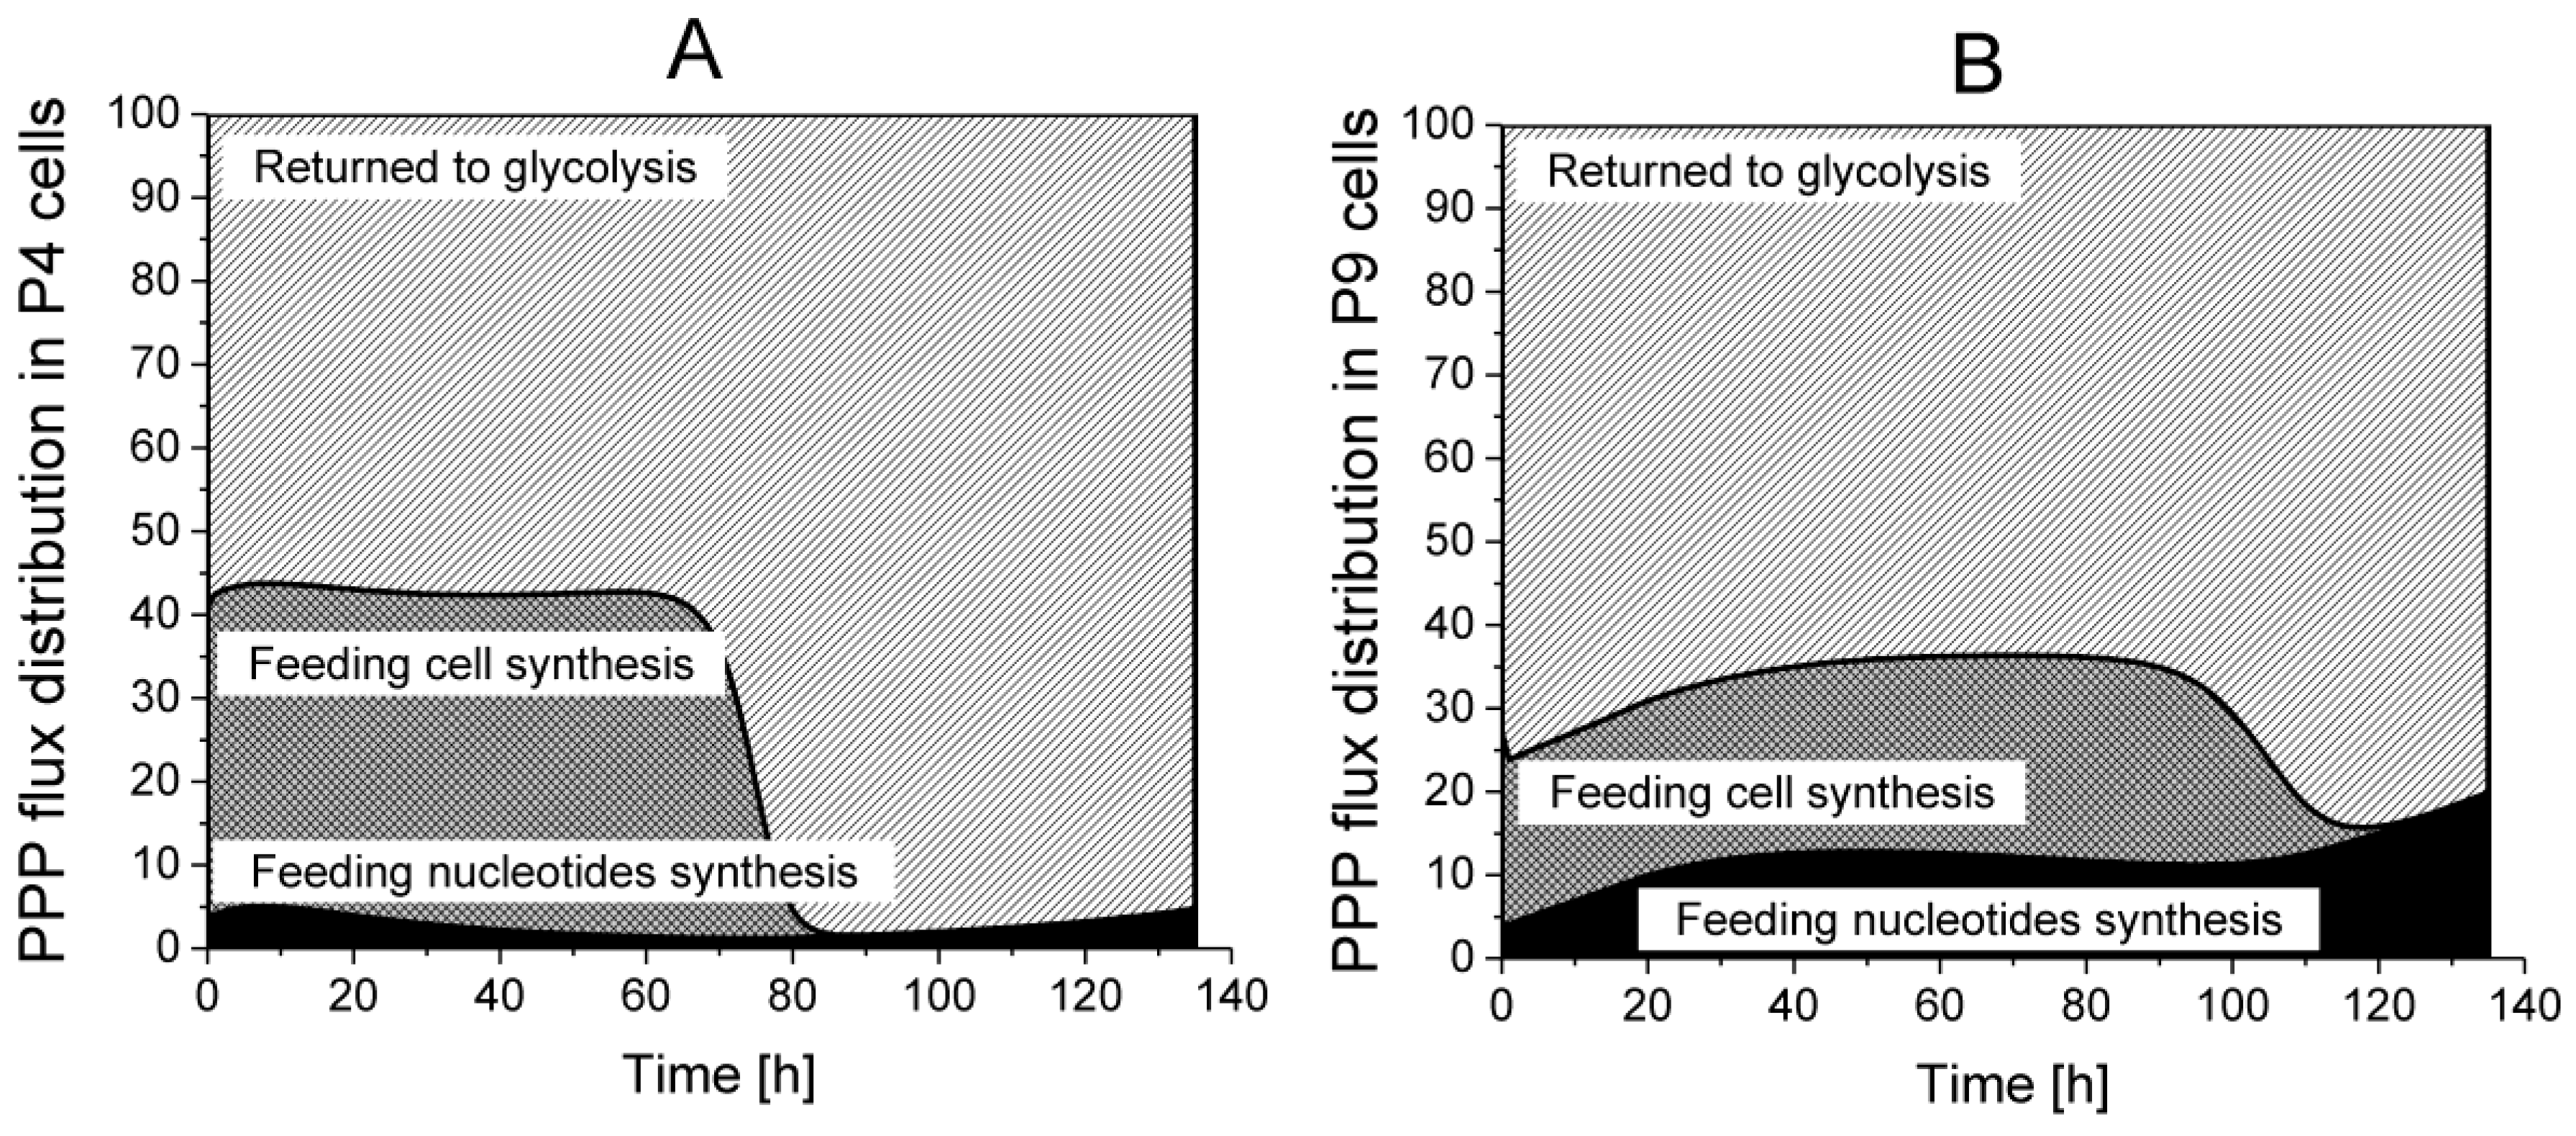


 ATP production from glycolysis,
  ATP production from TCA cycle,
  ATP production from respiration.
ATP production from glycolysis, ATP production from TCA cycle, ATP production from respiration.
ATP production from respiration.
ATP production from glycolysis, ATP production from TCA cycle, ATP production from respiration.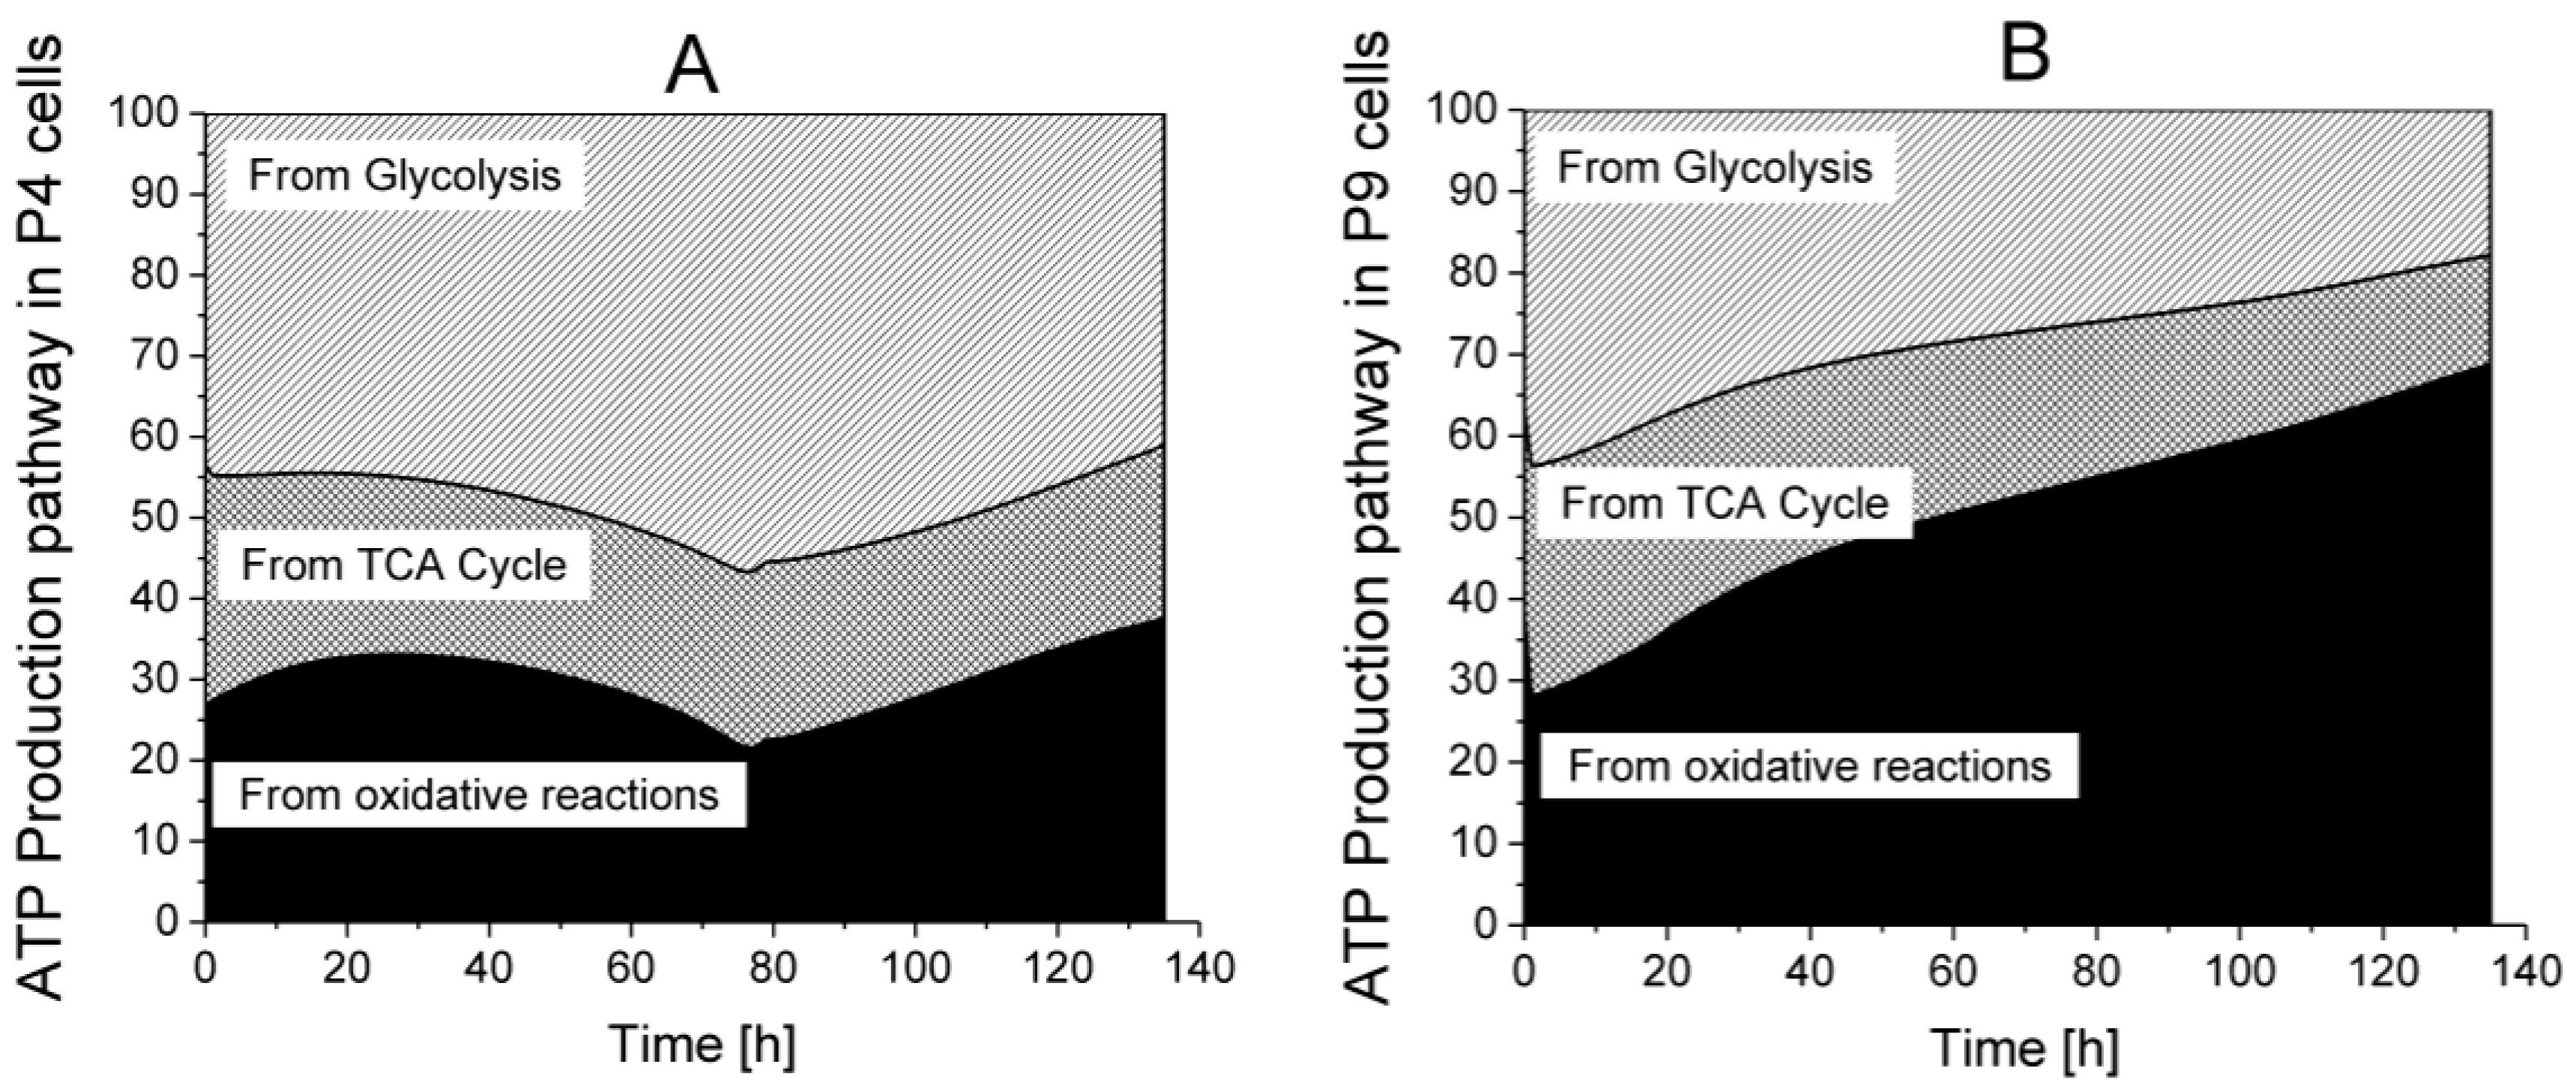


| Parameters | Units | P4 Cells | P4 and P9 Combined | P9 Cells | P9 vs. P4 |
|---|---|---|---|---|---|
| mmol·10−6 cells·h−1 | 6.20 × 10⁻⁴ | 6.20 × 10⁻⁴ | 1.34 × 10⁻² | 22x | |
| mmol·10−6 cells·h−1 | 1.87 × 10⁻⁴ | 1.92 × 10⁻⁴ | 1.94 × 10⁻⁴ | idem | |
| mmol·10−6 cells·h−1 | 1.53 × 10⁻³ | 1.53 × 10⁻³ | 1.53 × 10⁻³ | idem | |
| mmol·10−6 cells·h−1 | 9.42 × 10⁻⁴ | 1.08 × 10⁻³ | 1.11 × 10⁻³ | 1.2x | |
| mmol·10−6 cells·h−1 | 9.45 × 10⁻⁴ | 1.08 × 10⁻³ | 1.10 × 10⁻³ | 1.2x | |
| h−1 | 8.57 × 10⁻² | 6.97 × 10⁻² | 4.26 × 10⁻² | 0.5x | |
| mmol·10−6 cells·h−1 | 1.58 × 10⁻³ | 1.00 × 10⁻³ | 7.67 × 10⁻⁴ | 0.5x | |
| mmol·10−6 cells·h−1 | 7.91 × 10⁻⁵ | 8.80 × 10⁻⁵ | 8.88 × 10⁻⁵ | idem | |
| mmol·10−6 cells·h−1 | 4.19 × 10⁻⁵ | 5.33 × 10⁻⁵ | 7.81 × 10⁻⁵ | 1.9x | |
| mmol·10−6 cells·h−1 | 1.35 × 10⁻⁴ | 1.42 × 10⁻⁴ | 9.89 × 10⁻⁵ | 0.7x | |
| mmol·10−6 cells·h−1 | 1.63 × 10-03 | 1.17 × 10⁻³ | 1.08 × 10⁻³ | 0.7x | |
| mmol·10−6 cells·h−1 | 7.09 × 10⁻⁴ | 7.20 × 10⁻⁴ | 1.20 × 10⁻³ | 1.7x | |
| mmol·10−6 cells·h−1 | 1.39 × 10⁻³ | 1.39 × 10⁻³ | 1.39 × 10⁻³ | idem | |
| mmol·10−6 cells·h−1 | 3.16 × 10⁻⁴ | 3.16 × 10⁻⁴ | 3.16 × 10⁻⁴ | idem | |
| mmol·10−6 cells·h−1 | 1.79 × 10⁻¹ | 1.79 × 10⁻¹ | 1.79 × 10⁻¹ | idem | |
| mM | 1.83 × 10⁻⁷ | 1.00 × 10⁻⁷ | 5.21 × 10⁻⁷ | 2.8x | |
| mM | 3.00 × 10⁻¹ | 3.00 × 10⁻¹ | 3.35 × 10⁻¹ | idem | |
| mM | 3.00 × 10⁻¹ | 3.00 × 10⁻¹ | 9.70 × 10⁻¹ | 3.2x | |
| mM | 3.00 × 10⁻¹ | 3.00 × 10⁻¹ | 8.47 × 10⁻¹ | 2.8x | |
| mM | 1.50 × 10⁻¹ | 1.50 × 10⁻¹ | 2.31 × 10⁻¹ | 1.5x | |
| mM | 5.00 × 10⁻¹ | 5.00 × 10⁻¹ | 2.49 × 10⁻¹ | 0.5x | |
| mmol·10−6 cells | 1.00 × 10⁻⁸ | 1.00 × 10⁻⁸ | 1.00 × 10⁻⁸ | idem | |
| mM | 4.95 | 5.00 | 6.06 | 1.2x | |
| / | 1.05 | 1.10 | 1.28 | 1.2x | |
| / | 6.27 × 10⁻¹ | 1.05 | 1.69 | 2.7x | |
| mmol·10−6 cells | 1.12 × 10⁻⁷ | 1.08 × 10⁻⁷ | 1.04 × 10⁻⁷ | idem | |
| / | 4.57 × 10⁻¹ | 4.65 × 10⁻¹ | 4.68 × 10⁻¹ | idem | |
| / | 1.38 × 101 | 1.20 × 101 | 1.19 × 101 | idem | |
| mmol·10−6 cells | 4.06 × 10⁻⁷ | 2.00 × 10⁻⁷ | 2.00 × 10⁻⁷ | 0.5x | |
| mmol·10−6 cells | 3.00 × 10⁻⁷ | 3.00 × 10⁻⁷ | 3.00 × 10⁻⁷ | idem | |
| mmol·10−6 cells | 1.19 × 10⁻² | 1.19 × 10⁻² | 1.19 × 10⁻² | idem | |
| mmol·10−6 cells | 1.19 × 10⁻² | 1.19 × 10⁻² | 1.19 × 10⁻² | idem |
| Cells | Experimental Data (h−1) | Model Estimations (h−1) |
|---|---|---|
| P4 | [2.4 ± 0.3] × 10−2 | [2.1–2.5] × 10−2 |
| P9 | [1.5 ± 0.3] × 10−2 | [1.15–1.24] × 10−2 |
© 2018 by the authors. Licensee MDPI, Basel, Switzerland. This article is an open access article distributed under the terms and conditions of the Creative Commons Attribution (CC BY) license (http://creativecommons.org/licenses/by/4.0/).
Share and Cite
Laflaquière, B.; Leclercq, G.; Choey, C.; Chen, J.; Peres, S.; Ito, C.; Jolicoeur, M. Identifying Biomarkers of Wharton’s Jelly Mesenchymal Stromal Cells Using a Dynamic Metabolic Model: The Cell Passage Effect. Metabolites 2018, 8, 18. https://doi.org/10.3390/metabo8010018
Laflaquière B, Leclercq G, Choey C, Chen J, Peres S, Ito C, Jolicoeur M. Identifying Biomarkers of Wharton’s Jelly Mesenchymal Stromal Cells Using a Dynamic Metabolic Model: The Cell Passage Effect. Metabolites. 2018; 8(1):18. https://doi.org/10.3390/metabo8010018
Chicago/Turabian StyleLaflaquière, Benoît, Gabrielle Leclercq, Chandarong Choey, Jingkui Chen, Sabine Peres, Caryn Ito, and Mario Jolicoeur. 2018. "Identifying Biomarkers of Wharton’s Jelly Mesenchymal Stromal Cells Using a Dynamic Metabolic Model: The Cell Passage Effect" Metabolites 8, no. 1: 18. https://doi.org/10.3390/metabo8010018