Article

An Improved Genome-Scale Metabolic Model of Arthrospira platensis C1 (iAK888) and Its Application in Glycogen Overproduction

by
Amornpan Klanchui
1,
Sudarat Dulsawat
2,
Kullapat Chaloemngam
3,
Supapon Cheevadhanarak
4,
Peerada Prommeenate
5,* and
Asawin Meechai
3,*
1
Biological Engineering Program, Faculty of Engineering, King Mongkut’s University of Technology Thonburi, Bangkok 10140, Thailand
2
Pilot Plant Development and Training Institute, King Mongkut’s University of Technology Thonburi (Bang Khun Thian), Bangkok 10150, Thailand
3
Department of Chemical Engineering, Faculty of Engineering, King Mongkut’s University of Technology Thonburi, Bangkok 10140, Thailand
4
Division of Biotechnology, School of Bioresources and Technology, King Mongkut’s University of Technology Thonburi, Bangkok 10150, Thailand
5
Biochemical Engineering and Pilot Plant Research and Development (BEC) Unit, National Center for Genetic Engineering and Biotechnology, National Science and Technology Development Agency, King Mongkut’s University of Technology Thonburi, Bangkok 10150, Thailand
*
Authors to whom correspondence should be addressed.
Metabolites 2018, 8(4), 84; https://doi.org/10.3390/metabo8040084
Submission received: 21 October 2018 / Revised: 16 November 2018 / Accepted: 20 November 2018 / Published: 26 November 2018
(This article belongs to the Special Issue Metabolites from Phototrophic Prokaryotes and Algae Volume 2)

Abstract

:
Glycogen-enriched biomass of Arthrospira platensis has increasingly gained attention as a source for bioethanol production. To study the metabolic capabilities of glycogen production in A. platensis C1, a genome-scale metabolic model (GEM) could be a useful tool for predicting cellular behavior and suggesting strategies for glycogen overproduction. New experimentally validated GEM of A. platensis C1 namely iAK888, which has improved metabolic coverage and functionality was employed in this research. The iAK888 is a fully functional compartmentalized GEM consisting of 888 genes, 1,096 reactions, and 994 metabolites. This model was demonstrated to reasonably predict growth and glycogen fluxes under different growth conditions. In addition, iAK888 was further employed to predict the effect of deficiencies of NO3, PO43−, or SO42− on the growth and glycogen production in A. platensis C1. The simulation results showed that these nutrient limitations led to a decrease in growth flux and an increase in glycogen flux. The experiment of A. platensis C1 confirmed the enhancement of glycogen fluxes after the cells being transferred from normal Zarrouk’s medium to either NO3, PO43−, or SO42−-free Zarrouk’s media. Therefore, iAK888 could be served as a predictive model for glycogen overproduction and a valuable multidisciplinary tool for further studies of this important academic and industrial organism.

1. Introduction

Due to the environmental concerns of production and utilization of fossil fuels, researches towards renewable energy are currently of great interest. Conversion of carbohydrate-enriched biomass of microalgae has become one of the promising approaches for sustainable clean energy generation [1]. Since their carbohydrates are in the form of lignin-free cellulose, starch, or glycogen, microalgae are much easier to convert to monosaccharides compared to lignocellulosic feedstocks [2]. In particular, prokaryotic microalgae, cyanobacteria, have certain advantages over eukaryotic microalgae for many reasons. They possess peptidoglycan cell wall which is easily degraded by fermentation processes [3,4]. Moreover, cyanobacteria accumulate glycogen as storage carbohydrate which is an excellent feedstock for fermentation over starch [4]. Furthermore, transformation systems in cyanobacteria have been much better developed [5,6,7].
Arthrospira (Spirulina) platensis, a filamentous non-nitrogen-fixing cyanobacterium, is an attractive candidate which has certain properties to be used as promising feedstocks for bioethanol production. For example, it has the capacity to accumulate large amounts of glycogen during cultivation under nutrient or environmental stresses [1]. The highest glycogen productivity of 0.29 g L−1 d−1 was reported under NO3 depletion and high light intensity of 700 μmol photons/m2/s [8]. It also has the unique impressive characteristics for industrial applications, including a contaminant-free culture under the outdoor cultivation [9] and a fast bio-flocculation capability under nutrient starvation condition [10]. Moreover, Aikawa et al. proposed a low cost technology that generates the highest yield of bioethanol from carbohydrate-rich Arthrospira biomass by yeast fermentation [3]. Although research works have showed the potential use of Arthrospira to generate bioethanol, however, the glycogen productivity is still not high enough to profitably produce bioethanol at the commercial scale. To overcome this challenge, strategies for enhancement of glycogen content in A. platensis is needed. Among Arthrospira, A. platensis strain C1 is a good candidate for bioethanol production because it has distinct advantages over the others in term of strain improvement, non-gliding property [9], genome sequence [11], transformation systems [12], and the most comprehensive data at the molecular level, transcriptomics [13,14] proteomics [15,16,17] and protein–protein interactions [18]. However, the glycogen production in A. platensis C1 has not been investigated.
Driven by advancements in high-throughput biological and computational technologies, genome-scale metabolic model (GEM), a mathematical form of the cellular metabolic network, is currently being the indispensable tool for understanding cell phenotypes and providing rational strategies to maximize production of a desired metabolic product [19]. GEMs of various organisms across three domains of life, i.e., archaea, bacteria, and eukarya have been constructed and applied in various research areas, ranging from industrial to medical biotechnology [20,21]. Flux balance analysis (FBA) [22] is the most commonly used approach to simulate the GEMs. To investigate the metabolic activity and integrate omics data for allowing comprehensive studies at the systematic level of A. platensis C1, the first GEM of A. platensis C1, iAK692, was developed in 2012 [23]. This model was applied to predict optimal growth behavior, metabolic phenotypes, and essential genes under autotrophic, heterotrophic, and mixotrophic growth conditions.
Since bioinformatics tools, pathway/genome databases, and literatures have now been updated, newly curated genes and biochemical knowledge have become available. In this research, an updated GEM of A. platensis C1 named iAK888 was employed. iAK888 was built based on information of iAK692 as well as new annotated and curated genomic and biochemical knowledge. The iAK888, a fully compartmentalized GEM, is the most up-to-date comprehensive model for A. platensis. The model was demonstrated herein to be a helpful tool for proposing the rational strategies for improvement of glycogen production in A. platensis C1.

2. Materials and Methods

2.1. Genome-Scale Metabolic Network Reconstruction

The iAK888 was reconstructed by refining and updating the previously reconstructed genome-scale model for A. platensis C1, iAK692 [23]. The first step in the metabolic network reconstruction process was genome reannotation, which provided the initial set of gene–protein reaction (GPR) associations. The draft genome sequence of A. platensis C1 (6.089 Mb; GenBank NZ_CM001632) [11] was retrieved. A functional annotation was then performed using two independent systems: (i) The rapid annotation of microbial genomes using Subsystems Technology (RAST) annotation servers [24] supported by the SEED [25] and (ii) Kyoto Encyclopedia of Genes and Genomes (KEGG) Automatic Annotation Server (KAAS) [26]. To increase confidence in the annotation, the predicted ORFs obtained from iAK692, RAST [18], and KAAS [26] were compared. Only the shared ORFs were considered and any conflicting annotations were discarded. All transport genes and reactions were identified using a BLAST search [27] against the Transporter Classification Database (TCDB) [28].
Subsequently, a list of GPR associations was assembled and manually curated to reflect actual physiology of A. platensis C1 based on various information sources including biochemical databases [25,29,30], literatures [31,32,33,34], and curated genome-scale models, Synechocystis sp. PCC6803 [35] and Escherichia coli [36]. Manual curation was performed according to the standard reconstruction protocol [37]. A confidence scoring system [37] was employed to assign a confidence score to every network reaction. The score reflects the amount of available evidence type, biochemical data, genetic data, physiological data, sequence data, and modeling data, associated with individual reaction, ranging from 1 to 4, where 1 is the lowest and 4 is the highest evidence score. The gene expression data of A. platensis C1 (accession E-MTAB-2714) [14] were acquired from ArrayExpress in order to verify existence of predicted ORFs involved in the reconstructed network. Briefly, gene expression data of the control sample, in which A. platensis C1 was cultured in Zarrouk’s medium at 35 °C under a light intensity of 100 µmol photons/m2/s, were preprocessed and normalized. Then, the average of the log intensities between a housekeeping gene, 16S rRNA, and all genes were compared. Genes whose expression were equal to or greater than the housekeeping gene indicated the evidence for the existence of these genes and the associated reactions. Furthermore, all reactions were charge and mass balanced. The reaction directions were also assigned based on the standard Gibbs free energy of reaction (ΔrGo) provided by the SEED [25]. Formulas and charges for all metabolites were checked against KEGG [29] and PubChem [38]. Subsequently, the cofactor specificity of the enzyme in A. platensis C1 was verified using organism-related species literature. Cellular compartments of candidate genes and reactions were determined based on the literature and the GEM of Synechocystis sp. PCC6803 [35]. Moreover, BLAST search [27] and functional domain analysis using Pfam [39] were conducted to refine missing and low confidence gene annotations. The ambiguous genes existing in the iAK692, but absent in the annotation results of RAST [24] and KAAS [26] were removed.
Additionally, energy-generating cycles (type-II pathways) or internal cycles (type-III pathways) were checked during the reconstruction process to ensure that ATP and NAD(P) could not be produced without nutrient consumption. For ATP, the ATP maintenance flux was optimized when CO2 and photon uptake fluxes were set to zero. For NAD(P), an artificial reaction NAD(P)H → NAD(P) + H was added in the reconstructed network and optimized when CO2 and photon uptakes were not available. If either ATP or NAD(P) could be produced without nutrient uptake, the reactions related to the production of these energy metabolite were checked manually.
An organism-specific biomass equation, representing cell growth in silico, was formulated and used as an objective function for simulating growth phenotypes through FBA [22]. The major macromolecular constituents of biomass synthesis consisted of protein, carbohydrate, lipid, DNA, RNA, pigments, vitamins, and minerals. The content of each constituent of iAK888, compared to the previously published model, iAK692, is shown in Table 1. The protein, carbohydrate, and lipid were estimated in the exponential growth phase of A. platensis C1 [40]. The stoichiometric coefficients of DNA, RNA, and protein synthesis reactions were estimated from the nucleotide and amino acid contents of the published genome of A. platensis C1 [11]. Moreover, the biomass equation for iAK888 also included pigments, vitamins and minerals, of which the coefficients were calculated based on the published information of the closest species [41,42,43,44,45]. In this study, all stoichiometric coefficients in the biomass equation were assumed to be constant under different environmental conditions. The detailed calculation of the biomass equation is provided in Supplementary File S1.

2.2. Flux Balance Analysis

Flux balance analysis (FBA) is a widely used constraint-based optimization approach for predicting specific reaction rates (fluxes) of a large-scale network based on stoichiometry and steady-state assumption [22]. Briefly, all reactions within a reconstructed genome-scale metabolic network were converted into a stoichiometric matrix, S, in which each column and row represented one unique reaction and metabolite, respectively. The entries of S are the stoichiometric coefficients of metabolites participating in a reaction. By applying the mass balance constraints and steady state assumption, the particular metabolite’s concentration change per unit time is equal to zero (Sv = 0), where v represents the vector of reaction fluxes. Then, other constraints such as thermodynamic and enzyme capacity were accounted, thereby, determining reaction directions (reaction directionality and reaction reversibility) [46]. Reaction directionality is typically assigned based on a negative ΔrGo while, reaction reversibility is a kinetic property of enzymes which are able to catalyze the reactions in the forward and backward directions. Hence, thermodynamic constraints help to decide the reaction directions in FBA. Finally, a linear programming was applied to maximize or minimize an objective function, usually the biomass reaction flux. This optimization results in optimal objective flux and optimal flux distribution of the metabolic network. In this work, the COBRA toolbox version 2 [47] with MATLAB (The MathWorks, version R2015b) was employed to model and predict cell behaviors i.e., specific growth rate and glycogen production flux.

2.3. Estimation of Glycogen Production Flux

To represent the glycogen metabolism in A. platensis, iAK888 incorporates 4 glycogen associated reactions, i.e., (i) glycogen synthesis reaction, (ii) glycogen utilization reaction for biomass growth, (iii) glycogen transport reaction for carbon storage and (iv) glycogen degradation reaction. In this work, glycogen was treated as a monomer (C6H10O5, MW = 162.141) in the glycogen synthesis reaction where one mole of glycogen was synthesized from one mole of glucose-1-phosphate by glycogen synthase (glgA, EC 2.4.1.21). In addition, glycogen phosphorylase (glgP, EC 2.4.1.1) that is responsible for the glycogen degradation was assumed to be inactive under autotrophic growth. Thus, the glycogen production flux was simply determined from the flux of the glycogen synthesis reaction.

2.4. Model Validation

To evaluate the accuracy of the reconstructed metabolic model, comparisons between predicted phenotypes and experimental data, including a maximal growth rate under different growth conditions and maximal carbohydrate production flux under nitrogen depletion condition were performed.
For prediction of the maximum specific growth rate, the experimental data sets in which A. platensis C1 was grown under autotroph, heterotroph, and mixotroph were calculated and used as the input parameters. Cells grown under autotrophic conditions were simulated and compared, including two independent sets of A. platensis C1 experiments, (i) setting the photon uptake rate to 100 μmol photons/m2/s and HCO3 uptake rate to 0.2 mmol/gDCW/h [23] and (ii) setting the photon uptake rate to 200 μmol photons/m2/s and HCO3 uptake rate to 0.25 mmol/gDCW/h [48]. Cells grown under a heterotrophic condition were simulated by setting the photon uptake rate to zero and glucose uptake rate to 0.017 mmol/gDCW/h [23]. For mixotrophic condition, cell growth was simulated by setting the photon uptake rate to 100 μmol photons/m2/s, HCO3 uptake rate to 0.2 mmol/gDCW/h, and glucose uptake rate to 0.017 mmol/gDCW/h [23].
To further assess the reliability of the model, the maximum total carbohydrate production flux under nitrogen depletion condition was predicted. The photon and HCO3 uptake rate were set at 100 μmol photons/m2/s and 0.2 mmol/gDCW/h, respectively. NO3 uptake rate and specific growth rate were set to zero as observed in the experiment [49]. The objective function was accounted for maximizing the carbohydrate production flux.
For all the simulations, the uptake rates of all nutrients present in the Zarrouk’s medium [50] were constrained as 0 to −1000, while the transport fluxes of CO2, O2, and H2O were left unconstrained. In addition, all photons were assumed to be absorbed and used for driving photosynthesis without the influence of photoinhibition.

2.5. Simulation of Glycogen Production Under Nutrient-Limited Conditions

The effect of NO3, PO43−, and SO42− on growth and glycogen production were simulated by FBA [22] under the autotrophic condition. The specific uptake rate of HCO3 was fixed at 1.6 mmol/gDCW/h for all simulations to guarantee an excess carbon condition. The maximum photon uptake flux was set to 100 μmol photons/m2/s. The effect of each nutrient on specific growth rate and total glycogen production flux was analyzed by varying the uptake flux values of each nutrient, NO3, PO43−, and SO42−. The objective function was set to maximize the flux of the glycogen synthesis reaction. Additionally, flux variability analysis (FVA) [51] was performed to determine the minimum and maximum possible fluxes under the simulation conditions. Geometric FBA [52] was also used to determine a unique optimal solution which is central to the range of possible flux distributions.

2.6. Experimental Validation

To evaluate the validity of iAK888, A. platensis C1 (PCC9438) was cultured in 1 L Erlenmeyer flasks containing 500 mL of Zarrouk’s medium [50] at 35 °C under white fluorescent illumination at 100 μmol photons/m2/s until mid-logarithmic phase. Then, the cells were transferred to three different Zarrouk’s media, lacking either nitrate (NaNO3 and Co(NO3)·6H2O), or phosphate (K2HPO4), or sulfur (K2SO4, FeSO4·7H2O, MgSO4·7H2O, ZnSO4·7H2O, CuSO4·5H2O, NiSO4·7H2O, Ti(SO4), and K2Cr2(SO4)4·24H2O), and then re-incubated under the same incubation conditions as mentioned above. The control experiments were carried out in normal Zarrouk’s medium formulation [50]. Samples were collected at each time point 0, 3, 6, 12, 18, 24, 48, 72 and 96 hours after the cells were transferred to different media, and were kept frozen at −80 °C for further analysis. All experiments were repeated in triplicate.
To analyze growth of A. platensis C1, the cell concentration was quantified by turbidity based on the optical density at 560 nm (OD560) using a Genesys 20 spectrophotometer (Thermo scientific, Waltham, MA) and measured for dry cell weight (DCW). The correlation between OD560 and DCW (DCW in g/L = 1.0888xOD560) was calculated based on triplicated experiments. Glycogen content was measured using iodine-glycogen assay [53]. Briefly, 100 µL of wet cell was mixed with 50 mg of glass beads and 500 µL of phosphate-buffered saline. The samples were vortexed at maximum speed for 5 min and incubated at 65 °C for 10 min. The samples were then centrifuged at 12,000 rpm for 10 min at 4 °C. Subsequently, 100 µL of supernatants were mixed with 5 µL of iodine solution in Greiner 96-well plate and incubated at 25 °C for 1 min. Absorbance was determined using Microplate reader (Tecan Infinite M200, Mannedorf, Switzerland) at a wavelength of 492 nm. The glycogen concentration of the samples was calculated using the equation obtained from the linear regression of the standard curve.

3. Results and Discussion

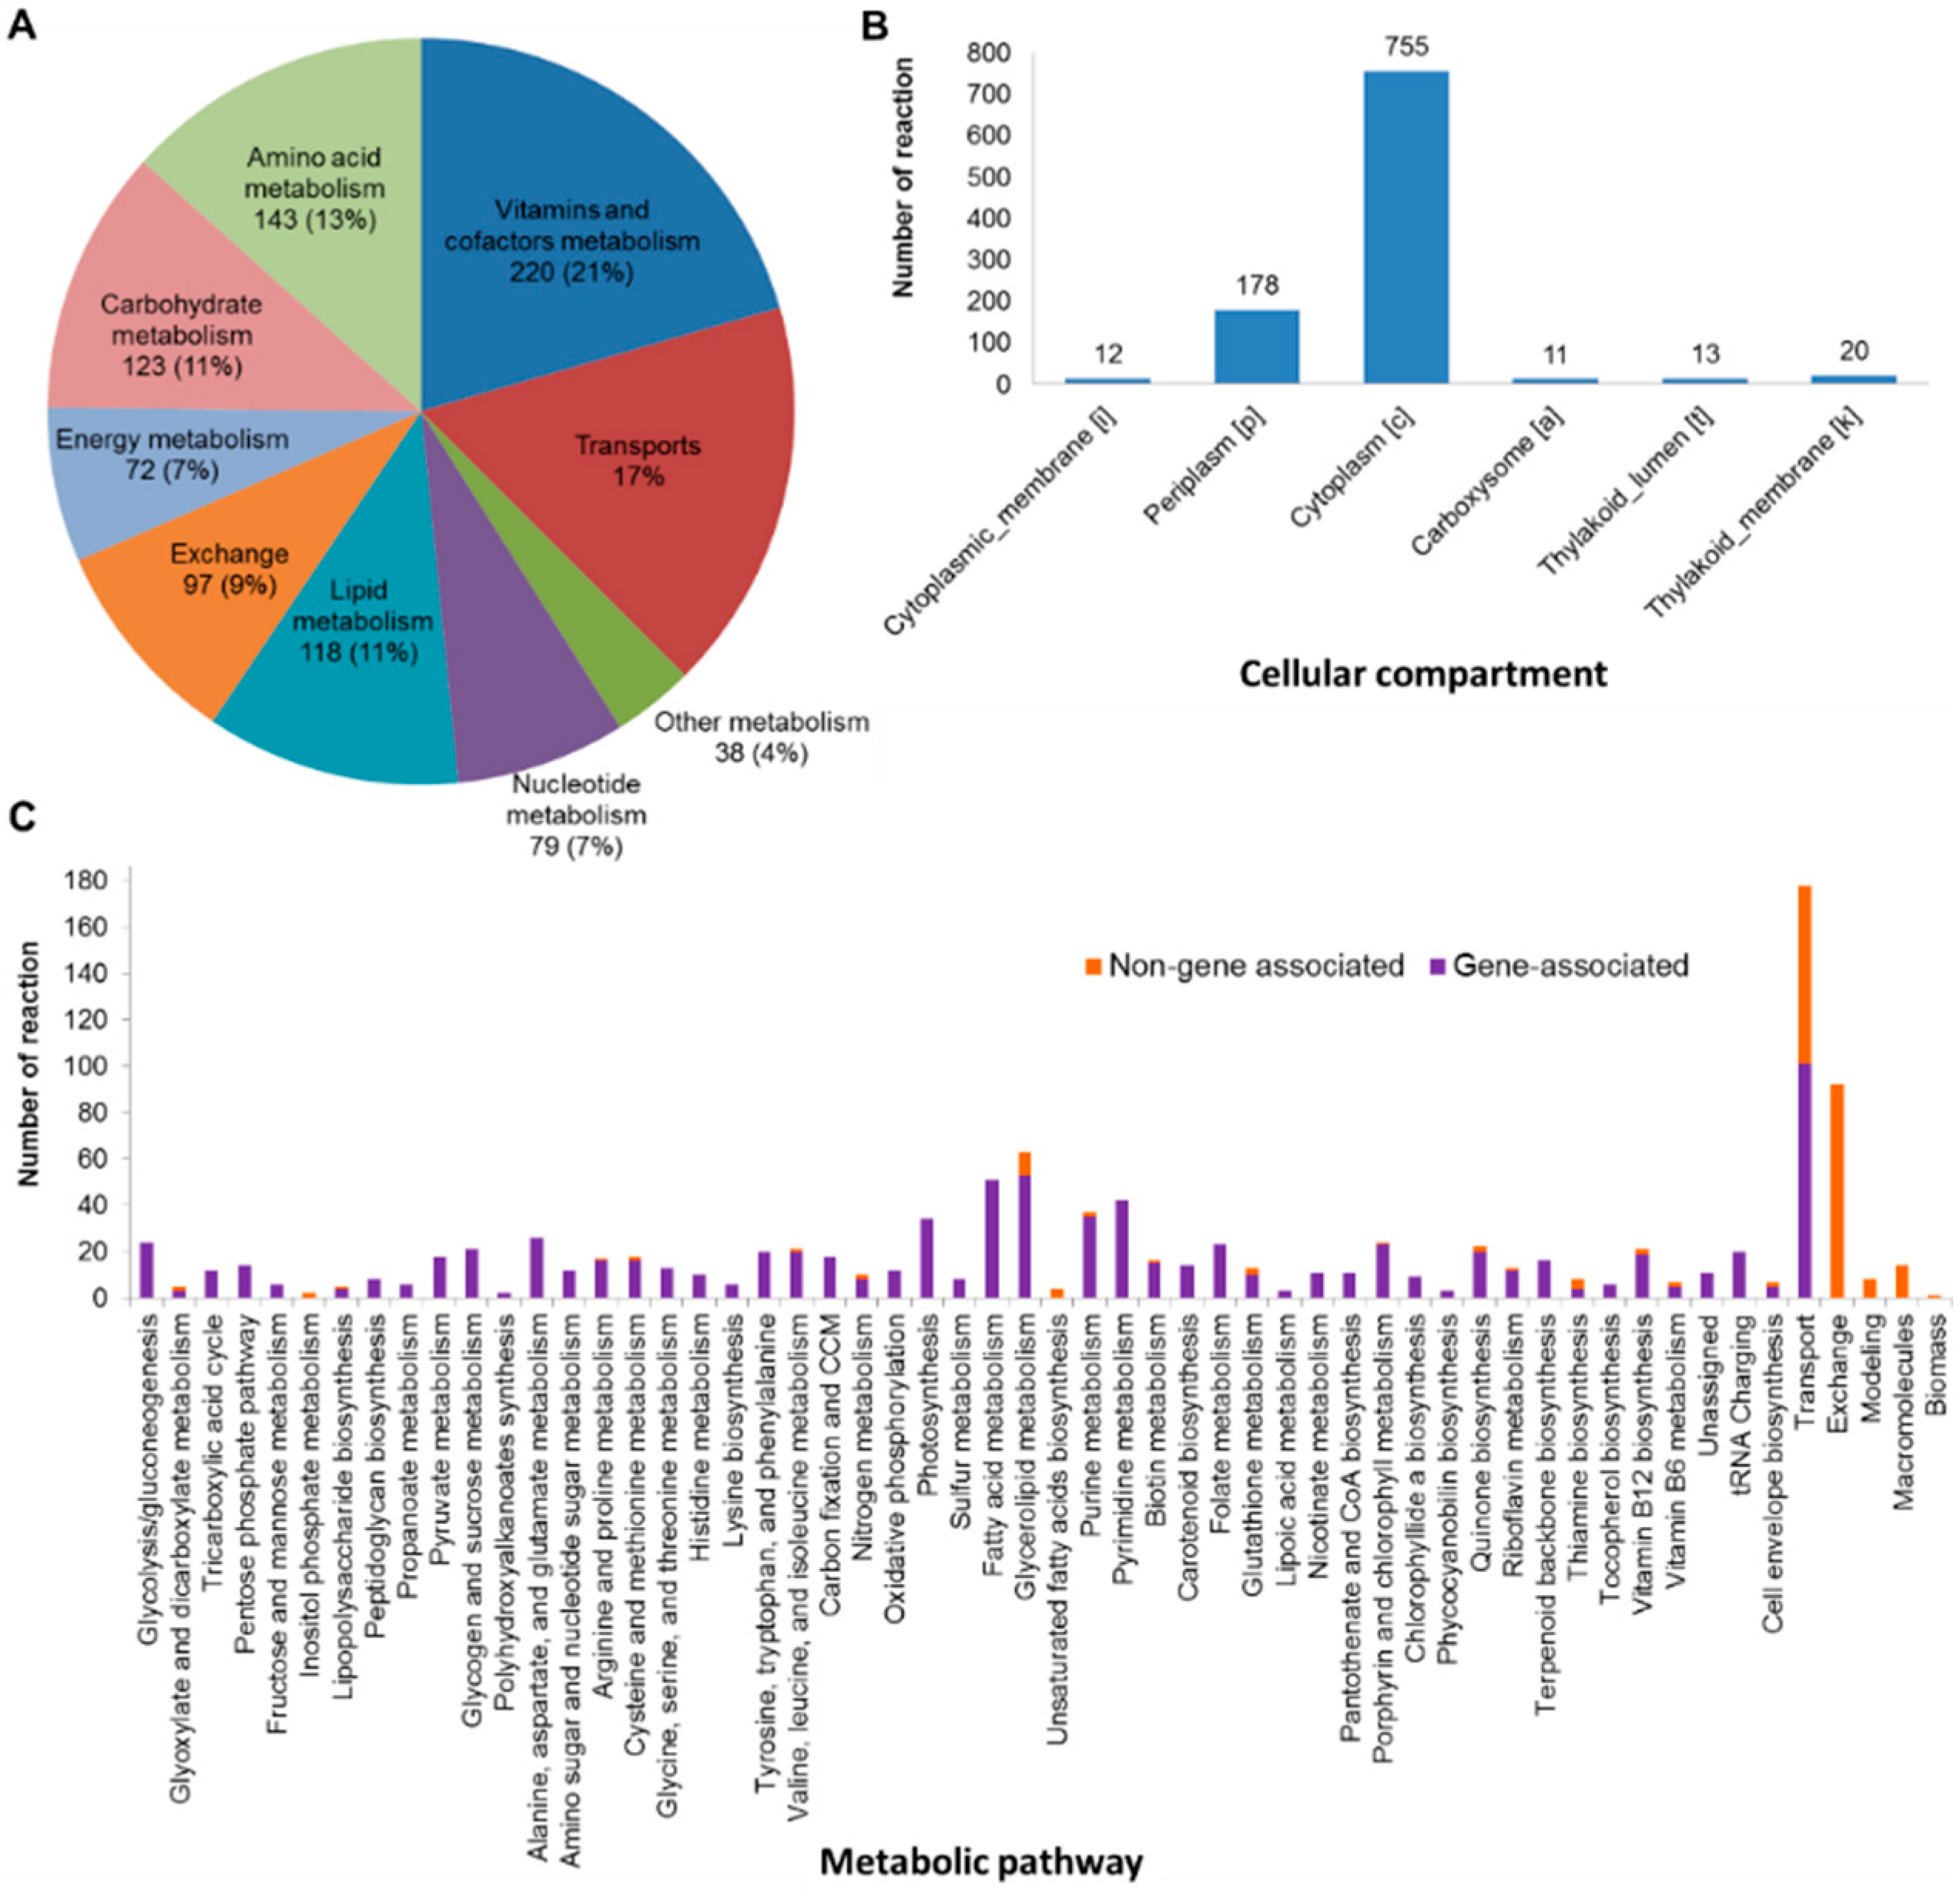
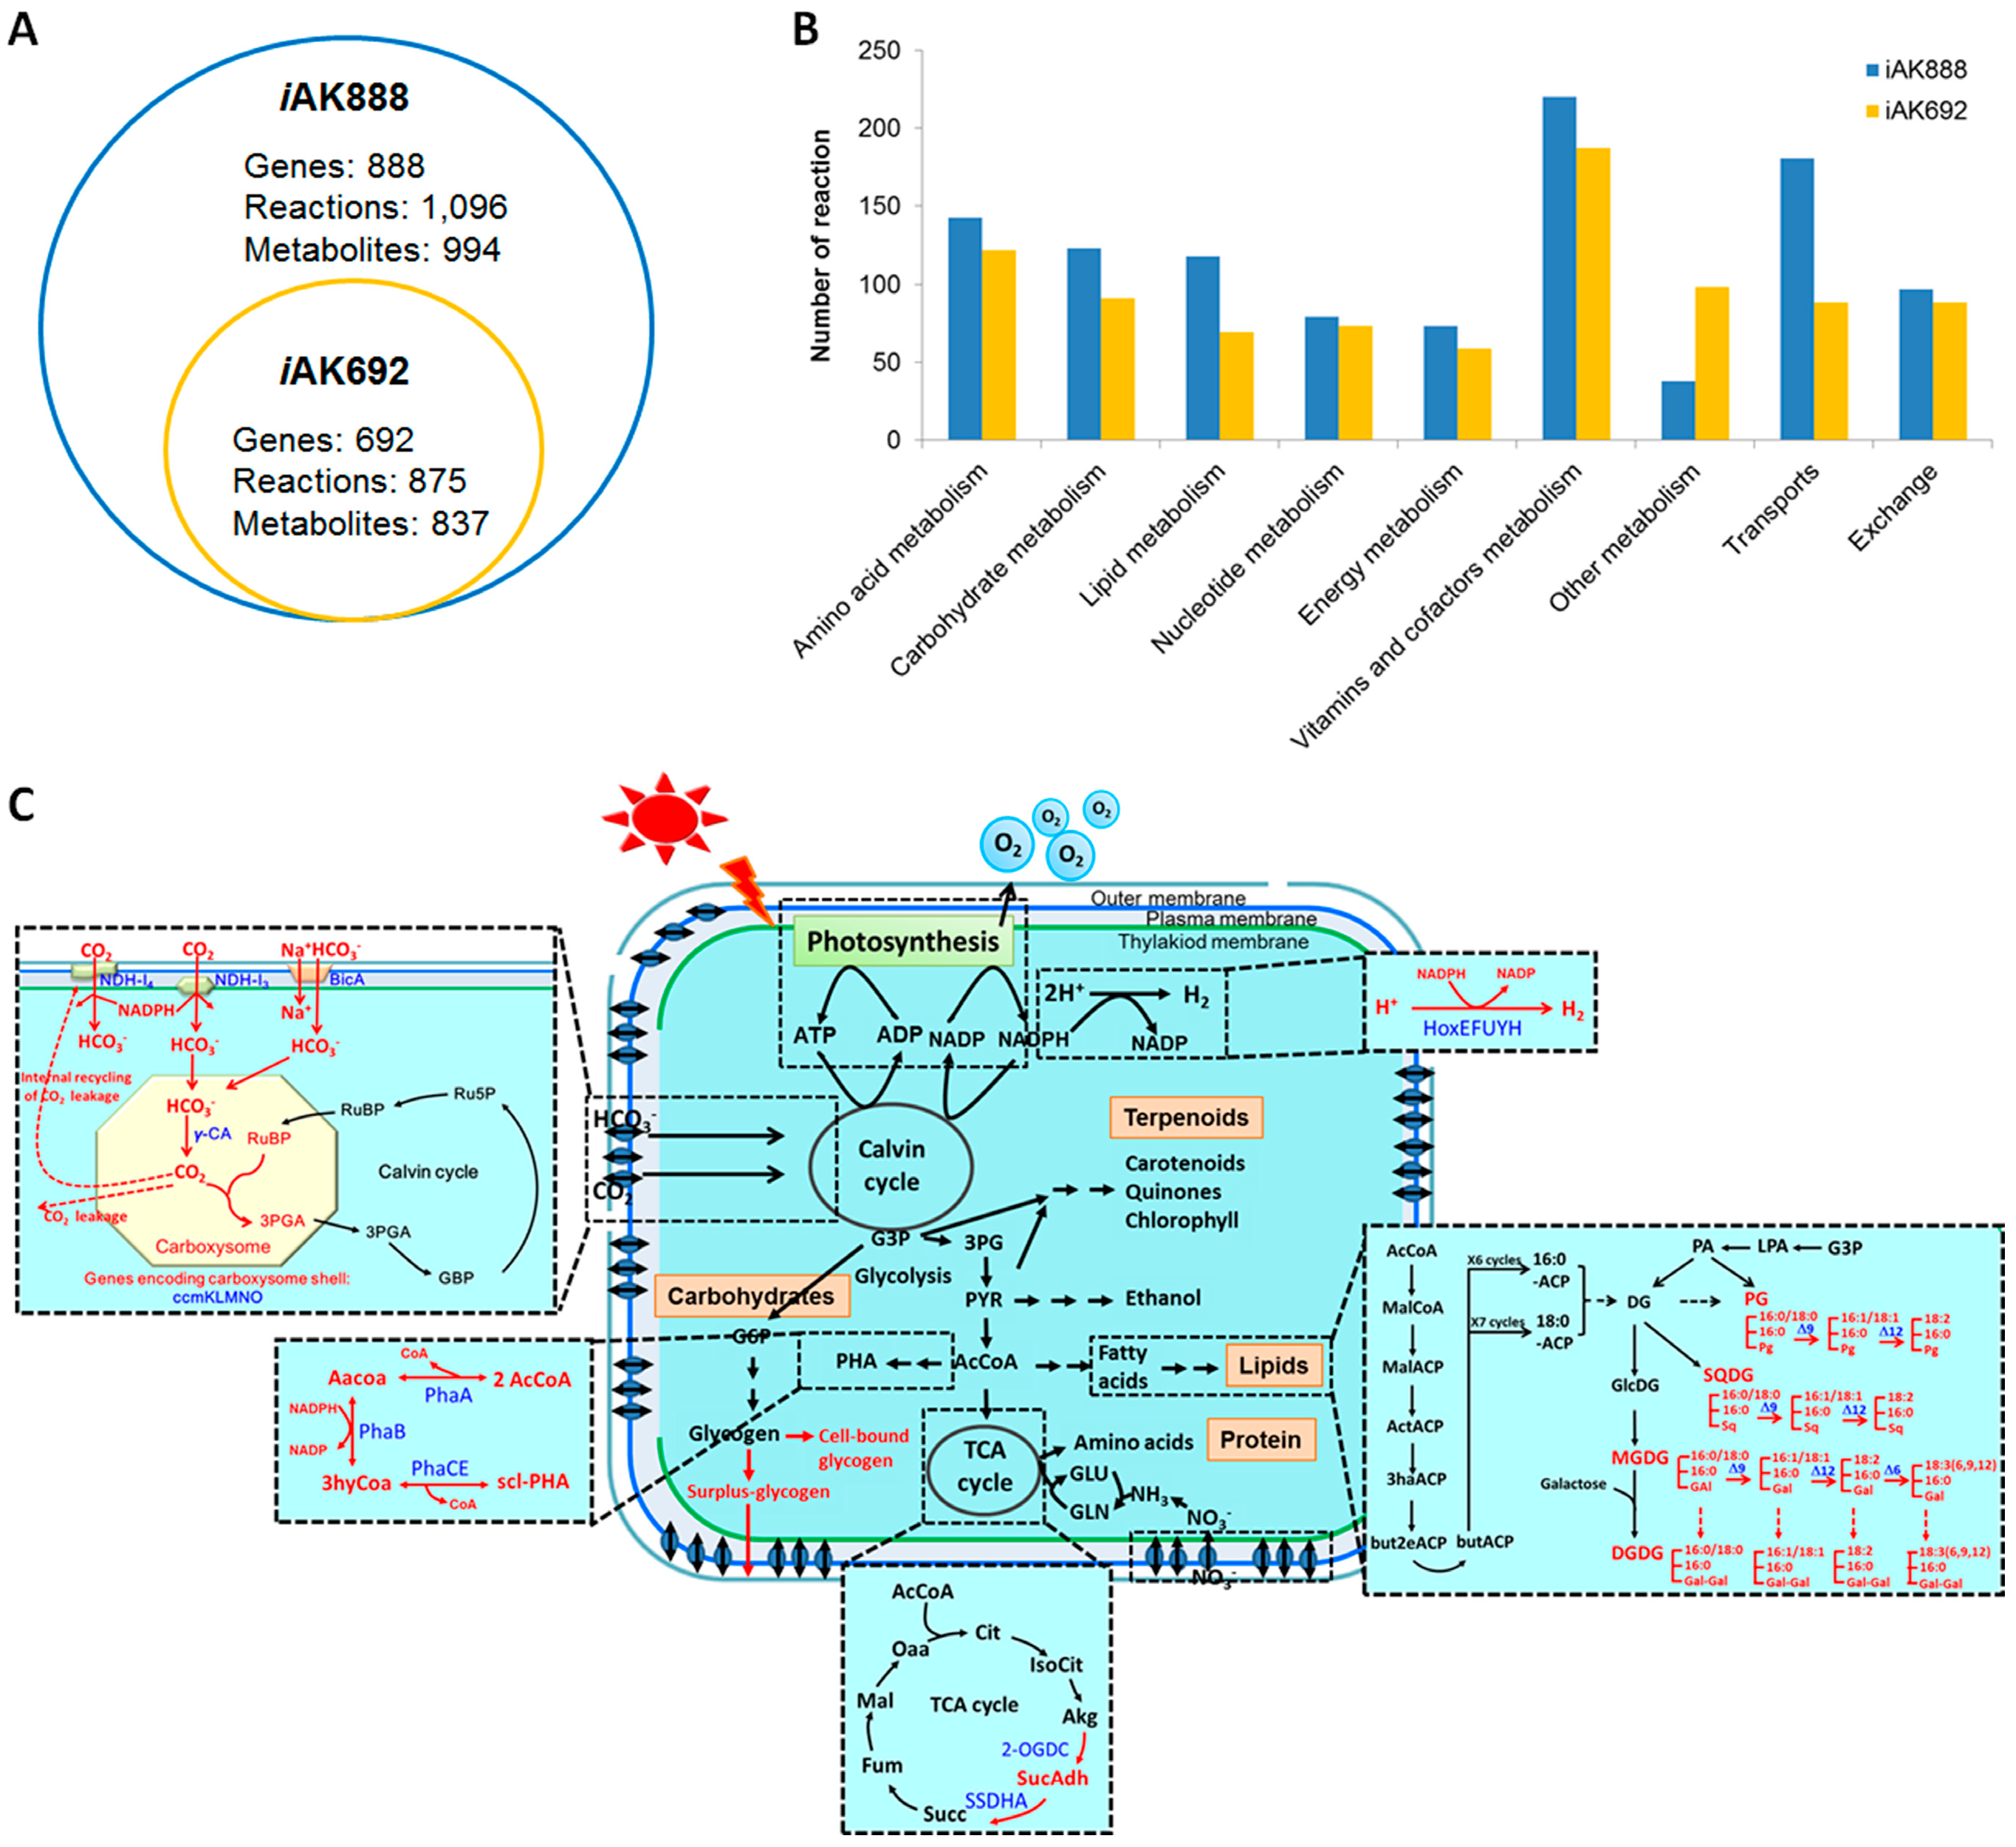
3.1. Reconstruction of the Updated Genome-Scale Metabolic Network of A. platensis C1

Genome annotation showed that the rapid annotation of microbial genomes using Subsystems Technology (RAST) annotation servers [24] predicted a total of 2626 (1759 unique genes), whereas the KEGG Annotation Server (KAAS) [26] predicted a total of 1729 genes (1011 unique genes). Using the previously published genome-scale reconstruction for A. platensis C1 (iAK692) [23] as a reference, the annotation results overlapping among these three sources were analyzed. There were 513 conserved genes while 70 genes were shared between iAK692 [23] and KAAS [26]; 45 genes were shared between iAK692 [23] and RAST [24]; 275 genes were shared between RAST [24] and KAAS [26] (Figure S1). These large overlaps found between sources indicated good annotation quality. Genes found in all sources or two of the sources were considered to have the high reliability. Regarding to the transport gene annotation, approximately 116 new transport genes in the genome encoding for transporters or transport-related proteins were obtained from KAAS [26] and TCDB [28]. This is because the transportation mechanisms in iAK692 [23] were only diffusion reactions. Thus, in this reconstruction, ABC transport reaction and symport or antiport reactions were addressed based on annotation-based inference of transporter function to represent the transport machinery of A. platensis C1. Subsequently, the GPR of all candidate genes were then manually curated based upon various information such as physiological evidence in literature, gene expression [14], and biochemical databases. Importantly, the reactions involved in glycogen biosynthesis and degradation pathways were elaborated.
The reactions were balanced for charge and mass to prevent infeasible cycles. However, there were still mass- and charge-unbalanced reactions because either the associated metabolites contained an unspecified metabolite, R groups, or the correct reaction mechanism was unknown. During the curation, a metabolic gap was identified and filled through repeated cell growth simulations using FBA [22] until a positive flux on the biomass reaction was observed. These processes led to the modification of genes, reactions, and metabolites in iAK692 [23] and addition of new metabolic genes and their associated reactions in the updated model. For genes, 60 (6%) genes were removed, 268 (28%) genes were added, and 620 (66%) were refined. For reactions, 202 (15%) reactions were removed, 423 (33%) were added, and 673 (52%) were refined. For metabolites, 140 (12%) metabolites were removed, 297 (26%) were added, and 697 (62%) were refined (see Supplementary File S2 for details). Obviously, significant improvements in annotation resulted from not only re-annotation information collected from RAST [24] and KAAS [26] but also a manual effort to assess the reliability of such annotation. This is a crucial prior step to address the careful revision of the first genome-scale network reconstruction and derived constraint-based model of A. platensis C1 published in 2012 [23].

3.2. Characteristics of iAK888 and Comparison

iAK888 contains 1096 metabolic reactions, 994 metabolites, and 888 genes-representing 15% of total protein coding genes in the genome [11]. Of all reactions, 751 (68.5%) were gene associated enzymatic reactions whereas non-gene associated enzymatic reactions, transport reactions and exchange reactions were 66 (6%), 182 (16.6%) and 97 (8.9%), respectively (Table 2). The reactions revealed 9 major subsystems (Figure 1A) including 56 metabolic pathways, as defined by KEGG [29]. Vitamins and cofactors metabolism and transport represented the largest portions of the network. These likely represented A. platensis physiology, an excellent source of vitamins [9] and reflected the fact that approx. 6% of A. platensis C1 genome encoded for transporters [11]. The reactions distributed over six cellular compartments including carboxysome, thylakoid lumen, thylakoid membrane, cytoplasmic membrane, cytoplasm and periplasm, with the majority of reactions localized to the cytosol (Figure 1B). This observation agreed well with the known life cycle of A. platensis [9]. Figure 1C showed the non-gene associated and gene associated reaction involved in each pathway. Notably, these non-gene associated reactions were required to complete the metabolic network of A. platensis C1 and were also observed in other GEMs [54,55]. Besides, the metabolites localized in different compartments of the fully compartmentalized model are considered as distinct metabolites. Therefore, without considering subcellular sites, the model accounted for 796 unique metabolites. Additionally, the quality of model reconstruction was assessed using the confidence scores associated to each reaction (Figure S2). The overall confidence score was 3.38. Almost 89% of the internal reactions (936) have been either very well or well-studied where extensive physiological and sequence evidences are available, while 11% were primarily based on the genome annotation and modeling hypotheses. The new metabolic network reconstruction for iAK888 is provided in a spreadsheet format (Supplementary File S3) that includes curation notes and references.
The properties of iAK888 were compared with the properties of two published GEM of A. platensis NIE-39 [55] and the first GEM of A. platensis C1 [23]. The iAK888 appeared to contain the largest number of genes, reactions, metabolites, and sub-cellular compartments (Table 2). It was evidently clear that the model reported in this research was the largest in terms of gene coverage. A comparison between iAK888 and iAK692 [23] specifically showed that iAK888 represented an increase in number of genes, reactions, and metabolites over iAK692 [23], by 196, 221, and 157, respectively (Figure 2A). Of the increased genes, 75 (38%) genes were the updated metabolic genes whereas 121 (62%) genes were the additional transport genes. The reactions associated to these genes covered a wide array of key metabolic functions mainly relevant to carbohydrate metabolism, lipid metabolism, vitamins and cofactors metabolism, and transports (Figure 2B). Furthermore, this effort was made to reconstruct some of the pathways which were either incomplete or not considered in the previous reconstruction such as tricarboxylic acid cycle (TCA) cycle, photosynthesis and oxidative phosphorylation, carbon concentrating mechanism (CCM), fatty acid biosynthesis, glycogen metabolism, polyhydroxyalkanoates biosynthesis, and hydrogen biosynthesis (Figure 2C). The incomplete TCA cycle in iAK692 [23] was improved based on the latest evidence reported in cyanobacteria [31,56]. Subsequently, the description of photosynthesis and oxidative phosphorylation was significantly improved according to a model organism, photosynthetic Synechocystis sp. PCC 6803 [35]. These included the photosynthetic linear electron flow (LEF) pathway [57], including photosystem I and II, alternate electron flow (AEF) pathways [58], and photorespiration [59]. In addition, the molecular components involved in CCM of A. platensis C1 were annotated and incorporated for a more precise understanding of the primary carbon metabolic route. There are 18 genes/proteins associated to the CCM in iAK888. Finally, reactions associated with polyhydroxyalkanoates and hydrogen biosynthesis were formulated to complement the physiological ability of A. platensis C1. In summary, iAK888 was considered to be the most comprehensive A. platensis model to date.

3.3. Validation of iAK888

For the growth verification, results showed that the model accurately predicted the growth rates with the error less than 5% in all culture conditions (Table 3). Moreover, the model generated oxygen under autotrophic and mixotrophic growth conditions. The released oxygen content under autotroph was higher than mixotroph. On the other hand, the model consumed oxygen and produced CO2 under heterotrophic simulations. These results suggested that iAK888 was able to represent the basic behavior of A. platensis C1. The models in SBML format for all four growth conditions are provided in Supplementary File S4–7. Besides, flux distributions of these three growth conditions are presented in Supplementary File S8.
Furthermore, an effort was made to investigate the total carbohydrate production flux under NO3 depletion. The simulation was performed to imitate the experimental conditions [49] with the following parameters: HCO3 uptake rate, 0.2 mmol/gDCW/h; photon uptake rate, 100 μmol photons/m2/s; no growth and NO3 uptake rate. The objective function was set to maximize the total carbohydrate production flux. Result showed that the in silico total carbohydrate production flux (0.0868 mmol/gDCW/h) was consistent with the experimental production (0.081 mmol/gDCW/h) [49]. The models in SBML format and flux distributions can be found in Supplementary File S9 and S10, respectively. These results suggested that iAK888 could predict the growth rates and carbohydrate production of A. platensis C1 reasonably well.

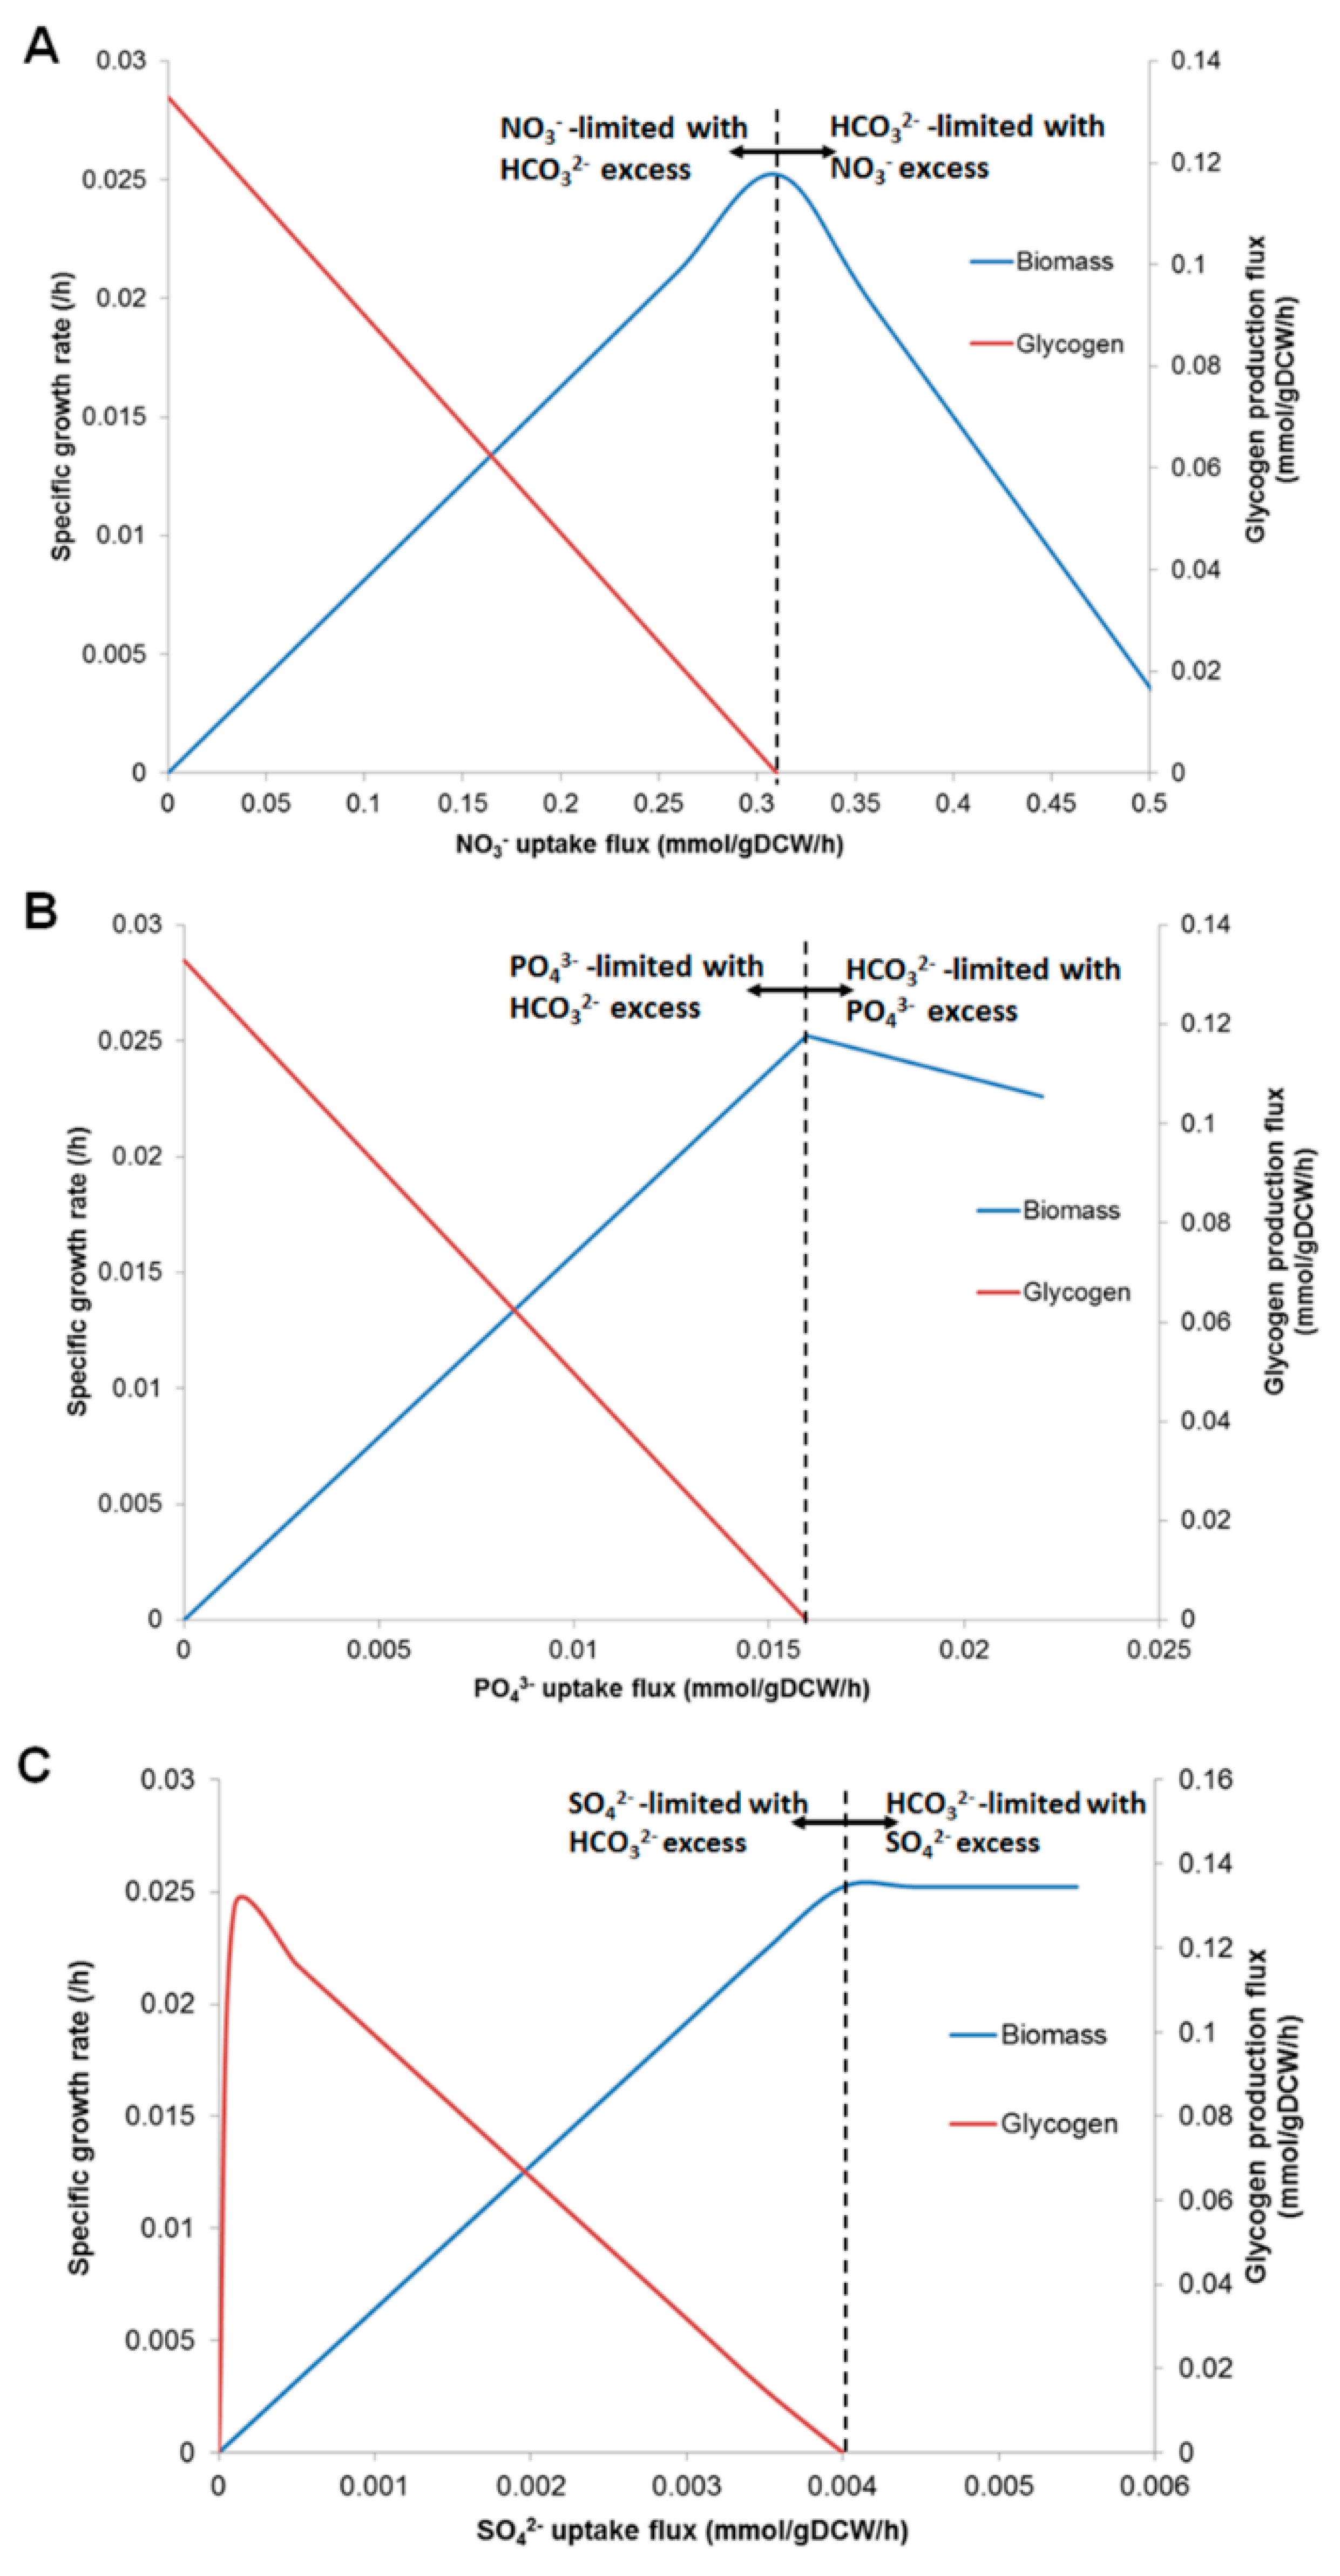
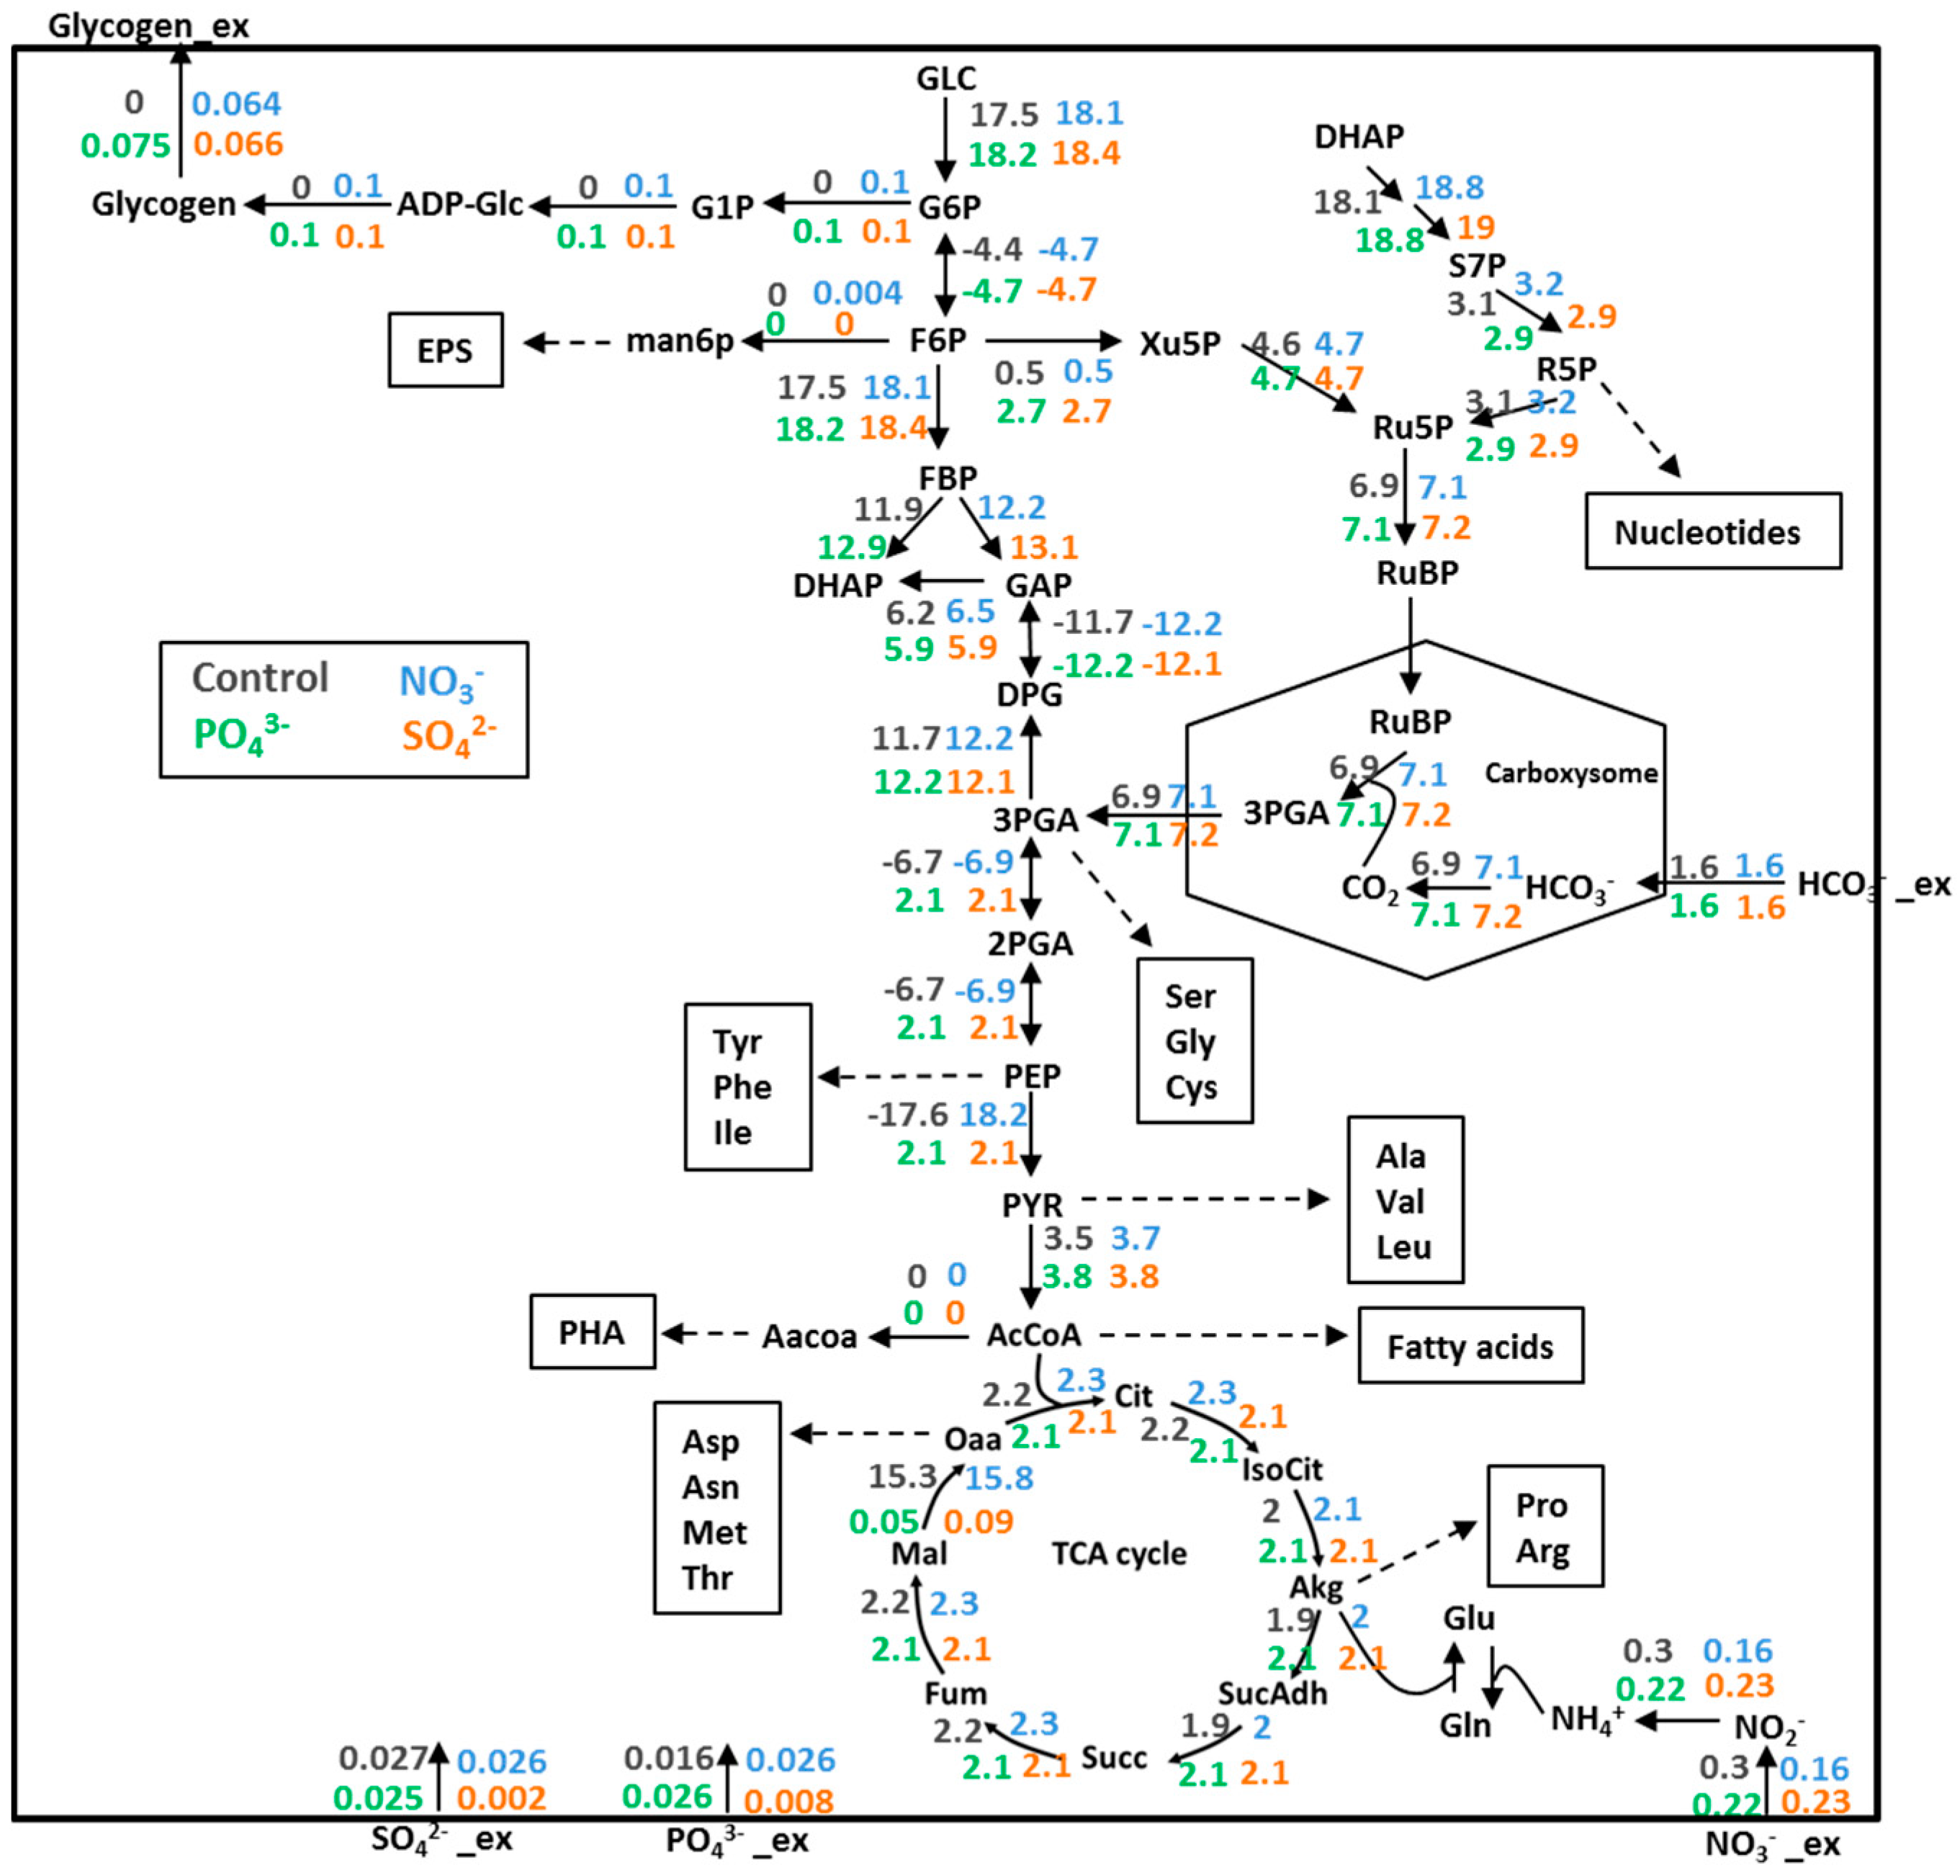
3.4. Prediction of Glycogen Overproduction Using iAK888

Herein, the impacts of nutrient starvation on growth and glycogen production were simulated to predict cultivation strategies for enhancing glycogen content in A. platensis C1. iAK888 was simulated by varying the uptake flux of NO3, PO43−, and SO42− under autotrophic conditions with the following parameters: HCO3 uptake flux, 1.6 mmol/gDCW/h; photon uptake flux, 100 μmol photons/m2/s. In overall, limitation of NO3, PO43−, and SO42− uptakes and the excess HCO3 resulted in the negative effect on growth, while revealed positive effect on glycogen production (Figure 3A–C). Obviously, the specific growth rate rapidly decreased when limited levels of NO3, PO43−, and SO42− were introduced. Apparently, iAK888 expressed ability to rapidly accumulate glycogen when the uptake flux of each nutrient was lower than the optimal uptake flux for biomass production. On the other hand, when the uptake flux of each nutrient was higher than the optimal uptake flux for biomass production, the glycogen production flux exhibited no flux values.
The internal metabolic fluxes throughout the central metabolism were determined using geometric FBA [52]. HCO3 uptake rate was constrained to 1.6 mmol/gDCW/h whereas, NO3, PO43−, and SO42− were constrained to half of the optimum uptake rate for growth. Flux map (Figure 4) showed that all reactions in the central metabolism were activated to provide maximum biomass. The excess carbon was secreted as glycogen under NO3, PO43−, and SO42−-insufficient growth. Fluxes comparison under different perturbations provided information on how central metabolic reactions respond to the altered growth condition, although each perturbation resulted in the similar overall phenotype. They exhibited different flux patterns. All fluxes in the central metabolisms were higher under NO3-limited growth than the normal growth considered as NO3-sufficient condition. All fluxes in the TCA cycle and some reactions of the glycolysis and non-oxidative pentose phosphate pathway were lower under PO43−, and SO42−-limited growth than the normal growth. A consequence of increased fluxes and metabolites in the central carbon pathway under NO3 starvation led to the enhanced synthesis of glycogen in iAK888. This showed some agreements with recent metabolomic observations during the glycogen production phase in A. platensis NIE-39 cultured under nitrate-free (Society of Toxicology) SOT medium [60]. The time-course analysis of the primary metabolites content revealed a transient increase of glucose-1-phosphate, glucose-6-phosphate, fructose-6-phosphate, 2-ketoglutarate, succinate, and malate. Besides, simulation of each nutrient limitation with excess carbon showed secretion of pyruvate, acetate, and lactate (see Supplementary File S11–13). In agreement with the experimental results, it was found that A. platensis NIES-39 cultured under nitrate-limited condition produced pyruvate, acetate, and lactate in the culture medium [55]. Regarding to PO43−, and SO42− starvation, the simulation results showed that the changes in flux patterns of both nutrients were very similar. Obviously, limitation of these nutrients greatly affected the fluxes through phosphoglycerate mutase, enolase, pyruvate kinase, and malate dehydrogenase reactions in comparison to the normal growth and NO3-limited conditions. These much lower fluxes occurred at the branch points where the precursor metabolites were drained for the synthesis of amino acid. However, future inclusion of such experimental data could be expected to verify the prediction of flux distribution under each nutrient limitation.

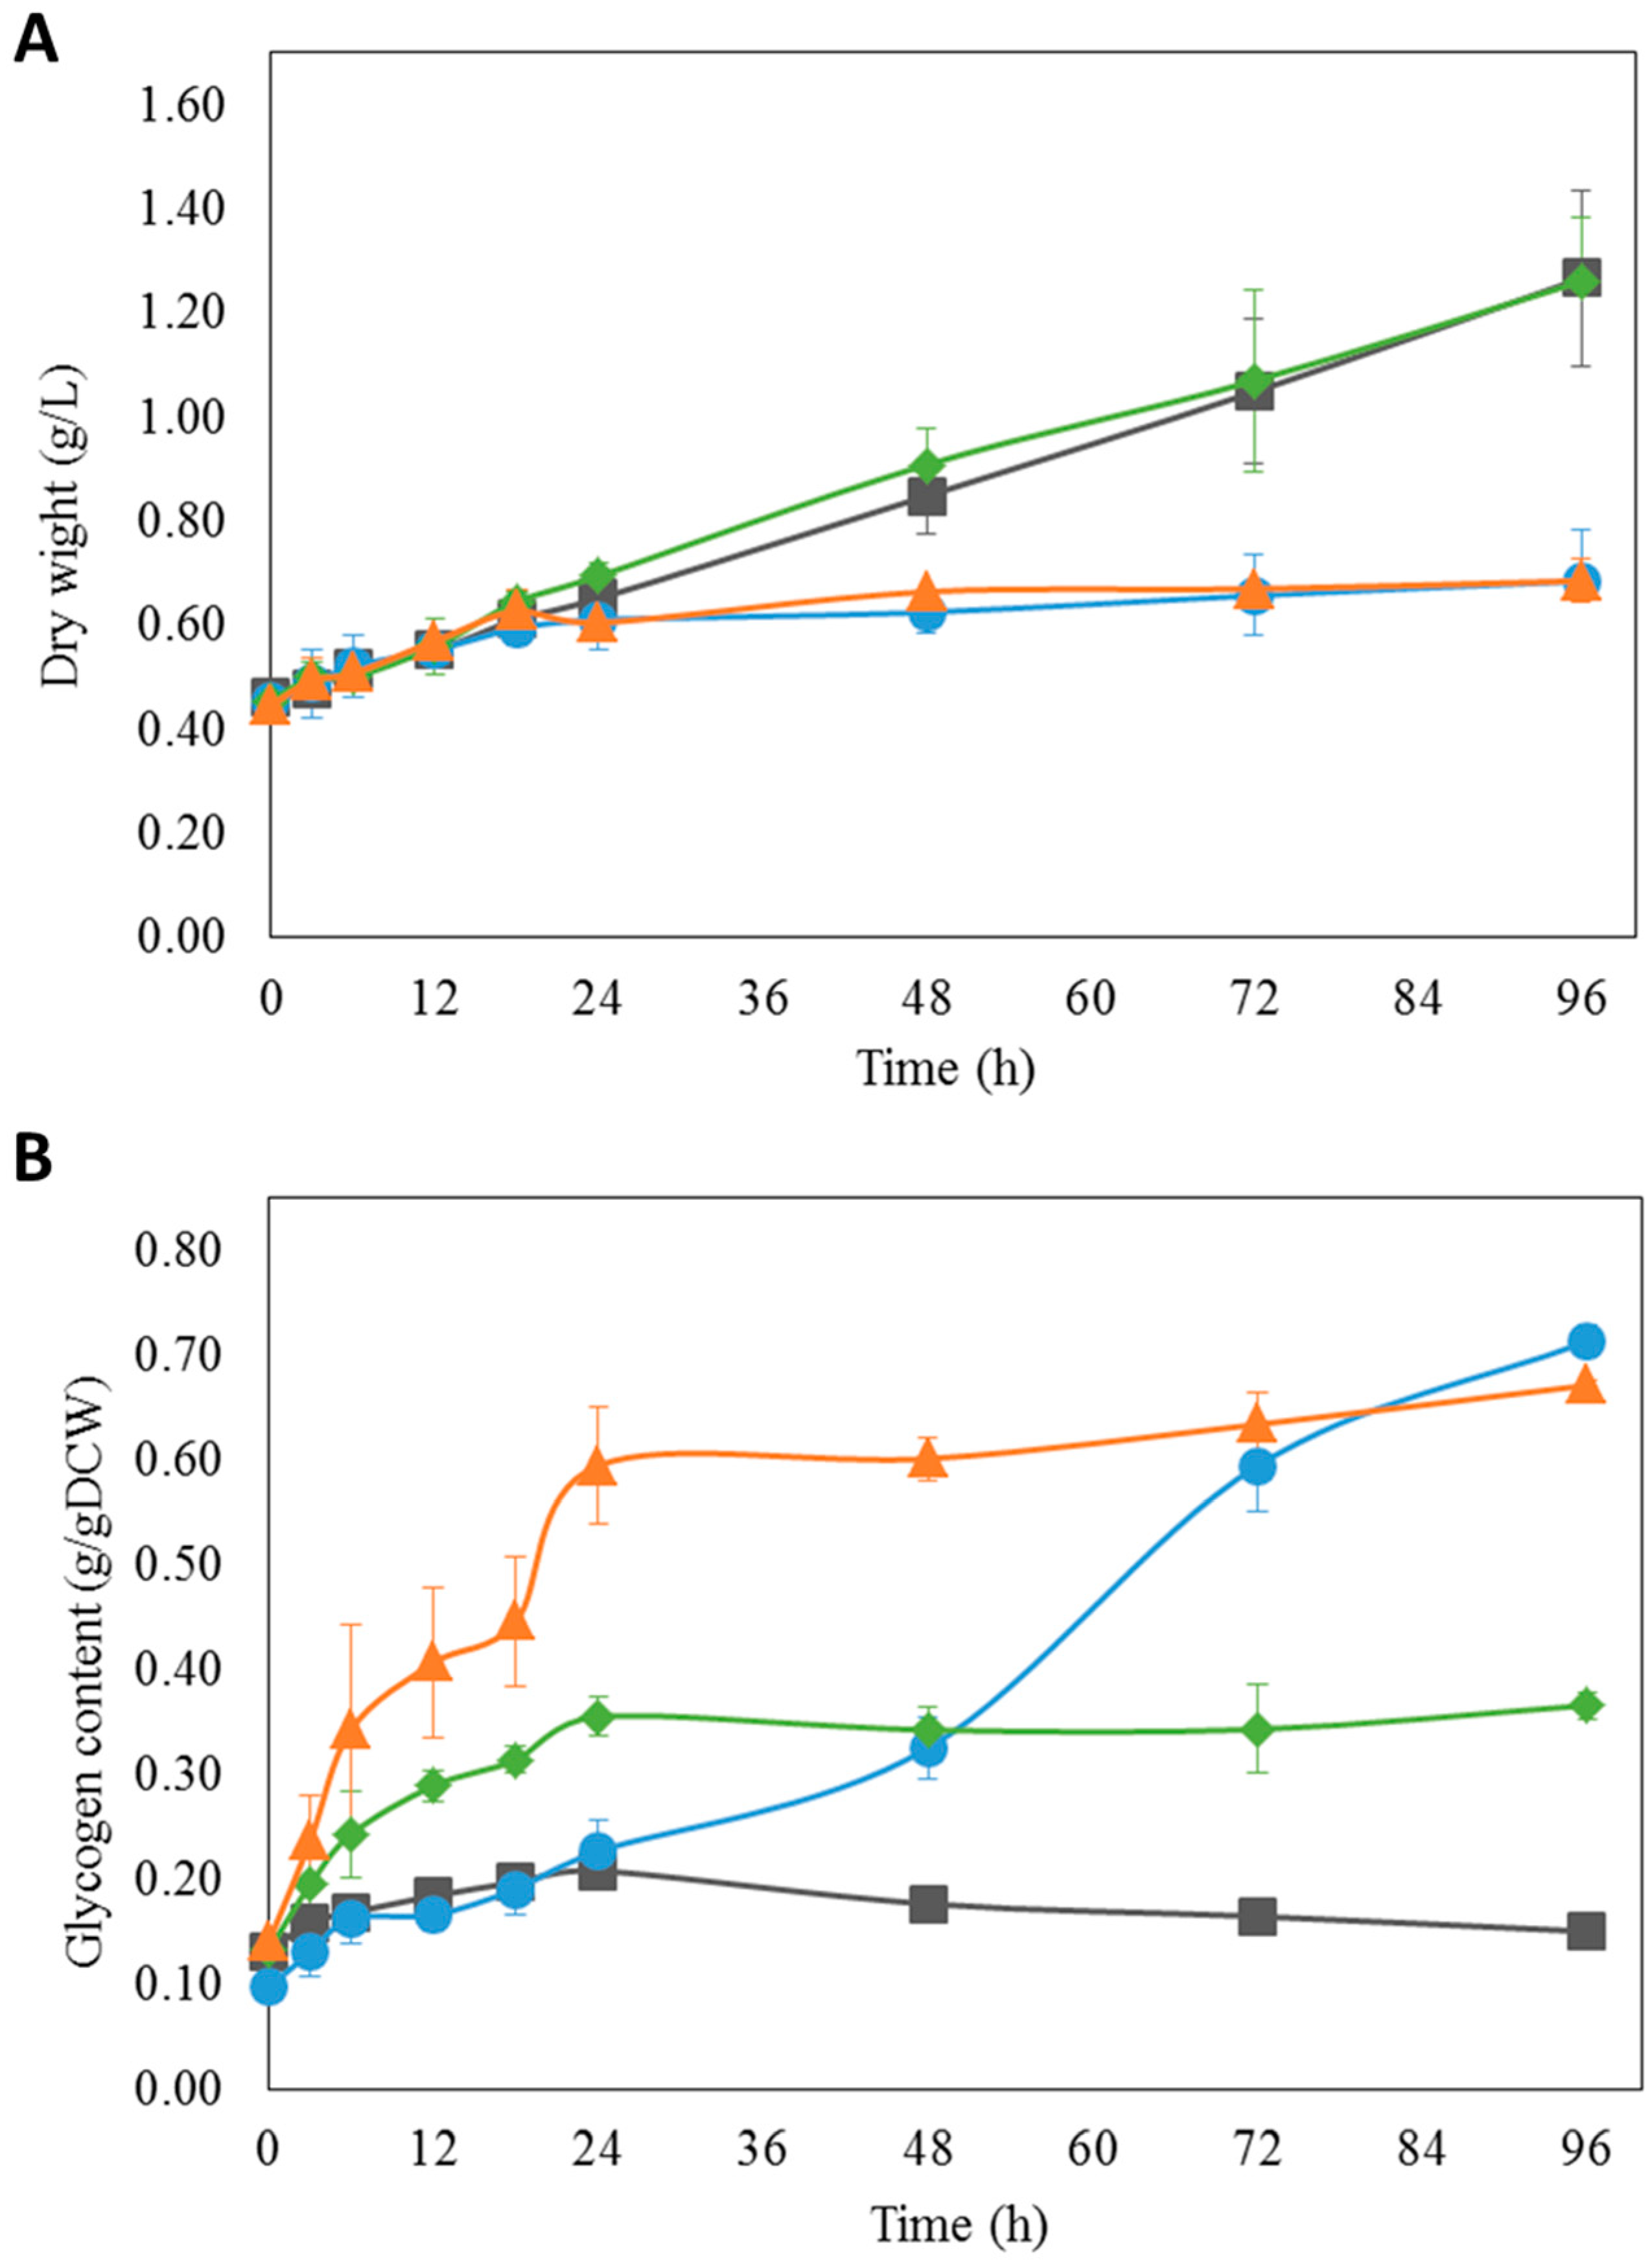
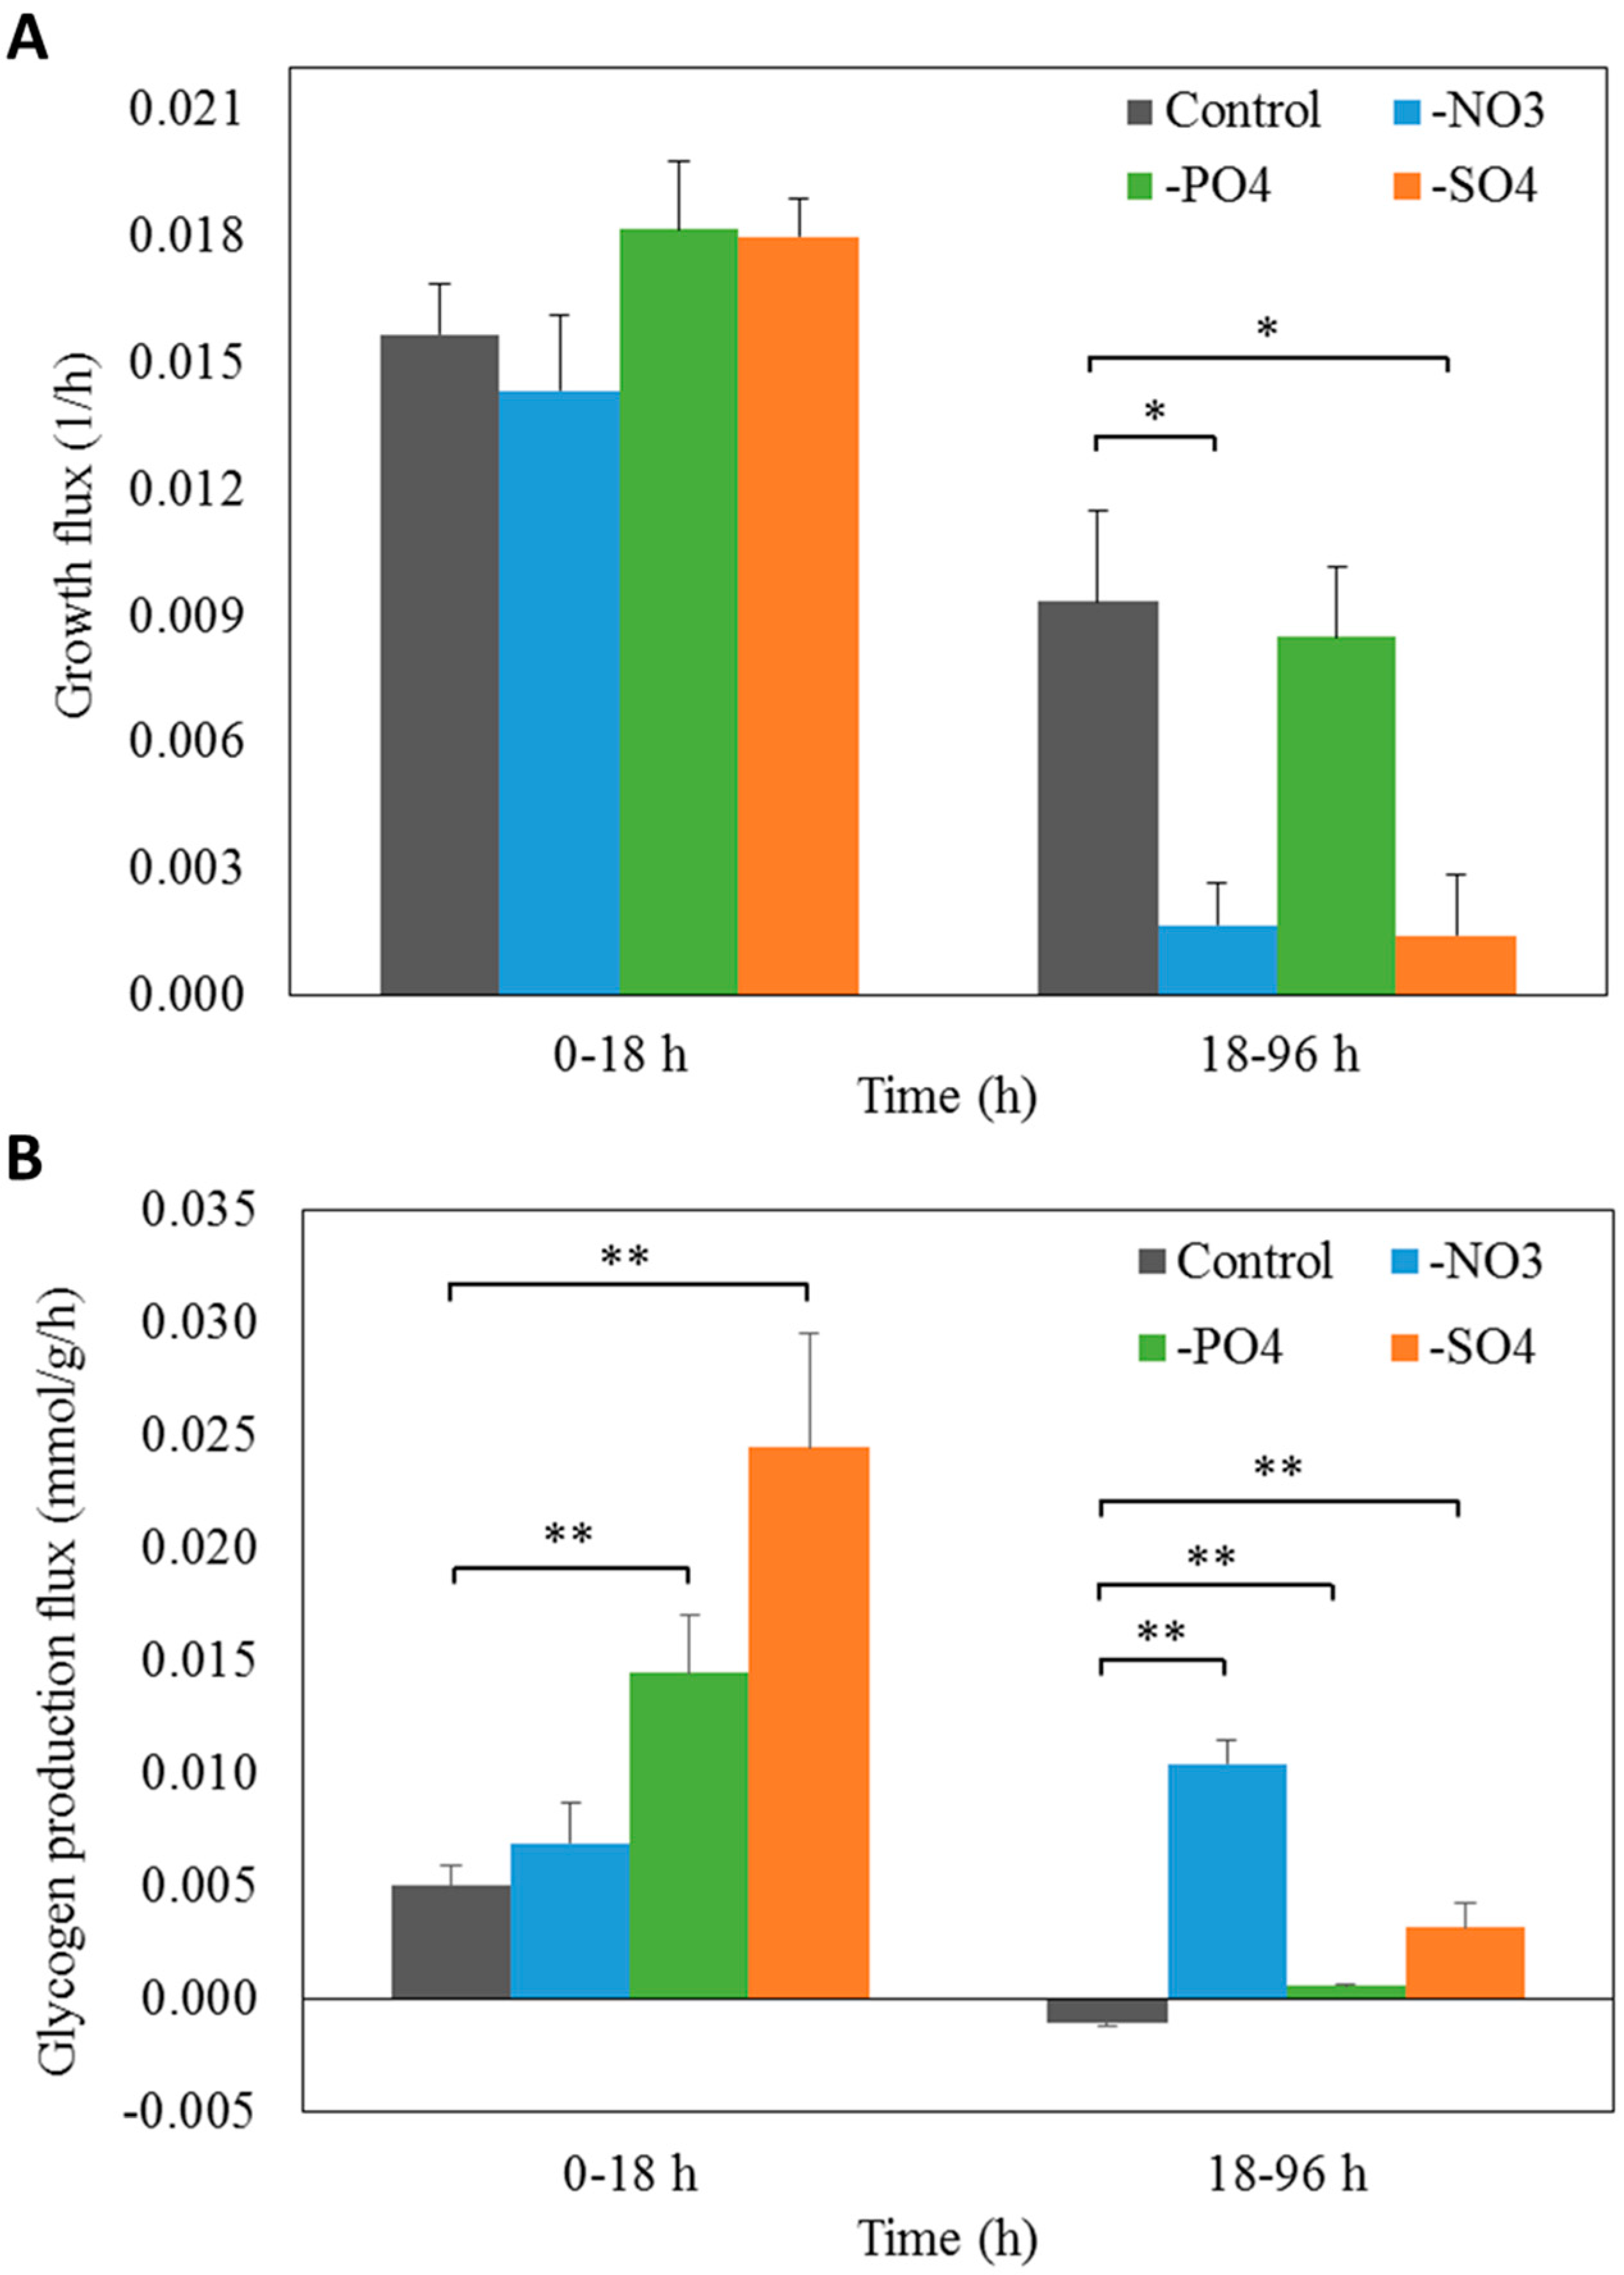
3.5. Experimental Validation of iAK888 Prediction for Glycogen Overproduction

Since iAK888 suggested that NO3, PO43−, and SO42− starvation enhance glycogen content in A. platensis C1, -growth rate and glycogen production under NO3, PO43−, and SO42− depletion was experimentally determined. A. platensis C1 was cultured with standard Zarrouk’s medium [50] and cells were transferred to nitrogen, phosphorus, or sulfur depleted Zarrouk’s medium [50]. Changes in cell growth and glycogen content of A. platensis C1 were investigated for 96 h. Regarding to growth in term of dry weight (Figure 5A) and growth rate (Figure 6A), the results showed no significant differences between control and experiments in the first 18 h. However, further incubation for 96 h, the dry weight and the growth rate under NO3 and SO42− starvation decreased significantly (p < 0.05) whereas the dry weight under PO43− starvation gradually increased, even though the growth rate was lower than that of the control. An increase in growth observed during the first 18 h might be due to the results from availability of endogenous nitrogen, phosphorus, and sulfur. In terms of glycogen content (Figure 5B) and glycogen production flux (Figure 6B), cells subjected to PO43− and SO42− depletion showed a significant increase in glycogen content and production flux (p < 0.01) in the first 18 h. In contrast, the significant increase in glycogen content and production flux were observed in the NO3-free medium after 24 h (p < 0.01).
Compared to the results predicted by FBA simulations, glycogen flux was considered to be consistent with those obtained by experiments, suggesting that NO3, PO43−, and SO42− depletion induced an increase of glycogen production in A. platensis C1. Notably, only the growth rate under PO43− starvation between the experimental and iAK888-simulated fluxes had no significant difference. It should be noted that despite FBA [22] being widely used approach for simulating a large-scale cellular metabolism under a certain condition, this method could only be used to predict the steady state snapshot of flux distribution. Thus, using the FBA approach [22] was unable to directly analyze the transient states of cell metabolism such as a concentration of metabolite and dynamic change in the flux with time. These reasons might cause the discrepancy between the FBA simulation and the experiment.

4. Conclusions

In this study, an improved genome-scale model for A. platensis C1, iAK888, was performed. The iAK888 model displayed a highly detailed reconstruction capturing the fundamental knowledge and the significantly biotechnological capabilities as compared to the previous model, iAK692. The iAK888 model was demonstrated to be a suitable model for prediction of growth and carbohydrate production flux of A. platensis C1 under various conditions. Moreover, it was demonstrated that the iAK888 model could suggest rational cultivation strategies for overproduction of glycogen in A. platensis C1. In the future, this new model shall be a versatile platform for further studies towards glycogen-enriched A. platensis C1 as an alternative feedstock for bioethanol production.

Supplementary Materials

The following are available online at https://www.mdpi.com/2218-1989/8/4/84/s1. Figure S1: The Venn diagrams illustrate the overlapped genes among RAST [24], KAAS [26], and iAK692 [23]. Figure S2: Heat map of the confidence score of each pathway in iAK888. The columns represent the level of confidence score (ranging from 1 to 4) and the rows represent the metabolic pathway. The various colors correspond to the percentage of pathway reactions that have the corresponding confidence score (orange = 100%, blue = 0%). Based on the confidence score system [37], 4 represents physiological and genetic evidence, 3 represents direct and indirect evidence for gene function, 2 represents indirect evidence from physiological data or only sequence-based evidence, and 1 represents modeling evidence. Supplementary File S1: Biomass composition of A. platensis C1. Supplementary File S2: Genome annotation. Supplementary File S3: Detailed GPR information of model iAK888. Supplementary File S4: SBML of autotrophic growth photon uptake 100 μmol photons/m2/s. Supplementary File S5: SBML of autotrophic growth photon uptake 200 μmol photons/m2/s. Supplementary File S6: SBML of heterotrophic growth. Supplementary File S7: SBML of mixotrophic growth. Supplementary File S8: Flux distribution of autotrophic, heterotrophic, and mixotrophic growth. Supplementary File S9: SBML of carbohydrate production under NO3 depletion. Supplementary File S10: Flux distribution of effect NO3 depletion on carbohydrate production. Supplementary File S11: Flux distribution of effect NO3 depletion on growth and glycogen. Supplementary File S12: Flux distribution of effect PO43− depletion on growth and glycogen. Supplementary File S13: Flux distribution of effect SO42− depletion on growth and glycogen.

Author Contributions

Reconstructed the genome-scale metabolic model, A.K.; performed the analyses, A.K.; wrote the manuscript, A.K.; conducted experiments for model validation, S.D. and K.C.; conceived and designed the overall study, P.P. and A.M.; revised the manuscript, P.P. and A.M.; approved the final manuscript, A.K., S.D., K.C., S.C., P.P. and A.M.

Funding

This work was supported by grants, P-11-01089, from the National Center for Genetic Engineering and Biotechnology (BIOTEC), NSTDA, Thailand and the research subsidy fund of fiscal year 2017 from King Mongkut’s University of Technology Thonburi. Moreover, the authors acknowledge the financial support provided by King Mongkut’s University of Technology Thonburi through the KMUTT 55th Anniversary Commemorative Fund.

Acknowledgments

The authors would like to specially thank the Algal Biotechnology Laboratory and the Biomedical Engineering Laboratory at KMUTT for allowing us to use their experimental facilities.

Conflicts of Interest

The authors declare no conflicts of interest.

References

  1. Markou, G.; Angelidaki, I.; Georgakakis, D. Microalgal carbohydrates: An overview of the factors influencing carbohydrates production, and of main bioconversion technologies for production of biofuels. Appl. Microbiol. Biotechnol. 2012, 96, 631–645. [Google Scholar] [CrossRef] [PubMed]
  2. Ho, S.-H.; Huang, S.-W.; Chen, C.-Y.; Hasunuma, T.; Chang, J.-S. Bioethanol production using carbohydrate-rich microalgae biomass as feedstock. Bioresour. Technol. 2013, 135, 191–198. [Google Scholar] [CrossRef] [PubMed]
  3. Aikawa, S.; Joseph, A.; Yamad, R.; Izumi, Y.; Yamagishi, T.; Matsuda, F.; Kawai, H.; Chang, J.-S.; Hasunuma, T.; Kondo, A. Direct conversion of Spirulina to ethanol without pretreatment or enzymatic hydrolysis processes. Energy Environ. Sci. 2013, 6, 1844–1849. [Google Scholar] [CrossRef]
  4. Möllers, K.B.; Cannella, D.; Jørgensen, H.; Frigaard, N.-U. Cyanobacterial biomass as carbohydrate and nutrient feedstock for bioethanol production by yeast fermentation. Biotechnol. Biofuels 2014, 7, 64. [Google Scholar] [CrossRef] [PubMed] [Green Version]
  5. Gao, Z.X.; Zhao, H.; Li, Z.M.; Tan, X.M.; Lu, X. F Photosynthetic production of ethanol from carbon dioxide in genetically engineered cyanobacteria. Energy Environ. Sci. 2012, 5, 9857–9865. [Google Scholar] [CrossRef]
  6. Wijffels, R.H.; Kruse, O.; Hellingwerf, K.J. Potential of industrial biotechnology with cyanobacteria and eukaryotic microalgae. Curr. Opin. Biotechnol. 2013, 24, 405–413. [Google Scholar] [CrossRef] [PubMed]
  7. Taton, A.; Unglaub, F.; Wright, N.E.; Zeng, W.Y.; Paz-Yepes, J.; Brahamsha, B.; Palenik, B.; Peterson, T.C.; Haerizadeh, F.; Golden, S.S.; et al. Broad-host-range vector system for synthetic biology and biotechnology in cyanobacteria. Nucleic Acids Res. 2014, 42, e136. [Google Scholar] [CrossRef] [PubMed]
  8. Aikawa, S.; Izumi, Y.; Matsuda, F.; Hasunuma, T.; Chang, J.S.; Kondo, A. Synergistic Enhancement of Glycogen Production in Arthrospira platensis by Optimization of Light Intensity and Nitrate Supply. Bioresour. Technol. 2012, 108, 211–215. [Google Scholar] [CrossRef] [PubMed]
  9. Vonshak, A. Spirulina platensis (Arthrospira): Physiology, Cell Biology and Biotechnology. J. Appl. Psychol. 1997, 9, 295–296. [Google Scholar]
  10. Markou, G.; Chatzipavlidis, I.; Georgakakis, D. Carbohydrates production and bio-flocculation characteristics in cultures of Arthrospira Spirulina platensis: Improvements through phosphorus limitation process. BioEnergy Res. 2012, 5, 915–925. [Google Scholar] [CrossRef]
  11. Cheevadhanarak, S.; Paithoonrangsarid, K.; Prommeenate, P.; Kaewngam, W.; Musigkain, A.; Tragoonrung, S.; Tabata, S.; Kaneko, T.; Chaijaruwanich, J.; Sangsrakru, D.; et al. Draft Genome Sequence of Arthrospira platensis C1 (PCC 9438). Stand. Genom. Sci. 2012, 6, 43–53. [Google Scholar] [CrossRef] [PubMed]
  12. Jeamton, W.; Dulsawat, S.; Tanticharoen, M.; Vonshak, A.; Cheevadhanarak, S. Overcoming Intrinsic Restriction Enzyme Barriers Enhances Transformation Efficiency in Arthrospira platensis C1. Plant Cell Physiol. 2017, 58, 822–830. [Google Scholar] [CrossRef] [PubMed]
  13. Jeamton, W.; Mungpakdee, S.; Sirijuntarut, M.; Prommeenate, P.; Cheevadhanarak, S.; Tanticharoen, M.; Apiradee Hongsthong, A. A combined stress response analysis of Spirulina platensis in terms of global differentially expressed proteins, and mRNA levels and stability of fatty acid biosynthesis genes. FEMS Microbiol. Lett. 2008, 281, 121–131. [Google Scholar] [CrossRef] [PubMed]
  14. Panyakampol, J.; Cheevadhanarak, S.; Sutheeworapong, S.; Chaijaruwanich, J.; Senachak, J.; Siangdung, W.; Jeamton, W.; Tanticharoen, M.; Paithoonrangsarid, K. Physiological and transcriptional responses to high temperature in Arthrospira (Spirulina) platensis C1. Plant Cell Physiol. 2014, 56, 481–496. [Google Scholar] [CrossRef] [PubMed]
  15. Hongsthong, A.; Sirijuntarut, M.; Prommeenate, P.; Lertladaluck, K.; Porkaew, K.; Cheevadhanarak, S.; Tanticharoen, M. Proteome analysis at the subcellular level of the cyanobacterium Spirulina platensis in response to low-temperature stress conditions. FEMS Microbiol. Lett. 2008, 288, 92–101. [Google Scholar] [CrossRef] [PubMed]
  16. Hongsthong, A.; Sirijuntarut, M.; Yutthanasirikul, R.; Senachak, J.; Kurdrid, P.; Cheevadhanarak, S.; Tanticharoen, M. Subcellular proteomic characterization of the high-temperature stress response of the cyanobacterium Spirulina platensis. Proteome Sci. 2009, 7, 33. [Google Scholar] [CrossRef] [PubMed]
  17. Kurdrid, P.; Senachak, J.; Sirijuntarut, M.; Yutthanasirikul, R.; Phuengcharoen, P.; Jeamton, W.; Roytrakul, S.; Cheevadhanarak, S.; Hongsthong, A. Comparative analysis of the Spirulina platensis subcellular proteome in response to low- and high-temperature stresses: Uncovering cross-talk of signaling components. Proteome Sci. 2011, 9, 39. [Google Scholar] [CrossRef] [PubMed]
  18. Senachak, J.; Cheevadhanarak, S.; Hongsthong, A. SpirPro: A Spirulina proteome database and web-based tools for the analysis of protein-protein interactions at the metabolic level in Spirulina (Arthrospira) platensis C1. BMC Bioinform. 2015, 16, 233. [Google Scholar] [CrossRef] [PubMed]
  19. Likic, V.A.; McConville, M.J.; Lithgow, T.; Bacic, A. Systems Biology: The Next Frontier for Bioinformatics. Adv. Bioinform. 2010, 2010, 1–10. [Google Scholar] [CrossRef] [PubMed] [Green Version]
  20. Monk, J.; Nogales, J.; Palsson, B.O. Optimizing genome-scale network reconstructions. Nat. Biotechnol. 2014, 32, 447–452. [Google Scholar] [CrossRef] [PubMed] [Green Version]
  21. Kim, W.J.; Kim, H.U.; Lee, S.Y. Current State and Applications of Microbial Genome-scale Metabolic Models. Curr. Opin. Syst. Biol. 2017, 2, 10–18. [Google Scholar] [CrossRef]
  22. Jeffrey, D.O.; Thiele, I.; Palsson, B.Ø. What Is Flux Balance Analysis? Nat. Biotechnol. 2010, 28, 245–248. [Google Scholar]
  23. Klanchui, A.; Khannapho, C.; Phodee, A.; Cheevadhanarak, S.; Meechai, A. iAK692: A genome-scale metabolic model of Spirulina platensis C1. BMC Syst. Boil. 2012, 6, 71. [Google Scholar] [CrossRef] [PubMed]
  24. Aziz, R.K.; Bartels, D.; Best, A.A.; DeJongh, M.; Disz, T.; Edwards, R.A.; Formsma, K.; Gerdes, S.; Glass, E.M.; Kubal, M.; et al. The RAST Server: Rapid annotations using subsystems technology. BMC Genom. 2008, 9, 75. [Google Scholar] [CrossRef] [PubMed]
  25. Overbeek, R.; Olson, R.; Pusch, G.D.; Olsen, G.J.; Davis, J.J.; Disz, T.; Edwards, R.A.; Gerdes, S.; Parrello, B.; Shukla, M.; et al. The SEED and the Rapid Annotation of microbial genomes using Subsystems Technology (RAST). Nucleic Acids Res. 2014, 42, D206–D214. [Google Scholar] [CrossRef] [PubMed]
  26. Moriya, Y.; Itoh, M.; Okuda, S.; Yoshizawa, A.C.; Kanehisa, M. KAAS: An Automatic Genome Annotation and Pathway Reconstruction Server. Nucleic Acids Res. 2007, 35, W182–W185. [Google Scholar] [CrossRef] [PubMed]
  27. McGinnis, S.; Madden, T.L. Blast: At the Core of a Powerful and Diverse Set of Sequence Analysis Tools. Nucleic Acids Res. 2004, 32, W20–W25. [Google Scholar] [CrossRef] [PubMed]
  28. Saier, M.H., Jr.; Reddy, V.S.; Tsu, B.V.; Ahmed, M.S.; Li, C.; Moreno-Hagelsieb, G. The Transporter Classification Database (TCDB): Recent Advances. Nucleic Acids Res. 2016, 44, D372–D379. [Google Scholar] [CrossRef] [PubMed]
  29. Kanehisa, M.; Sato, Y.; Kawashima, M.; Furumichi, M.; Tanabe, M. KEGG as a reference resource for gene and protein annotation. Nucleic Acids Res. 2016, 44, D457–D462. [Google Scholar] [CrossRef] [PubMed]
  30. Caspi, R.; Billington, R.; Ferrer, L.; Foerster, H.; Fulcher, C.A.; Keseler, I.M.; Kothari, A.; Krummenacker, M.; Latendresse, M.; Mueller, L.A.; et al. The MetaCyc database of metabolic pathways and enzymes and the BioCyc collection of pathway/genome databases. Nucleic Acids Res. 2016, 44, D471–D480. [Google Scholar] [CrossRef] [PubMed]
  31. Steinhauser, D.; Fernie, A.R.; Araujo, W.L. Unusual cyanobacterial TCA cycles: Not broken just different. Trends Plant Sci. 2012, 17, 503–509. [Google Scholar] [CrossRef] [PubMed]
  32. Klanchui, A.; Cheevadhanarak, S.; Prommeenate, P.; Meechai, A. Exploring Components of the CO2-Concentrating Mechanism in Alkaliphilic Cyanobacteria through Genome-Based Analysis. Comput. Struct. Biotechnol. 2017, 15, 340–350. [Google Scholar] [CrossRef] [PubMed]
  33. Satora, P.; Barwińska-Sendra, A.; Duda-Chodak, A.; Wajda, Ł. Strain-dependent production of selected bioactive compounds by Cyanobacteria belonging to the Arthrospira genus. J. Appl. Microbiol. 2015, 119, 736–743. [Google Scholar] [CrossRef] [PubMed]
  34. Badri, H.; Monsieurs, P.; Coninx, I.; Nauts, R.; Wattiez, R.; Leys, N. Temporal Gene Expression of the Cyanobacterium Arthrospira in Response to Gamma Rays. PLoS ONE 2015, 10, e0135565. [Google Scholar] [CrossRef] [PubMed]
  35. Knoop, H.; Grundel, M.; Zilliges, Y.; Lehmann, R.; Hoffmann, S.; Lockau, W.; Steuer, R. Flux balance analysis of cyanobacterial metabolism: The metabolic network of Synechocystis sp. PCC 6803. PLoS Comput. Biol. 2013, 9, e1003081. [Google Scholar] [CrossRef] [PubMed]
  36. Orth, J.D.; Conrad, T.M.; Na, J.; Lerman, J.A.; Nam, H.; Feist, A.M.; Palsson, B.O. A comprehensive genome-scale reconstruction of Escherichia coli metabolism—2011. Mol. Syst Biol. 2011, 7, 535. [Google Scholar] [CrossRef] [PubMed]
  37. Thiele, I.; Palsson, B.O. A protocol for generating a high-quality genome-scale metabolic reconstruction. Nat. Protoc. 2010, 5, 93–121. [Google Scholar] [CrossRef] [PubMed] [Green Version]
  38. Kim, S.; Thiessen, P.A.; Bolton, E.E.; Chen, J.; Fu, G.; Gindulyte, A.; Han, L.; He, J.; He, S.; Shoemaker, B.A.; et al. PubChem Substance and Compound databases. Nucleic Acids Res. 2016, 44, D1202–D1213. [Google Scholar] [CrossRef] [PubMed]
  39. Finn, R.D.; Bateman, A.; Clements, J.; Coggill, P.; Eberhardt, R.Y.; Eddy, S.R.; Heger, A.; Hetherington, K.; Holm, L.; Mistry, J.; et al. The Pfam protein families database. Nucleic Acids Res. 2014, 42, D222–D230. [Google Scholar] [CrossRef] [PubMed]
  40. Panyakampol, J. (King Mongkut’s University of Technology Thonburi, Bangkok, Thailand). Unpublished work. 2015.
  41. Cogne, G.; Gros, J.B.; Dussap, C.G. Identification of a metabolic network structure representative of Arthrospira (spirulina) platensis metabolism. Biotechnol. Bioeng. 2003, 84, 667–676. [Google Scholar] [CrossRef] [PubMed]
  42. Paithoonrangsarid, K. (King Mongkut’s University of Technology Thonburi, Bangkok, Thailand). Unpublished work. 1997.
  43. Abd El-Baky, H.H.; El Baz, F.K.; El-Baroty, G.S. Spirulina Species as a Source of Carotenoids and α-tocopherol and its Anticarcinoma Factors. Biotechnology 2003, 2, 222–240. [Google Scholar]
  44. Shimamatsu, H. Mass production of Spirulina, an edible microalga. Hydrobiologia 2004, 512, 39–44. [Google Scholar] [CrossRef]
  45. Ali, S.K.; Saleh, A.M. Spirulina—An Overview. Int. J. Pharm. Pharm. Sci. 2012, 4, 9–15. [Google Scholar]
  46. Ataman, M.; Hatzimanikatis, V. Heading in the right direction: Thermodynamics-based network analysis and pathway engineering. Curr. Opin. Biotechnol. 2015, 36, 176–182. [Google Scholar] [CrossRef] [PubMed]
  47. Schellenberger, J.; Que, R.; Fleming, R.M.; Thiele, I.; Orth, J.D.; Feist, A.M.; Zielinski, D.C.; Bordbar, A.; Lewis, N.E.; Rahmanian, S.; et al. Quantitative Prediction of Cellular Metabolism with Constraint-based Models: The COBRA Toolbox V2.0. Nat. Protoc. 2011, 6, 1290–1307. [Google Scholar] [CrossRef] [PubMed]
  48. Phodee, A. (King Mongkut’s University of Technology Thonburi, Bangkok, Thailand). Unpublished work. 2009.
  49. Panyakampol, J.; Cheevadhanarak, S.; Senachak, J.; Dulsawat, S.; Siangdung, W.; Tanticharoen, M.; Paithoonrangsarid, K. Different Effects of the Combined Stress of Nitrogen Depletion and High Temperature Than an Individual Stress on the Synthesis of Biochemical Compounds in Arthrospira platensis C1 (PCC 9438). J. Appl. Phycol. 2016, 28, 2177–2186. [Google Scholar] [CrossRef]
  50. Zarrouk, C. Contribution à l’étude d’une cyanophycéeInfluence de divers’ facteurs physiques et chimiques sur la croissance et la photosynthèse de Spirulina maxima. PhD Thesis, Université de Paris, Paris, France, 1996. (In French). [Google Scholar]
  51. Mahadevan, R.; Schilling, C.H. The effects of alternate optimal solutions in constraint-based genome-scale metabolic models. Metab. Eng. 2003, 5, 264–276. [Google Scholar] [CrossRef] [PubMed]
  52. Smallbone, K.; Simeonidis, E. Flux balance analysis: A geometric perspective. J. Theor. Biol. 2009, 258, 311–315. [Google Scholar] [CrossRef] [PubMed] [Green Version]
  53. Iwase, T.; Okai, C.; Kamata, Y.; Tajima, A.; Mizunoe, Y. A straightforward assay for measuring glycogen levels and RpoS. J. Microbiol. Meth. 2018, 145, 93–97. [Google Scholar] [CrossRef] [PubMed]
  54. Karp, P.D. Call for an enzyme genomics initiative. Genome Biol. 2004, 5, 401. [Google Scholar] [CrossRef] [PubMed] [Green Version]
  55. Yoshikawa, K.; Aikawa, S.; Kojima, Y.; Toya, Y.; Furusawa, C.; Kondo, A.; Shimizu, H. Construction of a Genome-Scale Metabolic Model of Arthrospira platensis NIES-39 and Metabolic Design for Cyanobacterial Bioproduction. PLoS ONE 2015, 10, e0144430. [Google Scholar] [CrossRef] [PubMed]
  56. Zhang, S.; Bryant, D.A. The tricarboxylic acid cycle in cyanobacteria. Science 2011, 334, 1551–1553. [Google Scholar] [CrossRef] [PubMed]
  57. Kramer, D.M.; Evans, J.R. The Importance of Energy Balance in Improving Photosynthetic Productivity. Plant Physiol. 2011, 155, 70–78. [Google Scholar] [CrossRef] [PubMed]
  58. Nogales, J.; Gudmundsson, S.; Knight, E.M.; Palsson, B.O.; Thiele, I. Detailing the Optimality of Photosynthesis in Cyanobacteria through Systems Biology Analysis. Proc. Natl. Acad. Sci. USA 2012, 109, 2678–2683. [Google Scholar] [CrossRef] [PubMed]
  59. Cooley, J.W.; Vermaas, W.F. Succinate Dehydrogenase and Other Respiratory Pathways in Thylakoid Membranes of Synechocystis sp. strain PCC 6803: Capacity Comparisons and Physiological Function. J. Bacteriol. 2001, 183, 4251–4258. [Google Scholar] [CrossRef] [PubMed]
  60. Hasunuma, T.; Kikuyama, F.; Matsuda, M.; Aikawa, S.; Izumi, Y.; Kondo, A. Dynamic metabolic profiling of cyanobacterial glycogen biosynthesis under conditions of nitrate depletion. J. Exp. Bot. 2013, 64, 2943–2954. [Google Scholar] [CrossRef] [PubMed] [Green Version]
Figure 1. Properties of the updated genome-scale metabolic network of A. platensis C1. Distribution of reactions in each metabolism (A), Distribution of reactions in each cellular compartment (B), Gene associated and non-gene associated reaction in each metabolic pathway (C).
Metabolites 08 00084 g001
Figure 2. Comparison between iAK888 and iAK692. Overview features of iAK888 compared to iAK692 (A). Number of reactions in each metabolism of iAK888 compared to iAK692 (B). Schematic representation of iAK888 and the example of the filled pathways compared to iAK692 (C). Zoomed out sections are pathways that were completed in iAK888. Red texts and arrows indicate missing pathways in iAK692.
Metabolites 08 00084 g002
Figure 3. Prediction of nutrient effect on growth and glycogen production. The biomass and glycogen production as the functions of uptake fluxes of NO3 (A), PO43− (B), and SO42− (C). Dashed line indicates the optimal uptake rate for growth.
Metabolites 08 00084 g003
Figure 4. Illustrative fluxes in central metabolic predicted by geometric FBA for each growth condition: Control (black), NO3-limited (NO3, blue), PO43−-limited (PO43−, green) and SO42−-limited (SO42−, orange). The diagram included key reactions including the glycolysis, the carbon fixation through CO2-concentrating mechanism, the nonoxidative pentose phosphate pathway, the TCA cycle, and biosynthetic pathways of glycogen. Single and double-headed arrows indicate reactions assumed to be irreversible and reversible, respectively. Numbers labeled at the corresponding arrows show flux values in mmol/gDCW/h.
Metabolites 08 00084 g004
Figure 5. Growth (A) and glycogen content (B) of A. platensis C1 under nutrient starvation at 0–96 h. Culture conditions of Control (), NO3 (), PO43− () and SO42− ().
Metabolites 08 00084 g005
Figure 6. The specific growth rate growth (A) and the glycogen production flux (B) under the control, NO3-depleted, PO43−-depleted and SO42−-depleted conditions. * and ** represent significant difference at the p-value < 0.05 and the p-value < 0.01, respectively.
Metabolites 08 00084 g006
Table 1. Comparison of biomass constituents between iAK888 and iAK692.
ComponentContent (%w/w)
iAK888iAK692 [23]
Proteins51.4468
Carbohydrates31.6216
Lipids4.9811
DNA0.880.88
RNA3.123.12
Colorants2.841
Vitamins0.11-
Minerals2.79-
Ash2.27-
Sum100100
Table 2. Comparison of network model characteristics of A. platensis species.
Arthrospira SpeciesA. platensis C1A. platensis NIE-39
Genome Statistics--
Genome size (bp)6,089,2106,788,435
Protein coding genes61086630
Gene with enzymes952905
Transporter genes 345NA
Model Name/CharacteristicsiAK888iAK692-
Total genes in model888 (15%)692 (11%)620 (9%)
- Metabolic genes767692579
- Transporter genes121041
Total biochemical reactions1096875746
- Metabolic reactions817699652
- Transport reactions1828860
- Exchange reactions978834
Metabolites994837 673
Compartments622
ReferenceThis study[23][55]
Table 3. Comparison of in silico and experimental growth.
Growth ConditionConstraints of Consumed MetabolitesMaximal Specific Growth Rate (1/h)% Error
Photon Flux
(μmol photons m−2 s−1)
HCO3 Uptake Flux (mmol/g
DCW/h)
Glucose Uptake Flux (mmol/g
DCW/h)
ExperimentIn Silico
Autotroph1000.200.0255 [23]0.02521.2
Autotroph2000.2500.0331 [48]0.03340.9
Heterotroph000–0.0170 [23]00
Mixotroph1000.20–0.0170.0262 [23]0.02600.8

