Extra-Virgin Olive Oils from Nine Italian Regions: An 1H NMR-Chemometric Characterization

 , , and
Abstract
:
1. Introduction
2. Results and Discussion
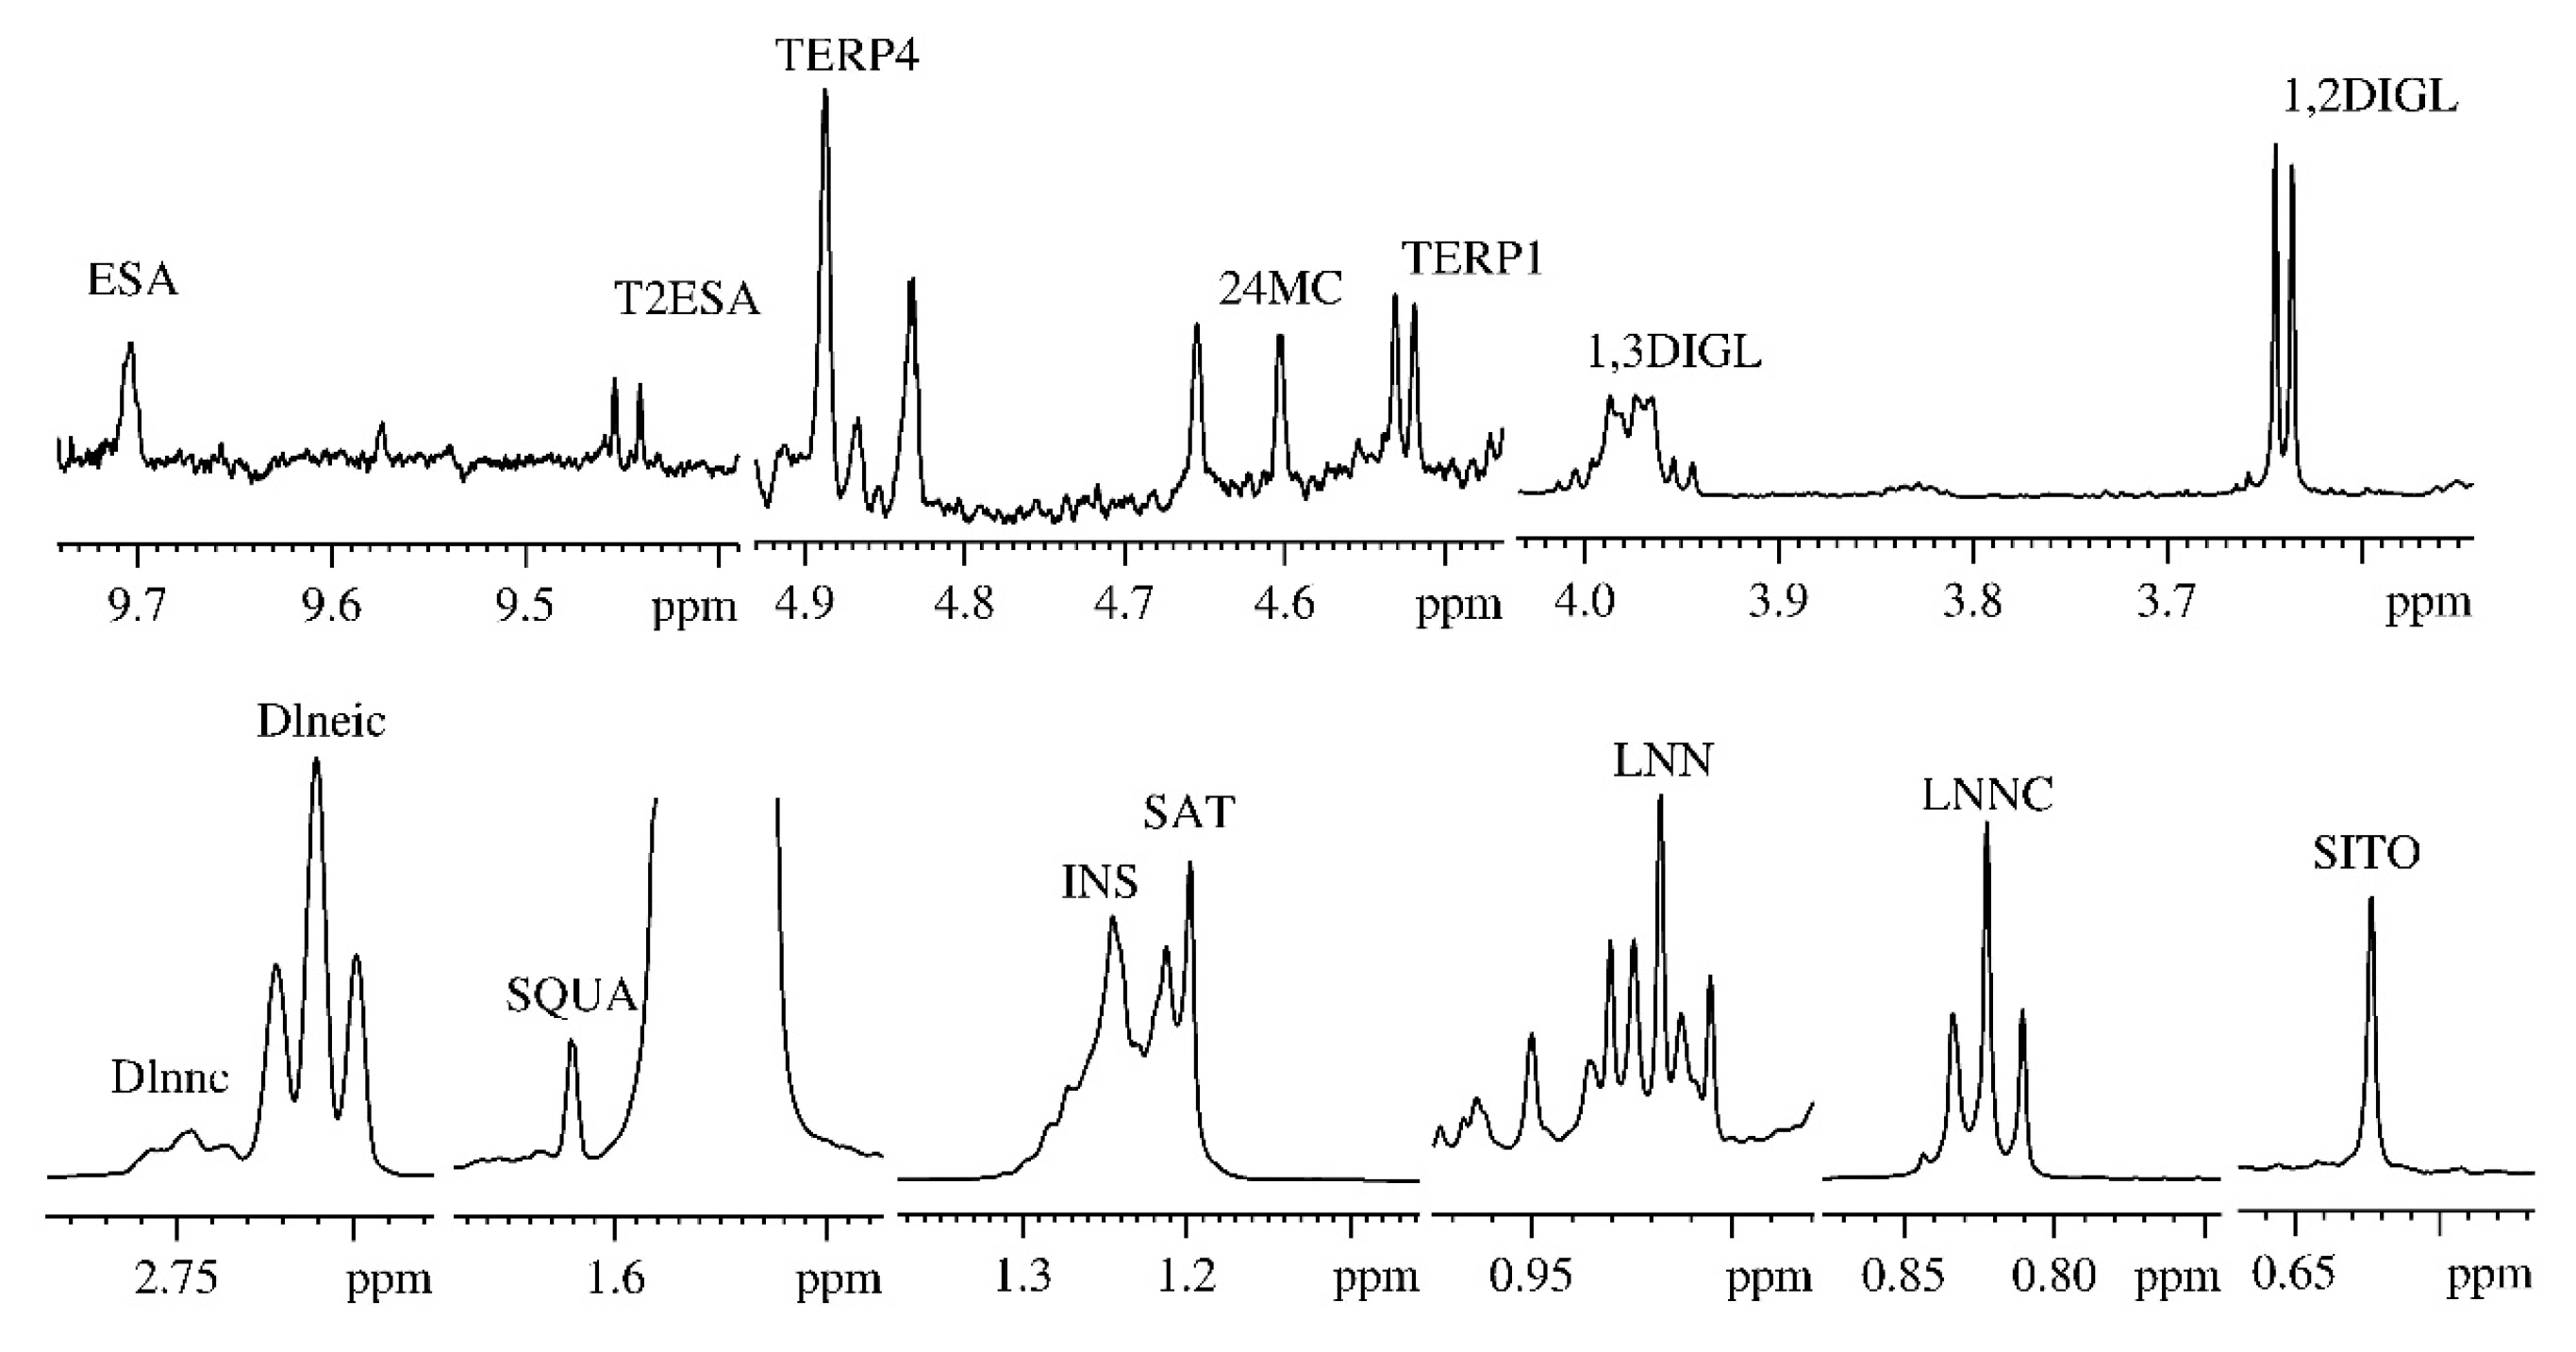
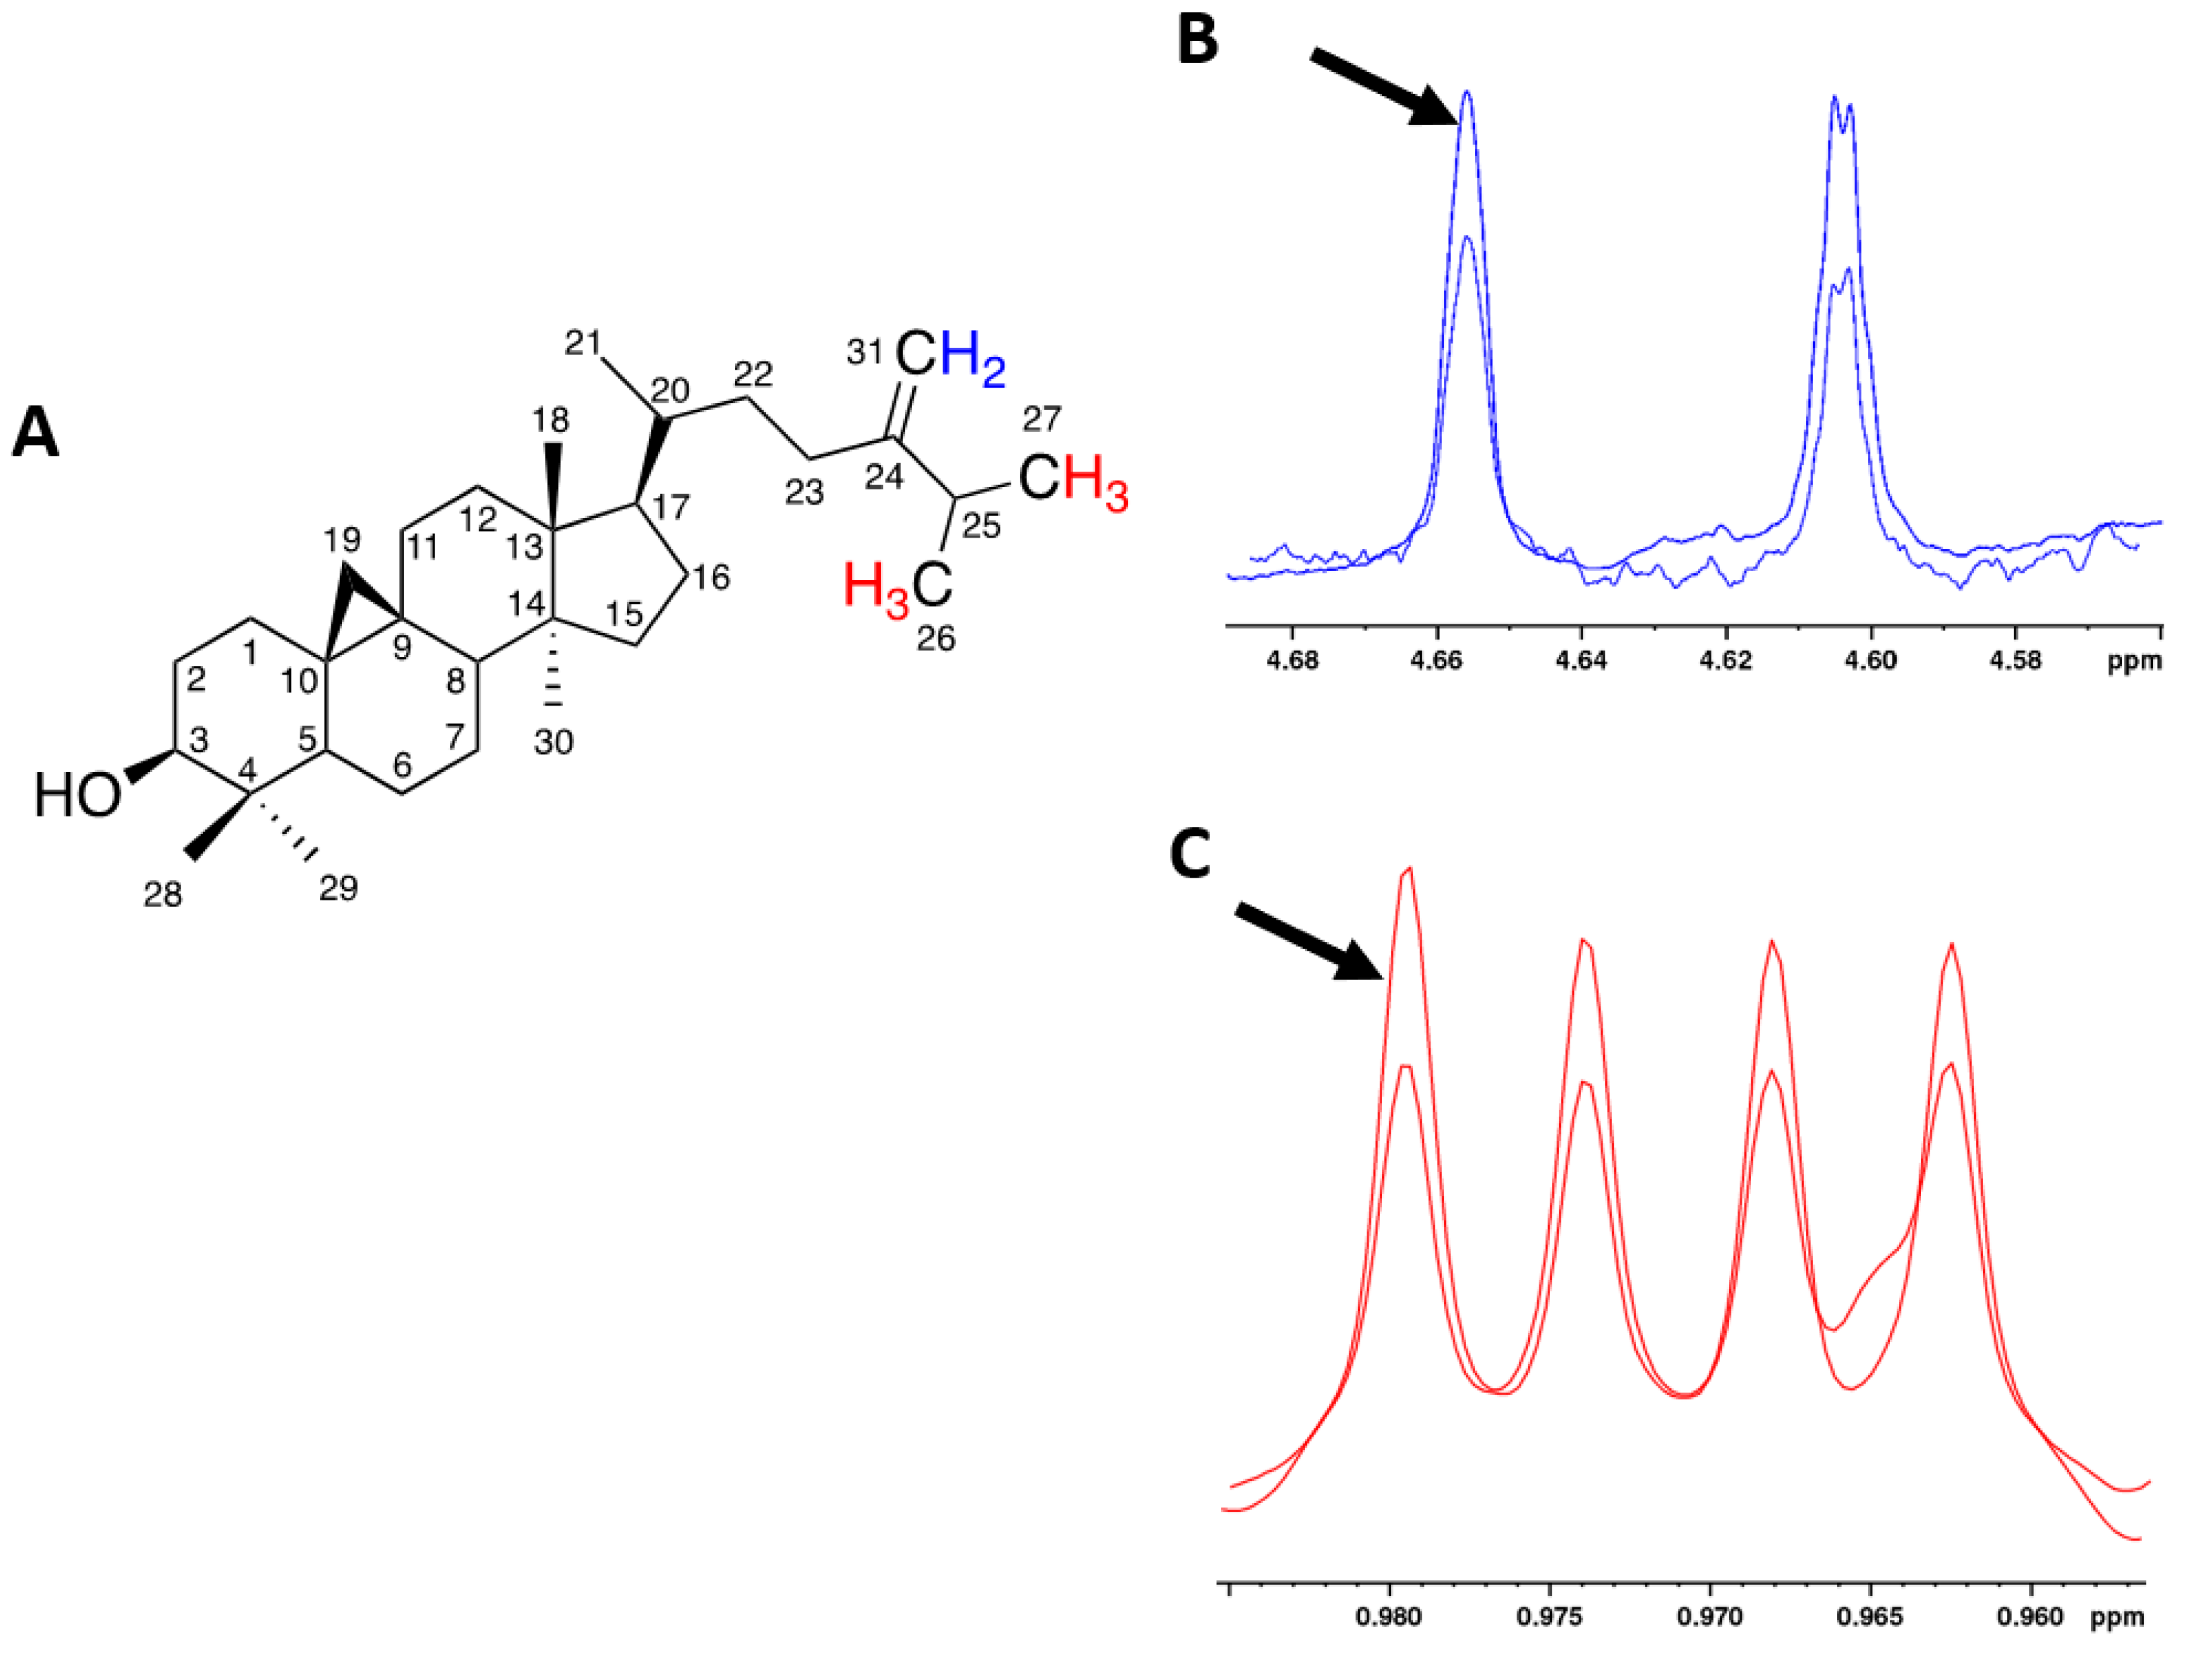
2.1. NMR Analysis
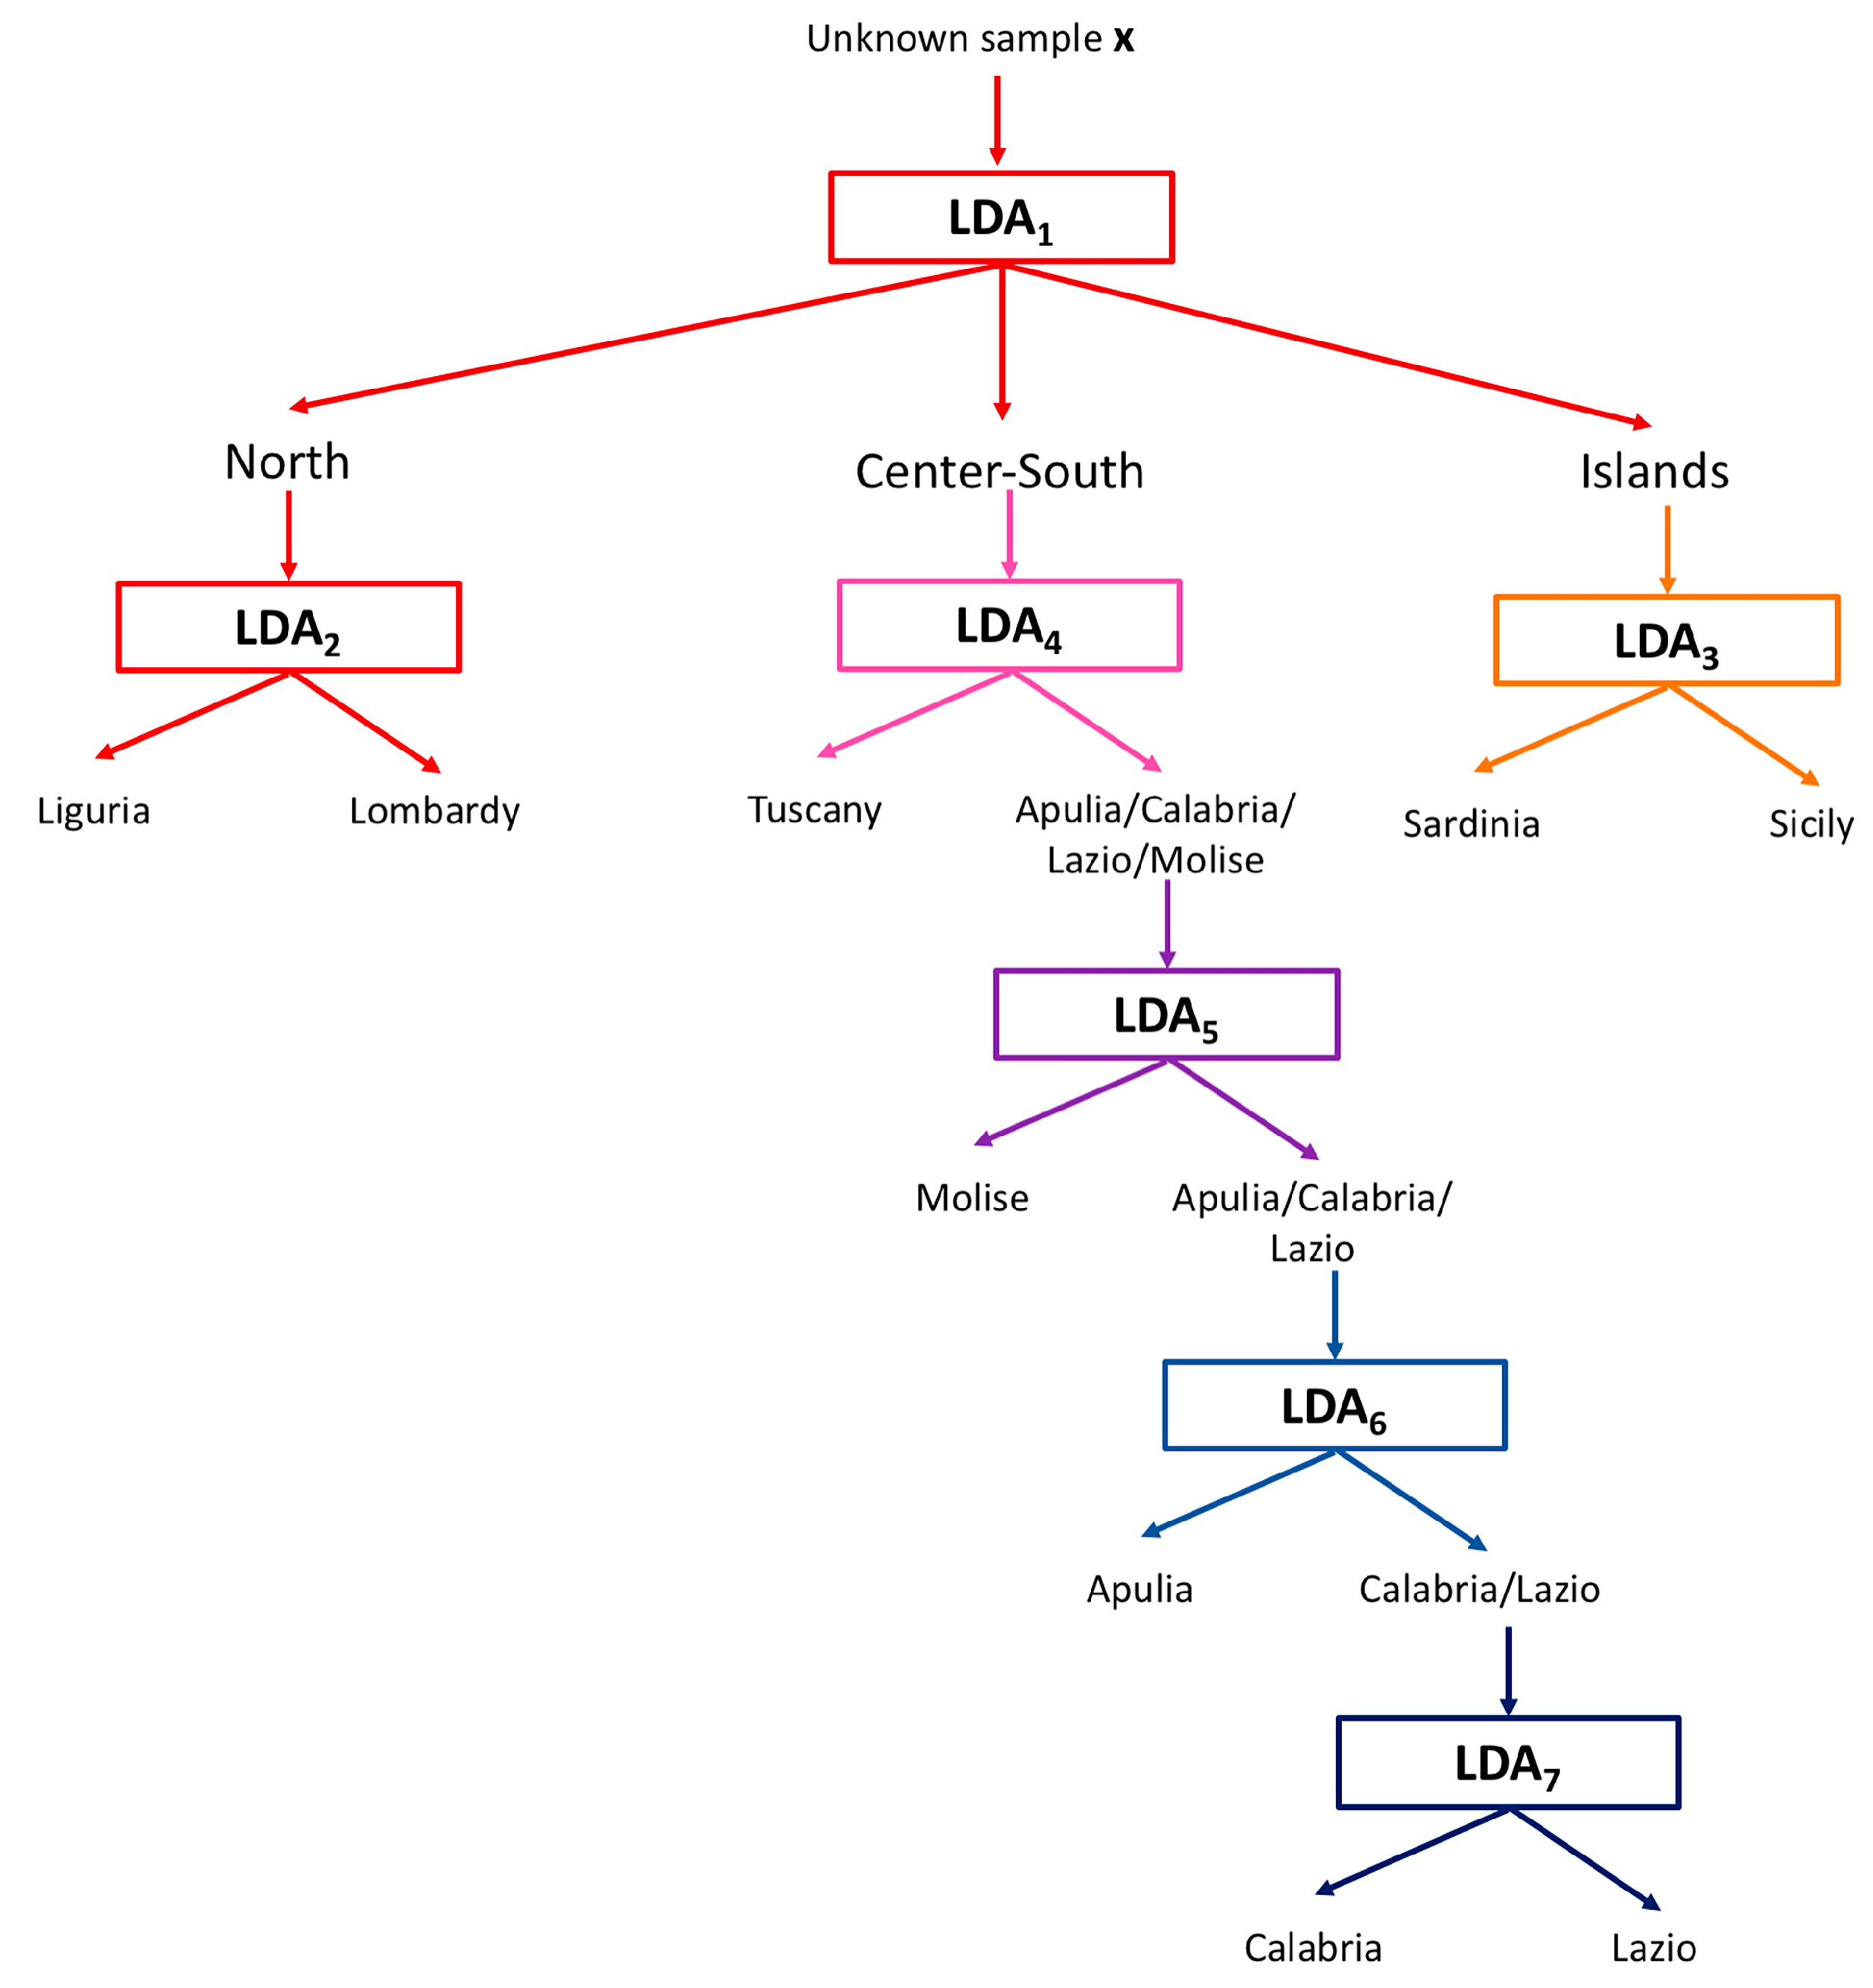
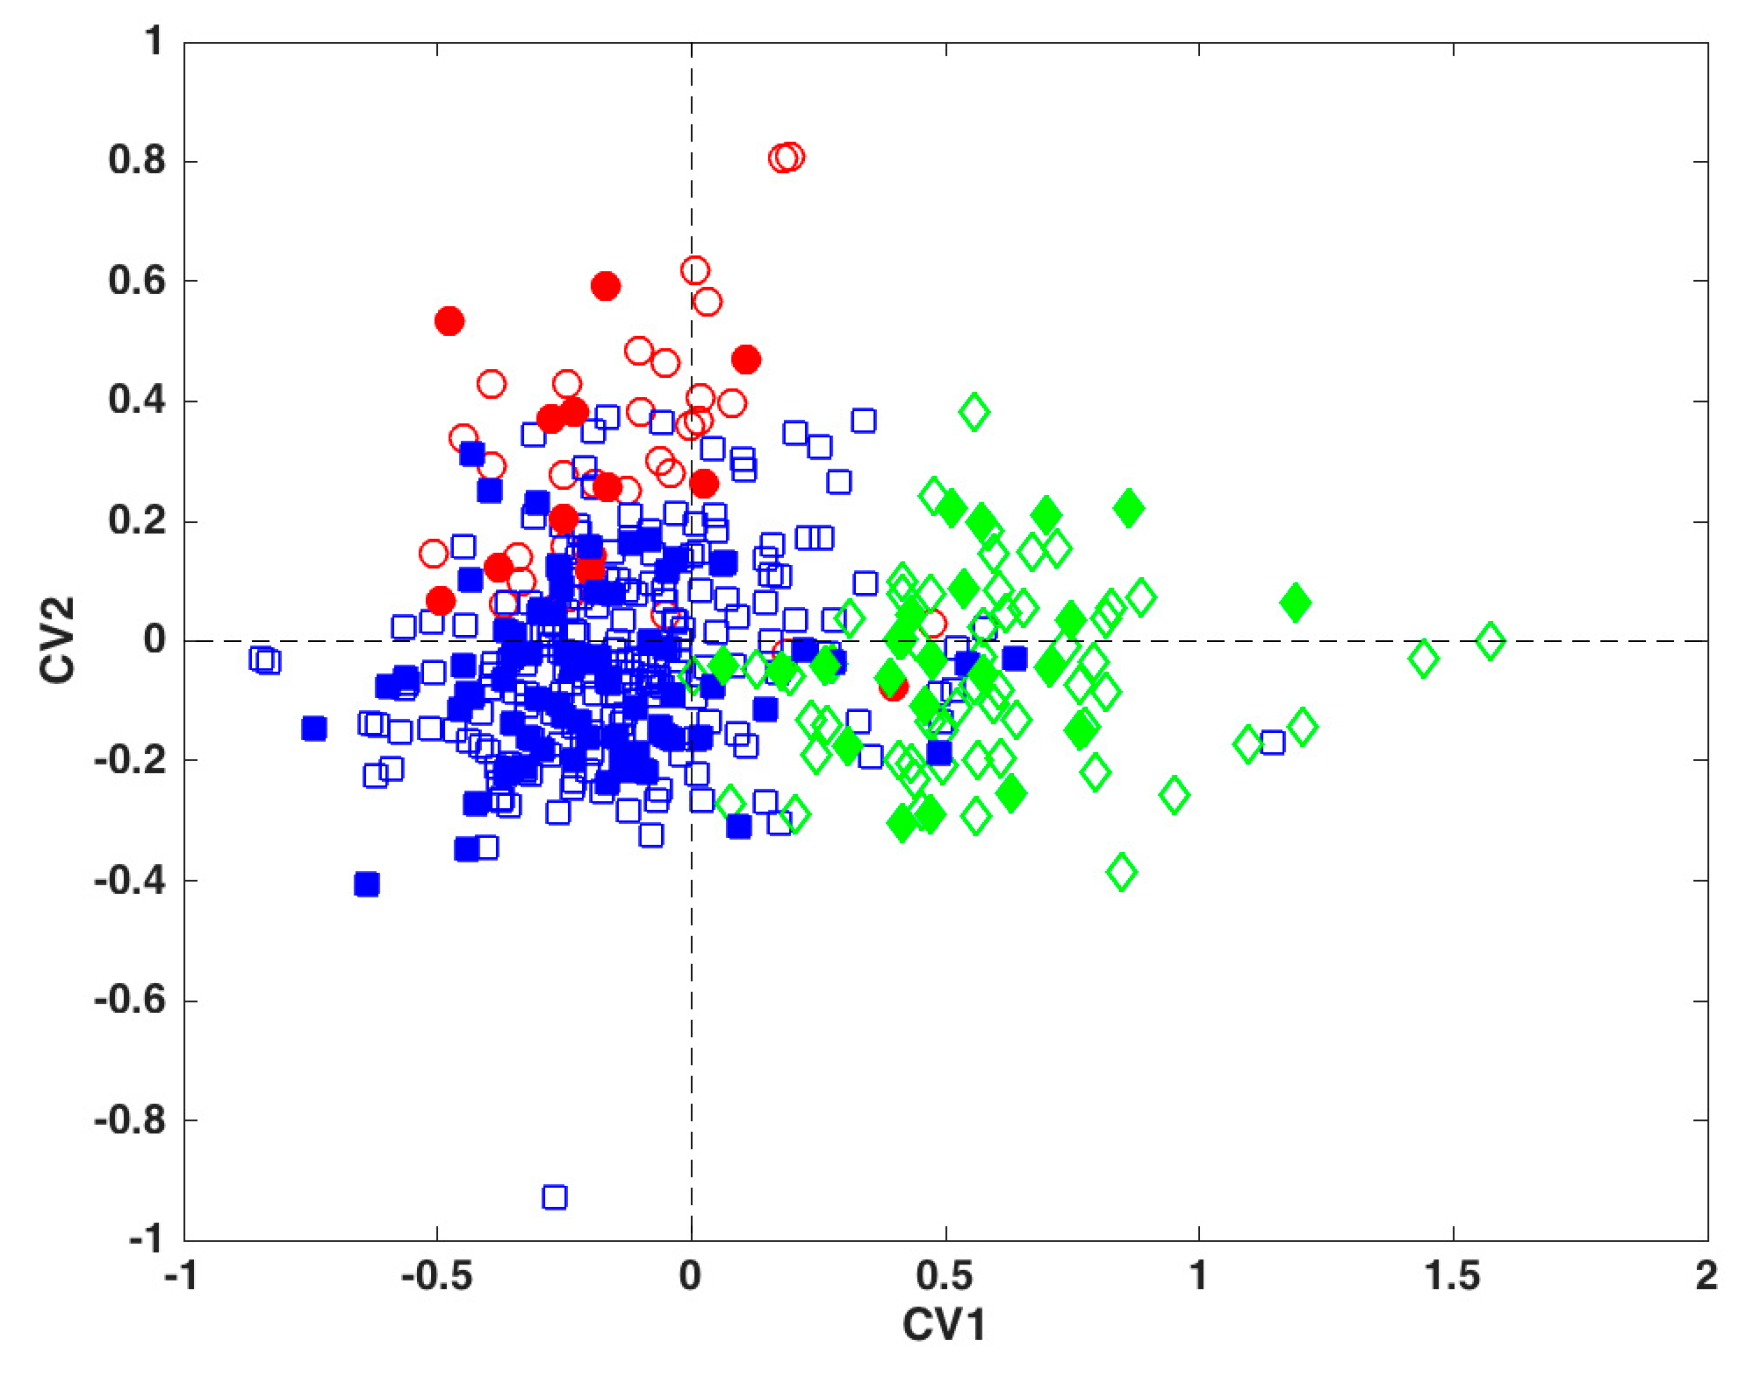
2.2. Global Model
3. Materials and Methods
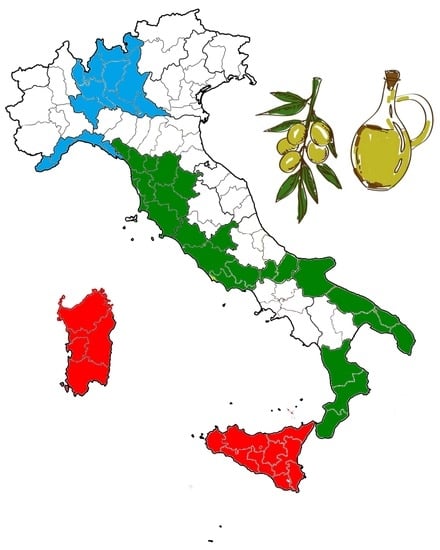
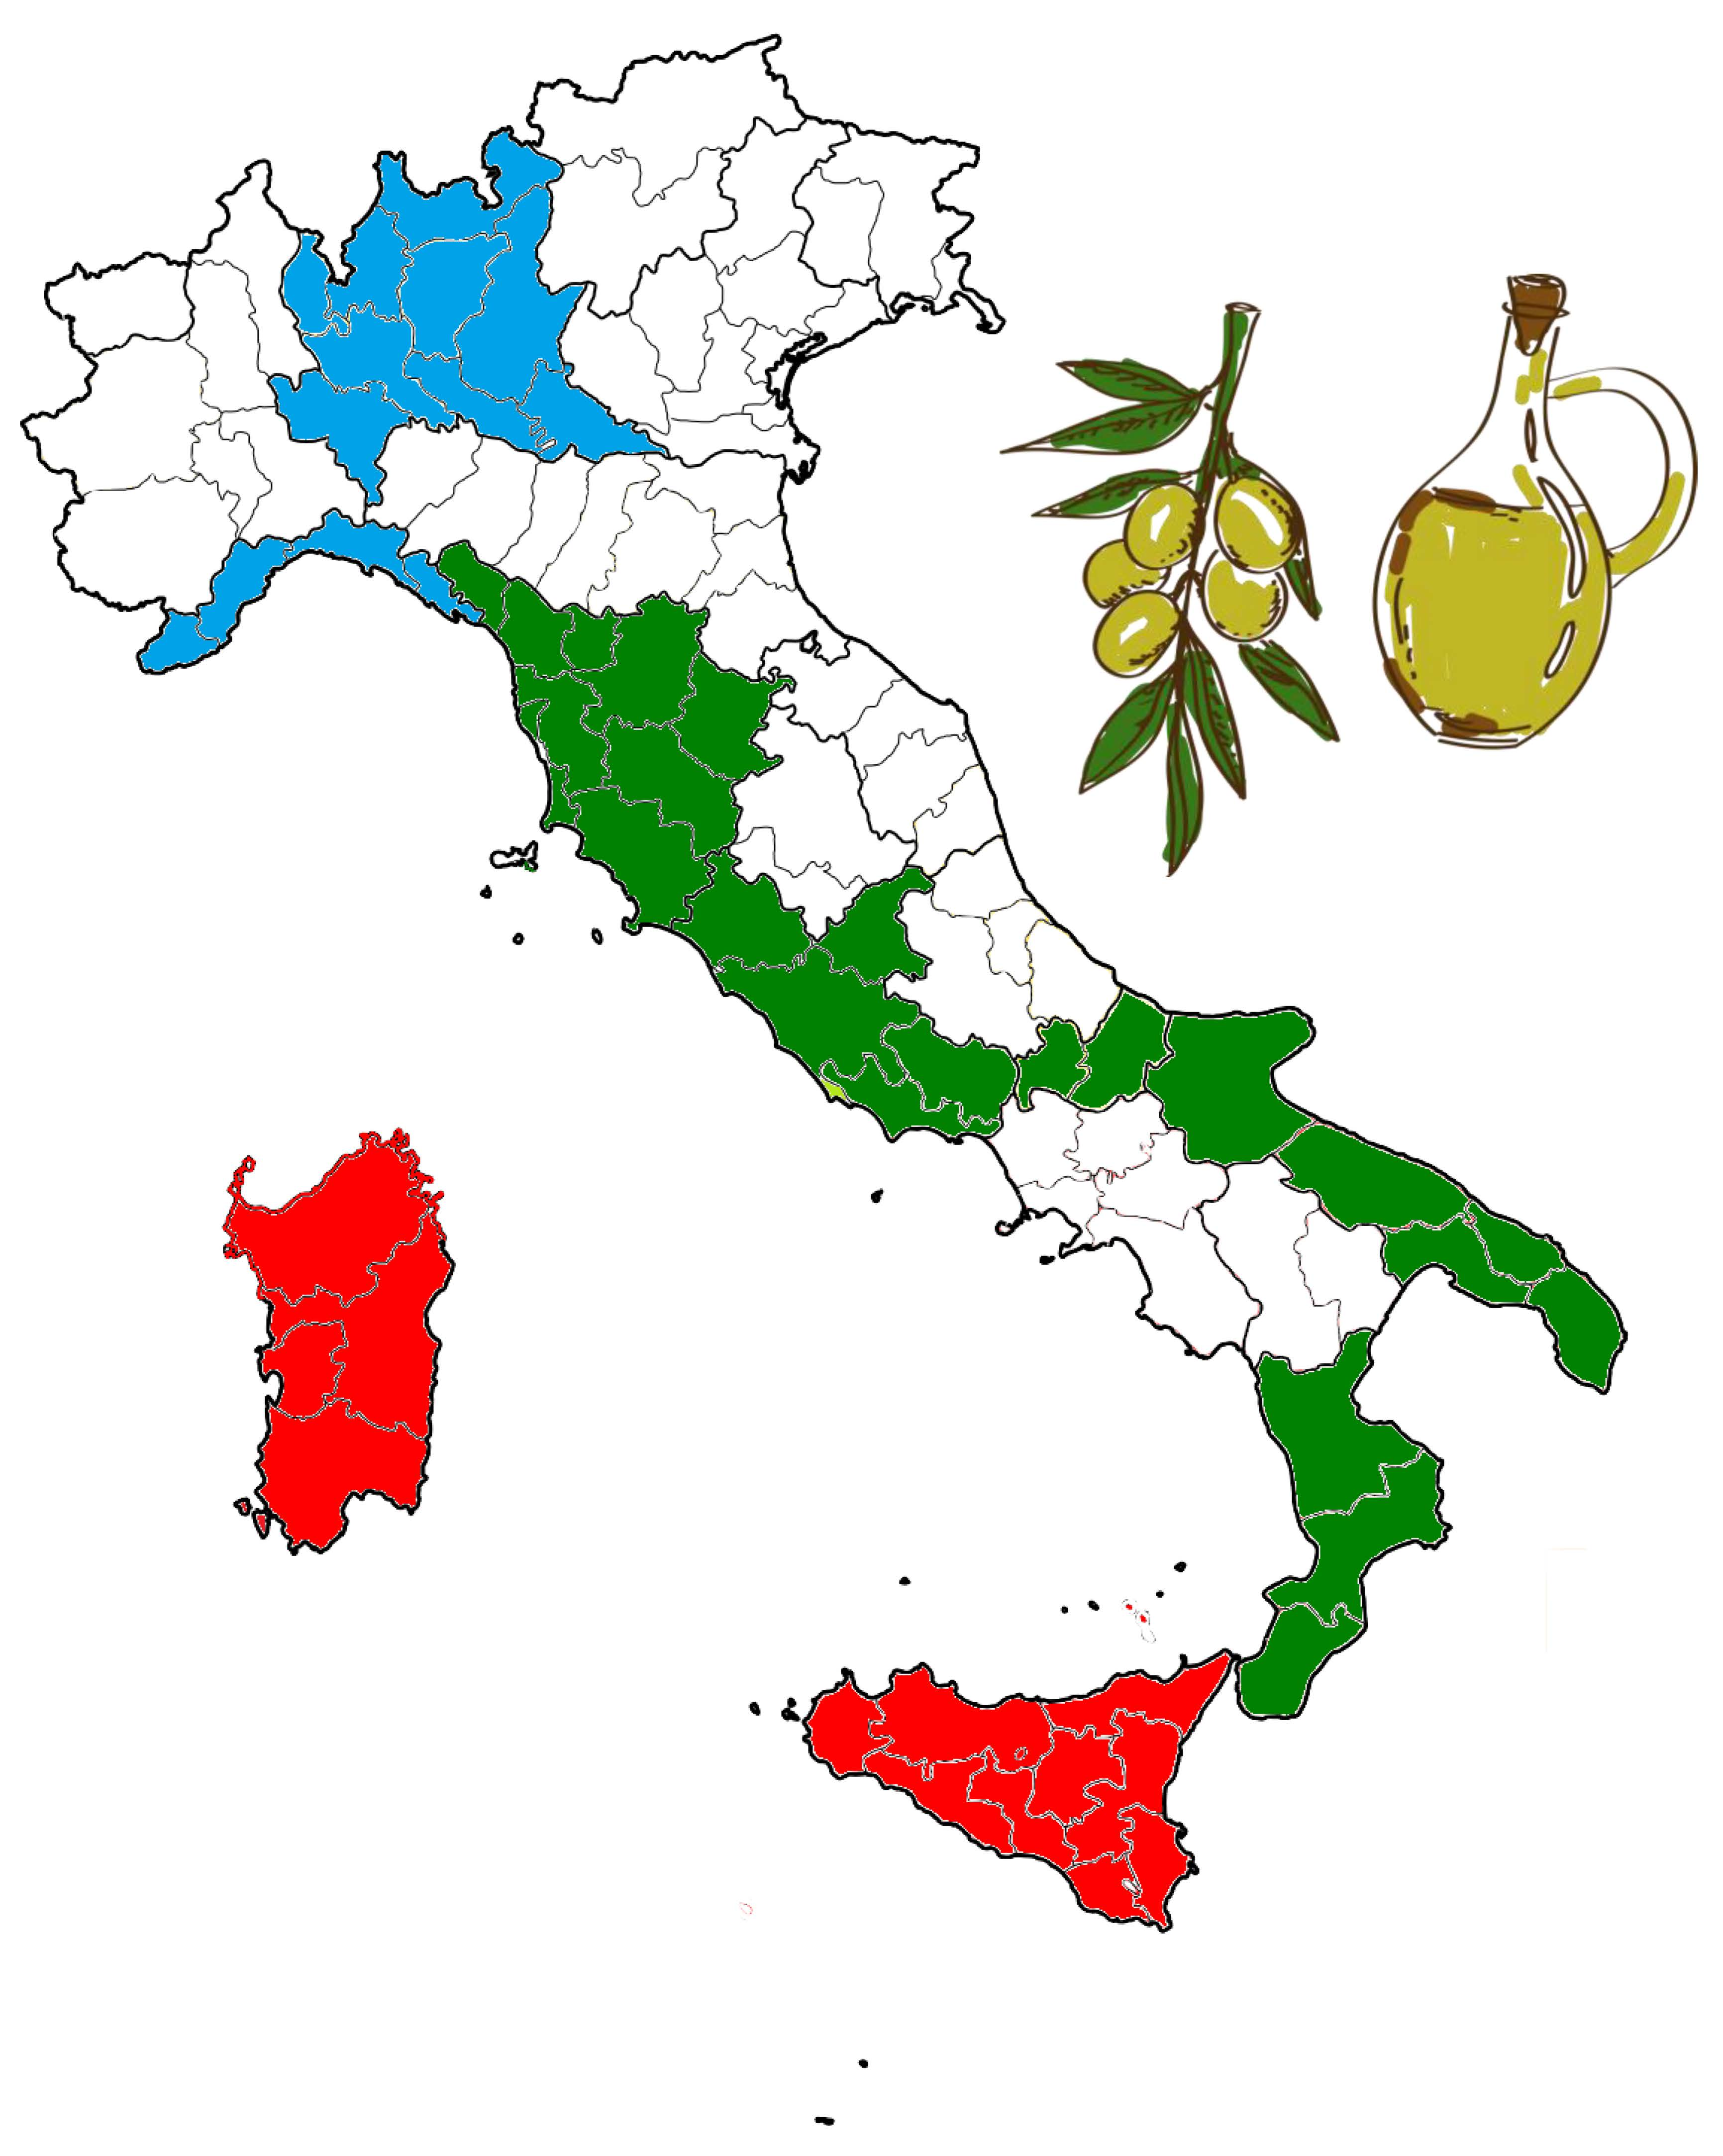
3.1. Sampling
3.2. NMR Analyses
3.3. Chemometrics
4. Conclusions
Supplementary Materials
Author Contributions
Funding
Acknowledgments
Conflicts of Interest
References
- International Olive Council. Available online: http://www.internationaloliveoil.org (accessed on 19 November 2018).
- The European Parliament and the Council of the European Union. Regulation (EC) No. 182/2009 of the European Parliament and of the Council of 06 Mach 2009 on Amending Regulation (EC) No 1019/2002 on Marketing Standards for Olive Oil. Available online: https://eur-lex.europa.eu/LexUriServ/LexUriServ.do?uri=OJ:L:2009:063:0006:0008:EN:PDF (accessed on 19 November 2018).
- The Commission of the European Communities. Commission Regulation (EEC) No 2568/91 of 11 July 1991 on the Characteristics of Olive Oil and Olive-Residue Oil and on the Relevant Methods of Analysis. Available online: https://eur-lex.europa.eu/eli/reg/1991/2568/2015-01-01 (accessed on 19 November 2018).
- Commission Implementing Regulation (EU) No 299/2013 of 26 March 2013 Amending Regulation (EEC) No 2568/91 on the Characteristics of Olive Oil and Olive-Residue Oil and on the Relevant Methods of Analysis. Available online: https://eur-lex.europa.eu/eli/reg_impl/2013/299/oj (accessed on 19 November 2018).
- Mannina, L.; Patumi, M.; Proietti, N.; Bassi, D.; Segre, A.L. Geographical characterization of Italian extra virgin olive oils using high field 1H-NMR spectroscopy. J. Agric. Food Chem. 2001, 49, 2687–2696. [Google Scholar] [CrossRef]
- Mannina, L.; Marini, F.; Gobbino, M.; Sobolev, A.P.; Capitani, D. NMR and chemometrics in tracing European olive oils: the case study of Ligurian samples. Talanta 2010, 80, 2141–2148. [Google Scholar] [CrossRef]
- Mannina, L.; Gobbino, M.; Mariani, C.; Bellan, G.; Alessandri, V.; Capitani, D.; Di Ferdinando, S. Fingerprint of olive oils from Latium using a widespread analytical protocol. Riv. Ital. Sost. Grasse 2009, XXXVI, 15–23. [Google Scholar]
- Del Coco, L.; Mondelli, D.; Mezzapesa, G.N.; Miano, T.; De Pascali, S.A.; Girelli, C.R.; Fanizzi, F.P. Protected Designation of Origin Extra Virgin Olive Oils Assessment by Nuclear Magnetic Resonance and Multivariate Statistical Analysis: “Terra di Bari”, an Apulian (Southeast Italy) Case Study. J. Am. Oil Chem. Soc. 2016, 93, 373–381. [Google Scholar] [CrossRef]
- Piccinonna, S.; Ragone, R.; Stocchero, M.; Del Coco, L.; De Pascali, S.A.; Schena, F.P.; Fanizzi, F.P. Robustness of NMR-based metabolomics to generate comparable data sets for olive oil cultivar classification. An inter-laboratory study on Apulian olive oils. Food Chem. 2016, 199, 675–683. [Google Scholar] [CrossRef]
- Girelli, C.R.; Del Coco, L.; Zelasco, S.; Salimonti, A.; Conforti, F.L.; Biagianti, A.; Barbini, D.; Fanizzi, F.P. Traceability of “Tuscan PGI” Extra Virgin Olive Oils by 1H NMR Metabolic Profiles Collection and Analysis. Metabolites 2018, 8, 60. [Google Scholar] [CrossRef]
- Giuffrida, D.; Salvo, F.; Salvo, A.; La Pera, L.; Dugo, G. Pigments composition in monovarietal virgin olive oils from various sicilian olive varieties. Food Chem. 2007, 101, 833–837. [Google Scholar] [CrossRef]
- Salvo, A.; Rotondo, A.; La Torre, G.L.; Cicero, N.; Dugo, G. Determination of 1,2/1,3-diglycerides in Sicilian extra-virgin olive oils by 1H-NMR over a one-year storage period. Nat. Prod. Res. 2017, 31, 822–828. [Google Scholar] [CrossRef] [PubMed]
- Camin, F.; Pavone, A.; Bontempo, L.; Wehrens, R.; Paolini, M.; Faberi, A.; Marianella, R.M.; Capitani, D.; Vista, S.; Mannina, L. The use of IRMS, 1H NMR and chemical analysis to characterise Italian and imported Tunisian olive oils. Food Chem. 2016, 196, 98–105. [Google Scholar] [CrossRef]
- D’Imperio, M.; Gobbino, M.; Picanza, A.; Costanzo, S.; Della Corte, A.; Mannina, L. Influence of harvest method and period on olive oil composition: An NMR and statistical study. J. Agric. Food Chem. 2010, 58, 11043–11051. [Google Scholar] [CrossRef]
- D’Imperio, M.; Mannina, L.; Capitani, D.; Bidet, O.; Rossi, E.M.; Bucarelli, F.; Quaglia, G.B.; Segre, A.L. NMR and statistical study of olive oils from Lazio: A geographical, ecological and agronomic characterization. Food Chem. 2007, 105, 1256–1267. [Google Scholar] [CrossRef]
- Mannina, L.; D’Imperio, M.; Lava, R.; Schievano, E.; Mammi, S. Caratterizzazione NMR e analisi statistica di oli di oliva DOP veneti. Riv. Ital. Sost. Grasse 2005, LXXXII, 59–63. [Google Scholar]
- Mannina, L.; Patumi, M.; Proietti, N.; Segre, A.L.P.D.O. (Protected designation of origin): Geographical characterization of Tuscan extra virgin olive oils using high-field 1H NMR spectroscopy. Ital. J. Food Sci. 2001, 13, 53–63. [Google Scholar]
- Vlahov, G.; Del Re, P.; Simone, N. Determination of Geographical Origin of Olive Oils Using 13C Nuclear Magnetic Resonance Spectroscopy. I—Classification of Olive Oils of the Puglia Region with Denomination of Protected Origin. J. Agric. Food Chem. 2003, 51, 5612–5615. [Google Scholar] [CrossRef] [PubMed]
- Sacco, A.; Brescia, M.A.; Liuzzi, V.; Reniero, F.; Guillou, C.; Ghelli, S.; van der Meer, P. Characterization of italian olive oils based on analytical and nuclear magnetic resonance determinations. J. Am. Oil Chem. Soc. 2000, 77, 619–625. [Google Scholar] [CrossRef]
- Fronimaki, P.; Spyros, A.; Christophoridou, S.; Dais, P. Determination of the Diglyceride Content in Greek Virgin Olive Oils and Some Commercial Olive Oils by Employing 31P NMR Spectroscopy. J. Agric. Food Chem. 2002, 50, 2207–2213. [Google Scholar] [CrossRef]
- Petrakis, P.V.; Agiomyrgianaki, A.; Christophoridou, S.; Spyros, A.; Dais, P. Geographical Characterization of Greek Virgin Olive Oils (Cv. Koroneiki) Using 1H and 31P NMR Fingerprinting with Canonical Discriminant Analysis and Classification Binary Trees. J. Agric. Food Chem. 2008, 56, 3200–3207. [Google Scholar] [CrossRef]
- Yoshida, K.; Hirose, Y.; Imai, Y.; Kondo, T. Conformational Analysis of Cycloartenol, 24-Methylenecycloartanol and Their Derivatives. Agric. Biol. Chem. 1989, 53, 1901–1912. [Google Scholar] [CrossRef]
- Benabdelaziz, I.; Haba, H.; Lavaud, C.; Benkhaled, M. Triterpenoids and Flavonoid from Scorzonera undulata ssp. alexandrina. Int. J. Chem. Biol. Sci. 2014, 5, 1–5. [Google Scholar]
- Sacchi, R.; Patumi, G.; Fontanazza, P.; Fiordiponti, P.; Mannina, L.; Rossi, E.; Segre, A.L. High-Field 1H Nuclear Magnetic Resonance Study of the Minor Virgin Olive Oils. J. Am. Oil Chem. Soc. 1996, 73, 747–758. [Google Scholar] [CrossRef]
- Ruiz-Aracama, A.; Goicoechea, E.; Guillén, M.D. Direct study of minor extra-virgin olive oil components without any sample modification. 1H NMR multisupression experiment: A powerful tool. Food Chem. 2017, 228, 301–314. [Google Scholar] [CrossRef] [PubMed]
- Fisher, R.A. The use of multiple measurements in taxonomic problems. Ann. Eugen. 1936, 7, 179–188. [Google Scholar] [CrossRef]
- Westad, F.; Marini, F. Validation of chemometric models—A tutorial. Anal. Chim. Acta 2015, 893, 14–24. [Google Scholar] [CrossRef] [PubMed]
- Kennard, R.W.; Stone, L.A. Computer aided design of experiments. Technometrics 1969, 11, 137–148. [Google Scholar] [CrossRef]
- Del Nobile, M.A.; Bove, S.; La Notte, E.; Sacchi, R. Influence of packaging geometry and material properties on the oxidation kinetic of bottled virgin olive oil. J. Food Eng. 2003, 57, 189–197. [Google Scholar] [CrossRef]
- Mattei, A.; Burattini, M.; Zanoni, B. Effetto della tipologia di confezionamento primario sulla conservabilità di oli extravergini di oliva. Riv. Ital. Sost. Grasse 2005, 82, 65–70. [Google Scholar]
- Mèndez, A.I.; Falquè, E. Influence of container type and storage tine on olive marc oil quality. Electron. J. Environ. Agric. Food Chem. 2002, 1, 71–95. [Google Scholar]


| Assignment | NMR Resonances (ppm) |
|---|---|
| Methyl 18 of β-sitosterol (SITO) | 0.623 |
| Linoleic acid methyl group (LNEIC) | 0.843 |
| Linolenic acid methyl group (LNNC) | 0.910 |
| Methylenic protons of the saturated fatty acids chains (SAT) | 1.197 |
| Methylenic protons of the unsaturated fatty acids chains (INS) | 1.244 |
| Squalene (SQUA) | 1.620 |
| Diallylic protons of the linoleic acid (Dlneic) | 2.710 |
| Diallylic protons of the linolenic acid (Dlnnc) | 2.746 |
| Sn-1,2-diglycerids α methylenic protons (1,2DIGL) | 3.636 |
| Sn-1,3-diglycerids α methylenic protons (1,3DIGL) | 3.988 |
| Terpene 1 (TERP1) | 4.541 |
| 24-methylenecycloartanol (24MC) | 4.609 |
| Terpene 4 (TERP4) | 4.885 |
| Trans-2-Hexanal (T2ESA) | 9.454 |
| Hexanal (ESA) | 9.704 |
| Region | Calibration | Validation |
|---|---|---|
| Calabria | 36.11 (13/36) a | 40.00 (6/15) |
| Lazio | 44.68 (21/47) | 60.00 (12/20) |
| Liguria | 80.00 (12/15) | 66.67 (4/6) |
| Lombardy | 75.00 (12/16) | 100.00 (7/7) |
| Molise | 81.48 (22/27) | 63.64 (7/11) |
| Apulia | 49.06 (26/53) | 43.48 (10/23) |
| Sardinia | 91.67 (22/24) | 90.00 (9/10) |
| Sicily | 74.19 (23/31) | 61.54 (8/13) |
| Tuscany | 60.00 (12/20) | 66.67 (6/9) |
| Region | Calibration | Validation |
|---|---|---|
| Macro-geographical area (LDA1) | ||
| North | 80.65 (25/31) a | 84.62 (11/13) |
| Center-South | 77.05 (141/183) | 85.90 (67/78) |
| Islands | 92.73 (51/55) | 91.30 (21/23) |
| Northern Italian regions (LDA2) | ||
| Liguria | 93.33 (14/15) | 100.00 (6/6) |
| Lombardy | 100.00 (16/16) | 100.00 (7/7) |
| Island regions (LDA3) | ||
| Sardinia | 95.83 (23/24) | 100.00 (10/10) |
| Sicily | 90.32 (28/31) | 92.31 (12/13) |
| Region | Calibration | Validation |
|---|---|---|
| Tuscany | 85.00 (17/20) a | 88.89 (8/9) |
| Others (Calabria, Lazio, Molise, Apulia) | 88.96 (145/163) | 91.30 (63/69) |
| Molise | 85.19 (23/27) | 81.82 (9/11) |
| Others (Lazio, Apulia, Calabria) | 84.56 (115/136) | 84.48 (49/58) |
| Apulia | 81.13 (43/53) | 82.61 (19/23) |
| Others (Lazio, Calabria) | 79.52 (66/83) | 80.00 (28/35) |
| Calabria | 69.44 (25/36) | 86.67 (13/15) |
| Lazio | 70.22 (33/47) | 60.00 (12/20) |
| Region | Calibration | Validation |
|---|---|---|
| Calabria | 73.33 (24/36) a | 73.33 (11/15) |
| Lazio | 63.83 (30/47) | 60.00 (12/20) |
| Liguria | 86.67 (13/15) | 83.33 (5/6) |
| Lombardy | 81.25 (13/16) | 100.00 (7/7) |
| Molise | 85.19 (23/27) | 72.73 (8/11) |
| Apulia | 66.04 (35/53) | 65.22 (15/23) |
| Sardinia | 95.83 (23/24) | 100.00 (10/10) |
| Sicily | 77.42 (24/31) | 76.92 (9/13) |
| Tuscany | 65.00 (13/20) | 66.67 (6/9) |
© 2019 by the authors. Licensee MDPI, Basel, Switzerland. This article is an open access article distributed under the terms and conditions of the Creative Commons Attribution (CC BY) license (http://creativecommons.org/licenses/by/4.0/).
Share and Cite
Ingallina, C.; Cerreto, A.; Mannina, L.; Circi, S.; Vista, S.; Capitani, D.; Spano, M.; Sobolev, A.P.; Marini, F. Extra-Virgin Olive Oils from Nine Italian Regions: An 1H NMR-Chemometric Characterization. Metabolites 2019, 9, 65. https://doi.org/10.3390/metabo9040065
Ingallina C, Cerreto A, Mannina L, Circi S, Vista S, Capitani D, Spano M, Sobolev AP, Marini F. Extra-Virgin Olive Oils from Nine Italian Regions: An 1H NMR-Chemometric Characterization. Metabolites. 2019; 9(4):65. https://doi.org/10.3390/metabo9040065
Chicago/Turabian StyleIngallina, Cinzia, Antonella Cerreto, Luisa Mannina, Simone Circi, Silvia Vista, Donatella Capitani, Mattia Spano, Anatoly P. Sobolev, and Federico Marini. 2019. "Extra-Virgin Olive Oils from Nine Italian Regions: An 1H NMR-Chemometric Characterization" Metabolites 9, no. 4: 65. https://doi.org/10.3390/metabo9040065