


Two-Pion Bose–Einstein Correlations in Au+Au Collisions at

1
Department of Experimental Nuclear Physics and Cosmophysics, National Research Nuclear University MEPhI (Moscow Engineering Physics Institute), Moscow 115409, Russia
2
Joint Institute for Nuclear Research, Dubna 141980, Russia
Universe 2024, 10(4), 188; https://doi.org/10.3390/universe10040188
Submission received: 11 January 2024
/
Revised: 17 April 2024
/
Accepted: 18 April 2024
/
Published: 20 April 2024
(This article belongs to the Special Issue Multiparticle Dynamics)
Abstract
:The correlation femtoscopy technique makes it possible to estimate the geometric dimensions and lifetime of the particle emission region after the collision of ions. Measurements of the emission region characteristics not only at midrapidity but also at backward (forward) rapidity can provide new information about the source and make it possible to impose constraints on the heavy-ion collision models. This work is devoted to revealing the dependence of the spatial and temporal parameters of the emission region of identical pions in Au+Au collisions at = 3 GeV from the fixed-target program of the STAR experiment. The extracted femtoscopic radii, , , , , and the correlation strength, , are presented as a function of collision centrality, pair rapidity, and transverse momentum. Physics implications will be discussed.
1. Introduction
The important goal of the high-energy heavy-ion collision experiments is to study the properties of quark–gluon matter and its description from the first principles of the fundamental theory of strong interactions—quantum chromodynamics (QCD) [1,2,3,4]. Collisions of heavy ions generate matter with different temperatures, T, and baryon chemical potentials, , which allows to probe different regions of the QCD phase diagram [5,6,7]. The phase diagram contains regions where partonic degrees of freedom dominate—quark–gluon plasma (QGP), hadronic degrees of freedom dominate—hadronic gas, and a mixed phase. According to theoretical predictions [8,9,10], there is a first-order phase transition between the QGP and the hadronic phase at finite , as opposed to the crossover transition at close to zero. The point where the first-order phase transition ends is called the QCD critical point. Studying the properties of the nuclear matter under extreme conditions and finding the critical point in the QCD phase diagram is the main focus of beam energy scan programs. The beam energy scan (BES) programs at the Relativistic Heavy-Ion Collider (RHIC, USA) provide the opportunity to explore different regions of the QCD phase diagram from low and high T to high and low T. This allows one to study the properties of nuclear matter and find possible phase transitions and critical point signals. The STAR experiment at RHIC finished collecting data for the BES-I program in 2011, and now BES-II and FXT have completed high-statistics data-taking at high-. The STAR experiment took data for gold–gold collisions at –27 GeV, corresponding to from 420 to 150 MeV in the collider mode [11] during the BES-II program at RHIC. The fixed-target (FXT) program of BES-II provides access to Au+Au collisions at = 3–7.7 GeV [12] that corresponds to from 720 to 420 MeV. For the BES-II program, STAR upgraded the inner time projection chamber iTPC and installed new detectors such as endcap Time-Of-Flight (eTOF) and Event Plane Detector (EPD). The upgrades improve the acceptance of particle detection and identification, as well as the event-plane resolution.
Measurements of the spatial and temporal structure of particle emission regions play one of the key roles in understanding quark–gluon matter evolution. The short lifetime of the system makes it impossible to directly measure the position and time of particle emission. Using momentum correlations of particles provides an opportunity to extract information about the source’s shape and lifetime [13,14,15,16,17,18].
Pion correlations with small opening angles were observed in experiments studying proton–antiproton annihilation by G. Goldhaber, S. Goldhaber, W. Li, and A. Pais in the 1960s. They proposed to take into account Bose–Einstein statistics to describe the production of identical and nonidentical pion pairs [19]. In the 1970s, G. Kopylov and M. Podgoretsky [20,21,22,23] proposed to use the correlation function to study the space–time structure of the particle-emitting region and settled the basics for future femtoscopy techniques. The momentum correlations are also influenced by the final state interactions (FSI)—Coulomb and strong [13,24,25,26]. The Coulomb interaction affects correlation function at very small relative momenta (on the order of two-particle system inverse Bohr radius) [27,28]. Momentum correlations also provide an opportunity to study the properties of strong interaction between particles (recent experimental results and reviews can be found in refs. [29,30]. Using unlike-sign pair correlations makes it possible to study the relative space–time asymmetries in a particle emission process and the final-state interaction parameters [31,32,33]. Therefore, the momentum correlations of identical and nonidentical particles are widely used to study the space–time characteristics of the production processes and are called correlation femtoscopy. The correlation femtoscopy technique makes it possible to estimate the geometric dimensions and lifetime of the particle emission region created in collisions of ions.
The main goal of this analysis is to study the dynamics of the system produced at GeV. Collision expansion could be characterized by freeze-out concepts: chemical and kinetic (thermal). Chemical freeze-out occurs at a temperature () when inelastic processes that convert one kind of hadronic species into a different one cease and the hadronic abundances stop changing. Kinetic freeze-out occurs at a temperature () when the momenta of the particles stop changing, i.e., elastic and inelastic scatterings cease (). The femtoscopic radii of the source emission region extracted from two-particle correlations describe the system at the moment of the kinetic freeze-out. Previous results of pion femtoscopy in Au+Au collisions at RHIC [34,35,36] show signs of hydrodynamic flow in heavy-ion collisions, manifested in a decrease in source radii with an increase in transverse mass () [37,38], where () is the average transverse momentum of the particle pair. This -dependence indicates the dynamics of system expansion after collisions [39]. For kaons, similar behavior was observed for , as for pions [40].
More insights about the production of particles can be obtained from the dependence of the density of charged particles on rapidity. The rapidity distribution has an almost flat plateau [41]. The presence of a plateau in the rapidity dependence in the region of central rapidities is used in the Bjorken collision model [42]. In this model, the collision region expands only along the collision axis, and in such a way that the independence of the observables (energy density, temperature) from the rapidity is preserved. According to this model, most calculations of the hydrodynamic evolution of the system are performed only in transverse directions. In heavy-ion collisions, the produced particles are assumed to be approximately boost-invariant with respect to the beam direction (longitudinal) that provides a model for an expanding system [42]. Boost-invariance means that the particle density does not depend on the rapidity, and the correlations between particles in the final state are the same in any coordinate system under Lorentz transformations. Experiments show that a flat rapidity plateau was observed at high energies at midrapidity [3]. In this work, we explore the rapidity-dependence of the femtoscopic parameters on paired pseudorapidity and transverse momentum.
Previous kaon femtoscopy studies carried out in Pb+Pb collisions at SPS by the NA44, NA49 and CERES collaborations [43,44,45] showed a decrease in with by as a consequence of the boost-invariance of the longitudinal flow. Subsequent studies carried out in Au+Au collisions at RHIC [34,35,36] showed similar dependenced for pion and kaon femtoscopic radii. Obtained femtoscopic radii in Pb+Pb collisions at TeV at the ALICE experiment [38] were compared with obtained results in Au+Au collisions at GeV in the STAR experiment. The pion source radii measured by ALICE are larger than those measured at RHIC by ≈10–35%. The homogeneity volume and the decoupling time for pions at midrapidity are two times and 40% larger, respectively, than in the STAR experiment. ALICE’s results obtained in the study of multiplicity [46] show that the pseudorapidity densities of charged particles at midrapidity are significantly larger than those measured at RHIC. Elliptic flow measurements at the LHC [47,48] have the observed similarity of -differential elliptic flow at low at the RHIC. The integral elliptic flow increases by 30% from GeV at the RHIC to TeV at the ALICE. These results taken together indicate that the fireball formed in nuclear collisions at the LHC is hotter, lives longer, and expands to a larger size at freeze-out as compared with lower energies.
This work is devoted to the study of femtoscopic correlations of identical pion pairs in Au+Au collisions at = 3 GeV in the fixed-target program in the STAR experiment. The resulting femtoscopic parameters of the system are measured as a function of collision centrality, pair rapidity (), and transverse momentum (). Measurements of the emission region characteristics not only at midrapidity but also at the backward/forward rapidity provide new information about the spatiotemporal structure of the source and make it possible to impose constraints on heavy-ion collision models.
2. Materials and Methods
2.1. The Correlation Function
Correlations of two particles with small relative momentum make it possible to extract information about the emission source. The size of the emission region is estimated by constructing a three-dimensional correlation function, , that is formed as a ratio of the two-particle relative momentum distributions. The numerator, , is formed using pairs where both particles originate from the same event, and the denominator, , is formed using the event mixing method [15,20] such that pairs are formed from particles from different events. It is constructed as
where is the relative momentum of the first and second particles from a pair, respectively. The numerator contains correlations due to quantum statistics (QS) and final state interactions (Coulomb and strong), while the denominator does not contain femtoscopic correlations.
The correlation function is sensitive to the spatiotemporal structure of the pion radiation source at kinetic freeze-out (the last stage of the collision evolution, when particles finish scattering on each other) and shows the size of the “homogeneity” region [39] from which particles fly out with the similar magnitude of velocities and direction. In this analysis, pairs of particles correspond to identical pions.
In the Bertsch–Pratt system [49,50], the relative momentum particle pair is projected into three directions, out, side, and long, as follows: is pointing along the average transverse momentum of the particle pair (), is pointing along the beam axis, and is perpendicular to the previous two. The analysis is performed in the longitudinal co-moving system (LCMS), where . The and are the projections of the momenta of the first and second particle onto the beam axis, respectively.
The Bowler–Sinyukov procedure [27,28,51] is used to account for the Coulomb interaction (the procedure is based on the separation of the Coulomb interaction from the effect of the quantum statistics) and fit the correlation function using:
where N is a normalization factor that scales the correlation function to a value of unity at large values of . The is a coefficient that characterizes the strength of femtoscopic correlations. In the two-particle correlation measurements, is also influenced by secondary particle decays, e.g., resonances, and experimental effects. is the squared like-sign particle pair Coulomb wave-function integrated over a spherical Gaussian source of the 5 fm radius. To estimate the systematic uncertainty, the Coulomb radius varied from 3 to 7 fm [52,53].
The term represents the Gaussian source function and can be described by the following equation:
where , , , , , and are components of femtoscopic radii. The cross terms , , and represent tilts of the correlation function in the , , and planes, respectively. In this analysis, has a nonzero value due to the asymmetry of the experimental acceptance with respect to the midrapidity, while and are zeroed due to symmetry. The is expected to be positive for positive pair rapidity, cross zero at midrapidity, and become negative for negative rapidity.
2.2. Experimental Setup and Analysis Details
Data from Au+Au collisions at = 3 GeV from the FXT program of the STAR experiment at RHIC were analyzed. The interaction probability between the beam and the target is 1% (determined using the inelastic Au+Au cross-section). The gold beam with an incident beam momentum of 3.85 GeV per nucleon collided with a gold target of thickness 1.93 g/cm2 (0.25 mm). The target was installed inside the vacuum pipe, 2 cm below its center, at a distance of 200.7 cm to the west of the center of the STAR detector.
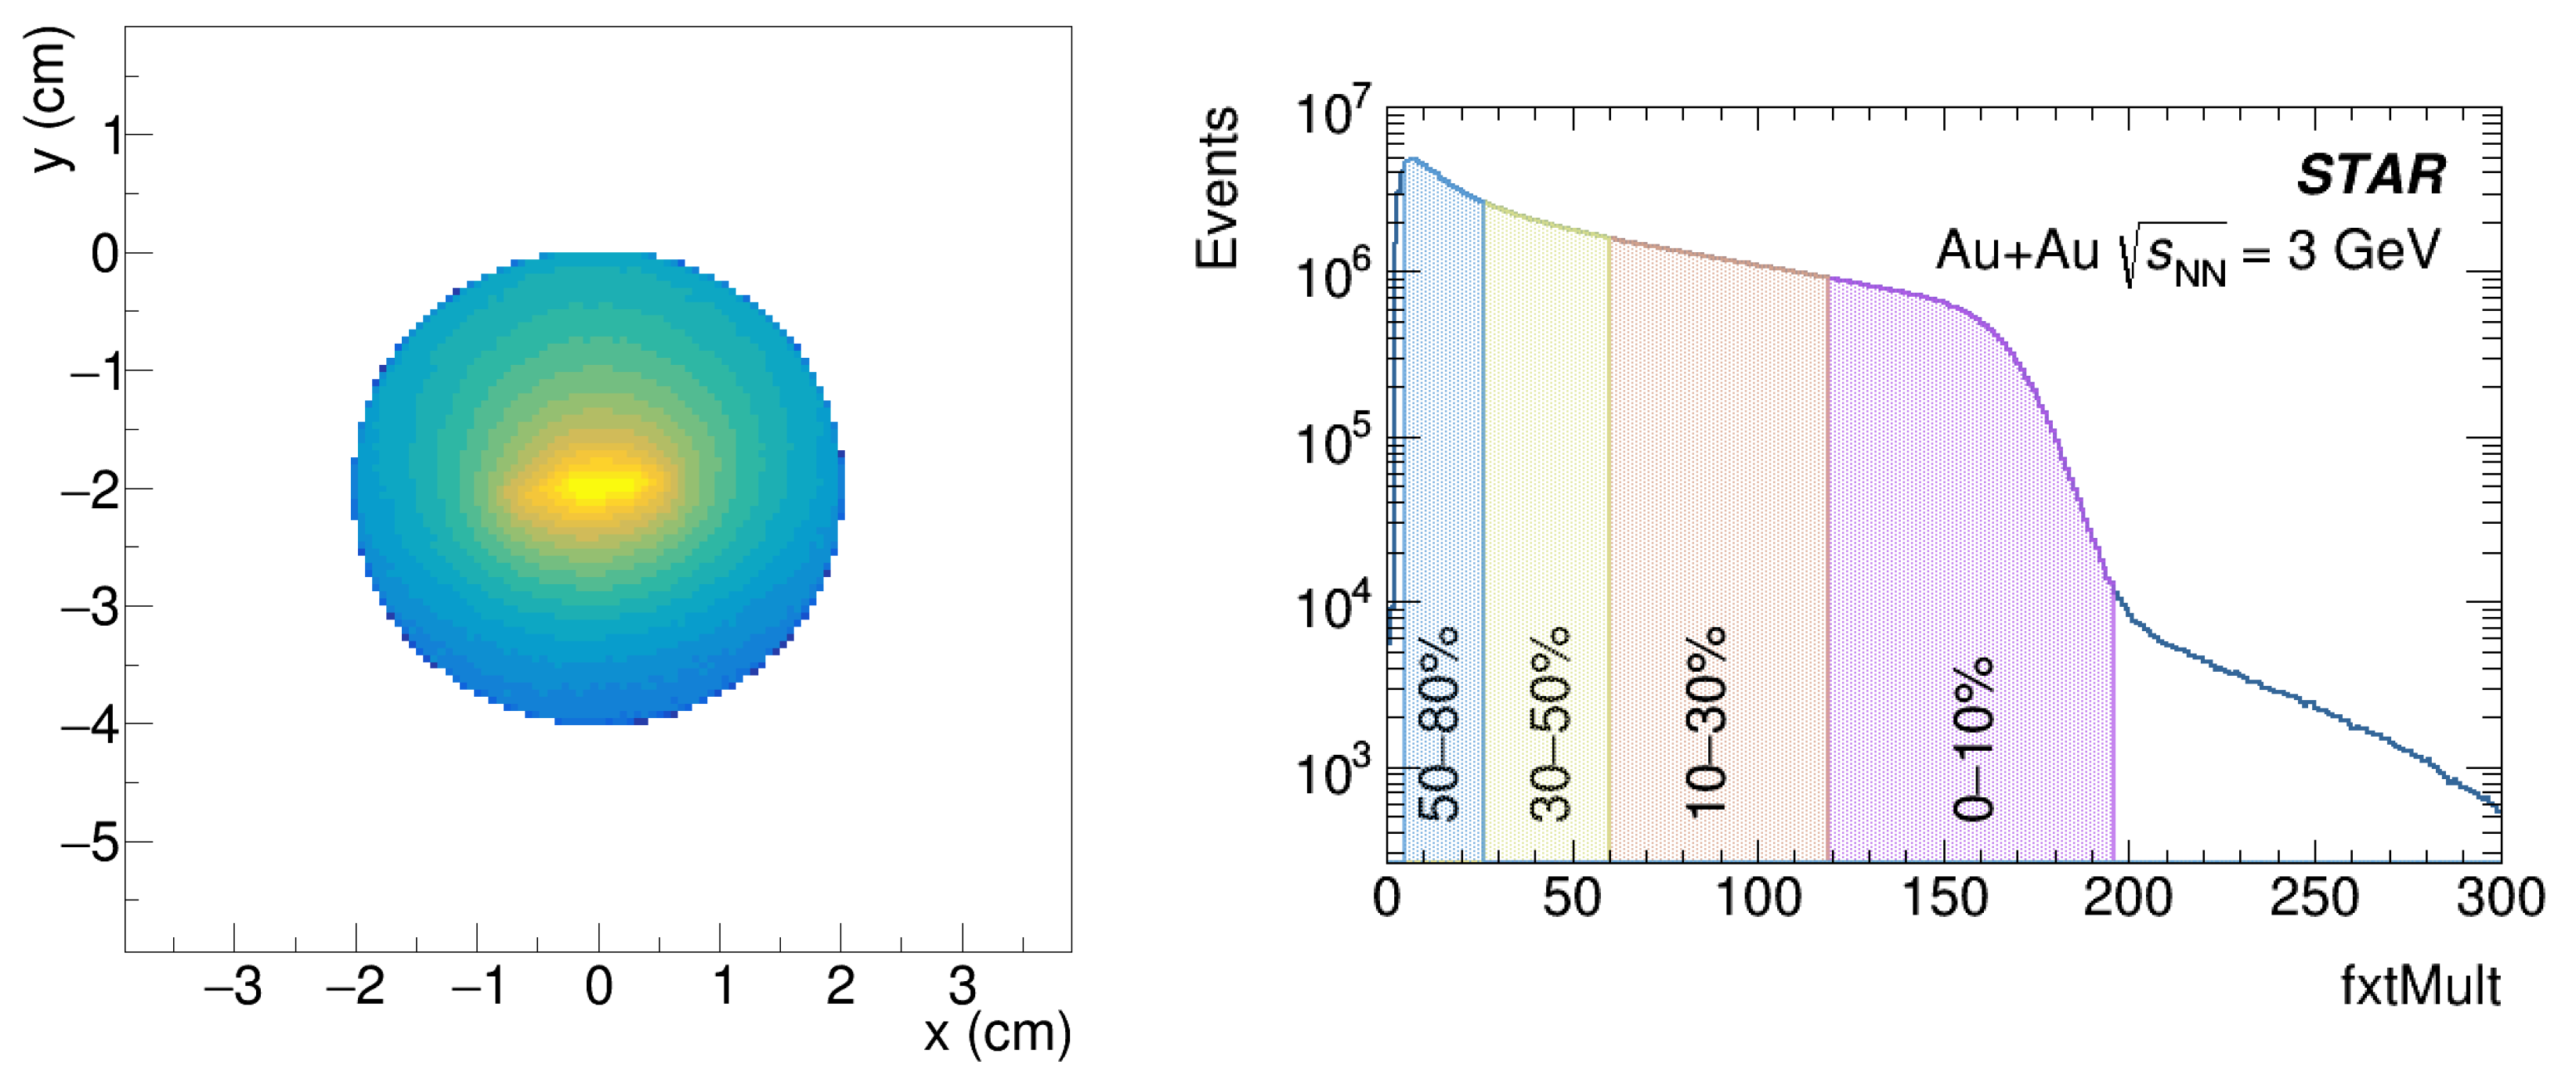
In this analysis, events with reconstructed primary vertex were selected using the following selection criteria: cm and cm, where is the vertex position along the beam direction and is the radial vertex position. The left panel in Figure 1 shows the distribution of the reconstructed position of the collision vertex in the XY plane.
Collision centrality is determined using the multiplicity of charged particles. To estimate centrality, primary tracks (tracks fitted to the reconstructed collision vertex) were used to determine the multiplicity of charged tracks (fxtMult) in the FXT program. The right panel of Figure 1 shows the fxtMult distribution. The shaded areas show the ranges for 0–10%, 10–30%, 30–50%, and 50–80% central collisions.
The following track selection criteria were used for the femtoscopic analysis: pseudorapidity , more than 15 ionization points inside the time projection chamber (TPC), and the distance of the closest approach (DCA) to the primary vertex is fewer than 3 cm. The latter was introduced to reduce the contribution of nonprimary pions.
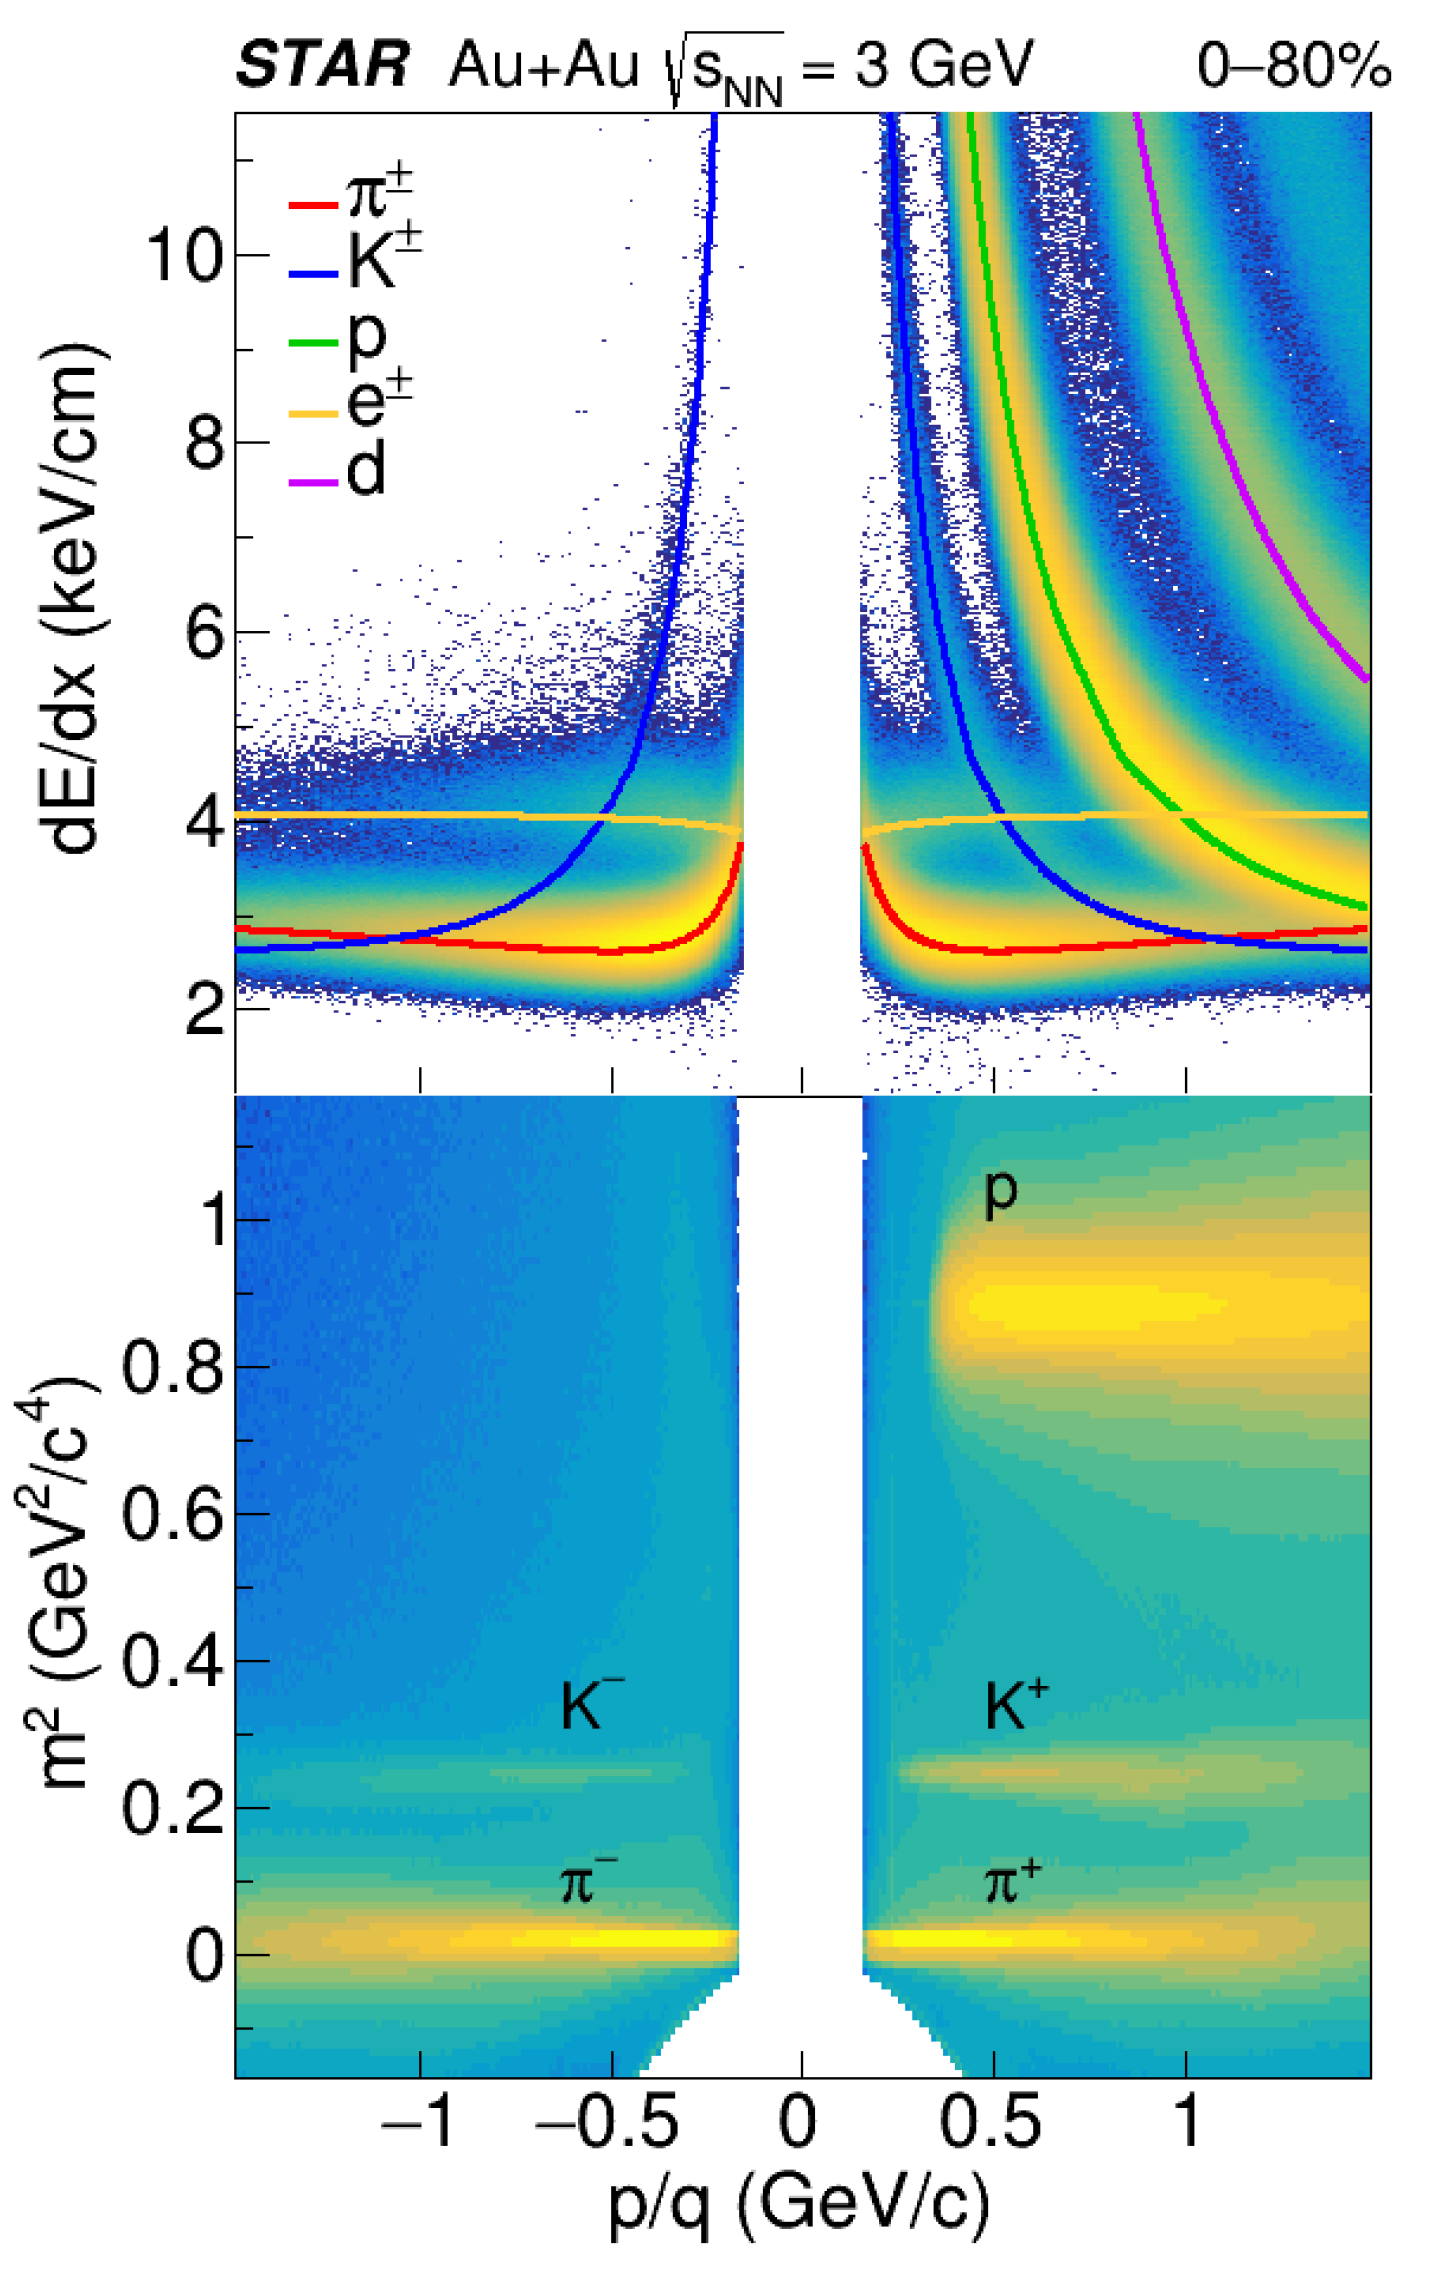
Particle identification was performed utilizing ionization losses in TPC and time of flight in TOF. Figure 2 shows the distribution of ionization energy loss, /, in TPC (top panel) and the distribution of particle mass squared estimated via time of flight (bottom panel). The lines indicate theoretical calculations of ionization energy loss for different particle species. The red, blue, green, yellow, and magenta lines correspond to , , p, , and d, respectively.
A combination of TPC and TOF was used in this analysis. In the region of low momentum ( GeV/c), particle identification was performed by measuring in the TPC for each track and comparing it with the expected value for each particle type i using the following equation:
where is the resolution of the TPC.
The following selection criteria were used to identify pions, , , which suppresses contamination to pions from other particles.
At higher particle momentum ( GeV/c), pions were selected using a combination of TPC and TOF. The particle tracks with and GeV2/, estimated via TOF ( is the particle velocity) were assumed to be pions. The single-pion purity was estimated to not be lower than 98%.
The correlation function is sensitive to detector effects such as track merging and splitting in the track reconstruction procedure. The former corresponds to the case when two tracks are reconstructed as one. The latter represents the case when one track is reconstructed as two with close momenta. Both effects distort the correlation function in the low relative momentum region. To assess how track splitting affects correlation functions, the concept of Splitting Level (SL) is introduced [52]:
where if only one track of a pair has a hit, if both tracks of a pair have hits, if no track has a hit in the detector plane. represent the sum of the hits of the two tracks. For this analysis, a constraint of was applied, which suppresses the effect of track splitting on the correlation function.
On the other hand, the track-merging effect also affects the correlation function of identical pions. The fraction of merged hits (FMH) between two tracks was used to estimate the effect of track merging. The particle pairs with (that mostly eliminate the effect) were analyzed.
The current femtoscopic analysis was dedicated to the two studies. First, we performed the rapidity-integrated analysis for pair transverse momentum ranges [0.15, 0.25], [0.25, 0.35], [0.35, 0.45], [0.45, 0.55], and [0.55, 0.65] GeV/c. In the second part, the femtoscopic correlations were studied for the one pair transverse momentum, , the interval of [0.15, 0.6] GeV/c, and for several pair rapidity () regions: [0, 0.2], [−0.2, 0], [−0.4, −0.2], [−0.6, −0.4], and [−0.8, −0.6]. Positively and negatively charged pion pairs are analyzed separately. Figure 3 shows the two-pion acceptance, where the dashed lines correspond to the pair rapidity and transverse momentum intervals used in the study. A shift of pair rapidity by ( for = 3 GeV) allows to boost the kinematics from the laboratory to the center of the mass frame.
To extract the femtoscopic parameters (, , , , ). Equation (2) was used to fit the correlation functions.
2.3. Systematic Uncertainty
The next sources of systematic uncertainty are considered in this work: radius variation in Coulomb interaction between particles, correlation function fit range, fraction of merged tracks (FMH), and the Splitting Level (SL). Table 1 shows default parameters and their variations.
The Barlow test was used to evaluate the total systematic uncertainty. Variations in parameters are denoted as , while the default values are marked as . The difference between and introduces a systematical uncertainty if its difference is larger than their statistical uncertainty difference:
Systematic uncertainty from the i-th source (for example, SL) for the j-th variation-passing Barlow test [54] is defined as
Systematic uncertainty from the i-th source (for example, SL) with m cut variations (for example, ; ) is:
The total systematical uncertainty from n systematic sources is calculated as follows:
Systematic uncertainties of femtoscopic parameters were calculated for each bin of centrality, , and . Table 2 shows sources of systematic uncertainty and its typical values.
3. Results
In the rapidity-integrated analysis, correlation functions were studied for several intervals ([0.15, 0.25], [0.25, 0.35], [0.35, 0.45], [0.45, 0.55], and [0.55, 0.65] GeV/c) and three centrality classes (0–10%, 10–30%, and 30–50% central Au+Au collisions). No constraint on pair rapidity was used. Correlation functions were constructed for positive and negative pion pairs. Equation (2) was used to fit correlation functions. Figure 4 shows an example of the correlation function and fit projections for pion pairs with GeV/c measured for 0–10% central collisions. Red and blue circles show projections of the three-dimensional correlation function onto the out, side, and long axes for and , respectively. The red and blue lines show the fit projections to the correlation functions of and , respectively. For each projection (, , ) shown, the other components of relative momentum are integrated over the range GeV/c.
Figure 5 shows the , , and as a function of for the 0–10% central collisions. , , and are shown as red, blue, and black markers, respectively. Filled and empty markers correspond to the negative and positive pion pairs, respectively. The shaded area represents systematic uncertainty estimated for each data point.
In the rapidity-differential analysis, correlation functions were constructed for different pair rapidity () intervals: [0, 0.2], [−0.2, 0], [−0.4, −0.2], [−0.6, −0.4], and [−0.8, −0.6] (see Figure 3) for GeV/c and 0–10%, 10–30%, 30–50% centrality classes. The femtoscopic parameters are extracted from fitting the Equation (2) to correlation functions. Figure 6 shows the , , , , and dependence on . Filled and open markers refer to negative and positive pion pairs, respectively. Black, red, and blue markers represent 0–10%, 10–30%, and 30–50% central collisions, respectively. Gray markers are the measured results mirrored with respect to the midrapidity (). Boxes represent systematic uncertainty values.
4. Discussion
Figure 4 shows an example of the correlation functions for and constructed for the most central collisions for the rapidity-integrated analysis. The peak of correlation functions for is larger than that for at GeV/c and for 0–10% central collisions. The difference between the extracted femtoscopic parameters for positive and negative pion pairs is most visible for and , which may be due to the influence of residual electric charge and different resonance decay contributions.
The extracted femtoscopic parameters (, , and ) are studied as a function of pair transverse momentum. The femtoscopic radii correspond to the lengths of homogeneity regions and decrease with increasing . This can be explained as a decrease in the particle emission region due to the transverse flow. A difference in the femtoscopic radii of positive and negative pions, extracted in the side and long projections, is observed.
Figure 6 shows rapidity dependence of femtoscopic parameters (, , , , and ) for 0–10%, 10–30%, and 30–50% central collisions. The , , and increase with moving away from the midrapidity, while follows the opposite trend. The values of , and are similar for and . The values of for are systematically larger than that for for all centrality classes and pair rapidity intervals studied. The represents the geometrical size of the particle emission source. Hence, negative pions are emitted from sources with larger sizes than those of positive pions. The is related to the particle emission duration. Different emission times are observed for positive and negative pions due to similar values of and different values of for and . The , , and increase from peripheral to central collisions reflecting the increase in the overlapping region of colliding nuclei.
The is found to be symmetric with respect to the and has negative and positive values for the negative and positive pair rapidities, respectively. Clear rapidity dependence of is observed due to the asymmetry of experimental acceptance in the longitudinal direction. Decreasing with pair rapidity, and having finite values and changing sign with respect to midrapidity, hints at the boost-invariance breaking.
5. Conclusions
We performed the femtoscopic analysis of positively and negatively charged pion pairs produced in Au+Au collisions at = 3 GeV measured by the STAR experiment at RHIC. Correlation functions of positive and negative pions were found to differ slightly at low pair transverse momentum, , which may be due to the interaction with residual electric charge or different resonance decay contributions. The , , and decrease with increasing transverse momentum of the pair due to the transverse flow. We present the first measurement of femtoscopic parameter dependence on the pair rapidity, , for 0–10%, 10–30%, and 30–50% central Au+Au collisions at = 3 GeV.
The is found to be negative for negative pair rapidities and positive for positive rapidities (crossing zero at midrapidity) due to the symmetry in the longitudinal direction. The decrease in with increasing pair rapidity, as well as the behavior of , manifests a hint of boost-invariance breaking.
The differs for positive and negative pion pairs, while the values are similar, which may indicate a longer emission time for positive pions.
Funding
This work was funded in part by the Ministry of Science and Higher Education of the Russian Federation, Project “New Phenomena in Particle Physics and the Early Universe” FSWU-2023-0073, and by the MEPhI Program Priority 2030.
Data Availability Statement
Data are contained within the article.
Acknowledgments
This work was partially performed using resources of the heterogeneous computing platform HybriLIT of JINR (LIT) (http://hlit.jinr.ru (accessed on 1 February 2024)) and NRNU MEPhI high-performance computing center. Authors are grateful to Richard Lednický for fruitful discussions.
Conflicts of Interest
The authors declare no conflicts of interest.
References
- Arsene, I. et al. [BRAHMS Collaboration] Quark Gluon Plasma an Color Glass Condensate at RHIC? The perspective from the BRAHMS experiment. Nucl. Phys. A 2005, 757, 1. [Google Scholar] [CrossRef]
- Adcox, K. et al. [PHENIX Collaboration] Formation of dense partonic matter in relativistic nucleus-nucleus collisions at RHIC: Experimental evaluation by the PHENIX collaboration. Nucl. Phys. A 2005, 757, 184. [Google Scholar] [CrossRef]
- Back, B.B.et al. [PHOBOS Collaboration] The PHOBOS perspective on discoveries at RHIC. Nucl. Phys. A 2005, 757, 28. [Google Scholar] [CrossRef]
- Adams, J. et al. [STAR Collaboration] Experimental and Theoretical Challenges in the Search for the Quark Gluon Plasma: The STAR Collaboration’s Critical Assessment of the Evidence from RHIC Collisions. Nucl. Phys. A 2005, 757, 102. [Google Scholar] [CrossRef]
- Cleymans, J.; Redlich, K. Chemical and thermal freeze-out parameters from 1A to 200A GeV. Phys. Rev. C 1999, 60, 054908. [Google Scholar] [CrossRef]
- Becattini, F.; Manninen, J.; Gazdzicki, M. Energy and system size dependence of chemical freeze-out in relativistic nuclear collisions. Phys. Rev. C 2006, 73, 044905. [Google Scholar] [CrossRef]
- Andronic, A.; Braun-Munzinger, P.; Stachel, J. Hadron production in central nucleus-nucleus collisions at chemical freeze-out. Nucl. Phys. A 2006, 772, 167. [Google Scholar] [CrossRef]
- Rajagopal, K.; Wilczek, F. The Condensed Matter Physics of QCD. arXiv 2000, arXiv:hep-ph/0011333. [Google Scholar]
- Laermann, E.; Philipsen, O. The Status of Lattice QCD at Finite Temperature. Ann. Rev. Nucl. Part. Sci. 2003, 53, 163. [Google Scholar] [CrossRef]
- Stephanov, M. QCD phase diagram: An overview. In Proceedings of the 24th International Symposium on Lattice Field Theory (Lattice 2006), Tucson, AZ, USA, 23–28 July 2006. [Google Scholar]
- Aggarwal, M.M. et al. [STAR Collaboration] An Experimental Exploration of the QCD Phase Diagram: The Search for the Critical Point and the Onset of Deconfinement. arXiv 2010, arXiv:1007.2613. [Google Scholar]
- Ackermann, K. et al. [STAR Collaboration] STAR detector overview. Nucl. Instrum. Meth. A 2003, 499, 624. [Google Scholar] [CrossRef]
- Boal, D.; Gelbke, C.; Jennings, B. Intensity interferometry in subatomic physics. Rev. Mod. Phys. 1990, 62, 553. [Google Scholar] [CrossRef]
- Bauer, W.; Gelbke, C.; Pratt, S. Hadronic interferometry in heavy ion collisions. Annu. Rev. Nucl. Part. Sci. 1992, 42, 77. [Google Scholar] [CrossRef]
- Heinz, U.; Jacak, B. Two-Particle Correlations in Relativistic Heavy-Ion Collisions. Annu. Rev. Nucl. Part. Sci. 1999, 49, 529. [Google Scholar] [CrossRef]
- Wiedemann, U.; Heinz, U. Particle Interferometry for Relativistic Heavy-Ion Collisions. Phys. Rep. 1999, 319, 145. [Google Scholar] [CrossRef]
- Csorgo, T. Particle Interferometry from 40 MeV to 40 TeV. Heavy Ion Phys. 2002, 15, 1. [Google Scholar]
- Alexander, G. Bose-Einstein and Fermi-Dirac Interferometry in Particle Physics. Rep. Prog. Phys. 2003, 66, 481. [Google Scholar] [CrossRef]
- Goldhaber, G.; Goldhaber, S.; Lee, W.; Pais, A. Influence of Bose-Einstein Statistics on the Antiproton-Proton Annihilation Process. Phys. Rev. 1960, 120, 300. [Google Scholar] [CrossRef]
- Kopylov, G.; Podgoretsky, M. Correlations of identical particles emitted by highly excited nuclei. Sov. J. Nucl. Phys. 1972, 15, 219. [Google Scholar]
- Kopylov, G.; Lyuboshits, V.; Podgoretsky, M. Correlations between the Particles Which Have Small Relative Momenta; Communications of the Joint Institute for Nuclear Research: Dubna, Russia, 1974; JINR-P2-8069. [Google Scholar]
- Kopylov, G.; Podgoretsky, M. Multiple production and interference of particles emitted by moving sources. Sov. J. Nucl. Phys. 1974, 18, 336. [Google Scholar]
- Kopylov, G. Like particle correlations as a tool to study the multiple production mechanism. Phys. Lett. B 1974, 50, 472. [Google Scholar] [CrossRef]
- Koonin, S.E. Proton pictures of high-energy nuclear collisions. Phys. Lett. B 1977, 70, 43. [Google Scholar] [CrossRef]
- Gyulassy, M.; Kauffmann, S.K.; Wilson, L.W. Pion interferometry of nuclear collisions. I. Theory. Phys. Rev. C 1979, 20, 2267. [Google Scholar] [CrossRef]
- Lednicky, R.; Lyuboshitz, V. Final state interaction effect on pairing correlations between particles with small relative momenta. Sov. J. Nucl. Phys. 1982, 35, 770. [Google Scholar]
- Bowler, M.G. Coulomb corrections to Bose-Einstein corrections have greatly exaggerated. Phys. Lett. B 1991, 270, 69–74. [Google Scholar] [CrossRef]
- Sinyukov, Y.M.; Lednicky, R.; Akkelin, S.V.; Pluta, J.; Erazmus, B. Coulomb corrections for interferometry analysis of expanding hadron systems. Phys. Lett. B 1998, 432, 248. [Google Scholar] [CrossRef]
- Adamczyk, L. et al. [The STAR Collaboration] Measurement of interaction between antiprotons. Nature 2016, 527, 345. [Google Scholar]
- Fabbietti, L.; Sarti, V.M.; Vazquez Doce, O. Study of the Strong Interaction Among Hadrons with Correlations at the LHC. Annu. Rev. Nucl. Part. Sci. 2021, 71, 377. [Google Scholar] [CrossRef]
- Lednicky, R.; Lyuboshitz, V.L.; Erazmus, B.; Nouais, D. How to measure which sort of particles was emitted earlier and which later. Phys. Lett. B 1996, 373, 30. [Google Scholar] [CrossRef]
- Voloshin, S.; Lednicky, R.; Panitkin, S.; Xu, N. Relative space-time asymmetries in pion and nucleon production in noncentral nucleus-nucleus collisions at high energies. Phys. Rev. Lett. 1997, 79, 4766. [Google Scholar] [CrossRef]
- Ardouin, D.; Soff, S.; Spieles, C.; Bass, S.A.; Stöcker, H.; Gourio, D.; Schramm, S.; Greiner, C.; Lednicky, R.; Lyuboshit, V.L.; et al. Unlike particle correlations and the strange quark matter distillation process. Phys. Lett. B 1999, 446, 191. [Google Scholar] [CrossRef]
- Adams, J. et al. [STAR Collaboration] Identified Particle Distributions in pp and Au+Au Collisions at = 200 GeV. Phys. Rev. Lett. 2004, 92, 112301. [Google Scholar] [CrossRef] [PubMed]
- Adamczyk, L. et al. [STAR Collaboration] Freeze-out dynamics via charged kaon femtoscopy in = 200 GeV central Au+Au collisions. Phys. Rev. C 2013, 88, 034906. [Google Scholar] [CrossRef]
- Afanasiev, S. et al. [PHENIX Collaboration] Kaon Interferometric Probes of Space-Time Evolution in Au + Au Collisions at = 200 GeV. Phys. Rev. Lett. 2009, 103, 142301. [Google Scholar] [CrossRef] [PubMed]
- Lisa, M.A.; Pratt, S.; Soltz, R.; Wiedemann, U. Femtoscopy in relativistic heavy ion collisions. Annu. Rev. Nucl. Part. Sci. 2005, 55, 357. [Google Scholar] [CrossRef]
- Aamodt, K. et al. [ALICE Collaboration] Two-pion Bose–Einstein correlations in central Pb-Pb collisions at = 2.76 TeV. Phys. Lett. B 2011, 696, 328. [Google Scholar] [CrossRef]
- Akkelin, S.; Sinyukov, Y. The HBT interferometry of expanding sources. Phys. Lett. B 1995, 356, 525. [Google Scholar] [CrossRef]
- Acharya, S. et al. [ALICE Collaboration] Kaon femtoscopy in Pb-Pb collisions at = 2.76 TeV. Phys. Rev. C. 2017, 96, 064613. [Google Scholar] [CrossRef]
- Adam, J. et al. [ALICE Collaboration] Centrality dependence of the pseudorapidity density distribution for charged particles in Pb-Pb collisions at = 5.02 TeV. Phys. Lett. B 2017, 772, 567–577. [Google Scholar] [CrossRef]
- Bjorken, J. Highly relativistic nucleus-nucleus collisions: The central rapidity region. Phys. Rev. D 1983, 27, 140. [Google Scholar] [CrossRef]
- Bearden, I. et al. [NA44 Collaboration] Two Kaon Correlations in Central Pb+Pb Collisions at 158 AGeV/c. Phys. Rev. Lett. 2001, 87, 112301. [Google Scholar] [CrossRef] [PubMed]
- Afanasiev, S. et al. [NA49 Collaboration] Bose-Einstein correlations of charged kaons in central Pb+Pb collisions at E(beam) = 158 GeV per nucleon. Phys. Lett. B 2003, 557, 157. [Google Scholar] [CrossRef]
- Adamova, D. et al. [CERES Collaboration] Beam energy and centrality dependence of two pion Bose-Einstein correlations at SPS energies. Nucl. Phys. A. 2003, 714, 124. [Google Scholar] [CrossRef]
- Aamodt, K. et al. [ALICE Collaboration] Charged-Particle Multiplicity Density at Midrapidity in Central Pb-Pb Collisions at = 2.76 TeV. Phys. Rev. Lett. 2010, 105, 252301. [Google Scholar] [CrossRef] [PubMed]
- Kestin, G.; Heinz, U. Hydrodynamic radial and elliptic flow in heavy-ion collisions from AGS to LHC energies. Eur. Phys. J. C 2009, 61, 545. [Google Scholar] [CrossRef]
- Niemi, H.; Eskola, K.; Ruuskanen, P. Elliptic flow in nuclear collisions at ultrarelativistic energies available at the CERN Large Hadron Collider. Phys. Rev. C. 2009, 79, 024903. [Google Scholar] [CrossRef]
- Bertsch, G.; Brown, G.; Koch, V.; Li, B. Pion collectivity in relativistic heavy-ion collisions. Nucl. Phys. A 1988, 490, 3. [Google Scholar] [CrossRef]
- Pratt, S. Pion Interferometry for Exploding Sources. Phys. Rev. Lett. 1984, 53, 1219. [Google Scholar] [CrossRef]
- Bowler, M. Extended sources, final state interactions and Bose-Einstein correlations. Z. Phys. C 1988, 39, 81. [Google Scholar] [CrossRef]
- Adams, J. et al. [STAR Collaboration] Pion interfrometry in Au+Au collisions at = 200 GeV. Phys. Rev. C 2005, 71, 044906. [Google Scholar] [CrossRef]
- Abdallah, M. et al. [STAR Collaboration] Flow and interferometry results from Au+Au collisions at = 4.5 GeV. Phys. Rev. C 2021, 103, 034908. [Google Scholar] [CrossRef]
- Barlow, R. Systematic Errors: Facts and fictions. arXiv 2002, arXiv:hep-ex/0207026. [Google Scholar]
Figure 1.
(Left panel) collision vertex in the XY plane. (Right panel) the fxtMult distribution.

Figure 2.
(Top panel) the particle identification using ionization energy loss, /, in the TPC. (Bottom panel) the particle identification using from TOF.
Figure 2.
(Top panel) the particle identification using ionization energy loss, /, in the TPC. (Bottom panel) the particle identification using from TOF.

Figure 3.
Acceptance of positively (left panel) and negatively (right panel) charged pion pairs for Au+Au collisions at = 3 GeV. Dashed lines denote the selected rapidity windows for the rapidity-differential analysis.
Figure 3.
Acceptance of positively (left panel) and negatively (right panel) charged pion pairs for Au+Au collisions at = 3 GeV. Dashed lines denote the selected rapidity windows for the rapidity-differential analysis.

Figure 4.
Correlation functions of positive (red markers) and negative (blue markers) pions with a centrality of 0–10% in the range GeV/c at = 3 GeV in Au+Au collisions. In each case, the other components are projected over GeV/c. Error bars represent statistical uncertainty.
Figure 4.
Correlation functions of positive (red markers) and negative (blue markers) pions with a centrality of 0–10% in the range GeV/c at = 3 GeV in Au+Au collisions. In each case, the other components are projected over GeV/c. Error bars represent statistical uncertainty.

Figure 5.
Extracted pion source radii () as a function of the for the 0–10% central Au+Au collisions at = 3 GeV.
Figure 5.
Extracted pion source radii () as a function of the for the 0–10% central Au+Au collisions at = 3 GeV.

Figure 6.
The (a), (b), (c), (d), and (e) as a function of pair rapidity (). The values for 0–10%, 10–30%, and 30–50% centrality classes of Au+Au collisions at = 3 GeV are depicted as black circles, red triangles, and blue squares, respectively. Filled markers represent the data for and empty markers correspond to .


Table 1.
Systematic sources and their variations.
| Systematic Source | Default | Variations |
|---|---|---|
| Splitting Level (SL) | ; | |
| Fraction of merged tracks (FMH) | ; | |
| Fit range | ; | |
| Coulomb radius | 5 fm | 3 fm; 7 fm |
Table 2.
Sources of systematic uncertainty and its typical values.
| Systematic Source | |||
|---|---|---|---|
| Splitting Level (SL) | |||
| Fraction of merged tracks (FMH) | |||
| Fitting range | |||
| Coulomb radius | |||
| Total |
Disclaimer/Publisher’s Note: The statements, opinions and data contained in all publications are solely those of the individual author(s) and contributor(s) and not of MDPI and/or the editor(s). MDPI and/or the editor(s) disclaim responsibility for any injury to people or property resulting from any ideas, methods, instructions or products referred to in the content. |
© 2024 by the author. Licensee MDPI, Basel, Switzerland. This article is an open access article distributed under the terms and conditions of the Creative Commons Attribution (CC BY) license (https://creativecommons.org/licenses/by/4.0/).
Share and Cite
MDPI and ACS Style
Kraeva, A., on behalf of the STAR Collaboration.
Two-Pion Bose–Einstein Correlations in Au+Au Collisions at
AMA Style
Kraeva A on behalf of the STAR Collaboration.
Two-Pion Bose–Einstein Correlations in Au+Au Collisions at
Kraeva, Anna on behalf of the STAR Collaboration.
2024. "Two-Pion Bose–Einstein Correlations in Au+Au Collisions at
Note that from the first issue of 2016, this journal uses article numbers instead of page numbers. See further details here.