1. Introduction
Probing the variation of nature’s fundamental constants (such as the fine structure constant,
), through the analysis of absorption spectra, is one of the most direct ways of testing the universality of physical laws. Interactive methods for analysing high-resolution quasar spectra of heavy element absorption systems are complex and require considerable expertise. Recently, we presented a new “artificial intelligence” method for the analysis of high-resolution absorption spectra [
1]. Our new method unifies three established numerical methods: a genetic algorithm (GVPFIT); non-linear least-squares optimisation with parameter constraints (VPFIT); and Bayesian Model Averaging (BMA).
This method requires evaluation before being applied to the analysis of large sets of absorption spectra. In particular, it is unknown how the accuracy of GVPFIT and BMA is effected by the complexity of an absorption systems velocity structure. We investigate the performance of GVPFIT and BMA over a broad range of velocity structure complexities using synthetic spectra. This is the first time a sample of synthetic spectra has been used to investigate how we analyse quasar absorption spectra. Using synthetic spectra, we can provide stringent tests of the modelling process. When analysing spectral data, one cannot uniquely determine the velocity structure of the absorbing cloud and the physical parameters are unknown. In contrast, with synthetic spectra, the underlying (real) velocity structure and input parameters are uniquely determined. By directly comparing our models, parameter estimates, and statistical uncertainties with the underlying (real) velocity structures and input values, we can establish the stability, precision and accuracy of our approach over a broad range of complexity levels in the velocity structure. Such an investigation was previously infeasible due to the time-consuming nature of the interactive method of absorption spectra analysis.
2. Method
We previously applied GVPFIT and BMA to the analysis of a high signal-to-noise, high spectral resolution and complex absorption system at
towards J110325-264515 [
1]. In this analysis, GVPFIT was iterated for over 80 generations and generated a large database of candidate models over a broad range of model complexity. From this large database, we selected 37 models each corresponding to the minimum-
model with 1 through 37 velocity components, where
is the Akaike Information Criteria corrected for small sample size (see [
2,
3] and Equation (
1)). We go up to 37 because a 37-component model corresponded to the minimum-
model for the real data.
For each of these 37 models, we utilised the Voigt profile parameters to generate a synthetic spectra, with
set to zero. The appropriate VPFIT
1 output was applied to generate the synthetic models, and hence we convolved the synthetic spectra using the same instrumental profile as the real spectra. Using the actual error arrays from the real spectra, we assigned a Gaussian standard deviation to each pixel and used the Box–Muller transform approach [
4] to add noise to the synthetic spectra. The real spectra have multiple observations at different epochs and instrumental settings (see [
1] Table 2); we generated synthetic spectra corresponding to all of these for each of the selected 37 models. Thus, the synthetic spectra emulate the characteristics of the real spectra of this absorption system.
We then treated the synthetic spectra described above as if they were real spectra as described in [
1]. To each spectra, we applied GVPFIT generating a large set of models to the synthetic spectra. The synthetic spectra were both created and fitted using turbulent b-parameters and using the same atomic data. We then estimated
using BMA, with
providing the relative likelihood used to weight the contribution of each model. In this method,
provides a measure of the relative quality of a model, based on a balance of goodness-of-fit (chi-squared) against the complexity (number of components compared to the number of data points) of each model. We define
in the normal way ([
2,
3])
where
k is the number of free parameters and
n is the number of data points. Statistical uncertainties are determined from the diagonal terms of the covariance matrix at the best-fitting solution.
3. Results
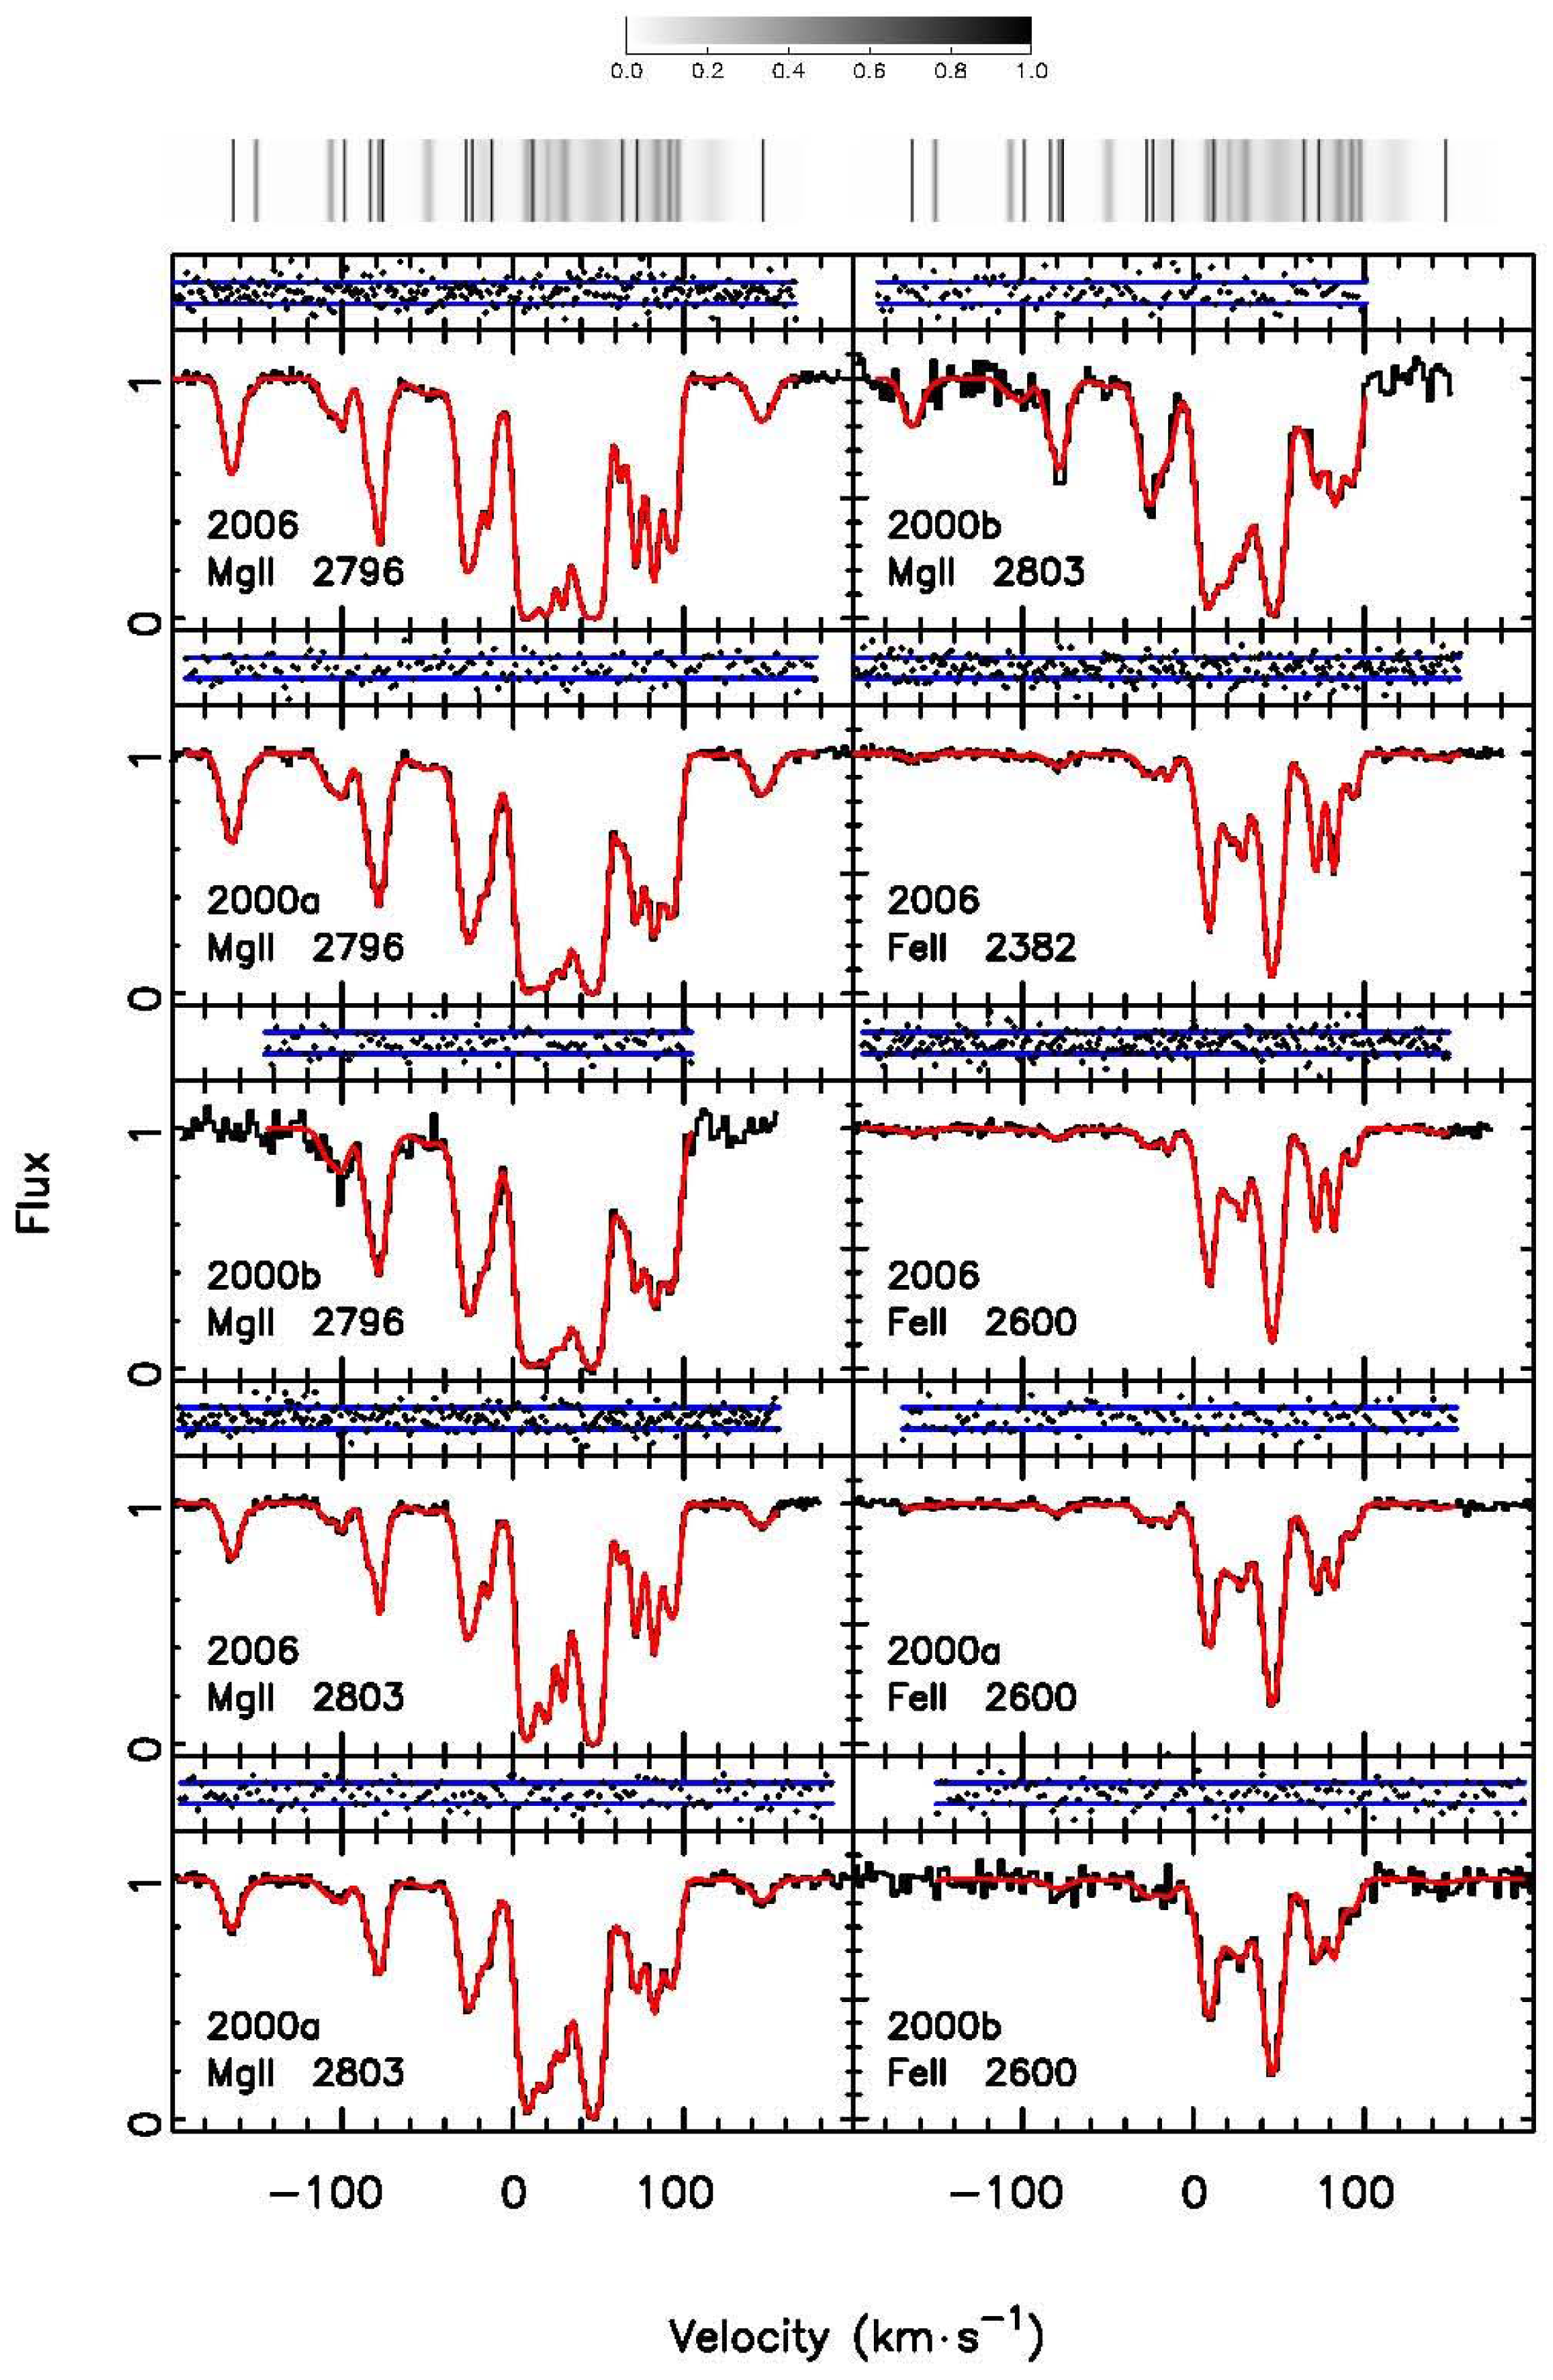
The new “artificial intelligence” method, GVPFIT and BMA, results in excellent fits to the synthetic spectra. As an example,
Figure 1 and
Figure 2 illustrate the BMA model for the most complex synthetic spectrum we analysed, with 37 underlying (real) velocity components. These figures show the residuals are well behaved and there are no discrepancies between the data and the model. The BMA model is determined by summing over all models for each pixel in the data, with the contribution of each model being weighted by its relative likelihood using
(using Equations (7) and (13) from [
1]):
such that
is the weight of model
j.
Similarly, the relative likelihood of velocity components at each pixel is determined by summing the probability density function of each redshift parameter from each component in all models, weighted by relative likelihood using
(Equation (
2)).
For the most complex synthetic spectra, the 37 underlying (real) velocity components represent a total of 148 Voigt profile parameters, with each component contributing four Voigt profile parameters: FeII and MgII column densities, redshift and Doppler broadening
b-parameter. When we compared the minimum-
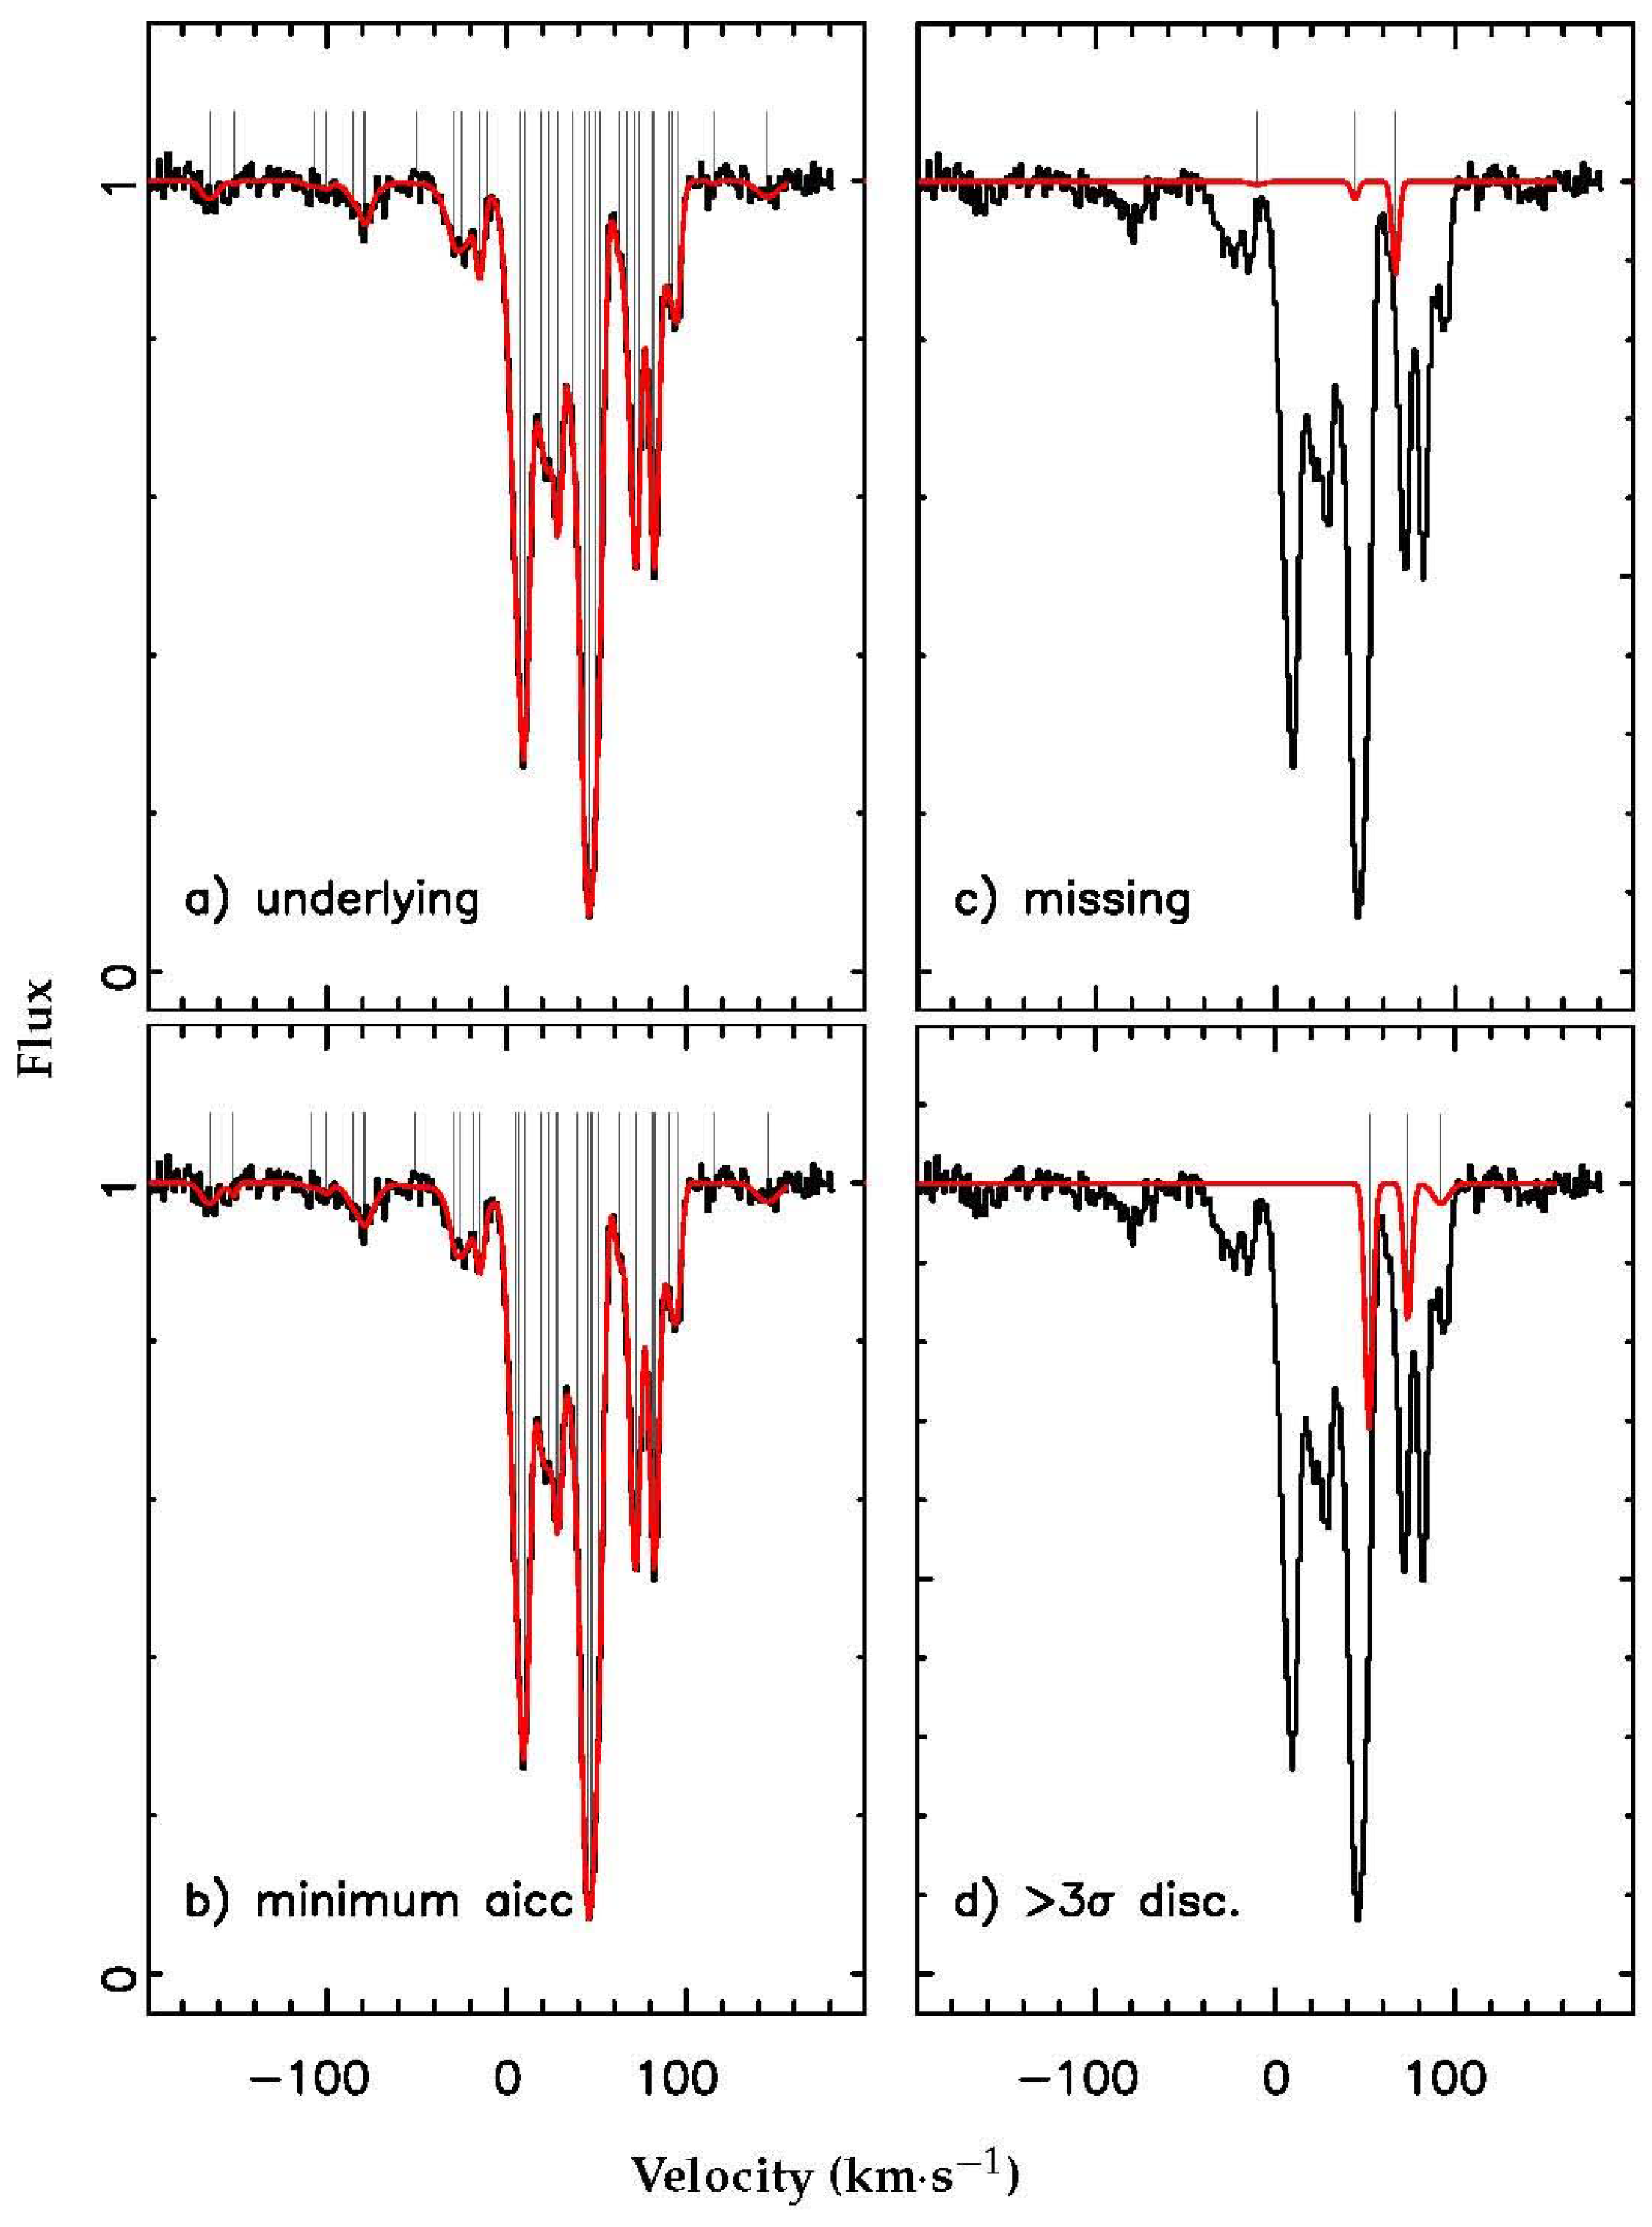
model to the underlying (real) model, we found that 136 parameters, or 91.9%, were identified. GVPFIT failed to identify three velocity components, and inaccurately estimated (discrepancies of >3
in at least one Voigt profile parameter, using the statistical uncertainties determined from the diagonal terms of the covariance matrix at the best-fitting solution) a further three velocity components. This is illustrated in
Figure 3. The missing components are among the weakest components in the underlying model and are surrounded by stronger components, while the inaccurately estimated components are weak compared to the surrounding velocity components and occur in regions of dense absorption. This trend is repeated throughout the entire set of 37 synthetic spectra, with GVPFIT identifying 653, or 92.9%, of the 703 underlying (real) velocity components. Additionally, four spurious (extra) weak velocity components were introduced in the GVPFIT process that were not present in the original models.
GVPFIT recovered the underlying (real)
for the synthetic spectra in our sample.
Figure 4 illustrates the
estimates of all models generated by GVPFIT for each of the synthetic spectra with 34, 35, 36 and 37 underlying velocity components. A clear plateau is seen at
, the underlying (real) value. At lower generations, i.e., when the models are under-fit, we see conspicuous departures from zero.
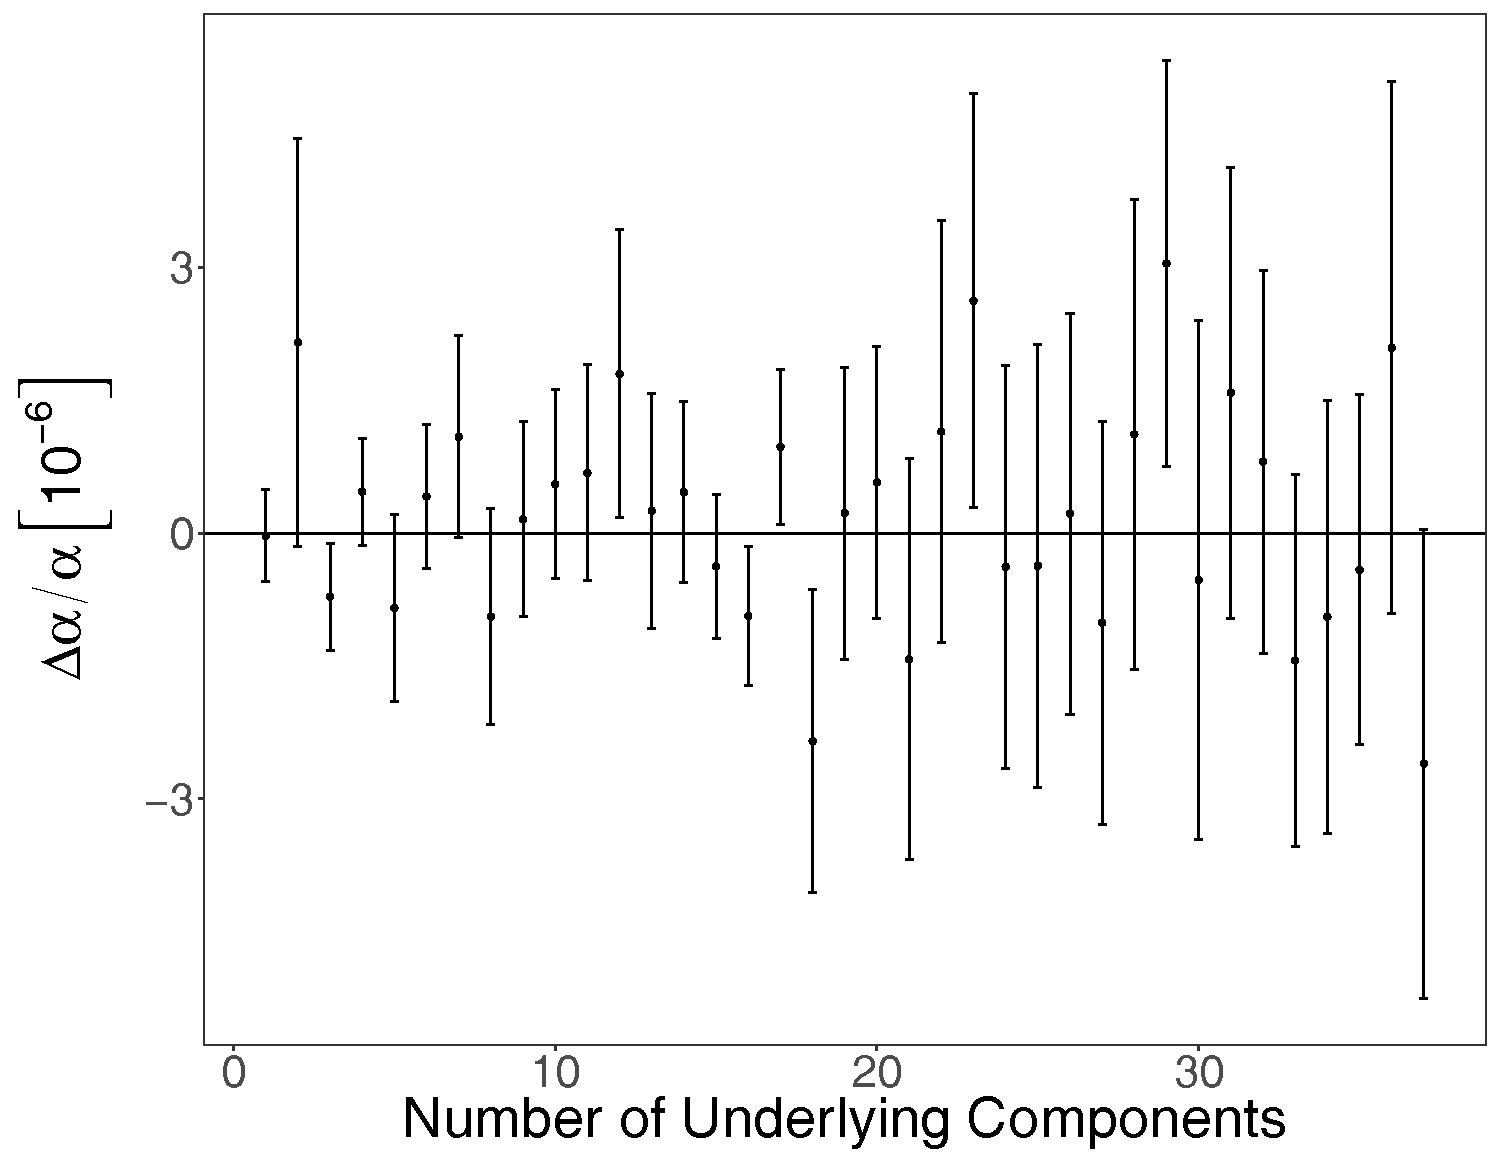
Figure 5 plots the BMA estimates of
for the sample of 37 synthetic spectra. The inverse-variance weighted mean is
. This is consistent with zero, as expected given that the underlying (real) value of
is zero for these synthetic spectra, and hence we found no evidence of a systematic bias.
Figure 5 also shows that the statistical uncertainties grow as the absorption system complexity increases, as would be expected, and this is consistent with absorption systems with similar quality spectral data and numbers of components from previous analyses [
5,
6,
7,
8]. For example, the statistical uncertainty from the analysis of the (real) spectral data for this system in King et al. (2012) [
8] is
(with 14 velocity components and using less spectral data and different transitions) and in Bainbridge and Webb (2017) [
1] is
(with 37 velocity components).
4. Discussion
We found that the method described in Bainbridge and Webb [
1], GVPFIT and BMA, recovers the velocity structures of absorption systems and accurately estimates
over a broad range of velocity structures.
GVPFIT recovered almost all the underlying (real) Voigt profile parameters from the synthetic spectra (see
Figure 3). The velocity components that GVPFIT missed or inaccurately estimated are weak and occur in locations of dense absorption. We believe that it is unlikely that a human interactively fitting this set of synthetic spectra would perform better than GVPFIT.
Figure 4 shows interesting characteristics in the evolution of
, similar to those seen by Bainbridge and Webb [
1] in the real spectra of the
absorption system towards J110325-264515. There appears to be an underlying linear trend in the evolution of
, with occasional conspicuous departures (see
Figure 4). These conspicuous departures exhibit a dramatic shift in
over a small change in complexity. Previous interactive methods, relying on a single “best-fit” model, lack this broad picture of how
evolves with velocity structure and may lead to a spurious estimate of
.
These results also highlight the importance of having an accurate spectra error estimate. The spectral error estimate heavily influences the statistics of the fitting process, as an incorrect spectral error can artificially increase or decrease the chi-squared “goodness-of-fit” statistic for a model and influence or any similar statistical criteria. This can lead to incorrectly estimating the number of components that are required to adequately fit the data and, as we have shown, have a large impact on the final estimate of .
Future work will increase the sample size, include a more diverse set of velocity structures and refine the method used to generate noise for the synthetic spectra. The sample of synthetic spectra used in this paper is small. Ideally, a study of this type would consist of 1000s of synthetic spectra and the automated nature of the new “artificial intelligence” method lends itself to analysing large samples. A larger sample will allow us to increase the precision of our analysis by reducing the uncertainty on our weighted mean and probe for any smaller systematic bias. For example, a similar sample consisting of 1000 synthetic spectra should allow us to estimate the weighted mean below . In addition, we would like to include synthetic spectra based on a broader range of real absorption systems, to show that this method is generalizable to a larger range of velocity structures, data qualities and combinations of species.
In addition, we expect that a more refined analysis will allow us to optimise our approach. In this work, we generate Gaussian noise using the error array from (real) spectral data. However, in spectral data, the noise is not of Gaussian nature near zero flux and the noise in adjacent pixels is not independent. At the current level of precision with which is being probed, these effects may become important.
However, we believe that this work is an important contribution, giving initial indications that this new method is accurate and unbiased. The size of this sample is adequate to show there is no evidence of bias in
, when using our method, at the
level under ideal circumstances (correct spectral error, high signal to noise and high resolution). This level of precision is two orders of magnitude smaller than the systematic uncertainty estimated in previous analyses of real spectral data (for example in [
8]
is approximately
, using almost eight times the number of absorption systems). In addition, although GVPFIT is automated, the analysis still requires time and computing resources; time and resources which otherwise could be used to analyse (real) spectral data instead of synthetic spectra. Future work will extend these results, consider non-ideal circumstances and apply this approach to (real) spectral data.
Studies such as this one are required to test the new method of GVPFIT and BMA before being applied to the analysis of large sets of data. This is the first time that synthetic spectra have been utilised to evaluate how we analyse absorption spectra. One of the main limiting factors in the use of absorption spectra to probe fundamental physics is the human interaction required during the interactive modelling process. This human interaction involves many complex decisions, considerable expertise and can be very time-consuming for even a single moderately complex absorption system, such as a typical damped Lyman-
absorption system (such as [
9]). Furthermore, the end result can be somewhat unreliable, with the literature providing many examples of fits to absorption systems which are clearly inadequate. Much time is devoted to echelle spectroscopy of quasars on large optical telescopes and considerable amounts of spectra exist in telescope archives which remain unpublished, or which have only partially been analysed, representing a great deal of valuable scientific information. With new instruments constantly being developed, such as ESPRESSO, the quality and quantity of available quasar echelle spectra are only going to increase.
Since the new method presented in Bainbridge and Webb (2017) [
1] removes the previously required human interaction, we can begin to analyse the ever-increasing number of quasar echelle spectra more efficiently and undertake projects that were previously unrealistic. One example of this is modelling both thermally and turbulently broadened models for each absorption system independently, allowing a more reliable comparison between models and data. The development and testing of this new “artificial intelligence” method (GVPFIT and BMA) are key to moving past the limiting factor of human interaction and open the way for projects that were previously unrealistic.


