1. Introduction
What is the behavior of matter when we increase its density? The observed densities of our world expand over many orders of magnitude, from ∼ nucleons/cm on average in our universe to ∼ nucleons/cm inside a nucleus and nucleons/cm in a neutron star. The study of the high density limit, specifically the confinement transition from hadrons to quarks and gluons can be regarded as the place where a high energy collision (two body) probes the short range limit and therefore meets the thermodynamics (many body) of this short distance dynamics.
In the case of Quantum-Chromo-Dynamics () we have confinement, which means the color field is confined to a small space region, forming hadrons which are colorless bound states of colored quarks. In the confining phase the quarks are dressed with gluons, acquiring an effective constituent mass up to 300 MeV (1/3 of the proton mass). For light quarks the constituent mass is much larger than the mass appearing in the Lagrangian which is close to zero. In other words the light quark mass in the confined phase is generated by the confinement interaction and when deconfinement occurs the additional mass disappears.
The lattice QCD studies have shown, that at baryon chemical density
∼ 0, color deconfinement and chiral symmetry restoration coincide. Hence, in a medium of low baryon density, the mass of the constituent quark vanishes at the deconfinement point
and also the screening radius of the gluon cloud size vanishes. At low
T and high
, there is no reason to expect a similar behavior and probably there may be an intermediate region of massive dressed quarks between the hadronic phase and the deconfined and chiral symmetry restoration phase. At low
T and high
, other possibilities could exist such as quarkyonic matter and color superconductivity [
1,
2]. A possible phase diagram is shown in
Figure 1 [
3].
The energy density of quark-gluon matter at a temperature
T is given by
where
,
and
are the degeneracy numbers of the gluons, quarks and antiquarks. For two flavors the total number of degrees of freedom (DOF) ∼37.
Quantitative predictions have not been evaluated using experimental data from high energy heavy ion collisions. In one of the recent article several big questions regarding the formation of QGP have been posed [
4]. The two most interesting problems are the determination of temperature and the thermalization in
and
collisions. The central challenge of this paper is to obtain the thermodynamics of the
from data and compare with the predictions of lattice QCD results. There are other review articles in the literature on the deconfinement both in
and
collisions [
5,
6,
7].
2. High Energy Nuclear Collisions
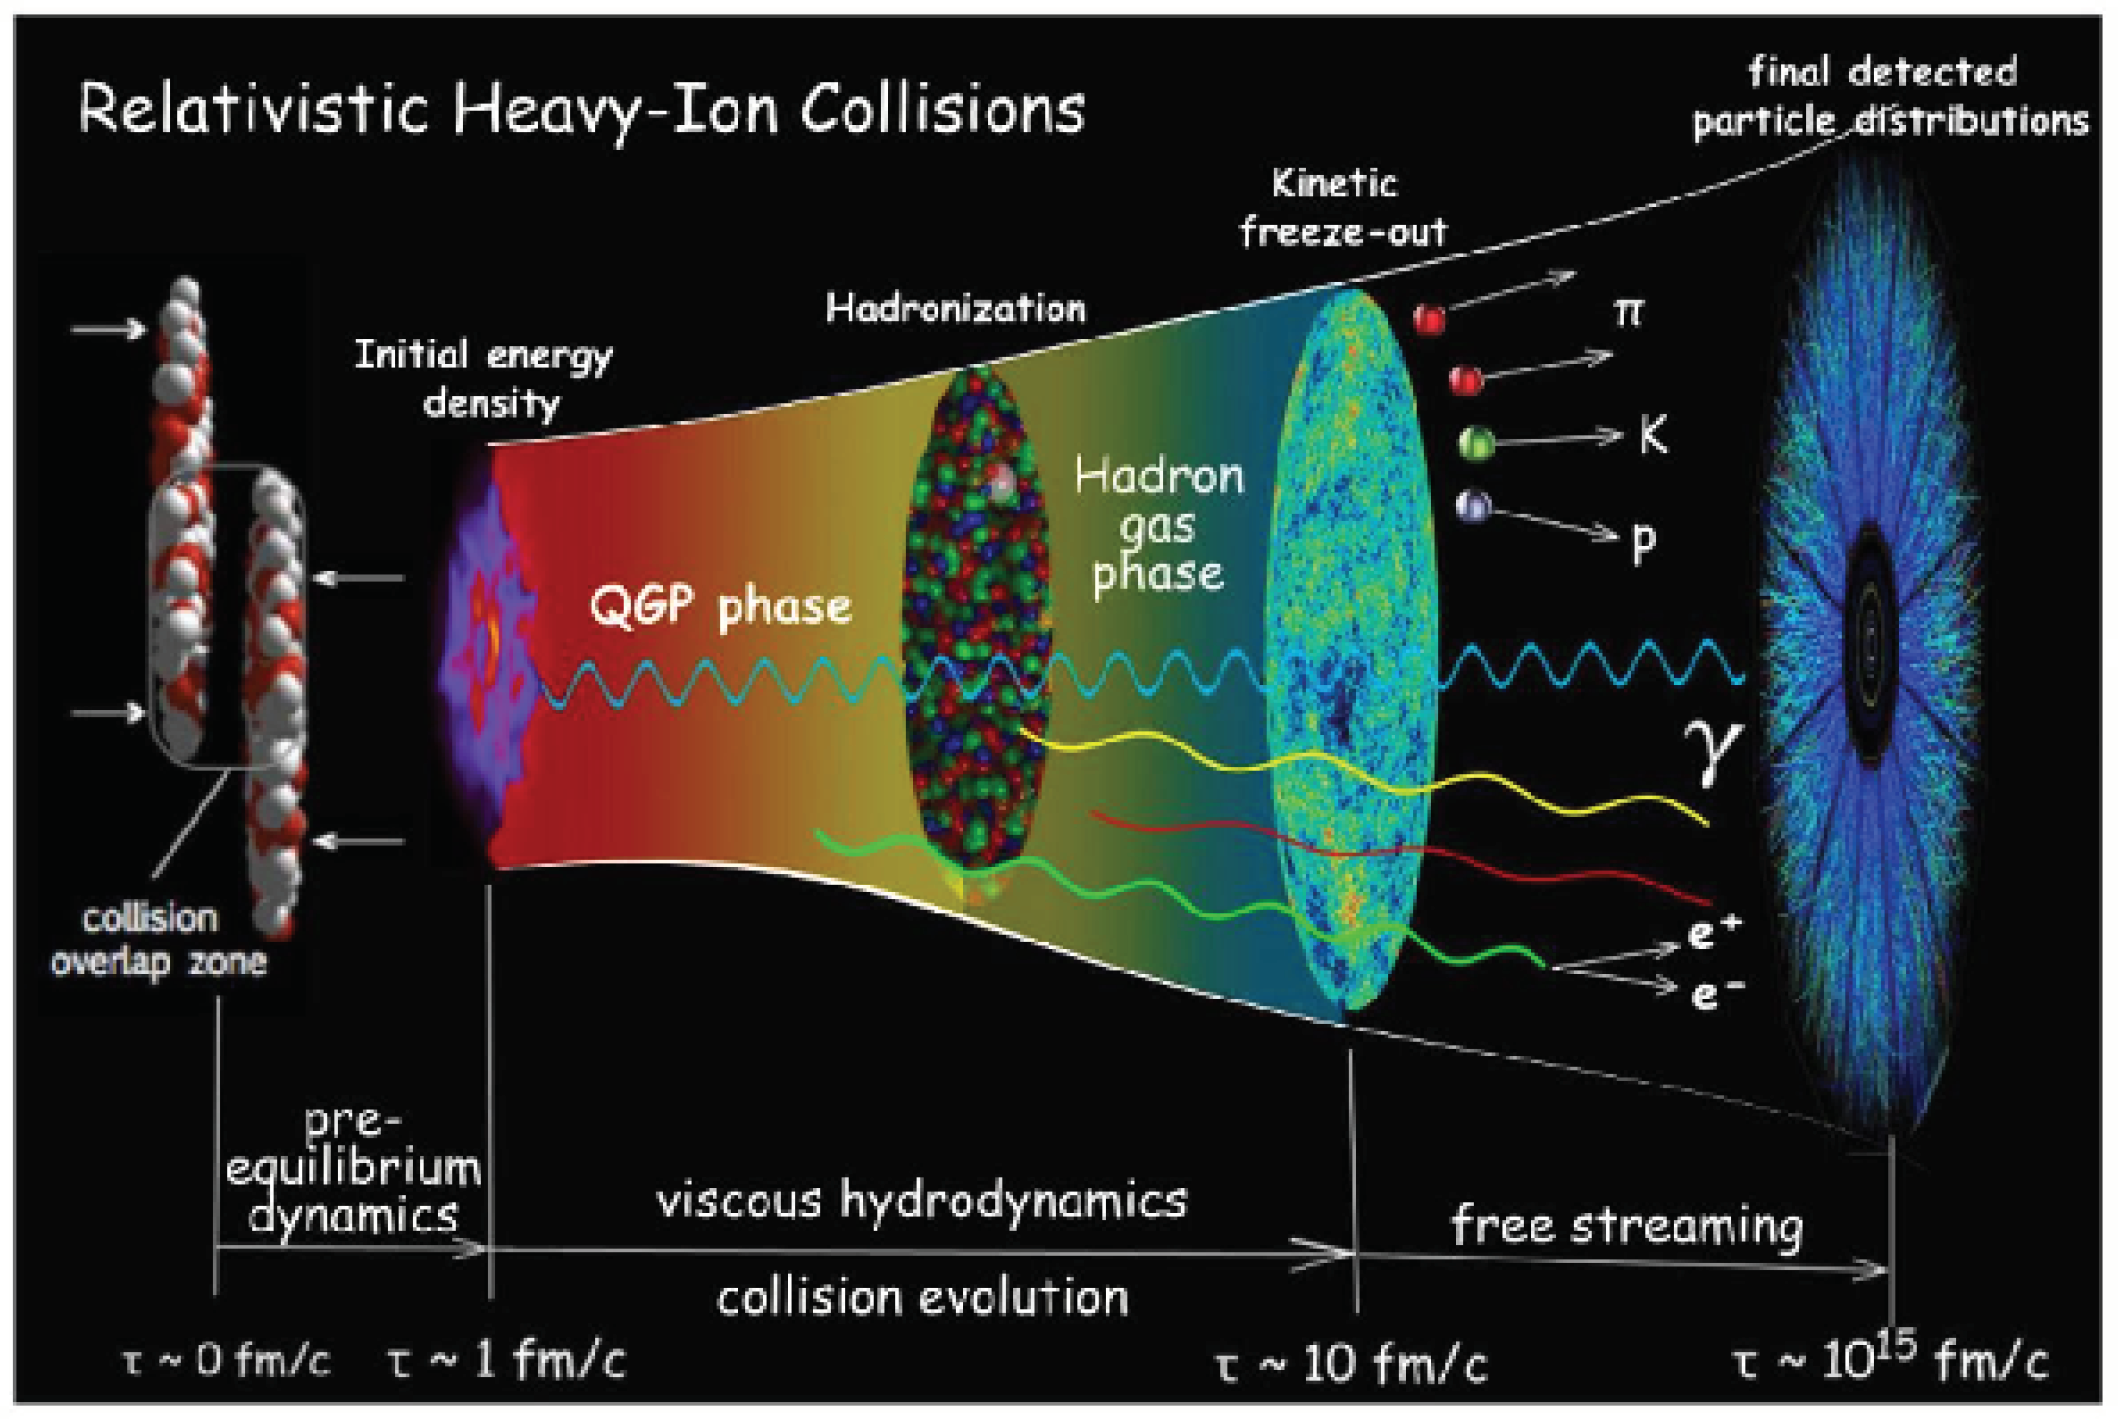
A diagram of the time sequence of a heavy ion collision is shown in
Figure 2. The time unit is
s. The initial energy density is developed in 1
. A new form of matter, the QGP, is composed of a dense volume of deconfined
Q and
pairs , which expands in ∼10
and subsequently forms the freeze out hadrons.
To create a system of a large number (∼1000) of color strings, in a nuclear collision requires an accelerator with ∼100 eV (100 GeV) kinetic energy per nucleon with two colliding beams. The two accelerators used in these nuclear collision studies are the Relativistic Heavy Ion Collider (RHIC) located at Brookhaven National Laboratory on Long Island New York and the Large Hadron Collider (LHC) at the Central European Research Nuclear Laboratory (CERN), in Geneva, Switzerland.
The strong field of a color source can lift a quark-antiquark pair out of the vacuum. This is the Schwinger
mechanism [
9]. The interaction of an initial quark
Q in one nucleon and
in the colliding nucleon are connected by the strong color string that subsequently breaks into two strings creating a
q and
deconfined pair at a time
given by [
9]
with
being the average transverse mass of the
pair. More details of string fragmentation is given by Lund model which has tried to address the collectivity in
collisions [
10].
3. The Color String Percolation Model
The thermodynamic quantities are derived from RHIC and LHC data using the Color String Percolation Model (CSPM), as seen in
Figure 3. In CSPM strings have a finite area in the transverse space in terms of the color field. The area is restricted to a finite disc of a given radius dictated by confinement. When the string with radii
and string density
are uniformly distributed on the much larger transverse nuclear collision area
they may overlap.
is given by
where the single disc area is
and
is the total number of strings.
Multiparticle production is currently described in terms of color strings stretched between the projectile and the target, which decay into new strings and subsequently hadronize to produce the observed hadrons. Color strings may be viewed as small areas in the transverse plane filled with color field created by colliding partons. With growing energy and size of the colliding system, the number of strings grows, and they start to overlap, forming clusters, in the transverse plane. At a certain critical density
= 1.2 a macroscopic percolation cluster appears that marks the percolation phase transition [
11,
12,
13]. This is the Color String Percolation Model (CSPM). The interaction between strings occurs when they overlap and the general result, due to the SU(3) random summation of charges, is a reduction in multiplicity and an increase in the string tension hence increase in the average transverse momentum squared,
. We assume that a cluster of
strings that occupies an area of
behaves as a single color source with a higher color field
corresponding to the vectorial sum of the color charges of each individual string
. The resulting color field covers the area of the cluster. As
, and the individual string colors may be oriented in an arbitrary manner respective to each other, the average
is zero, and
.
Knowing the color charge
one can obtain the multiplicity
and the mean transverse momentum squared
of the particles produced by a cluster of
strings [
13]
where
and
are the mean multiplicity and
of particles produced from a single string with a transverse area
. For strings just touching each other
, and
,
. When color strings fully overlap,
and therefore
and
, so that the multiplicity is maximally suppressed and the
is maximally enhanced. This implies a simple relation between the multiplicity and transverse momentum
, which is conservation of the total transverse momentum.
In the thermodynamic limit, one obtains an analytic expression [
12,
13]
where
is the color suppression factor. With
as
and
as
, where
is the percolation density parameter. Equation(3) can be written as
and
. The critical cluster which spans
, appears for
1.2 [
14].
It is worth noting that CSPM is a saturation model similar to the Color Glass Condensate (CGC), where
plays the same role as the saturation momentum scale
in the CGC model [
15,
16]. Saturation results from the overcrowding in impact parameter of low
x partons of a boosted hadrons or nucleus, leading to the appearance of a scale,
. This is the basic idea of CGC. For example the particle density in CSPM is given by
In CGC particle density is related to the coupling constant
,
In both case particle density increases with the number of participants
[
16].
4. Color Suppression Factor
In the present work we have extracted the color suppression factor
in high multiplicity events in
collisions using CMS data from the transverse momentum spectra of pions at
= 0.9, 2.76, 7 and 13 TeV [
17,
18].
Figure 4 shows a transverse momentum spectra for two multiplicity cuts at
= 7 TeV. For comparison purpose the spectra from
collisions
= 200 GeV is also shown. The spectra becomes harder for higher multiplicity cuts. This is due to the fact that high string density color sources are created in the higher multiplicity events.
To evaluate the initial value of
from data in high multiplicity events in
collisions, a parameterization of the experimental data of
distribution in low energy
collisions
= 200 GeV was used [
20]. The charged particle spectrum is described by a power law [
19]
where
a is the normalization factor,
and
are fitting parameters with
= 1.98 and
= 12.87 [
20]. This parameterization is used in high multiplicity events in
collisions to take into account the interactions of the strings [
19]. The color suppression factor
encodes the effect of the interaction among strings once they overlap. The parameter
in Equation (
7) is for independent strings and gets modified.
where
is the multiplicity dependent color suppression factor. In
collisions
∼ 1 at low energies due to the low overlap probability. The spectra were fitted using Equation (
9) in the softer sector with
in the range 0.12–1.0 GeV/c. Equation (
9) is similar to Tsallis distribution [
21] which can be obtained in the clustering of color sources frame by doing the convolution of the distribution of the different formed clusters size with the thermal distributions of the decay of each cluster. In the thermodynamic limit the color suppression factor
is related to the percolation density parameter
[
19].
Figure 5 shows the extracted value of
as a function of
from CMS experiment for
= 0.9–13 TeV. It is observed that the
has a lower value for high multiplicity events. To compare high energy
with the heavy ions results, we need to normalized
with the interaction area in
collisions.
The interaction area
has been computed in the IP-Glasma model, where
is the interaction radius [
22]. This is based on an impact parameter description of
collisions, combined with an underlying description of particle production based on the theory of Color Glass Condensate [
22]. The interaction radius
is approximately a linear function of the charged particle multiplicity. In the IP-Glasma model
is dependent on gluon multiplicity [
22]
where
x =
. The gluon multiplicity
is related to the number of tracks seen in the CMS experiment by
where
∼ 4.8 units of pseudorapidity. The interaction cross section
as a function of
, using Equation (
11), is shown in
Figure 6.
increases with the multiplicity and for very high multiplicities it is approximately constant.
Figure 7 shows the extracted value of
as a function of
scaled by the interaction area
from the CMS experiment for
= 0.9–13 TeV.
is the total charged particle multiplicity in the region
with
4.8 units of pseudorapidity.
The results from FNAL (Fermi National Accelerator Laboratory) E735 experiment on
collisions at
= 1.8 TeV is also shown in
Figure 7 [
24]. In the E735 experiment the total charged particle multiplicity was 10
200 in the pseudorapidity range
3.25 with
∼ 6.5 units of pseudorapidity. It is observed that the E735 results follow the trend seen in CMS data. The decrease in
for high multiplicity events is due to the high string density created in theses events.
5. Temperature
The connection between
and the temperature
involves the Schwinger mechanism (SM) for particle production. The Schwinger distribution for massless particles is expressed in terms of
[
9,
25]
where the average value of the string tension is
. The tension of the macroscopic cluster fluctuates around its mean value because the chromo-electric field is not constant. The origin of the string fluctuation is related to the stochastic picture of the QCD vacuum. Since the average value of the color field strength must vanish, it cannot be constant but changes randomly from point to point [
26,
27]. Such fluctuations lead to a Gaussian distribution of the string tension
which gives rise to thermal distribution [
26]
with
=
. The temperature is expressed as [
20,
28]
We will adopt the point of view that the experimentally determined chemical freeze-out temperature is a good measure of the upper end of the cross over phase transition temperature,
[
29]. The single string average transverse momentum
is calculated at
= 1.2 with the universal chemical freeze-out temperature of 167.7 ± 2.6 MeV [
30]. This gives
= 207.2 ± 3.3 MeV which is close to ≃200 MeV used previously in the calculation of percolation transition temperature [
28].
Recently, it has been suggested that fast thermalization in heavy ion collisions can occur through the existence of an event horizon caused by a rapid deceleration of the colliding nuclei [
31]. The thermalization in this case is due to the Hawking-Unruh effect [
32,
33].
It is well known that the black holes evaporates by quantum pair production and behave as if they have an effective temperature of
where 1/4G
M is the acceleration of gravity at the surface of a black hole of mass
M. The rate of pair production in the gravitational background of the black hole can be evaluated by considering the tunneling through the event horizon. Unruh showed that a similar effect arises in a uniformly accelerated frame, where an observer detects the thermal radiation with the temperature
T =
a/2
, where
a is the acceleration. Similarly, in hadronic interactions the probability to produce states of masses
M due to the chromoelectric field
E and color charge is given by the Schwinger mechanism [
9]
which is similar to the Boltzmann weight in a heat bath with an effective temperature
In CSPM the strong color field inside the large cluster produces deceleration of the primary
pair which can be seen as a thermal temperature by means of the Hawking-Unruh effect. This implies that the radiation temperature is determined by the transverse extension of the color flux tube/cluster in terms of the string tension [
34,
35,
36].
The string percolation density parameter
which characterizes the percolation clusters measures the initial temperature of the system. Since the cluster covers most of the interaction area, this temperature becomes a global temperature determined by the string density. In this way at
= 1.2 the connectivity percolation transition at
models the thermal deconfinement transition. The temperature obtained using Equation (
16) was ∼193.6 MeV for Au-Au collisions at
= 200 GeV in reasonable agreement with
= 221 ±
MeV from the enhanced direct photon experiment measured by the PHENIX Collaboration [
37]. For Pb-Pb collisions at
= 2.76 TeV the temperature is ∼262.2 MeV for 0–5% centrality, which is expected to be ∼35% higher than the temperature from Au-Au collisions [
20]. A recent summary of the results from Pb-Pb collisions at the LHC has mentioned that the initial temperature increases at least by 30 % as compared to the top RHIC energy [
38]. The direct photon measurements from ALICE gives the temperature of
= 304 ± 51 MeV [
39]. The agreement with the measured temperature shows that the temperature obtained using Equation (
16) can be termed as the initial temperature of the percolation cluster.
Figure 8 shows a plot of temperature as a function of
scaled by
. Temperature from both hadron-hadron and nucleus-nucleus collisions fall on a universal curve when multiplicity is scaled by the transverse interaction area. The horizontal line at ∼165 MeV is the universal hadronization temperature obtained from the systematic comparison of the statistical thermal model parametrization of hadron abundances measured in high energy
,
and A-A collisions [
30]. In
Figure 8 for
= 7 and 13 TeV higher multiplicity cuts show temperatures above the hadronization temperature and similar to those observed in Au-Au collisions at
= 200 GeV.
The thermalization in
and A-A collisions occurs through the existence of an event horizon caused by a rapid deceleration of the colliding nuclei [
34,
35]. The thermalization is due to the Hawking-Unruh effect [
32,
33,
34]. In CSPM the strong color field inside the large cluster produces deceleration of the primary
pair which can be seen as a thermal temperature. In case of A-A collisions it was observed that average transverse momentum is twice the temperature <
> = 2T. This shows that the charged particle transverse momentum spectrum is exponentially distributed and the inverse slope parameter is the thermalized temperature [
19].
After the initial temperature
the CSPM perfect fluid may expand according to Bjorken boost invariant 1D hydrodynamics [
41]
where
is the energy density,
nuclear overlap area, and
the production time for a boson (gluon) [
25]. The
is given by Equation (
2) ∼1
. The dynamics of massless particle production has been studied in QE2 quantum electrodynamics. QE2 can be scaled from electrodynamics to quantum chromodynamics using the ratio of the coupling constants [
25].
Figure 9 shows a plot of
as a function of
that is in excellent agreement with numerical lattice gauge calculations for
. At
∼ 1.2 (
195 MeV) we find that the
has ∼37 quark gluon degrees of freedom.
It is important to ask the question if matter created in high multiplicity
events is nearly a perfect fluid with a low shear viscosity as observed in heavy ion collisions [
19].
6. Shear Viscosity and Trace Anomaly
The shear viscosity to entropy density ratio
was obtained in the framework of relativistic kinetic theory and the string percolation [
42]. In this picture the relevant parameter is the string density
. The relativistic kinetic theory relation for the shear viscosity over entropy density ratio,
is given by [
43,
44]
where
T is the temperature and
is the mean free path given by
is the number density of an ideal gas of quarks and gluons and
the transport cross section for these constituents.
After the cluster is formed it behaves like a free gas of constituents. Equation (
22) can be applied to obtain the shear viscosity. In CSPM the number density is given by the effective number of sources per unit volume
where
L is the longitudinal extension of the source,
L = 1.0–1.1
[
28].
is obtained from Equations (
22) and (
24) as
Well below , as the temperature increases, the string density increases and the area is filled rapidly and and decrease sharply. Above , more than 2/3 of the area are already covered by strings, and therefore the area is not filling as fast and the relatively small decrease of is compensated by the rising of temperature, resulting in a smooth increase of . The behavior of is dominated by the fractional area covered by strings. This is not surprising because is the ability to transport momenta at large distances and that has to do with the density of voids in the matter.
Figure 10a shows
as a function of the temperature. The lower bound shown in
Figure 10a is given by the AdS/CFT conjecture [
45]. The results from
collisions from
= 13 TeV shows a very small
and that is 2.7 times the AdS/CFT conjectured lower bound
. The theoretical estimates of
has been obtained as a function of T/
for both the weakly interacting (wQGP) and strongly interacting (sQGP) coupled QCD plasma are shown in
Figure 5 [
43].
has also been obtained in several other calculations for pure glue matter [
48], in the semi quark gluon plasma [
49] and in quasi particle description [
50]. In pure SU(3) gluodynamics a conservative upper bound for
was obtained
= 0.134(33) at
[
51]. In the quasi particle approach also low
∼ 0.2 is obtained for T
and rises very slowly with the increase in temperature [
52]. In CSPM also
grows with temperature as 0.16
T/
.
In CSPM
is not needed to reproduce the elliptic flow and higher harmonics. The cluster formed by the strings has generally an asymmetric form in the transverse plane and acquires dimensions comparable to the nuclear overlap. This azimuthal asymmetry is at the origin of the elliptic flow in CSPM. The partons emitted at some point inside the cluster have to pass through the strong color field before appearing on the surface. The results of the simulation for different harmonics are in reasonable agreement with the experimental data on the
and centrality dependencies [
53,
54].
The trace anomaly (
) is the expectation value of the trace of the energy-momentum tensor,
, which measures the deviation from conformal behavior and thus identifies the interaction still present in the medium [
55]. We consider the
that inverse of
is equal to trace anomaly
.
is in quantitative agreement with
over a wide range of temperatures [
56,
57].
Figure 10b shows 1/(
) and the dimensionless quantity,
, obtained from lattice QCD simulations [
46]. The minimum in
∼ 0.22 determines the peak of the interaction measure ∼4.5 in agreement with the recent HotQCD values [
46]. This happens at the temperature of
∼ 195 MeV.
Figure 10b also shows the results from Wuppertal Collaboration [
47]. The maximum in
corresponds to the minimum in
. Both
and
describe the transition from a strongly coupled QGP to a weakly coupled QGP.
We are not aware of any theoretical work which directly relates the trace anomaly with the shear viscosity to entropy density ratio. However, the bulk viscosity
is related to both
and
[
58]. A detailed study based on low energy theorems and the lattice result for
shows that
rises very fast close to the critical temperature in such a way that its value at temperatures higher than
is quite negligible [
59]. It was observed that
scales as
where
is the coupling constant. The trace anomaly
is proportional to
[
58]. There are many other works in which
and
have been obtained separately [
48,
50,
60,
61].
In our earlier work
was obtained in Au-Au collisions at
= 200 GeV for various centralities using STAR data [
19]. The results are shown in
Figure 7 along with
(CMS) and
(E735) collisions. It is observed that
as a function of
scaled by the transverse interaction area falls on a universal scaling curve for both hadron-hadron and nucleus-nucleus collisions.
values in high multiplicity events in
collisions at
= 13 TeV are similar to those obtained in most central events in Au-Au collisions at
= 200 GeV. In
Figure 8 the temperatures from Au-Au collisions at
= 200 GeV are compared with the
collisions. In high multiplicity events for
collisions at
= 13 TeV the temperature is the same as in most central events in Au-Au.
The
as a function of temperature from Au-Au at
= 200 GeV and Pb-Pb at
= 2.76 TeV collisions is shown in
Figure 10a along with
collisions. The
value is similar both in the high multiplicity
collisions at
13 TeV and in most central collisions in Au-Au at
= 200 GeV. This shows that the QGP created in high multiplicity
collisions is also strongly coupled.
The similarity between high multiplicity
events and Au-Au suggests that the thermalization in both systems is reached through the stochastic process (Hawking-Unruh) instead of kinetic process [
62].
7. Summary and Conclusions
In the initial collision of and A-A nuclei at high energy, the Schwinger mechanism scaled from electric to color fields, lifts color neutral pairs from the vacuum at the initial time <> ∼1 . Here <> is the average transverse mass of quarks when a color source string breaks. Color sources are formed by the overlapping of n individual color strings with transverse area . The overall result of color string breaking is the increase of the transverse momentum of the pairs and the decrease of the multiplicity expected from n individual strings. In the transverse plane the total color string area is reduced by due to the overlapping of individual strings. is determined by comparing the charged particle transverse momentum spectra from a lower energy collision (single string) with the various high energy charged particle transverse momentum spectra from and A-A collisions(overlapping strings). In the overlap area the strings start interacting to form clusters in the transverse plane very much similar to discs in 2D percolation theory. When the 2D percolation density parameter reaches =1.2 , the spanning cluster is formed and represents a communicating droplet.
The initial temperature is given by Equation (
16) and is due to the Hawking-Unruh barrier penetration of the event horizon provided by color confinement. The similarity between high multiplicity
events and Au-Au indicates that the thermalization in both systems reached is due to a stochastic process rather than a kinetic process. We find ∼37 degrees of freedom at highest temperature of 195 MeV reached in Au-Au collisions at
= 200 GeV.
The percolation clustering begins ∼145 MeV and ends at the hadronization ie. critical temperature (T = 167.8 MeV). The center of this crossover phase transition is in agreement with the lattice gauge pseudo-critical temperature T = 155 ± 9 MeV. The temperature dependence of the ratio across the crossover region has a clear minimum value at MeV and , which is ∼2.7 times the Ads/CFT value of . Here the QGP has a low shear viscosity with strong residual interactions. We found that the inverse of closely tracks the lattice QCD values of the trace anomaly for T from 150 MeV to 260 MeV.
The color string percolation model (CSPM) gives a successful description of the experimental data in the soft region. The clustering of color sources is not derived directly from QCD, but has its most fundamental features. The non-Abelian character is reflected in the coherence sum of the color fields. Confinement is responsible for the event horizon and the small transverse size of the strings. The interpretation of data using color string percolation describes the equation of state of the QGP close to and above the critical (hadronization) temperature.


