
Axion-like Particles Implications for High-Energy Astrophysics


1
INAF, Istituto di Astrofisica Spaziale e Fisica Cosmica di Milano, Via A. Corti 12, 20133 Milano, Italy
2
INFN, Sezione di Pavia, Via A. Bassi 6, 27100 Pavia, Italy
3
INAF, Osservatorio Astronomico di Brera, Via E. Bianchi 46, 23807 Merate, Italy
*
Authors to whom correspondence should be addressed.
†
These authors contributed equally to this work.
Universe 2022, 8(5), 253; https://doi.org/10.3390/universe8050253
Submission received: 1 March 2022
/
Revised: 30 March 2022
/
Accepted: 2 April 2022
/
Published: 20 April 2022
(This article belongs to the Special Issue Astroparticle Physics)
Abstract
:We offer a pedagogical introduction to axion-like particles (ALPs) as far as their relevance for high-energy astrophysics is concerned, from a few MeV to 1000 TeV. This review is self-contained, in such a way to be understandable even to non-specialists. Among other things, we discuss two strong hints at a specific ALP that emerge from two very different astrophysical situations. More technical matters are contained in three Appendices.
1. Introduction
The Standard Model (SM) of strong, weak and electromagnetic interactions based on the gauge group with three sequential families of quarks and leptons has had wonderful success in explaining all known processes involving elementary particles, and the detection of the Higgs boson with the right properties in 2012 represents its crownig.
However nobody would seriously regard the SM as the ultimate theory of fundamental interactions. Apart from more or less aesthetic reasons, electroweak and strong interactions are not unified, and gravity is not even included. The natural expectation from a final theory would rather be a full unification of all four fundamental interactions at the quantum level. Moreover, the need for an extension of the SM is made compelling by the fact that it cannot account for the observational evidence for non-baryonic dark matter—ultimately responsible for the formation of structures in the Universe—as well as for dark energy, presumably triggering the present accelerated cosmic expansion.
Thus, the SM is presently viewed as the low-energy manifestation of some more fundamental and complete theory of all elementary-particle interactions including gravity. Any specific attempt to accomplish this task is characterized by a set of new particles, along with a specific mass spectrum and their interactions with the standard world. This point will be outlined in detail in Section 2.
Although it is presently impossible to tell which new proposal—out of so many ones—has any chance to successfully describe Nature, it seems remarkable that several attempts along very different directions such as four-dimensional supersymmetric models [1,2,3,4,5], multidimensional Kaluza-Klein theories [6,7] and especially M theory—which encompasses superstring and superbrane theories—predict the existence of axion-like particles (ALPs) [8,9] (for a very incomplete list of references, see [10,11,12,13,14,15,16,17,18,19,20,21,22,23,24,25,26,27,28,29]).
Basically, ALPs are very light, pseudo-scalar bosons—denoted by a—which mainly couple to two photons with a strength according to the Feynman diagram in Figure 1.
Owing to their very low mass , they are effectively stable particles (even if they were not, their lifetime would be much longer than the age of the Universe). Additional couplings to fermions and gauge bosons may be present, but they are irrelevant for our forthcoming considerations and will be discarded.
Consider now the Feynman diagram in Figure 1.
A possibility is that one photon is propagating but the other represents an external magnetic field . In such a situation we have and conversions, represented by the Feynman diagram in Figure 2. Note that could be replaced by an external electric field , but we will not be interested in this possibility.
Because we can combine two diagrams of the latter kind together—as shown in Figure 3—this means that oscillations take place in the presence of an external magnetic field. They are quite similar to flavour oscillations of massive neutrinos, apart from the need of the external magnetic field in order to compensate for the spin mismatch [30,31,32,33].
Over the last fifteen years or so, ALPs have attracted an ever growing interest, basically for three different reasons.
- In another region of the parameter plane —which can overlap with the previous one—ALPs give rise to very interesting astrophysical effects (for a very incomplete list of references, see [39,40,41,42,43,44,45,46,47,48,49,50,51,52,53,54,55,56,57,58,59,60,61,62,63,64,65,66,67,68,69,70,71,72,73,74,75,76,77,78,79,80,81,82,83,84,85,86,87,88,89,90,91,92,93,94,95,96,97,98,99,100,101,102,103,104,105,106,107,108,109,110,111,112,113,114,115,116,117,118,119,120,121,122,123,124,125,126,127,128,129]. In particular, we shall see that ALPs can be indirectly detected by the new generation of gamma-ray observatories, such as CTA (Cherenkov Telescope Array) [130], HAWC (High-Altitude Water Cherenkov Observatory) [131], GAMMA-400 (High-Altitude Water Cherenkov Observatory) [132], LHAASO (High-Altitude Water Cherenkov Observatory) [133], TAIGA-HiSCORE (Hundred Square km Cosmic Origin Explorer) [134] and HERD (High Energy cosmic-Radiation Detection) [135].
- The last reason is that the region of the parameter plane relevant for astrophysical effects can be probed—and ALPs can be directly detected—in the laboratory experiment called shining through the wall within the next few years thanks to the upgrade of ALPS (Any Light Particle Search) II at DESY [136] and by the STAX experiment [137]. Alternatively, these ALPs can be observed by the planned IAXO (International Axion Observatory) observatory [138], as well as with other strategies developed by Avignone and collaborators [139,140,141]. Moreover, if the bulk of the dark matter is made of ALPs they can also be detected by the planned experiment ABRACADABRA (A Broadband/Resonant Approach to Cosmic Axion Detection with an Amplifying B-field Ring Apparatus) [142].
Our aim is to offer a pedagogical and self-contained account of the most important implications of ALPs for high-energy astrophysics.
The paper is structured as follows.
Section 2 contains a brief outline of what can be considered as the standard view about the relation of the SM with the ultimate theory.
Section 3 describes the most important properties of ALPs, which will be used in the subsequent discussions, along with most of the bounds on and .
The aim of Section 4 is to provide all the necessary astrophysical background needed to understand the rest of the paper, which is therefore fully self-contained.
Section 5 describes the propagation of a photon beam in the -ray band—emitted by a far-away source with redshift z—in extragalactic space and observed on Earth at energy . Extragalactic space is supposed to be magnetized, and so oscillations should take place in the beam as it propagates. Moreover, the extragalactic magnetic field is modeled as a domain-like structure—which mimics the real physical situation—with the strength of nearly equal in all domains, the size of all domains being taken equal and set by the coherence length while the direction of jumps randomly and abruptly from one domain to the next. Because of the latter fact, this model is called domain-like sharp edge model (DLSHE), and is adequate for beam energies currently detected (up to a few TeV) since the oscillation length is very much larger than . It is just during propagation that an important effect of the presence of ALPs comes about. What happens is that the very-high-energy (VHE, ) beam photons scatter off background infrared/optical/ultraviolet photons, which are nothing but the light emitted by stars during the whole evolution of the Universe, called extragalactic background light (EBL). Owing to the Breit-Wheeler process [143], the beam undergoes a frequency-dependent attenuation1. However in the presence of oscillations photons acquire a ‘split personality’: for some time they behave as a true photon—thereby undergoing EBL absorption—but for some time they behave as ALPs, which are totally unaffected by the EBL and propagate freely. Therefore, now the optical depth is smaller than in conventional physics. However since the corresponding photon survival probability is , even a small decrease in gives rise to a much larger photon survival probability as compared to the case of conventional physics. This is the crux of the argument, first realized in 2007 by De Angelis, Roncadelli and Mansutti [52].
Section 6 addresses the so-called VHE BL LAC spectral anomaly. Basically, even if the EBL absorption is considerably reduced in the presence of ALPs, it nevertheless produces a frequency-dependent dimming of the source. Owing to the Breit-Wheeler process , the beam undergoes a frequency-dependent attenuation. Thus, if we want to know the emitted spectrum we have to EBL-deabsorb the observed one . Correspondingly, we obtain the emitted spectrum which slightly departs from a single power law, hence for simplicity we perform the best-fit . When we apply this procedure to a sufficiently rich homogeneous sample of VHE sources and perform a statistical analysis of the set of the emitted spectral slopes for all considered sources, in the absence of ALPs we find that the best-fit regression line is a concave parabola in the plane. As a consequence, there is a statistical correlation between and z. However how can the sources get to know their z so as to tune their in such a way to reproduce the above statistical correlation? At first sight, one could imagine that this arises from selection effects, but this possibility has been excluded, whence the anomaly in question. So far, only conventional physics has been used. Nevertheless, it has been shown that by putting ALPs into the game with and such an anomaly disappears altogether!
Section 7 discusses a vexing question. A particular kind of active galactic nucleus (AGN)—named Flat Spectrum Radio Quasars (FSRQs)—should not emit in the -ray band above 30 GeV according to conventional physics, but several FSRQs have been detected up to 400 GeV! It is shown that in the presence of oscillation not only FSRQs emit up to 400 GeV, but in addition their spectral energy distribution comes out to be in perfect agreement with observations! Basically, what happens is that the above mechanism that increases the photon survival probability in extragalactic space works equally well inside FSRQs.
Section 8 is superficially similar to Section 5, but with a big difference. In 2015 Dobrynina, Kartavtsev and Raffelt [145] realized that at energies photon dispersion on the CMB (Cosmic Microwave Background) becomes the leading effect, which causes the oscillation length to get smaller and smaller as E further increases. Therefore, things change drastically whenever , because in this case a whole oscillation—or even several oscillations—probe a whole domain, and if it is described unphysically like in the DLSHE model then the results also come out as unphysical. The simplest way out of this problem is to smooth out the edges in such a way that the change of the direction becomes continuous across the domain edges. After a short description of the new model, the propagation of a VHE photon beam from a far-away source is described in detail.
Section 9 presents a full scenario, which also includes the conversions also in the source. Actually, the VHE photon/ALP beam emitted by the considered sources crosses a variety of magnetic field structures in very different astrophysical environments where oscillations occur: inside the BL Lac jet, within the host galaxy, in extragalactic space, and finally inside the Milky Way. For three specific sources a better agreement with observations is achieved as compared to conventional physics.
Section 10 addresses another characteristic effect brought about by photon-ALP interaction, namely the change in the polarization state of photons. Less attention has been paid so far to this effect in the literature. Very recent and interesting results on this topic are discussed.
Finally, in Section 11 we draw our conclusions.
2. The Standard Lore in Particle Physics
As already stressed, the Standard Model (SM) of particle physics is presently regarded as the low-energy manifestation of some more fundamental theory (FT) characterized by a very large energy scale, much closer to the Planck mass than to the Fermi scale .
2.1. General Framework
In order to be somewhat specific, let us suppose that the FT is a string theory. As is well known, in order for such a theory to be mathematically consistent it has to be formulated in ten dimensions. As a consequence, six dimensions must be compactified. Unfortunately, the number of different compactification patterns is , and so far no criterion has been found to decide which one uniquely leads to the SM at low-energy: many of them appear to be viable. However each one predicts a new physics beyond the SM. Nevertheless, one thing is clear. Generally speaking, every compactification pattern leads to a certain number of ALPs as pseudo-Goldstone bosons, namely Goldstone bosons with a tiny mass due to string non-perturbative instanton effects. Basically, they arise from the topological complexity of the extra-dimensional manifold, and their properties depend on the specific compactification pattern. While for a Calabi-Yau manifold one expects ALPs, there are manifolds which give rise to the so-called Axiverse, a plenitude af ALPs with one per decade with mass down to [16]. Below, we do not commit ourselves with any specific string theory.
After compactification at the very high scale , the resulting four-dimensional field theory is described by a Lagrangian. We collectively denote by the SM particles together with possibly new undetected particles with mass smaller than —the above ALPs are an example—while all particles much heavier than are collectively represented by . Correspondingly, the Lagrangian in question has the form , and the generating functional for the corresponding Green’s functions reads
where J and K are external sources and N is a normalization constant. The resulting low-energy effective theory then emerges by integrating out the heavy particles in , so that the low-energy effective Lagrangian is defined by
Evidently, the SM Lagrangian is contained in , and—in the absence of any new physics below —it will differ from only by non-renormalizable terms involving the particles alone, that are suppressed by inverse powers of .
In any theory with a sufficiently rich gauge structure—which is certainly the case of —some further ALPs can arise. Indeed, some global symmetries invariably show up as an accidental consequence of gauge invariance. Since the Higgs fields which spontaneously break gauge symmetries often carry nontrivial global quantum numbers, it follows that the group undergoes spontaneous symmetry breaking as well. As a consequence, some Goldstone bosons—which are collectively denoted by a if is non-abelian—are expected to appear in the physical spectrum and their interactions are described by the low-energy effective Lagrangian, in spite of the fact that is an invariance group of the FT. Because the instanton-like effect explicitly break by a tiny amount, additional ALPs show up. Moreover, ALPs can arise simply because the effective low-energy theory does not respect the symmetry which gives rise to the Goldstone bosons.
Therefore, by splitting up the set into the set of SM particles plus the ALPs a, the low-energy effective Lagrangian has the structure
where contains the kinetic and mass terms of a, and stands for renormalizable soft-breaking terms that can be present whenever is not an automatic symmetry of the low-energy effective theory (we recall that automatic symmetry means any global symmetry which is implied by the gauge group, such as lepton and baryon numbers in the SM). Clearly, the SM is contained in .
Needless to say, it can well happen that between and other relevant mass scales exist. In such a situation the above scheme remains true, but then may be spontaneously broken stepwise at various intermediate scales.
Finally, we recall that pseudo-Goldstone bosons such as ALPs are necessarily pseudo-scalar particles [146].
2.2. Axion as a Prototype
A characteristic feature of the SM is that non-perturbative effects produce the term in the QCD Lagrangian, where is an angle, and are the gauge coupling constant and the gauge field strength of , respectively, and . All values of are allowed and theoretically on the same footing, but a nonvanishing values produce a P and CP violation in the strong sector of the SM. An additional source of CP violation comes from the chiral transformation needed to bring the quark mass matrix into diagonal form, and so the total strong CP violation is parametrized by (for a review, see e.g., [147,148,149,150,151]). Observationally, a nonvanishing would show up in an electric dipole moment for the neutron. Consistency with the experimental upper bound requires [147,148,149,150,151]. Thus, the question arises as to why is so unexpectedly small. A natural way out of this fine-tuning problem—which is the strong CP problem— was proposed in 1977 by Peccei and Quinn [152,153]. Basically, the idea is to make the SM Lagrangian invariant under an additional global symmetry in such a way that the term can be rotated away. While this strategy can be successfully implemented, it turns out that the is spontaneously broken, and so a Goldstone boson is necessarily present in the physical spectrum. Actually, things are slightly more complicated, because is also explicitly broken by the same non-perturbative effects which give rise to . Therefore, the would-be Goldstone boson becomes a pseudo-Goldstone boson—the original axion [154,155], which was missed by Peccei and Quinn—with nonvanishing mass given by
where denotes the scale at which is spontaneously broken. We stress that Equation (4) has general validity, regardless of the value of . Qualitatively, the axion is quite similar to the pion and it has Yukawa couplings to quarks which go like the inverse of . Moreover—just like for the pion—a two-photon coupling of the axion a is generated at one-loop via the triangle graph with internal fermion lines, which is described by the effective Lagrangian
where is the usual electromagnetic field strength and . The two-photon coupling entering Equation (5) has dimension of the inverse of an energy and is given by
with k a model-dependent parameter of order one [156]. Note that and it turns out to be independent of the mass of the fermions running in the loop. Hence, the axion is characterized by a strict relation between its mass and two-photon coupling
In the original proposal [152,153], is spontaneously broken by two Higgs doublets which also spontaneously break , so that . Correspondingly, from Equation (4) we get . In addition, the axion is rather strongly coupled to quarks and induces observable nuclear de-excitation effects [157]. In fact, it was soon realized that the original axion was experimentally ruled out [158].
A slight change in perspective led shortly thereafter to the resurrection of the axion strategy. Conflict with experiment arises because the original axion is too strongly coupled and too massive. However, given the fact that both m and all axion couplings go like the inverse of the axion becomes weakly coupled and sufficiently light provided that one chooses . This is straightforwardly achieved by performing the spontaneous breakdown of with a Higgs field which is a singlet under [159,160], and with a vacuum expectation value .
We have told the axion story in some detail because the latter condition leads to the conclusion that the symmetry has nothing to do with the low-energy effective theory to which the axion belongs—namely in Equation (3)—but rather arises within an underlying more fundamental theory (alternative strategies to make the axion observationally viable were developed in [161,162,163]).
Thus, we see that the axion strategy provides a particular realization of the general scenario outlined in Section 2.1, with , (for some i) and including among other terms involving the SM fermions and gauge bosons. This fact also entails that new physics should lurk around the scale at which is spontaneously broken. Incidentally, the same conclusion is reached from the recognition that the Peccei-Quinn symmetry is dramatically unstable against any tiny perturbation—even for at the Planck scale—unless it is protected by some discrete gauge symmetry which can only arise in a more fundamental theory [164,165,166,167].
Finally, we remark that the first strategy to detect the axion was suggested in 1984 by Sikivie [168], but nowadays a lot of experiments are looking for it.
2.3. Emergence of ALPs
ALPs are very similar to the axion, but important differences exist between them, mainly because the axion arises in a very specific context; in dealing with ALPs the aim is to bring out their properties in a model-independent fashion as much as possible. This attitude has two main consequences.
- Only photon-ALP interaction terms are taken into account. Nothing prevents ALPs from coupling to other SM particles, but for our purposes they will henceforth be discarded. Observe that such an ALP coupling to two photons is just supposed to exist without further worrying about its origin.
- The parameters and are to be regarded as unrelated for ALPs, and it is merely assumed that and .
As a result, ALPs are described by the Lagrangian
where and have the same meaning as before. Note that is included in .
Throughout this Review, we shall suppose that is the electric field of a propagating photon beam while is an external magnetic field. Because a couples to , the effective coupling is proportional , where is the angle between and , and we denote by the -component transverse to the beam momentum. Thus, what matters is and not . As a consequence, if the photon beam propagates in an external magnetic field with varying direction, the beam polarization changes. This effect will be addressed in Section 10.
When the strength of either or is sufficiently large, also QED vacuum polarization effects should be taken into account, which are described by Heisenberg-Euler-Weisskopf Lagrangian [169,170]
where is the fine-structure constant and is the electron mass, so that ALPs are described by the full Lagrangian (no confusion between the energy and the electric field will arise since the electric field will never be considered again).
So far, we have been concerned with the emergence of ALPs as pseudo-Goldstone bosons from the physics after compactification. However ALPs can also arise due to the topological complexity of the extra-dimensional manifold, and their properties depend on the specific compactification pattern. An example thereof is the so-called String Axiverse [16]. Finally, it has been shown that ALPs can be one of the decay products of the fundamental (moduli) fields (for a review, see e.g., [171] and the references therein).
3. General Properties of ALPs
We are presently concerned with a monochromatic, polarized photon beam of energy E and wave vector propagating in a cold plasma which is both magnetized and ionized. We suppose for the moment that an external homogeneous magnetic field is present and we denote by the electron number density. We employ an orthogonal reference frame with the y-axis along , while the x and z axes are chosen arbitrarily.
3.1. Beam Propagation Equation
It can be shown that in this case the beam propagation equation following from can be written as [32]
with
where and denote the photon amplitudes with polarization (electric field) along the x- and z-axis, respectively, while is the amplitude associated with the ALP. It is useful to introduce the basis , where and represent the two photon linear polarization states along the x- and z-axis, respectively, and denotes the ALP state. Accordingly, we can rewrite as
and the real, symmetric photon-ALP mixing matrix entering Equation (10) has the form
where we have set
While the terms appearing in the third row and column of are dictated by and have an evident physical meaning, the other -terms require some explanation. They reflect the properties of the medium—which are not included in —and the off-diagonal term directly mixes the photon polarization states giving rise to Faraday rotation, while and will be specified later.
As already stated, in the present paper we are interested in the situation in which the photon/ALP energy is much larger than the ALP mass, namely . As a consequence, the short-wavelength approximation will be appropriate and greatly simplifies the problem. As first shown by Raffelt and Stodolsky [32], the beam propagation equation accordingly takes the form
which is a Schrödinger-like equation with time replaced with y.
We see that a remarkable picture emerges, wherein the beam looks formally like a three-state non-relativistic quantum system. Explicitly, they are the two photon polarization states and the ALP state. The evolution of the pure beam states—whose photons have the same polarization—is then described by the three-dimensional wave function , with the y-coordinate replacing time, which obeys the Schödinger-like equation (15) with Hamiltonian
Denoting by the transfer matrix—namely the solution of Equation (15) with initial condition , the propagation of a generic wave function can be represented as
where represents the initial position. Moreover, we can set
where is the transfer matrix associated with the reduced Schödinger-like equation
3.2. A Simplified Case
Because is supposed to be homogeneous, we have the freedom to choose the z-axis along , so that . The diagonal -terms receive in principle two different contributions. One comes from QED vacuum polarization described by Lagrangian (9), but since here we suppose for simplicity that is rather weak this effect is negligible [32]. The other contribution arises from the fact that the beam is supposed to propagate in a cold plasma, where charge screening produces an effective photon mass resulting in the plasma frequency [32]
which entails
Finally, the , terms account for Faraday rotation, but since we are going to take E in the X-ray or in the -ray band Faraday rotation can be discarded. Altogether, the mixing matrix becomes
with the superscript recalling the present choice of the coordinate system and
We see that decouples away while only mixes with a.
Application of the discussion reported in Appendix A with yields for the corresponding eigenvalues
where we have set
As a consequence, the transfer matrix associated with Equation (19) with mixing matrix can be written with the help of Equation (A16) as
where the matrices , and are just those defined by Equations (A17)–(A19) as specialized to the present situation. Actually, a simplification is brought about by introducing the photon-ALP mixing angle
since then simple trigonometric manipulations allow us to express the above matrices in the simpler form
Now, the probability that a photon polarized along the z-axis oscillates into an ALP after a distance y is evidently
and in complete analogy with the case of neutrino oscillations [33] it reads
which shows that plays the role of oscillation wave number, thereby implying that the oscillation length is . Owing to Equations (27) and (32) can be rewritten as
which shows that the photon-ALP oscillation probability becomes both maximal and independent of E and for
and explicitly reads
This is the strong-mixing regime, which—from the comparison of Equations (25) and (34)—turns out to be characterized by the condition
and so it sets in sufficiently above the energy threshold
Observe that in the strong-mixing regime the mass term and the plasma term should be omitted in the mixing matrix, just for consistency.
Below the photon-ALP oscillation probability becomes energy-dependent, oscillates typically over a decade in energy and next monotonically decreases becoming rapidly vanishingly small. The reader should keep this point in mind, since it will be used to put astrophysical bounds on .
3.3. A More General Case
In view of our subsequent discussion it proves essential to deal with the general case in which is not aligned with the z-axis but forms a nonvanishing angle with it. Correspondingly, the mixing matrix presently arises from through the similarity transformation
operated by the rotation matrix in the x–z plane, namely
This leads to
indeed in agreement with Equation (13) within the considered approximation. Therefore the transfer matrix reads
and its explicit representation turns out to be
with
As a result, a beam initially containing only photons propagating in an external magnetic field, after a distance of many oscillation lengths will contain ALPs. Moreover, the three states , , will equilibrate, namely the beam will be composed by of photons and of of ALPs.
3.4. Complications
So far we have considered the implications of Lagrangian (8) alone in order to introduce the reader in a rather gentle way into the present formalism. Nevertheless, we shall meet cases in which also Lagrangian (9) has to be taken into account. Moreover, we shall see that in some instances, other terms must be included into the mixing matrix, one of which is imaginary. As a consequence, the mixing matrix—which will be simply written as —will not be self-adjoint, and correspondingly the transfer matrix will be denoted by and will be not unitary anymore. Thus, the beam looks formally like a three-state non-relativistic unstable quantum system.
3.5. Unpolarized Beam
So far, our discussion was confined to the case in which the beam is in a polarized state (pure state in the quantum mechanical language). This assumption possesses the advantage of making the resulting equations particularly transparent but it has the drawback that it is too restrictive for our analysis. Indeed, photon polarization cannot be measured in the VHE band with present-day and planned detectors, and so we have to treat the beam as unpolarized. As a consequence, it will be described by a generalized polarization density matrix
rather than by a wave function . Remarkably, the analogy with non-relativistic quantum mechanics entails that obeys the Von Neumann-like equation
associated with Equation (19). Thus, the propagation of a generic is still given by
and the probability that a photon/ALP beam initially in the state at position will be found in the state at position y is
provided that is measured, since we are assuming as usual that .
3.6. Parameter Bounds
Before proceeding further, it seems important to report the observational bounds on the parameters and , which have been considered free so far. Moreover, we would like to stress that in the absence of direct couplings to fermions ALP interact neither with matter nor with radiation, in spite of the two-photon coupling (the proof will be provided in Appendix B).
| * * * |
ALPs were searched for by the CAST experiment at CERN by using a superconductive magnet (decommissioned from the Large Hadron Collider) pointing towards the Sun. The upper side of the magnet was closed, in order to stop the X-rays produced in the outer part of the Sun, since ALPs are expected to be produced in the Sun core through the Primakoff process —represented in Figure 4—with an energy also in the X-ray band.
However since they do not interact with matter, they travel unimpeded through the Sun and enter the magnet, which has an X-ray photon detector at its bottom. Owing of the strong magnetic field of the magnet, ALPs should convert into X-ray photons and be detected. Unfortunately, no detection has taken place and from this fact the resulting upper bound has been set as for at the level [107]. Coincidentally, exactly the same bound has been derived from the analysis of some particular stars in globular clusters [92].
Let us next turn to the other bounds on and . Basically, use is made of the observed absence of the characteristic oscillating behavior of the individual realizations of the beam propagation around (as explained in Section 3.2). Several bounds have been derived, among which the most relevant ones for us are the following.
- for from PKS 2155-304 [83].
- for from NGC 1275 [97].
- for from M87 [103].
- for from PKS 2155-304 [111].
- – for from Mrk 421 [120].
- for from Mrk 421 [121].
- for from NGC 1275 (center of Perseus cluster) [123].
Since 1996, Supernova1987A in the Large Magellanic Cloud has been used to set bounds on ALPs. Basically, the idea is that when the supernova exploded, a burst of ALPs produced by the Primakoff effect considered above was released, and when some of these ALPs entered the Milky Way they should have transformed into -rays and been detected by the Solar Maximum Mission satellite. From the failure of detection, upper bounds on and can be established [42,43]. This issue was reconsidered in more detail in 2015 by Payez et al., getting the improved bound and , without reporting the confidence level [94]. Although we do not trust such a bound since too many uncertainties are still present in our precise knowledge of a protoneutron star and the above analysis is rather superficial, two remarks are in order.
- Payez et al. 2015 say that ALPs are emitted simultaneously with neutrinos, and this is repeated by everybody. Concerning our ALPs which are supposed to interact only with two photons, this is not true. Since they do not interact either with matter nor with radiation (see Appendix B), they escape as soon as they are produced, while neutrinos remain trapped. Thus, this weakens the supernova bound.
- Because the value of is rather uncertain—basically depending on where the strong-mixing regime sets in—we will consider throughout this Review and . Hence, we can easily take no contradiction exists even apart from the previous remark.
4. Astrophysical Context
In order to make this Rewiev self-contained, we are going to provide all information that will be used in the next sections.
4.1. Blazars
A mechanism for the very-high-energy (VHE) emission from active galactic nuclei (AGNs) that attracted a lot of interest consists of a binary system made of a supermassive black hole (SMBH) and a massive star: the latter provides a sort of reservoir of matter that accretes onto the SMBH. In a sense, the situation is similar to a Type IA supernova, but the explosion is replaced with matter falling into the SMBH. Correspondingly, about of AGNs possess an accretion disk around the SMBH and supports two opposite relativistic jets emanating from the SMBH and perpendicular to an accretion disk, propagating from the central regions out to distances that—depending on the nature of the source—are in the range 1kpc–1. Ultra-relativistic particles (leptons and/or hadrons) in the gas carried by these jets are accelerated by relativistic shocks and emit non-thermal radiation extending from the radio band up to the VHE band. Aberration caused by the relativistic motion makes the emission strongly anisotropic, mainly in the direction of motion. Hence, in this case the emission is extremely beamed. When one jet happens to point towards us just for chance, the AGN is called a blazar, otherwise a radio galaxy. A schematic picture of a blazar (radio galaxy) is shown in Figure 5.
As a matter of fact, the phenomenology of the AGNs is quite involved, and the complication of their classification is an indication that many of their aspects have not yet been understood [172,173,174,175] (a nice updated and concise discussion of this and related topics is contained in [176]). For instance, it is totally unclear why some blazars become flaring—from a few hours to a few days—and next come back to their state of smaller luminosity. As far as our considerations are concerned, we will restrict our attention to blazars and to their VHE photon emission mechanisms. It turns out that VHE blazars are typically hosted by elliptical galaxies in small groups.
According to the current wisdom, two competing VHE non-thermal photon emission mechanisms can work.
- One is called leptonic mechanism (syncrotron-self Compton). Basically, in the presence of the magnetic fields inside the AGN jet, relativistic electrons emit synchrotron radiation and the produced photons are boosted to much higher energies by inverse Compton scattering off the parent electrons (in some cases also external photons from the disc participate in this process). The resulting emitted spectral energy distribution (SED) — is the specific apparent luminosity—has two humps: the synchrotron one—somewhere from the IR band to the X-ray band—while the inverse Compton one lies in the -ray band [177,178,179,180].
- The other mechanism is named hadronic mechanism (proton-proton scattering). As far as the synchrotron emission is concerned the situation is the same as before, but the gamma hump is produced by hadronic collisions. The resulting immediately decays as , while the produce neutrinos and antineutrinos [181,182]. Thus, the detection of these neutrinos can discriminate between the two mechanisms. In 2017 the IceCube neutrino telescope has detected one neutrino coming from the flaring blazar TXS 0506+056, thereby demonstrating that the hadronic mechanism does work [183].
As far as blazar photon polarization is concerned, the situation is as follows. In the X-ray band and below, where photons are produced via synchrotron emission, they are partially polarized with a realistic degree of linear polarization (see Section 10.1 for the definition) =0.2–0.4, as argued e.g., in [184]. Instead, in the HE and VHE bands, where photons are likely produced via an inverse Compton process, they are expected to be unpolarized [185].
It turns out that VHE blazars fall into two sharply distinct classes.
BL Lacs: They are named after the prototype BL Lacertae discovered in 1929 by Hoffmeister [186], but they were originally believed to be a variable star inside the Milky Way. Only in 1968 was it realized that they are instead a radio source, and in 1974 their redshift was found to be , corresponding to a distance . They lack broad optical lines, which entails that the broad line region (BLR) depicted in Figure 5 is absent. Moreover, this fact makes their redshift determination very difficult, which explains why only in the 1970s did BL Lacs starte to be understood. Their jets contain a magnetic field and extend out to about 1 kpc.
Flat spectrum radio quasars (FSRQs): They are considerably more massive than BL Lacs, and their jets also contain a magnetic field but they extend out to about 1 Mpc. Their structure is by far more complicated than that of BL Lacs, especially in the outer region, with the presence of radio lobes and hot spots where a magnetic field is also present. Because of the very high density of ultraviolet photons in the BLR—effectively centred on the SMBH with radius —and infrared photons emitted by the torus, the VHE photons produced at the jet base undergo the process . As a result, the FSRQs should be invisible above [187,188,189,190]. However, observations with IACTs have shown that such an expectation is blatantly wrong, since they have been detected up to 400 GeV. This fact poses an open problem.
So far, about 85 VHE blazars have been detected by the Imaging Atmospheric Cherenkov Telescopes (IACTs) H.E.S.S. (High Energy Stereoscopic System) [191], MAGIC (Major Atmospheric Gamma Imaging Cherenkov) [192] and VERITAS (Very Energetic Radiation Imaging Telescope Array System) [193] with redshift up to [194].
In view of our subsequent analysis, we carefully address the propagation of a monochromatic photon beam emitted by a blazar at redshift z and detected at energy within the standard CDM cosmological model, so that the emitted energy is owing to the cosmic expansion. Regardless of the actual physics responsible for photon propagation, two important quantities are the observed and emitted spectra (number fluxes) . They are related by
where is the photon survival probability throughout the whole trip from the source to us. Moreover, the SED is related to the observed spectrum by
where is the specific apparent luminosity. We suppose hereafter that lies in the VHE -ray band.
4.2. Conventional Photon Propagation
Within conventional physics the photon survival probability is usually parametrized as
where is the optical depth, which quantifies the dimming of the source. Note that in general increases with z, since a greater source distance entails a larger probability for a photon to disappear from the beam. Apart from atmospheric effects, one typically has for z not too large, in which case the Universe is optically thin up to the source. However depending on and z it can happen that , so that at some point the Universe becomes optically thick along the line of sight to the source. The value such that defines the -ray horizon for a given , and it follows from Equation (52) that sources beyond the horizon tend to become progressively invisible as z further increases past . Owing to Equations (50) and (52) becomes
Whenever dust effects can be neglected, photon depletion arises solely when hard beam photons of energy E scatter off soft background photons of energy permeating the Universe and isotropically distributed—we shall come back later to their nature—and produce pairs through the Breit-Wheeler process, represented by the Feynman diagram in Figure 6 [143].
Needless to say, in order for this process to take place enough energy has to be available in the centre-of-mass frame to create an pair. Regarding E as an independent variable, the process is kinematically allowed for
where denotes the scattering angle, c is the speed of light and is the electron mass. Note that E and change along the beam in proportion of . The corresponding Breit-Wheeler cross-section is [195]
which depends on E, and only through the dimensionless parameter
and the process is kinematically allowed for . The cross-section reaches its maximum for . Assuming head-on collisions for definiteness (), it follows that gets maximized for the background photon energy
where E and correspond to the same redshift.
Within the standard CDM cosmological model arises by first convolving the spectral number density of background photons at a generic redshift with along the line of sight for fixed values of z, and , and next integrating over all these variables [196,197,198]. Hence, we have
where the distance travelled by a photon per unit redshift at redshift z is given by
with Hubble constant , while and represent the average cosmic density of matter and dark energy, respectively, in units of the critical density .
Once is known, can be computed exactly, even though in general the integration over in Equation (58) can only be performed numerically.
Finally, in order to get an intuitive insight into the physical situation under consideration it may be useful to discard cosmological effects (which evidently makes sense for z small enough). Accordingly, z is best expressed in terms of the source distance and the optical depth becomes
where is the photon mean free path for referring to the present cosmic epoch. As a consequence, Equation (52) becomes
and so Equation (53) reduces to
Note that we have dropped the subscript 0 for simplicity.
4.3. Extragalactic Background Light (EBL)
Blazars detected so far with IACTs—or detectable in the near future—lie in the VHE range , and so from Equation (57) it follows that the resulting dimming is expected to be maximal for a background photon energy in the range (corresponding to the frequency range and to the wavelength range ), extending from the ultraviolet to the far-infrared. This is just the extragalactic background light (EBL). We stress that at variance with the case of the CMB, the EBL has nothing to do with the Big Bang. Rather, it is the radiation produced by all stars in galaxies during the whole history of the Universe and possibly by a first generation of stars formed before galaxies were assembled. Therefore, a lower limit to the EBL level can be derived from integrated galaxy counts [199].
Throughout this paper, we adopt the Franceschini-Rodighiero (FR) EBL model mainly because it supplies a very detailed numerical evaluation of the optical depth based on Equation (58), which will henceforth be denoted by [200], since it is in very good agreement with e.g., model of Dominguez et al. [201] (for a review, see e.g., [202]). Regretfully, the errors affecting are unknown. The dimming of a source at redshift due to the EBL as a function of the observed energy has been computed in [203] and shown in Figure 7.
4.4. Extragalactic Magnetic Field
Unfortunately, the morphology and strength of the extragalactic magnetic field are totally unknown, and it is not surprising that various very different configurations of have been proposed [204,205,206,207]. Yet, the strength of is constrained to lies in the range on the scale [208,209,210]
Nevertheless, a very realistic scenario for the extragalactic magnetic field exists has existed for a long time, which has become a classic and relies upon energetic galactic outflows.
What happens is that ionized matter from galaxies gets ejected into extragalactic space. The key-role is the fact that the associated magnetic field is frozen in, and amplified by turbulence, thereby magnetizing the surrounding space. Such a scenario was first proposed in 1968 by Rees and Setti [211] and in 1969 by Hoyle [212] in their investigations of radio sources. A more concrete and refined picture was considered in 1999 by Kronberg, Lesch and Hopp [213]. They proposed that dwarf galaxies are ultimately the source of . Specifically, they start from the clear consensus that supernova-driven galactic winds are a crucial ingredient in the evolution of dwarf galaxies. Next, they show that shortly after a starburst, the kinetic energy supplied by supernovae and stellar winds inflate an expanding superbubble into the surrounding interstellar medium of a dwarf galaxy. Moreover, they demonstrate that the ejected thermal gas and cosmic-rays—significantly magnetized—will become mixed into the surrounding intergalactic matter, which will coexpand with the Universe. This picture leads to on the scale . Actually, in order to appreciate the relevance of dwarf galaxies, it is useful to recall that our Local Group—which is dominated by the Milky Way and Andromeda—contains 38 galaxies, 23 of which are dwarfs. Because the Local Group has nothing special, it follows that dwarf galaxies are roughly 10 times more abundant than bright Hubble type galaxies. The considered result is in agreement with observations of Lyman-alpha forest clouds [214]. A similar situation was further investigated in 2001 by Furlanetto and Loeb [215] in connection with quasars outflows, which still predicts on the scale . Moreover, also normal galaxies possess this kind of ionized matter outflows—especially ellipticals and lenticulars—due to the central AGN (see e.g., [216] and the references therein) and supernova explosions. Remarkably, this picture is in agreement with numerical simulations [217]. Uncontroversial evidence of galactic outflows comes from the high metallicity (including strong iron lines) of the intracluster medium of regular galaxy clusters, which are so massive that matter cannot escape.
A classic and simple modeling of such a magnetic field configuration consists of a domain-like network, made of identically domains of size equal to the coherence length, all having roughly the same strength of and with the direction of uniform in each domain but randomly jumping from one domain to the next (for a review, see [204,205]).
Quite remarkably, the fact that in all above scenarios the seeds of are galaxies indeed explains the three main features of the considered model for . (1) Its cell-like morphology arises from its galactic origin. (2) It is quite plausible that has nearly the same strength around each galaxy, and so in all domains. (3) Because galaxies are uncorrelated, it looks natural that the direction changes randomly from the neighborhood of a galaxy to that of another, thereby explaining the random jump in direction of from one domain to the next.
Now, we have to address a critical point. Up until 2017, all models describing the propagation of a photon/ALP beam in extragalactic space assumed that the edges between adjacent domains are sharp, namely that the change in the direction of from a domain to the next one is abrupt, which causes its components to be discontinuous. Models of this kind will be referred to as domain-like sharp edge models (DLSHE). Even though they are obviously a mathematical idealizations, they have been successfully used because the domain size was invariably much larger than the oscillation length . Because coherence is maintained only inside a single domain, this means that only a very small fraction of an oscillation probes a single domain, and so the discontinuity at the interface of two adjacent domains is not felt by the oscillations. However, if it happens that instead , a whole oscillation probes a single domain, and this model breaks down. In such a situation it becomes compelling to modify the model by replacing the sharp edges with smooth ones, so as to avoid any abrupt jump in the direction of , which gives rise to a more complicated model called domain-like smooth edge model (DLSME) and developed in [114] and briefly described in Section 8.2.
A totally different approach to the extragalactic magnetic field is based on magnetohydrodynamic cosmological simulations (see e.g., [218,219] and the references therein). The strategy is as follows. An initial condition for a cosmological is chosen arbitrarily during the dark age and its evolution as driven by structure formation is studied. The link with the real world is the condition to reproduce regular cluster magnetic fields, which fixes a posteriori the initial condition of . As a by-product, a prediction of the magnetic field inside filaments in the present Universe emerges. But this cannot be the whole story. Apart from failing to answer the question of the seed of primordial magnetic fields, galactic outflows are missing. This issue has a two-fold relevance: inside galaxy clusters and in extragalactic space. Indeed, galactic outflows are a reality in regular clusters, owing to the strong iron line. in 2009 Xu, et al. [220] claimed that the magnetic field ejected by a central AGN during the cluster formation can be amplified by turbulence during the cluster evolution in such a way to explain the observed cluster magnetic fields. Still in 2009, Donnert, et al. [221] have found that the strength and structure of the magnetic fields observed in clusters are well reproduced for a wide range of the model parameters by galactic outflows. Therefore, the requirement to reproduce regular cluster magnetic fields can totally mislead the expectations based on cosmological hydrodynamic simulations, in particular the present value of the magnetic field inside filaments and the model described in [106]. For this reason, we prefer to stick to the previous scenario.
4.5. Galaxy Clusters
According to Abell, Galaxy clusters contain from thirty up to more than thousands galaxies with a total mass in the range and represent the largest gravitationally bound structures in the Universe. They are classified as (i) regular clusters, (ii) intermediate clusters, and (iii) irregular clusters. We consider regular clusters here, since most of them are spherical in first approximation, and so they are very easy to describe. In view of our subsequent needs, we focus our attention on the strength and morphology of their magnetic field and electron number density .
Faraday rotation measurements and synchrotron radio emissions tell us that [222,223]. The structure of is believed to have a turbulent nature with a Kolmogorov-type turbulence spectrum , with k the wave number in the interval (more about this, in Section 10.2) and index [224]. The behavior of is modeled by [224,225]
where is the spectral function describing the Kolmogorov-type turbulence of the cluster magnetic field (for more details see e.g., [86]), and are the central cluster magnetic field strength and the central electron number density, respectively, while is a cluster parameter. The behavior of is modeled by the model
where is a cluster parameter and is the cluster core radius. Galaxy clusters are divided into two main categories: cool-core (CC) and non-cool-core (nCC) clusters. CC clusters generally host an AGN, while nCC clusters do not usually contain an active SMBH. Many aspects differentiate CC and nCC galaxy clusters (see e.g., [226]). However, for our studies their central electron number density represents the real crucial quantity. We take the following average values for the two classes: for CC clusters and for nCC ones [226]. Other models with a larger number of parameters have been proposed in the literature, but they do not influence much our final results about oscillations inside clusters.
In the cluster central region photons are produced by several processes in different energy ranges: thermal Bremsstrahlung is responsible in the X-ray band [227], while inverse Compton scattering, neutral pion decay are believed to produce photons in the HE range (see e.g., [228,229,230,231]). Photons produced by all these processes turn out to be effectively unpolarized.
5. Propagation of ALPs in Extragalactic Space—1
Let us consider a far away VHE blazar at redshift z which is presently detected by an IACT. We stress that H.E.S.S., MAGIC and VERITAS are sensitive to photons with energy from about up to a few TeV. As a consequence, we have and so we can apply the formalism developed in Section 3, but a small extension is needed in order to take EBL absorption into account.
Our ultimate task is the computation of the photon survival probability in the presence of ALPs. We have seen that in conventional physics photons undergo EBL absorption, which severely depletes the photon beam when z is sufficiently large. Clearly, now—owing to the presence of the extragalactic magnetic field— oscillations will take place in the beam. This means that during its propagation a photon acquires a `split personality’: for some time it behaves as a true photon—thereby undergoing EBL absorption—but for some time it behaves as an ALP, and so it is unaffected by the EBL and propagates freely. Therefore, the optical depth in the presence of ALPs is now smaller than in the conventional case. But since the corresponding photon survival probability is
recalling (52) we conclude that is much larger than evaluated in conventional physics: this is the crux of the argument. As a consequence, far-away sources that are too faint to be detected according to conventional physics would become observable.
In order to be definite—and in view of the discussion to be presented in the next section—we choose the values of some parameters in agreement with the subsequent needs.
As far as the extragalactic magnetic field is concerned, we assume a domain-like structure described in Section 4.4 with a DLSHE model, since we shall see that .
5.1. Strategy
Thanks to the fact that is homogeneous in every domain, the beam propagation equation can be solved exactly in every single domain. But due to the nature of the extragalactic magnetic field, the angle of B in each domain with a fixed fiducial direction equal for all domains (which we identify with the z-axis) is a random variable, and so the propagation of the photon/ALP beam becomes a -dimensional stochastic process, where denotes the total number of magnetic domains crossed by the beam. Moreover, we shall see that the whole photon/ALP beam propagation can be recovered by iterating times the propagation over a single magnetic domain, changing each time the value of the random angle. Therefore, we identify the photon survival probability with its value averaged over the angles.
Our discussion is framed within the standard CDM cosmological model with and , and so the redshift is the natural parameter to express distances. In particular, the proper length extending over the redshift interval is
Accordingly, the overall structure of the cellular configuration of the extragalactic magnetic field is naturally described by a uniform mesh in redshift space with elementary step , which is therefore the same for all domains. This mesh can be constructed as follows. We denote by the proper length along the y-direction of the generic n-th domain, with . Note that is the maximal integer contained in the number , hence . In order to fix we consider the domain closest to us, labelled by 1 and—with the help of Equation (66)—we write its proper length as , from which we get . So, once is chosen in agreement with such a prescription, the size of all magnetic domains in redshift space is fixed. At this point, two further quantities can be determined. First, . Second, the proper length of the n-th domain along the y-direction follows from Equation (66) with . Whence
| * * * |
Manifestly, in order to maximize we choose in order to be in the strong-mixing regime for . Incidentally, when the external magnetic field is homogeneous—as it is in fact in each single domain—a look at Lagrangian (8) shows that all results depend on the combination and not on and B separately. It is therefore quite convenient to employ the parameter
in terms of which Equation (37) can be rewritten as
Because we would like to be in the strong-mixing regime almost everywhere within the VHE band, we take . What about ? We should keep in mind that is unknown, but the upper bound on the mean diffuse extragalactic electron density is provided by the WMAP measurement of the baryon density [232], which—thanks to Equation (20)—translates into the upper bound . Moreover, in order to fix we use the fact that the result to be derived in the next section requires . As a consequence, we get .
5.2. Propagation over a Single Domain
We have to determine and the magnetic field strength in the generic n-th domain.
The first goal can be achieved as follows. Because the domain size is so small as compared to the cosmological standards, we can safely drop cosmological evolutionary effects when considering a single domain. Then as far as absorption is concerned what matters is the mean free path for the reaction , and the term should be inserted into the 11 and 22 entries of the matrix. In order to evaluate , we imagine that two hypothetical sources located at both edges of the n-th domain are observed. Therefore, we apply Equation (53) to both sources. With the notational simplifications and , we have
which upon combination imply that the flux change across the domain in question is
But owing to Equation (62) mutatis mutandis implies that Equation (72) should have the form
and the comparison with Equation (72) ultimately yields
where the optical depth is evaluated by means of Equation (58) or more simply taken from [200].
As for the determination of , we note that because of the high conductivity of the IGM medium the magnetic flux lines can be thought as frozen inside it [204,205]. Therefore, the flux conservation during the cosmic expansion entails that B scales like , so that the magnetic field strength in a domain at redshift z is [204,205]. Hence in the n-th magnetic domain we have .
Thus, at this stage the mixing matrix as explicitly written in the n-th domain reads
where is the random angle between and the fixed fiducial direction along the z-axis (note that indeed ). Observe that since we are in the strong-mixing regime, and can be neglected with respect to the other terms in the mixing matrix. So—apart from —all other matrix elements entering are known. Finding the transfer matrix corresponding to is straightforward even if tedious by using the results reported in Appendix A. The result is
with
where we have set
with
where is just as defined by Equation (68) and evaluated in the n-th domain.
5.3. Calculation of the Photon Survival Probability in the Presence of Photon-ALP Oscillations
As we said, our aim is to derive the photon survival probability from the source at redshift z to us in the present context. So far, we have dealt with a single magnetic domain but now we enlarge our view so as to encompass the whole propagation process of the beam from the source to us. This goal is trivially achieved thanks to the analogy with non-relativistic quantum mechanics, according to which—for a fixed arbitrary choice of the angles —the whole transfer matrix describing the propagation of the photon/ALP beam is
Moreover, the probability that a photon/ALP beam emitted by a blazar at z in the state will be detected in the state for the above choice of is given by
with .
Since the actual values of the angles are unknown, the best that we can do is to evaluate the probability entering Equation (84) as averaged over all possible values of the considered angles, namely
indeed in accordance with the strategy outlined above. In practice, this is accomplished by evaluating the r.h.s. of Equation (84) over a very large number of realizations of the propagation process (we take 5000 realizations) randomly choosing the values of all angles for every realization, adding the results and dividing by the number of realizations.
Because the photon polarization cannot be measured at the considered energies, we have to sum the result over the two final polarization states
Moreover, we suppose here that the emitted beam consists of unpolarized photons, so that the initial beam state is described by the density matrix
We find in this way the photon survival probability
A final remark is in order. It is obvious that the beam follows a single realization of the considered stochastic process at once, but since we do not know which one is actually selected the best we can do is to evaluate the average photon survival probability.
6. VHE BL Lac Spectral Anomaly
After all these preliminary considerations, we are now in a position to discuss an important effect. Actually, we show that VHE astrophysics leads to a first strong hint at ALPs.
Basically, we are going to demonstrate that conventional physics leads to a paradoxical situation concerning the EBL-deabsorbed BL Lac spectra as a function of the source redshift z. But such a situation disappears altogether once the ALPs consistent with the observational bounds enter the game.
As a first step, we have to select a sample of BL Lacs which is suitable for our analysis. They have to meet the following conditions.
- We focus our attention on flaring blazars, which show episodic time variability with their luminosity increasing by more than a factor of two, on the time span from a few hours to a few days: the reason is both their enhanced luminosity—which entails in turn their detectability [233,234]—and our desire to consider a homogeneous sample of BL Lacs.
- As we shall see, our analysis requires the knowledge of the redshift, the observed spectrum and the energy range wherein every blazar is observed. This information is available only for some of the observed flaring sources.
- In order to get rid of evolutionary effects inside blazars we restrict our attention to those with .
- It seems a good thing to deal with sources that are as similar as possible. Therefore, we consider only intermediate-frequency peaked (IBL) and high-frequency peaked (HBL) flaring BL Lacs with observed energy .
We are consequently left with a sample of 39 flaring VHE BL Lacs, which are listed in Appendix C.
In first approximation, all observed spectra of the VHE blazars in are fitted by a single power-law—neglecting a possible small curvature of some spectra in their lowest energy part—and so they have the form
where is the observed energy, is a common reference energy while and denote the normalization constant and the observed slope, respectively, for a source at redshift z. Actually, is generally defined at different energies for different sources. So, for the sake of comparison among all observed spectra normalization constants we need to perform a rescaling in the observed spectrum of the considered blazars in such a way that coincides with at the fiducial energy for every source in . Accordingly, Equation (89) becomes
As already emphasized, these spectra are strongly affected by the EBL, hence if we want to know the shape of the emitted spectra they have to be EBL-deabsorbed. We know that the emitted and observed spectra are related by Equation (53), which we presently rewrite as
where CP stands throughout this section for conventional physics.
6.1. Conventional Physics
Let us start by deriving the emitted spectrum of every source in , starting from each observed one. As a preliminary step, thanks to Equation (53) we rewrite Equation (91) as
Because of the presence of the exponential in the r.h.s. of Equation (92), cannot behave as an exact power law. Yet, it turns out to be close to it. Therefore, we best-fit (BF) to a single power-law expression
over the energy range where a source is observed, and so varies inside (which changes from source to source). Correspondingly, the resulting values of are plotted in Figure 8.
We proceed by performing a statistical analysis of all values of as a function of z, by employing the least square method and try to fit the data with one parameter (horizontal straight line), two parameters (first-order polynomial), and three parameters (second-order polynomial). In order to test the statistical significance of the fits we evaluate the corresponding . The values of the obtained for the three fits are (one parameter), (two parameters) and (three parameters). Thus, data appear to be best-fitted by the second-order polynomial
The best-fit regression line given by Equation (94) turns out to be a concave parabola shown in Figure 9.
This is the key-point. In order to appreciate the physical consequences of Equation (94) we should keep in mind that is the exponent of the emitted energy entering . Hence, in the two extreme cases and we have
thereby implying that the hardening of the emitted flux progressively increases with the redshift. More generally, we have found a statistical correlation between the and z.
However, this result looks physically absurd. How can the sources get to know their z so as to tune their in such a way to reproduce the above statistical correlation? We call the existence of such a correlation the VHE BL Lac spectral anomaly, which of course concerns flaring BL Lac alone. According to physical intuition, we would have expected a straight horizontal best-fit regression line in the plane.
The most natural explanation would be that such an anomaly arises from selection effects, but it has been demonstrated that this is not the case [118].
6.2. ALPs Enter the Game
As an attempt to get rid of the VHE BL Lac spectral anomaly, we put ALPs into play, with parameters consistent with the previously mentioned bounds. Because the presently operating IACTs reach at most e few TeV, the oscillation length is much larger than the magnetic domain size and so the propagation model in extragalactic space considered in Section 5 is fully adequate.
Basically, we go through exactly the same steps described above. That is to say, we rewrite Equation (92) with , keeping in mind that now . Whence
Next, we still best-fit to a single power law expression
over the energy range where a source is observed, hence varies within . Such a best-fitting procedure is performed for every benchmark value of and , namely , , and , .
Moreover, we carry out again the above statistical analysis of the values of for all blazars in , for any benchmark value of and .
Finally, the statistical significance of each fit can be quantified by computing the corresponding , whose values are reported in Table 1 for , , and in Table 2 for , . In both tables the values of are reported for comparison.
The relevance of such a statistical analysis is to single out two preferred situations (corresponding to the minimum of ): one for and the other for . In either case, the results are and a straight best-fit regression line which is exactly horizontal. More in detail, for we get and , while for we find and .
Manifestly, both cases turn out to be very similar. We plot the values of in Figure 10 only for the two considered situations.
Because is our preferred value, we are now in a position to make a sharp prediction of the ALP parameters. Correspondingly—owing to Equation (69) with —the ALP mass must be , since in Section 5.1 we have seen that . Moreover, by recalling Equation (68) with and the upper bounds on and B quoted in Section 3.6 we get . Remarkably, these parameters are consistent with the bounds reported in Section 3.6.
In conclusion, we have indeed succeeded in getting rid of the VHE BL Lac spectral anomaly, since the are on average independent of z. We stress that it is an automatic consequence of the ALP scenario, and not an ad hoc requirement.
A final remark is in order. It is obvious that by effectively changing the EBL level—this is what the ALP actually does— the best-fit regression line also changes. But that it transforms from a concave parabola into a perfectly straight horizontal line looks almost a miracle!
6.3. A New Scenario for Flaring BL Lacs
Besides getting rid of the VHE BL Lac spectral anomaly, the ALP scenario naturally leads to a new view of flaring BL Lacs.
In order to best appreciate this point, it is enlightening to fit the values of by a horizontal straight regression line, at the cost of relaxing the best-fitting requirement. Accordingly, the scatter of the values of for of blazars belonging to is less than of the mean value set by horizontal straight regression line in Figure 11, namely equal to 0.47. Superficially, the VHE BL Lac spectral anomaly problem would be solved—but in reality it is not—since we correspondingly have which is by far too large.
The result obtained in the presence of oscillations and leads to a similar but much more satisfactory picture. In the first place, we are dealing with a horizontal straight best-fit regression line, and in addition the corresponding turns out to be considerably smaller. Specifically, the scatter of the values of for of the considered blazars is now less than about the mean value set by for and less than about the mean value set by for , namely equal to 0.33 for and equal to 0.32 for . This situation is shown in Figure 12.
We argue that the small scatter in the values of implies that the physical emission mechanism is the same for all flaring blazars, with the small fluctuations in arising from the difference of their internal quantities: after all, no two identical galaxies have ever been found! On the other hand, the larger scatter in the values of as derived in [118]—presumably unaffected by photon-ALP oscillations when error bars are taken into account—is naturally traced back to the different environmental state of each flaring source, such as for instance the accretion rate.
A natural question finally arises. How is it possible that the large spread in the distribution (see Appendix C) arises from the small scatter in the distribution shown in Figure 10? The answer is very simple: most of the scatter in the distribution arises from the large scatter in the source redshifts.
7. New Explanation of VHE Emission from FSRQs
As emphasized in Section 4.1, according to conventional physics FSRQs do not emit at energy larger than about 30 GeV. But the IACTs have detected them up to an energy of 400 GeV [235,236,237]. This fact poses a formidable problem to VHE astrophysicists, who have developed contrived models as a way out of this conundrum, but none of them is really satisfactory. The most iconic example of these FSRQs is represented by PKS 1222+216, and we shall focus our attention on it.
7.1. Detection of PKS 1222+216 in the VHE Range
The detection of an intense, rapidly varying emission in the energy range from the FSRQ PKS 1222+216 at redshift represents a challenge for all blazar models. Since the surrounding of the inner jet in FSRQs is rich in optical/ultraviolet photons emitted by the BLR (see Section 4.1), a huge optical depth for rays above 20 GeV–30 GeV is expected (see e.g., [187,188,189]). However, photons up to have been observed by MAGIC [236]. In addition, the PKS 1222+216 flux doubles in only about 10 min, thereby implying an extreme compactness of the emitting region. These features are very difficult to explain by the standard blazar models.
The only solution within conventional physics to solve both issues—the detection of PKS 1222+216 in the VHE band, and its rapid variation—appears to deal with a two-blob model: a larger one located in the inner region of the source which is responsible for the emission from IR to X-rays, and a smaller compact blob ( cm) accounting for the VHE emitting region detected by MAGIC beyond the BLR—which is therefore far from the central engine—in order to avoid absorption [238,239,240]. Manifestly, this is an ad hoc solution.
Because PKS 1222+216 has also been simultaneously detected by Fermi/LAT in the energy range [241], it is compelling to find a realistic SED that fits both the Fermi/LAT and the MAGIC observations, besides to explaining the VHE -ray emission.
We want now to inquire whether a similar two-blob model can produce a physically consistent SED, with the key-difference that also the smaller blob is now located close to the center.
7.2. Observations and Setup
The relevant physical parameters for PKS 1222+216 are as follows. We assume a disk luminosity erg s, a radius of the BLR , and standard values for the cloud number density and the temperature of the BLR (see e.g., [189]). However, the average electron number density , which is relevant for the beam propagation, gets considerably reduced to .
We now estimate the BLR absorption by evaluating the optical depth of the beam photons inside the BLR according to conventional physics. By following the same procedure developed in [189], the optical depth reads
where E is the energy of a ray, x is the distance from the center of the BLR, where is the scattering angle between a ray and a soft photon of energy of the BLR, , while (which is computed by means of the standard photo-ionization code CLOUDY as in [242]) is the spectral number density of the BLR radiation field at position x per unit solid angle and is the pair-production cross-section of Equation (55).
The resulting is represented by the blue long-dashed line in Figure 13, which shows that we cannot expect photons from PKS 1222+216 in the energy range . But MAGIC has detected such photons.
The calculated is affected by some degree of uncertainty coming from the uncertainty of the input parameters, and in particular the luminosity of the disk . However, since (, see [243] and references therein), the final impact of these uncertainties is moderate. In addition, scattered disk photons [240] show a maximal absorption of at about 200 GeV, so that their contribution to the total can safely be neglected.
7.3. An ALP Model for PKS 1222+216
A natural explanation of the VHE observations arises if oscillations are put into the game, according to the following scenario. They take place within the BLR, ALPs cross this region unimpeded and re-conversion into photons occurs either in the magnetic field of the source or in that of the host galaxy (more about this, later). Thanks to oscillations, we can stay within the standard blazar emission models. The resulting SED looks quite realistic, and simultaneously fits both the Fermi/LAT and MAGIC spectra.
We use the same conventions of the previous sections. In particular, four different regions are crossed by the photon/ALP beam: (i) the inner region where is homogeneous in first approximation, (ii) the large scale jet where possesses a smooth y-dependence, (iii) the host galaxy where has a domain-like structure (as we shall see) and (iv) the extragalactic space where presents again a domain-like structure.
In the inner region the magnetic field strength is so strong that the photon one-loop vacuum polarization effects coming from in Equation (9) are not negligible, which is a further complication with respect to the simple scenario outlined in Section 3.2. Correspondingly, to the 11 and 22 entries of the mixing matrix in Equation (13) two new terms must be added, which read
and
respectively, where is the critical magnetic field. Thus, we can introduce also a high-energy cutoff
above which the photon/ALP beam does not propagate within the strong-mixing regime and presents an energy dependent behavior. We will now address oscillations in the several regions crossed by the beam. We consider very light ALPs as in [53,55,56,62,70]. We take as in Section 5.
7.4. Photon-ALP Oscillations Inside the BLR
We start by evaluating the photon/ALP beam propagation in the inner part of the blazar, which is the region extending from the centre to , to be referred to as region 1.
Because the magnetic field profile along the jet decreases starting from the center and possesses a complicated morphology, we prefer to assume its strength and orientation to be constant and equal to their average values from the center to the edge of the BLR, since their precise estimate is very difficult due to the presence of strong shocks and relativistic winds. Thus, we take ( at the base of the jet [244]) and an angle of with the beam direction, since oscillations vanish if is exactly along the beam, while it is maximal for transverse to the beam. Whence .
With the previous parameter choice, using the CAST bound [107] and employing Equations (37) and (101) we see that for Fermi/LAT data we are in the strong-mixing regime but for MAGIC observations we are beyond and thus in the weak mixing regime. Still, we will observe that oscillations are relevant well above .
We calculate the mean free path inside the BLR as
where is the optical depth for the process reported in Figure 13 and represented by blue long-dashed line. As a consequence, to leading order the various terms entering the mixing matrix of Equation (13) are
It is now possible to evaluate the transfer matrix in this region by means of the procedure developed in Appendix A.
7.5. Photon-ALP Oscillations in the Large Scale Jet
We now estimate the oscillations in the jet beyond , which we call region 2. In this zone is believed to possess a toroidal behavior so that [245,246] and reads
Region 2 extends up to , which is defined as the distance where in Equation (107) reaches the value assumed by the strength of turbulent magnetic field in the host elliptical galaxy, whose typical strength is (more about this, later). Accordingly, we get .
By employing Equations (37) and (101) with the previous choice of the parameter values and , we can conclude that the photon/ALP beam propagates in the strong-mixing regime over the whole region 2. Therefore, the plasma, the ALP mass and the QED one-loop terms can be safely neglected. In this region the same is true concerning photon absorption, so that the various terms entering the mixing matrix in Equation (13) are
In the present situation, the transfer matrix can be obtained by analytically solving the beam propagation equation and reads
where is given by Equation (107).
7.6. Photon-ALP Oscillations in the Host Galaxy
As anticipated, FSRQs are usually located in elliptical galaxies, whose is known with great uncertainty. Nevertheless, it is believed that possesses a turbulent nature and can be modeled with a domain-like structure, with strength and domain size equal to [247]. Thus, the photon/ALP beam propagates in this region, which we call region 3 from up to the radius of the host galaxy . The system is in the strong-mixing regime in region 3. By observing that also in this case photon absorption is negligible, the terms entering the mixing matrix in Equation (13) become simply
while the transfer matrix in this region can be calculated by means of a strategy very similar to the one developed in Section 5 and in Appendix A. However, it turns out that in practice oscillations in region 3 are totally negligible.
7.7. Photon-ALP Oscillations in Extragalactic Space
Finally, the photon/ALP beam propagates in extragalactic space from to us. We call this region 4. It goes without saying that the treatment of oscillations in this region is identical to the one developed in Section 5, and we have nothing to add. We denote transfer matrix in the extragalactic space by , where denotes the luminosity distance of PKS 1222+216 (corresponding to .
7.8. Overall Photon-ALP Oscillations
The whole transfer matrix associated with the propagation of the photon/ALP beam from the inner jet of PKS 1222+216 to us can be obtained by multiplying in the correct order the transfer matrices calculated in the previous sections. Correspondingly we obtain
Now, let us consider the total probability that a photon/ALP beam emitted by the considered FSRQ in the state will be detected in the state for a fixed configuration of the direction in each domain of the host galaxy and of the extragalactic space. Unless otherwise stated, we suppose that the angles and of in the magnetic domains of the host galaxy and if extragalactic space, respectively are held fixed. Then Equation (49) entails
with . But since their values are unknown—the situation is formally identical to that considered in Section 5—we are actually dealing with a -dimensional stochastic process. As already discussed in Section 5, the total photon survival probability is therefore given by
where for clarity we have explicitly written all angles that are averaged over.
7.9. Results
We now want to clarify the role of the oscillations for two issues concerning PKS 1222+216.
- The explanation of why MAGIC data have been observed [236].
In order to investigate the first item, we consider the photon survival probability from the center of PKS 1222+216 up to by means of the transfer matrix
The corresponding photon survival probability in the presence of oscillations is given by (65), which presently can be written as
We have considered three benchmark cases for B and .
- .
- .
- .
The curves for corresponding to the above cases are reported in Figure 13, where the red solid line corresponds to case (1), the green short-dashed line to case (2), the violet dashed-dotted line to case (3), while the blue long-dashed line represents the case of conventional physics (as in [189]).
From Figure 13, we see that oscillations greatly reduce the optical depth in the optically thick range. In particular, in the case (1)—which represents our best option—the effective optical depth is almost constant in the MAGIC band around , which corresponds to a photon survival probability of about . Instead, in the optically thin region below ∼30 , the optical depth with oscillations is larger than in conventional physics because a fraction of emitted photons are converted to ALPs close to the source but cannot be converted back. Thus, we have a solution to the first problem, namely why MAGIC data have been observed [236].
Let us turn our attention to the second issue. In order to fit both Fermi/LAT and MAGIC data at once with a physically motivated SED, it is instructive to define the quantity
measuring the ratio between at , which is representative of Fermi/LAT observations, and at which accounts for MAGIC ones. In order to get an acceptable shape for the emitted SED at VHE, we need to have as low as possible. Indeed, a low value of not only would reduce the discrepancy between Fermi/LAT and MAGIC data allowing us to produce a smooth SED, but would also give rise to a big correction to the MAGIC spectrum. By exploring the parameter space we conclude that case (1) looks like the best one.
We now present our model for the emitted spectrum of PKS 1222+216 in the whole -ray band. The emitted spectrum is linked to the observed one by
where z is the redshift of PKS 1222+216 and is computed from the center of PKS 1222+216 to us.
As already stressed, in order to explain the behavior of PKS 1222+216 within conventional physics a two-blob model has been proposed. We recall that a larger blob is located inside the source and is responsible for the emission from IR to soft -rays, and a smaller compact blob—accounting for the emission detected by MAGIC—is present well outside the BLR in order to avoid absorption [238]. We want now to inquire whether a similar two-blob model can produce a physically consistent SED with the key difference that the smaller blob is now located close to the center.
Within case (1)—which we have found to be the best situation—we consider electrons radiating through synchrotron, and inverse Compton processes (with both the internally produced synchrotron radiation and the external radiation from the BLR). In each blob several parameters must be chosen: size r, magnetic field B, bulk Lorentz factor , electron normalization K, minimum, break and maximum Lorentz factors , , , and the low energy () and the high energy () slope of the smoothed power law electron energy distribution. Concerning the larger blob we adopt the same parameters of the original model [238], while for the compact VHE -ray emitting blob we take cm, , , , , , and electron slopes , . The resulting SED is reported in Figure 14 for the above parameters.
Actually, Figure 14 shows that our model not only explains the detection of PKS 1222+216 by MAGIC but also leads to a physical motivated SED. Moreover, according to case (1)—which we restate to be our best option—the VHE luminosity is . While other choices such as case (2) give rise to a satisfactory SED shape (see [76] for details), the corresponding VHE luminosity erg s looks unrealistic, since it is about 100 times larger than that of the brightest VHE blazars (see e.g., [248]). In addition, it turns out that oscillations in extragalactic space is not important for our model, since a SED similar to the one reported in Figure 14 emerges even if such oscillations are discarded (see [76] for details).
In conclusion, without invoking ad hoc models we have solved the problems caused by PKS 1222+216. This fact represents a second strong hint at the existence of an ALP with the properties specified above, since also in this model we have taken . Note that our model can be applied to all other VHE FSRQs with analogous results.
8. Propagation of ALPs in Extragalactic Space—2
So far, we have been dealing with the DLSHE model for the extragalactic magnetic field since at the VHE currently probed by the IACTs the photon-ALP oscillation length is much larger than the size of the magnetic domains.
However, in 2015 Dobrynina, Kartavtsev and Raffelt [145] realized that at even larger energies photon dispersion on the CMB (Cosmic Microwave Background) becomes the leading effect, which implies to decrease as E further increases. Therefore, things completely change whenever , since in this case a full oscillation—or even several oscillations—probe a whole domain, and if it is described unphysically like in the DLSHE model then the results come out unphysical as well. Manifestly, this would be a disaster for the VHE observatories of the next generations, which will reach energies up to 100 TeV or even larger.
This problem can be solved by smoothing out the edges in order to make the change of the magnetic field direction continuous across the domain edges, even if it is still random, as already stressed in Section 4.4. Hence, in both cases only a random single realization of the beam propagation process is observable at once. We still suppose that photon-ALP oscillations are present in the beam from a blazar at redshift z, and so the photon survival probability is denoted by , where and are the two angles that fix the direction of in space at a generic point y along the beam and perpendicularly to it. In order to achieve our goal we have to resort to a domain-like smooth-edges (DLSME) model—mentioned in Section 4.4—wherein the beam propagation equation within a single domain becomes three-dimensional and very difficult to solve analytically. But as shown in [114] such an equation becomes effectively two-dimensional. Moreover, according the above two models [213,215] the strength of should vary rather little in different domains, hence we average it over many domains and attribute in first approximation the resulting value to each domain, denoting it for simplicity again by B. Finally, we consistently we take the transverse magnetic field component .
The two-dimensional beam propagation equation has been solved exactly and analytically [114]. It turns out that such a solution is indistinguishable from the numerical solution of the above three-dimensional exact equation (more about this in [114]). Physically, this amounts to the the whole physics of the problem being confined inside the planes perpendicular to the beam rather than being spread out throughout the full three-dimensional space. As a consequence, , where is the angle between and a fixed fiducial z-direction equal in all domains (namely in all planes ).
8.1. Preliminary Remarks
Broadly speaking, what we said in Section 3 remains unchanged, apart from two facts.
One is that the mixing matrix depends on y also in a single domain, and its explicit form is
The meaning of the terms of is as follows. The contribution from photon dispersion on the CMB is [145], the contribution from the EBL absorption is where denotes the corresponding photon mean free path inside a single domain (more about this, later), the contribution from the plasma frequency of the ionized intergalactic medium is while the remaining terms are and , just like in Section 3.2.
The other fact is that we now have three regimes, separated by the low-energy threshold
which is equal to Equation (37), and the high-energy threshold
Specifically we have:
- —This is the low-energy weak-mixing regime, wherein the terms dominate. Correspondingly, we haveandHowever, since we will not consider this case throughout the paper.
- —This is the intermediate-energy or strong-mixing regime in which the term dominates. Accordingly, we obtainClearly, and are independent of all the energy-dependent terms, and becomes maximal: observe that enters and nowhere else.
- —This is the high-energy weak-mixing regime, which is in a sense a sort of reversed low-energy weak-mixing regime, where however the term dominates over . Correspondingly, we getManifestly, decreases with increasing E and exhibits oscillations in E: this means that the individual realizations of the beam propagation are also oscillating functions of E. Moreover—since —as E increases the photon-ALP oscillations become unobservable at some point.
8.2. Domain-like Smooth-Edges (DLSME) Model
As we said, we are going to apply the DLSME model to a monochromatic photon/ALP beam of energy E emitted by a far-away blazar, propagating through extragalactic space and reaching us [115].
Therefore we briefly summarize this model (see [114] for a full account). We suppose that there are domains between the blazar and us, and we number them so that domain 1 is the one closest to the blazar while domain is the one closest to us. Momentarily, we take all domains with the same length. We denote by the set of coordinates which defines the beginning () and the end () of the n-th domain () towards the blazar.
Because of our ignorance about the strength of in every domain and since it is supposed to vary rather little in different domains, we average B over many domains, and next we attribute the resulting value to each of them, so that B—but not —will henceforth be regarded as constant in first approximation.
As we said the problem is actually a two-dimensional one, since what matters is only . Therefore, we denote by the set of angles that forms with the fixed fiducial z-direction in the middle of every domain. Thanks to the previous assumptions also —but not —can be taken as constant in all domains.
Given the fact that changes randomly from one domain to the next, in order for to be continuous all along the beam it is compelling that it has equal values on both sides of every edge, e.g., the one between the n-th and the -th domain. Thus, the emerging picture is that is homogeneous in the central part, but as the distance from the edge with the -th domain decreases we assume that linearly changes thereby becoming equal to on the same edge but in the -th domain. Accordingly, the continuity of the components of along the whole beam is ensured.
A schematic view of this construction is shown in Figure 15.
In practice, it is useful to define the two quantities and as
where is the smoothing parameter. The interval is the region where the angle changes smoothly from the value in the n-th domain to the value in the ()-th domain. Manifestly, for we have , and we recover the DLSHE model. On the other hand, for then becomes the midpoint of the n-th domain, and likewise becomes the midpoint of the -th domain: now the smoothing is maximal, because we never have a constant value of in any domain. The general case is intermediate—represented by a value of —so that in the central part of a domain the angle is constant () and then it linearly joins the value of the constant angle in the next domain (). Hence, in a generic interval we have
According to our conventions, the blazar redshift is , the points and defining the n-th domain have redshift and (), respectively, and we set for the average redshift of the n-th domain. Similarly, the emitted beam has energy , whereas the beam at points and has energy and (), respectively. Finally, we define the average energy in the n-th domain as , and the observer has energy . As usual, (. We stress that at variance with the previous conventions, the observed beam energy is .
8.3. Propagation over a Single Domain
We proceed along the same lines of Section 5.2, namely we have to account for the EBL absorption and to determine the magnetic field strength in the generic n-th domain of size .
The only novelty is that instead of taking the length of all domains strictly equal, we allow for a small spread. Thus, we assume a probability distribution for the . Owing to the properties of at redshift , we take for the probability density in question the power law inside the range , which means that , indeed allowed by present bounds [209]. Needless to say, such a choice is largely arbitrary and the corresponding histogram is shown in Figure 16.
In order to accomplish this task, we just employ the discussion reported in Section 5.2. Accordingly, we find
with again given by the FR model, and
where is the strength of in the local Universe, namely in the domain closest to the observer ().
So, the above mixing matrix in a single n-th domain is fully determined, and now has and all terms replaced with those evaluated within the n-th domain. It can next be inserted into the reduced Schrödinger-like Equation (19).
8.4. Solution of the Beam Propagation Equation
Our present job is two-fold. In the first place, we have to solve such a reduced Schrödinger equation, which amounts to find its transfer matrix in a single domain. This is the hard part of the game, which is actually the main achievement of [114]. Next, the overall transfer matrix emerges by properly multiplying the transfer matrices pertaining to all domains, which is a trivial implication of quantum mechanics.
The first one amounts to solving the beam propagation equation inside a single n-th domain. The solution reads
for an arbitrary choice of the angle . Unfortunately, the explicit forms of the two transfer matrices in Equation (134) is much too cumbersome to be reported here, and the reader can found them in [114] (see its Equations (54) and (91) with and the appropriate conversions in order to go over from physical space to redshift space).
The second point consists in the evaluation of the whole transfer matrix from the blazar to us, namely along a single arbitrary realization of the whole beam propagation process. Starting from Equation (134) the desired equation presently has the form
Note that this product must be ordered in such a way that the transfer matrices with smaller n must be closer to the source.
8.5. Results
We are finally in a position to derive the desired result, namely the photon survival probability from the blazar to us along an arbitrary realization of the whole beam propagation process. This goal is again trivially achieved thanks to the analogy with non-relativistic quantum mechanics, namely by employ again Equation (84).
As before, the photon polarization cannot be measured at the considered VHE, hence we have to start with the unpolarized beam state and sum the result over the two final polarization states. So, for the reader’s convenience we revert to the same, common notation used in Section 5.2, namely , , . Accordingly, we have
with
Below, the photon survival probability is plotted versus the observed energy for 7 simulated blazars at , assuming for each one our benchmark values . In order to simplify notations, we will denote as . Thousand random realizations of the propagation process have been considered for each choice of z, , . In all figures a random distribution of the domain length has been taken: a power law distribution function has been chosen with exponent and domain length in the interval between the minimal value and the maximal value . The resulting average domain length is . Our results are shown in Figure 17, Figure 18, Figure 19, Figure 20, Figure 21, Figure 22 and Figure 23. We take the smoothing parameter for the transition between two adjacent magnetic domains. The dotted-dashed black line corresponds to conventional physics, the solid light-gray line to the median of all realizations of the propagation process and the solid yellow line to a single realization with a random distribution of both the domain lengths and of the orientation angles of the magnetic field inside the domains. The filled area represents the envelope of the results on the percentile of all the possible realizations of the propagation process at 68% (dark blue), 90% (blue) and 99% (light blue), respectively. In the upper-left panel we have taken , in the upper-right panel , in the lower-left panel and in the lower-right panel [115]. A rather similar approach has been developed in 2017 by Kartavtsev, Raffelt and Vogel, where however only the average photon survival probability is considered [102].
9. A Full Scenario
Up until this point we have especially addressed two specific topics which provide two strong hints at the existence of an ALP with and . In addition, we have considered the propagation of a photon/ALP beam in extragalactic space both for VHE energies currently observed by the IACTs (Section 5) and for energies to be measured by the next generation of VHE observatories (Section 8).
A partial scenario—complementary to the one discussed in Section 5—has been put forward in 2008 and consists in the conversion inside a blazar and the reconversion in the Milky Way, neglecting any possible oscillation in extragalactic space [56].
Our present aim is to discuss a full scenario wherein a VHE photon/ALP beam is described from its origin inside a BL Lac to its detection on Earth. An early attempt towards this goal was done in 2009 [62], but since then much progress has been done. So, our analysis will be performed in the light of the most up-to-date astrophysical information and for energies up to above 50 TeV [116].
We are going to consider three sources.
- Markarian 501 at .
- The extreme BL Lac 1ES 0229+200 at .
- A simulated source like BL Lac 1ES 0229+200 but at
Recall that BL Lacs have been observed up to .
Manifestly, the emitted VHE photon/ALP beam from the BL Lacs in question crosses a variety of magnetic field structures in very different astrophysical environments: inside the BL Lac jet, within the host galaxy, in extragalactic space, and finally inside the Milky Way. Accordingly, we shall have to evaluate the transfer matrix in each of these structures.
Our strategy is to assume a realistic emitted spectrum for the considered three BL Lacs, and derive their observed spectrum up to above 50 TeV.
9.1. Propagation in the BL Lac Jet
We denote by the region where the VHE photons originate inside the BL Lac jet, with denoting its distance from the central supermassive black hole (SMBH). So, our first step is to evaluate the transfer matrix in the jet region between and the end of the jet , which we denote as .
The region is rather far from the central SMBH, and the jet axis is supposed to coincide with the direction y (as usual). In order to evaluate the photon/ALP beam propagation inside the jet we must know three quantities: (1) the distance from the central SMBH, (2) the transverse magnetic field profile from to , (3) the electron density profile from to .
The Synchrotron Self Compton (SSC) diagnostics as applied to the SED of BL Lacs [249] allows us to derive realistic values for these quantities. Inside we find and for definiteness we choose . Moreover, we get , leading in turn to a plasma frequency of , thanks to Equation (20). Although there is no direct way to infer a precise value of , this quantity can be estimated from the size of —which is assumed as measure of the jet cross-section— thus finding . For definiteness, we shall take . Once produced, VHE photons propagate unimpeded out to where they leave the jet, entering the host galaxy. Within , what is relevant is the toroidal part of the magnetic field which is transverse to the jet axis [245,250,251]. Its profile is
Concerning the electron density profile, due to the conical shape of the jet our expectation is
The knowledge of the above quantities allows us to compute the entire propagation process of the photon/ALP beam within the jet, namely .
It should be kept in mind that in we consider the photon/ALP beam in a frame co-moving with the jet, so that we must apply the transformation to the beam in order to go to a fixed frame—as it will be performed in the next regions—with being the Lorentz factor. We take .
9.2. Propagation in the Host Galaxy
All the three considered blazars are hosted by elliptical galaxies, which we denote by . We have already addressed the propagation of a VHE beam in these galaxies in Section 7.6, finding that even if the beam is in the strong-mixing regime the effect of oscillations is totally negligible. Therefore, denoting by and by the points on the y axis where the beam enters and exits from the host galaxy, respectively, we have .
9.3. Propagation in the Extragalactic Space
We let be the region where the photon/ALP beam propagates in the extragalactic space, i.e., from up to the border of the Milky Way . Now the beam behaviour in is affected by the morphology and strength of the extragalactic magnetic field . We have already repeatedly considered this issue in great detail, and for the present purposes in Section 8.
9.4. Propagation in the Milky Way
We denote by the region where the photon/ALP beam propagates inside the Milky Way, i.e., from up to the Earth, whose position is denoted by .
By closely following the strategy described in [74], we compute . In order to take into account the structured behaviour of the Galactic magnetic field we adopt the recent Jansson and Farrar model [252,253], which includes a disk and a halo component, both parallel to the Galactic plane, and a poloidal `X-shaped’ component at the galactic center. Its most updated version is described in [254], where newer polarized synchrotron data and use of different models of the cosmic ray and thermal electron distribution are employed.
The alternative model of the Galactic magnetic field existing in the literature is the one in [255]. However this model is based mainly on data along the Galactic plane so that the Galactic halo component of is not accurately determined. For this reason we prefer to use the Jansson and Farrar model. In any case, we have tested the robustness of our results by employing also this model and—even if with some little modifications—our results are qualitatively unchanged.
While the Jansson and Farrar model allows also for a random and a striated component of the field, it turns out that only the regular component is relevant in the present context, since the oscillation length is much larger than the coherence length of the turbulent field.
Inside the Milky Way disk the electron number density is , resulting in a plasma frequency owing to Equation (20): this emerges from a new model for the distribution of the free electrons in the Galaxy [256]. Moreover, the Galaxy is modeled by an extended thick disk accounting for the so-called warm interstellar medium, a thin disk standing for the Galactic molecular ring, spiral arms (inferred from a new fit to Galactic HII regions), a Galactic Center disk and seven local features counting the Gum Nebula, the Galactic Loop I and the Local Bubble. The model includes also an offset of the Sun from the Galactic plane and a warp of the outer Galactic disk. The Galactic model parameters are obtained from the fit to 189 pulsars with independently determined distances and DMs.
Accordingly, we compute for an arbitrary direction of the line of sight to a given blazar.
9.5. Overall Photon Survival Probability
Because all the transfer matrices in each region are now known, the total transfer matrix describing the propagation of the photon/ALP beam from the VHE photon production region in the BL Lac jet up to the Earth reads
where of course we have and z. Since photon polarization cannot be measured in the VHE gamma-ray band, we have to treat the beam as unpolarized. Therefore, we must use the generalized polarization density matrix . As a consequence, the overall photon survival probability becomes
where
and
Below—merely for notational convenience—we shall replace simply by .
In order to give the reader a feeling of what happens in the various regions crossed by the photon/ALP beam, in Figure 24 we plot how the oscillation length varies as a function of the energy E in the jet, in the extragalactic space and in the Milky Way. As the upper panel of Figure 24 shows, the behaviour of versus E is strongly affected by the value of : as expected (see also [114]), as decreases—when the distance from the emission region increases—the maximal value of increases and the energy where the QED vacuum polarization effect becomes important increases as well. Instead, in the central panel of Figure 24 what happens in extragalactic space is that starts to decrease because of the effect of the photon dispersion on the CMB, which becomes more and more important as E increases (for more details see [114]). Finally, in the lower panel of Figure 24 we see that in the Milky Way is almost constant with E since the QED vacuum polarization effect and photon dispersion on the CMB become subdominant as compared to the photon-ALP mixing in almost all the considered energy range.
9.6. Blazar Spectra
Starting from the intrinsic spectra, we are now in a position to employ the overall photon survival probability in order to derive the observed spectra of the considered three blazars, and from them to infer the corresponding SED in the presence of oscillations all the way from inside the blazar to us. We can thus compare our findings with the results from conventional physics.
The observable physical quantity is the blazar spectrum pertaining to a single random realization of the photon/ALP propagation process. Nevertheless, it is enlightening to contemplate several realizations at once and to compute some of their statistical properties—the median and the area containing the , and of the total number of realizations—in order to check the stability of the result against the distribution of the angles of the extragalactic magnetic field inside each domain with respect to a fixed fiducial direction z equal for all domain. We recall that these angles are independent random variables.
For the three blazars in question, we model their intrinsic spectrum with a power law exponentially truncated at a fixed cut-off energy as
where is a normalization constant accounting for the blazar luminosity, is a reference energy and is the spectral index.
- Markarian 501—This source is a high-frequency peaked blazar (HBL) at redshift . We use the observational data points from HEGRA [257] in a condition where Markarian 501 was observed in a high emission state, which allows us to have a very good quality spectrum up to ∼30 TeV. This fact is important for testing our model, since at such high energies it starts to make predictions which depart from conventional physics. In Figure 25 we report its observed SED when conventional physics alone is considered, and when oscillations are at work. In order to obtain the SED we take , and in Equation (146).
- 1ES 0229+200—This is a BL Lac at redshift . This is the prototype of the so-called `extreme HBL’ (EHBL) [258,259], which exhibit a rather hard VHE observed spectrum up to at least 10 TeV. This fact is particularly interesting since the observed data points at such high energies allow to distinguish between the models based on conventional physics and those containing oscillations. Future observations with the CTA that can eventually reach energies up to 100 TeV can provide a definitive answer. In Figure 26 we plot its observed SED both when only conventional physics is taken into account and in the case in which also oscillations are present. The SED is obtained by taking in Equation (146) in the case of conventional physics, and when also oscillations are considered, while in either case we choose and . Note that is in agreement with the one derived for the Fermi/LAT spectrum in the recent analysis of [259].
- Extreme BL Lac at —BL Lacs have been observed also at redshift , and so we assume the existence of an EHBL at redshift . For this blazar we take a SED similar to the one of 1ES 0229+200, namely , and in Equation (146) for both cases (conventional physics alone, presence of oscillations). We consider two possibilities: (1) such BL Lac is observed in the sky along the direction of the galactic pole: in Figure 27 we plot its observed SED for both cases of presence/absence of photon-ALP interaction; (2) in Figure 28 we exhibit the corresponding observed SED for the same BL Lac instead observed in the sky along the direction of the galactic plane for both cases of presence/absence of photon-ALP interaction.
9.7. Results
Our results about the SED of the above-considered BL Lacs are exhibited in Figure 25 and Figure 28. Generally speaking, the oscillations give rise to a harder observed spectrum for all three sources as compared to the outcome of conventional physics. We stress that this fact becomes increasingly evident as E or z (or both) get larger.
Our findings strongly suggest that oscillations inside the magnetic field of the BL Lac jet play a key role in starting the propagation in extragalactic space with a sizable amount of already produced ALPs, whose relevance depends both on E and on z. This is a rather subtle point and deserves a clear explanation. Superficially, one might expect to increase with , according to the physical intuition. This is certainly true as long as the EBL does not play an important role, namely for E and z low enough. Needless to say, conversions in the BL Lac and back-conversions in the Milky Way help increasing , but not that much. Suppose instead that both and z are fairly large but that E is not, so that photon dispersion on the CMB can be discarded. Accordingly, the conversion probability increases so that inside each single magnetic domain many and conversions take place. But since z is supposed to be fairly large the EBL level is high, so that most of the photons get absorbed. Such a behaviour is very clearly shown in Figure 27 and Figure 28 around . As the energy increases, photon dispersion on the CMB becomes dominant, which causes a much smaller number of and conversions to occur in extragalactic space. By and large, most of the ALPs produced in the BL Lac survive until they enter the Galaxy, whose strong magnetic field allows them to convert to photons. Whence the peak in Figure 27 and Figure 28 around . All figures show that—as E progressively increases beyond —the area covered by the realizations of the photon/ALP propagation process gradually reduces. The reason is that the EBL absorption becomes so high at those energies that almost all the photons in each extragalactic magnetic field domain are absorbed and only the ones reconverted from ALPs inside the Galaxy are observed (as previously mentioned). Therefore, the parameter space of the model— orientation angles, domain lengths —gets reduced, and this fact reduces the available area that can be covered by the realizations of the propagation process.
Observe that in all figures we draw the CTA sensitivity curve for the South site and 50 h of observation. Because the sensitivity curves are relay on conservative criteria [262,263] we expect that the theoretical spectral features—look at the peak in Figure 27 and Figure 28 around —which are close to the sensitivity curve should anyhow be detectable by the CTA.
| * * * |
For the reader’s convenience, we would like to briefly summarize our results. We have investigated the propagation of a photon/ALP beam originating well inside a BL Lac jet and traveling in the jet magnetic field, in the host galaxy magnetic field, in the extragalactic magnetic field, and in the Milky Way magnetic field up to us. We see from Markarian 501 (see Figure 25) that conventional physics does not fit the highest energy point of the SED while the model including oscillations naturally matches the data. For 1ES 0229+200 (see Figure 26) the model including oscillations fits the data remarkably well, especially the highest energy data points of the SED. As far as the simulated 1ES 0229+200 at is concerned, the situation is striking: only oscillations predict the peak around E = (10–30) TeV of the SED, while conventional physics prediction is many order of magnitude below.
As it is evident from Figure 27 and Figure 28—as the redshift increases—at high energies the difference between the results from conventional physics alone, and the model including oscillations becomes more and more dramatic. This is especially true when sizable conversions take place inside a blazar, since then most of the emitted ALPs can become photons only inside the Milky Way magnetic field. In particular, for very distant BL Lacs we predict a peak in the energy spectra at as it is evident from Figure 27 and Figure 28 for a BL Lac at . In addition, the energy oscillations in the observed spectrum—clearly recognizable in the figures—are a clear-cut feature of our scenario, which can be observed provided that the detector has enough energy resolution: they arise from the photon dispersion on the CMB.
A competitive scenario capable to reduce the optical depth is the Lorentz invariance violation (LIV) which could predict a somewhat similar peak in the BL Lac spectra above ∼20 [264,265]. But the two scenarios can be distinguished since the LIV does not predict any spectral energy oscillatory behavior [117].
At this point some remarks look compelling.
- The jet parameters (, ) are affected by uncertainties, and the amount of produced ALPs in this region clearly reflects this fact. Nevertheless, we have checked that the final spectra qualitatively possess the above-mentioned features regardless of the choice of the jet parameters, provided of course that they are realistic.
- Even if we consider very low values of the extragalactic magnetic field—namely —the considered model predicts the above-mentioned features even if partially reduced, in particular concerning the amplitude of the energy oscillations. However, the peak in the spectra at remains unaffected at high redshift.
- The electromagnetic cascade proposed to mimic oscillation effects in blazar spectra [266] can work only for , which is indeed quite close to the lower limits [208,209,210]. Still, for the charged particles produced in the cascade are deflected by and the resulting additional photon flux turns out to be very likely irrelevant (for more details, see e.g., [267]). This argument also applies to the possible additional pairs produced in the process .
- For the infrared radiation from dust present inside the Milky Way could play a moderate role in absorbing photons [268]. But this effect is irrelevant for us and can be safely discarded. Basically, the resulting absorption is substantial only inside the Galactic plane and a few degrees above and below it, hence only ALPs converted to photons in the Galactic plane close to the outer border of the Milky Way disk fully undergo such an effect. Actually, two points should be be stressed. (1) It goes without saying that when the line of sight to the blazar lies outside the galactic plane the considered effect is totally irrelevant. (2) Even for the photon/ALP beam entering the Milky Way along the Galactic plane the oscillations reduce photon absorption, thereby considerably weakening dust absorption.
10. Polarization Effects
As stressed in the Introduction and in Section 2.3, not only the photon-ALP interaction produces oscillations in the presence of an external magnetic field—resulting in several consequences for astrophysical spectra (transparency modification, flux excess, spectrum irregularities)—but it also gives rise to the change of the polarization state of photons. Less attention has been paid to the latter effect in the literature so far. Yet, it gives rise to effects which are potentially detectable from current and planned satellite missions.
10.1. ALP Effects on Photon Polarization
In order to describe the consequences of photon-ALP interaction on the final photon polarization we employ the generalized density matrix associated with the photon-ALP system defined by Equation (46). It can be specialized to describe pure photon states in the x and z direction, which can be expressed by
respectively, the ALP state reading
and unpolarized photons represented by
Instead, the polarization density matrix characterizing partially polarized photons shows an intermediate functional expression between Equations (147) and (149).
Once the transfer matrix of the photon-ALP system is known, the final polarization density matrix can be computed by means of Equation (48) when the initial polarization density matrix is specified. It is useful to express the photonic part of in terms of the Stokes parameters as [269]
The photon degree of linear polarization is defined as [270]
while the polarization angle reads [270]
It is simple algebra to express Equations (151) and (152) in terms of the elements of the matrix with as
and
respectively.
The photon degree of linear polarization at emission is linked to the photon conversion and survival probabilities and in the presence of the photon-ALP interaction. In particular, some theorems stated and proven in [127] show what follows.
- When photon absorption is negligible and photons (without initial ALPs) are emitted with initial degree of linear polarization , the two conditions and hold. If photons are emitted unpolarized () we have the two inequalities and .
- Under the previous conditions, can be viewed as the measure of the overlap between the values assumed by and . If photons are emitted unpolarized (), then and have no overlap apart from the value 1/2, at most.
From item 2 we envisage that photon-ALP interaction can be used to measure emitted photon degree of linear polarization when photon absorption is absent. In order for this strategy to be implemented, the photon-ALP system must be in the weak mixing regime: since and possess an oscillatory behavior in energy, their values oscillate within the bounds ensured by the above theorems and can be inferred. In particular, from an observed astrophysical spectrum we can extract as
where is the emitted spectrum, which is supposed either known or derivable from (for more details see [127]). Moreover, we have since there is no photon absorption. Now, is simply given by the measure of the interval where and overlap, as Figure 29 shows for a typical shape of and .
Such a procedure represents the only known possibility to measure the initial polarization of photons emitted by astrophysical sources, since all other methods can only detect the final . In addition, only flux observations are needed.
10.2. ALP-Induced Polarization Effects in Galaxy Clusters
We now address the impact of photon-ALP interaction on photon polarization for galaxy clusters. We combine the previous results obtained concerning the photon/ALP beam propagation in the different astrophysical backgrounds (galaxy cluster, extragalactic space, Milky Way).
As discussed in Section 4.5, photons produced inside nCC regular clusters are emitted unpolarized in each energy band, so that they have . The photon/ALP beam propagates inside the cluster, in the extragalactic space and in the Milky Way. While crossing these magnetized media, photon-ALP interaction produces a modification in the final and . Concerning the parameters of the photon-ALP system, in order to be specific we take and . Since a diffuse photon emission in the galaxy cluster is considered, we assume a typical nCC regular cluster at a redshift . The cluster magnetic field profile and the electron number density profile are given by Equations (63) and (64) of Section 4.5, respectively. We consider the following parameters entering Equations (63) and (64) and regarded as typical [224,225]: , , , , , , , and a cluster radius of . By evaluating the photon/ALP beam propagation from the cluster central region up to the cluster radius, we compute the transfer matrix of the photon-ALP system inside the cluster . The propagation of the photon/ALP beam in extragalactic space directly follows from Section 8. Thus, by taking an extragalactic magnetic field strength with coherence length in the range and average , we compute the transfer matrix in this region. We recall that oscillations in the Milky Way have been investigated in Section 9.4, which we closely follow. We consider the cluster located in the direction of the galactic pole, where the Milky Way magnetic field strength is minimal, so as to be conservative about oscillations. Hence, we are in a position to evaluate the transfer matrix of the photon-ALP system in the Milky Way .
By combining the previous transfer matrices in the correct order, we obtain the whole transfer matrix associated with the propagation of the photon/ALP beam from the cluster core to us
while the final photon survival probability with oscillations is given by
with reading from Equation (149) and and from Equation (147). Then, the corresponding final degree of linear polarization emerges from Equation (153).
In the left panel of Figure 30 we report in the MeV energy band for a particular realization of the photon/ALP beam propagation process, in the central panel of Figure 30 we plot the corresponding , while in the right panel of Figure 30 we present the probability density function of associated with several realizations at the benchmark energy .
From Figure 30 we observe that the photon/ALP beam propagates in the weak mixing regime, and show an oscillatory energy behavior and . Since is never the most probable result, as the right panel of Figure 30 shows, we can conclude that a signal of can be detected by the planned missions like COSI [271], e-ASTROGAM [272,273] and AMEGO [274]. Similar results have been obtained by considering Coma [129]. Note that in Figure 30 satisfies theorems enunciated and demonstrated in [127] and recalled above.
We have also performed the same procedure for the photon/ALP beam propagation in the VHE range (see [128]). For energies where photon absorption due to the EBL is strong, we have found a feature: photons are fully polarized. The reason is as follows. Since all photons propagating in the extragalactic space are absorbed, only the ALPs reconverted back to photons inside the Milky Way can be detected. Since the Milky Way magnetic field component responsible for photon-ALP conversion is the regular part, photons are fully polarized. In case of a detection of photons completely polarized, this fact would represent a proof for ALP existence. However, observatories cannot measure up to so high energies, yet [275].
10.3. ALP-Induced Polarization Effects in Blazars
In Section 4.1 we have described the blazar properties, which are important for the photon-ALP system. Concerning polarization we have seen that in the X-ray band photons are expected to be partially polarized, while in the MeV and VHE range they are expected to be emitted unpolarized with . In particular, we consider BL Lacs and we take the same parameters of Section 9.1. Thus, we can calculate the transfer matrix of the photon/ALP beam in the blazar jet . Concerning the photon/ALP beam propagation inside the host galaxy we closely follow what we have described in Section 7.6, so that we get the transfer matrix . The transfer matrices of the photon-ALP system in the galaxy cluster , in the extragalactic space and in the Milky Way exactly read from the previous section with the same parameters apart from since we are considering now a CC galaxy cluster. By evaluating the latter three transfer matrices and combining them with and in the correct order we can calculate the total transfer matrix associated to the propagation of the photon/ALP beam from the jet base up to us
while the final photon survival probability in the presence of photon-ALP interaction reads from Equation (157) and the corresponding final degree of linear polarization is given by Equation (153).
The left panel of Figure 31 shows in the MeV energy range for a peculiar realization of the photon/ALP beam propagation process, the central panel of Figure 31 exhibits the corresponding , while the right panel of Figure 31 reports the probability density function of associated to several realizations at the benchmark energy .
Figure 31 shows that the photon/ALP beam is in the weak mixing regime and presents a pseudo-oscillatory behavior with respect to the energy. Correspondingly, we observe in the central panel of Figure 31 that with a high variation. From the right panel of Figure 31, we infer that is never the most probable result. Therefore, we can conclude that a signal of can be observed by observatories such as COSI [271], e-ASTROGAM [272,273] and AMEGO [274]. The present situation is similar but even better with respect to photon production in the cluster central zone (see the previous section). It is possible to verify that in Figure 31 satisfies theorems enunciated and demonstrated in [127] and recalled above.
Furhtermore, in the present case of photon production at the blazar jet base, we have calculated the photon/ALP beam propagation in the VHE range (see [128]). We obtain the same results reported in the previous section about the production of fully polarized photons at VHE, when photon-ALP oscillations are present.
11. Conclusions and Outlook
In the present Review we have tried to summarize the most important implications of ALPs for High Energy Astrophysics (in a broad sense). Two new strong hints at an ALP with and have emerged.
An indirect detection can be made by the new generation of gamma-ray observatories, such as CTA [130], HAWC [131], GAMMA-400 [132], LHAASO [133], TAIGA-HiSCORE [134] and HERD [135].
On the other hand a direct detection can be achieved by means of the experiment called shining through the wall within the next few years, either using a laser at optical frequency such as in the ALP II [136] experiment at DESY or by employing a laser at radiofrequency such as in the planned STAX experiment [137]. Alternatively opportunities are the planned IAXO observatory [138] or the strategies developed by Avignone and collaborators [139,140,141]. Finally, if most of the dark matter is made of the considered ALPs, they can be discovered by the planned experiment ABRACADABRA [142].
Only time will tell!
Author Contributions
G.G. and M.R. have equally contributed, read, and agreed to the published version of the manuscript. Data curation, writing, visualization: all sections have been written by both authors. All authors have read and agreed to the published version of the manuscript.
Funding
The work of G.G. is supported by a contribution from the grant ASI-INAF 2015-023-R.1. M.R. acknowledges the financial support by the TAsP grant of INFN.
Informed Consent Statement
Informed consent was obtained from all subjects involved in the study.
Data Availability Statement
Data used in this paper can be asked to the authors of the quoted papers.
Acknowledgments
We would like to thank all our collaborators in this field, and especially Alessandro De Angelis and Fabrizio Tavecchio. We also thank the referees for suggesting the clarification of some points. We wish to dedicate this work to the memory of our friend and collaborator Nanni Bignami.
Conflicts of Interest
The authors declare no conflict of interest.
Appendix A
We solve here the mathematical problem of finding the transfer matrix associated with the reduced Schödinger-like equation
with
as in the text, and mixing matrix of the form
where the coefficients s, t, u and v are supposed to be complex numbers.
We start by diagonalizing . Its eigenvalues are
and it is straightforward to check that the corresponding eigenvectors can be taken to be
Correspondingly, any solution of Equation (A1) can be represented in the form
where , , and are arbitrary constants. As a consequence, the solution with initial condition
emerges from Equation (A10) for
It is a simple exercize to recast the considered solution into the form
with
where we have set
from which it follows that the desired transfer matrix is just as given by Equation (A16).
Appendix B
The key-point of the ALP scenario—already stressed in Section 3.6—is that ALPs do neither interact with the EBL—in spite of the fact that they couple to two photons—nor with the ionized intergalactic medium. The proof is as follows ALPs might interact with the EBL only through two processes: and , where f denotes a generic charged fermion.
Consider first the process represented by the Feynman diagram in Figure A1 in the s-channel. A simple estimate gives , and enforcing the CAST bound we find , which shows that this process is negligibly small for any reasonable choice of and . Let us next turn our attention to the process represented by the Feynman diagram in Figure A2 in the s-channel. Accordingly we have , which—thanks to the CAST bound—yields . Finally, we address the process represented by the Feynman diagram in Figure A2 in the t-channel. Manifestly, we have again and so . Therefore, for all practical purposes ALPs neither interact with photons nor with any fermion.
Figure A1.
Feynman diagram for the scattering.

Figure A2.
This Feynman diagram represents the scattering in the s-channel and the scattering in the u-channel.
Figure A2.
This Feynman diagram represents the scattering in the s-channel and the scattering in the u-channel.

Appendix C

Table A1.
Considered VHE blazars with redshift z, spectral slope , energy range and normalization constant . Statistical and systematic errors are added in quadrature to produce the total error reported on the measured spectral slope. When only statistical errors are quoted, systematic errors are taken to be 0.1 for H.E.S.S., 0.15 for VERITAS, and 0.2 for MAGIC.
| Source | z | [TeV] | ||
|---|---|---|---|---|
| Mrk 421 | 0.031 | |||
| Mrk 501 | 0.034 | |||
| 1ES 2344+514 | 0.044 | |||
| Mrk 180 | 0.045 | |||
| 1ES 1959+650 | 0.048 | |||
| 1ES 1959+650 | 0.048 | |||
| 1ES 1727+502 | 0.055 | |||
| PKS 1440-389 | 0.065 | |||
| PKS 0548-322 | 0.069 | |||
| PKS 2005-489 | 0.071 | |||
| 1ES 1741+196 | 0.084 | |||
| SHBL J001355.9-185406 | 0.095 | |||
| W Comae | 0.102 | |||
| BL Lacertae | 0.069 | |||
| 1ES 1312-423 | 0.105 | |||
| PKS 2155-304 | 0.116 | |||
| B3 2247+381 | 0.1187 | |||
| RGB J0710+591 | 0.125 | |||
| H 1426+428 | 0.129 | |||
| 1ES 1215+303 | 0.13 | |||
| 1ES 1215+303 | 0.13 | |||
| 1ES 0806+524 | 0.138 | |||
| 1RXS J101015.9-311909 | 0.142639 | |||
| 1ES 1440+122 | 0.163 | |||
| H 2356-309 | 0.165 | |||
| RX J0648.7+1516 | 0.179 | |||
| 1ES 1218+304 | 0.182 | |||
| 1ES 1101-232 | 0.186 | |||
| RBS 0413 | 0.19 | |||
| 1ES 1011+496 | 0.212 | |||
| PKS 0301-243 | 0.2657 | |||
| 1ES 0414+009 | 0.287 | |||
| OJ 287 | 0.306 | |||
| S5 0716+714 | 0.31 | |||
| TXS 0506+056 | 0.3365 | |||
| 3C 66A | 0.34 | |||
| PKS 0447-439 | 0.343 | |||
| 1ES 0033+595 | 0.467 | |||
| PG 1553+113 | 0.5 |
| 1 | Other processes discussed in [144] are totally irrelevant for the energy range considered in this paper. |
References
- Corianò, C.; Irges, N. Windows over a new low energy axion. Phys. Lett. B 2007, 651, 298–305. [Google Scholar] [CrossRef] [Green Version]
- Corianò, C.; Irges, N.; Morelli, S. Stückelberg axions and the effective action of anomalous abelian models 1. A unitarity analysis of the Higgs-axion mixing. J. High Energy Phys. 2007, 2007, 008. [Google Scholar] [CrossRef] [Green Version]
- Baer, H.; Krami, S.; Sekmen, S.; Summy, H. Dark matter allowed scenarios for Yukawa-unified SO(10) SUSY GUTs. J. High Energy Phys. 2008, 2008, 056. [Google Scholar] [CrossRef] [Green Version]
- Baer, H.; Summy, H. SO (10) SUSY GUTs, the gravitino problem, non-thermal leptogenesis and axino dark matter. Phys. Lett. B 2008, 666, 5–9. [Google Scholar] [CrossRef] [Green Version]
- Baer, H.; Haider, M.; Kraml, S.; Sekmen, S.; Summy, H. Cosmological consequences of Yukawa-unified SUSY with mixed axion/axino cold and warm dark matter. J. Cosmol. Astropart. Phys. 2009, 2009, 002. [Google Scholar] [CrossRef]
- Chang, S.; Tazawa, S.; Yamaguchi, M. Axion model in extra dimensions with TeV scale gravity. Phys. Rev. D 2000, 61, 084005. [Google Scholar] [CrossRef] [Green Version]
- Dienes, K.R.; Dudas, E.; Gherghetta, T. Invisible axions and large-radius compactifications. Phys. Rev. D 2000, 62, 105023. [Google Scholar] [CrossRef] [Green Version]
- Jaeckel, J.; Ringwald, A. The Low-Energy Frontier of Particle Physics. Ann. Rev. Nucl. Part. Sci. 2010, 60, 405–437. [Google Scholar] [CrossRef] [Green Version]
- Ringwald, A. Exploring the role of axions and other WISPs in the dark universe. Phys. Dark Univ. 2012, 1, 116–135. [Google Scholar] [CrossRef]
- Turok, N. Almost-Goldstone Bosons from Extra-Dimensional Gauge Theories. Phys. Rev. Lett. 1996, 76, 1015. [Google Scholar] [CrossRef] [Green Version]
- Witten, E. Some properties of O(32) superstrings. Phys. Lett. B 1984, 149, 351–356. [Google Scholar] [CrossRef]
- Conlon, J.P. The QCD axion and moduli stabilisation. J. High Energy Phys. 2006, 2006, 078. [Google Scholar] [CrossRef] [Green Version]
- Svrcek, P.; Witten, E. Axions in string theory. J. High Energy Phys. 2006, 2006, 051. [Google Scholar] [CrossRef] [Green Version]
- Conlon, J.P. Seeing an Invisible Axion in the Supersymmetric Particle Spectrum. Phys. Rev. Lett. 2006, 97, 261802. [Google Scholar] [CrossRef] [PubMed] [Green Version]
- Choi, K.-S.; Kim, I.-W.; Kim, J.E. String compactification, QCD axion and axion–photon–photon coupling. J. High Energy Phys. 2007, 2007, 116. [Google Scholar] [CrossRef]
- Arvanitaki, A.; Dimopoulos, S.; Dubovsky, S.; Kaloper, N.; March-Russell, J. String axiverse. Phys. Rev. D 2010, 81, 123530. [Google Scholar] [CrossRef] [Green Version]
- Acharya, B.S.; Bobkov, K.; Kumar, P. An M theory solution to the strong CP-problem, and constraints on the axiverse. J. High Energy Phys. 2010, 11, 105. [Google Scholar] [CrossRef] [Green Version]
- Cicoli, M.; Goodsell, M.; Ringwald, A. The type IIB string axiverse and its low-energy phenomenology. J. High Energy Phys. 2012, 10, 146. [Google Scholar] [CrossRef] [Green Version]
- Cicoli, M. Axion-like Particles from String Compactifications. In Proceedings of the Contributed to the 9th Patras Workshop on Axions, WIMPs and WISPs, Mainz, Germany, 24–28 June 2013. [Google Scholar]
- Dias, A.G.; Machado, A.C.B.; Nishi, C.C.; Ringwald, A.; Vaudrevange, P. The quest for an intermediate-scale accidental axion and further ALPs. J. High Energy Phys. 2014, 2014, 037. [Google Scholar] [CrossRef]
- Cicoli, M. Global D–brane models with stabilised moduli and light axions. Phys. J. Conf. Ser. 2014, 485, 012064. [Google Scholar] [CrossRef] [Green Version]
- Conlon, J.C.; Day, F. 3.55 keV photon lines from axion to photon conversion in the Milky Way and M31. J. Cosmol. Astropart. Phys. 2014, 11, 033. [Google Scholar] [CrossRef] [Green Version]
- Cicoli, M.; Conlon, J.C.; Marsh, M.C.D.; Rummel, M. 3.55 keV photon line and its morphology from a 3.55 keV axionlike particle line. Phys. Rev. D 2014, 90, 023540. [Google Scholar] [CrossRef] [Green Version]
- Kralijc, D.; Rummel, M.; Conlon, J.C. ALP conversion and the soft X-ray excess in the outskirts of the Coma cluster. J. Cosmol. Astropart. Phys. 2015, 2015, 011. [Google Scholar] [CrossRef] [Green Version]
- Cicoli, M.; Diaz, V.A.; Guidetti, V.; Rummel, M. The 3.5 keV line from stringy axions. J. High Energy Phys. 2017, 10, 192. [Google Scholar] [CrossRef] [Green Version]
- Scott, M.J.; Marsh, D.J.E.; Pongkitivanichkul, C.; Price, L.C.; Acharya, B.S. Spectrum of the axion dark sector. Phys. Rev. D 2017, 96, 083510. [Google Scholar]
- Conlon, J.P. Searches for 3.5 keV absorption features in cluster AGN spectra. Mon. Not. R. Astron. Soc. 2018, 1, 348–352. [Google Scholar] [CrossRef]
- Cisterna, A.; Hassaine, M.; Oliva, J.; Rinaldi, M. Axionic black branes in the k-essence sector of the Horndeski model. Phys. Rev. D 2017, 96, 124033. [Google Scholar] [CrossRef] [Green Version]
- Cisterna, A.; Erices, C.; Kuang, X.-M.; Rinaldi, M. Axionic black branes with conformal coupling. Phys. Rev. D 2018, 97, 124052. [Google Scholar] [CrossRef] [Green Version]
- Maiani, L.; Petronzio, R.; Zavattini, E. Effects of nearly massless, spin-zero particles on light propagation in a magnetic field. Phys. Lett. B 1986, 175, 359–363. [Google Scholar] [CrossRef] [Green Version]
- Anselm, A.A. Experimental test for arion ⇆ photon oscillations in a homogeneous constant magnetic field. Phys. Rev. D 1988, 37, 2001. [Google Scholar] [CrossRef]
- Raffelt, G.G.; Stodolsky, L. Mixing of the photon with low-mass particles. Phys. Rev. D 1988, 37, 1237. [Google Scholar] [CrossRef] [PubMed] [Green Version]
- Raffelt, G.G. Stars as Laboratories for Fundamental Physics; The University of Chicago Press: Chicago, IL, USA, 1996. [Google Scholar]
- Preskill, J.; Wise, M.B.; Wilczek, F. Cosmology of the invisible axion. Phys. Lett. B 1983, 120, 127–132. [Google Scholar] [CrossRef] [Green Version]
- Abbott, L.F.; Sikivie, P. A cosmological bound on the invisible axion. Phys. Lett. B 1983, 120, 133–136. [Google Scholar] [CrossRef]
- Dine, M.; Fischler, W. The not-so-harmless axion. Phys. Lett. B 1983, 120, 137–141. [Google Scholar] [CrossRef]
- Arias, P.; Cadamuro, D.; Goodsell, M.; Jaeckel, J.; Redondo, J.; Ringwald, A. WISPy cold dark matter. J. Cosmol. Astropart. Phys. 2012, 2012, 008. [Google Scholar] [CrossRef]
- Alonso-Álvarez, G.; Gupta, R.S.; Jaekel, J.; Spannowsky, M. On the wondrous stability of ALP dark matter. J. Cosmol. Astropart. Phys. 2020, 2020, 052. [Google Scholar] [CrossRef] [Green Version]
- Berezhiani, Z.G.; Sakharov, A.S.; Khlopov, Y.M. Primordial background of cosmological axions. Sov. Nucl. J. Phys. 1992, 55, 1063. [Google Scholar]
- Sakharov, A.S.; Khlopov, Y.M. Cosmological signatures of family symmetry breaking in multicomponent inflation models. Phys. At. Nucl. 1993, 56, 412–417. [Google Scholar]
- Sakharov, A.; Sokoloff, D.; Khlopov, Y.M. Large-scale modulation of the distribution of coherent oscillations of a primordial axion field in the universe. Phys. At. Nucl. 1996, 59, 1005–1010. [Google Scholar]
- Brockway, J.W.; Carlson, E.D.; Raffelt, G.G. SN 1987A gamma-ray limits on the conversion of pseudoscalars. Phys. Lett. B 1996, 383, 439–443. [Google Scholar] [CrossRef] [Green Version]
- Grifols, J.A.; Massó, E.; Toldrà, R. Gamma rays from SN 1987A due to pseudoscalar conversion. Phys. Rev. Lett. 1996, 77, 2372. [Google Scholar] [CrossRef] [Green Version]
- Csáki, C.; Kaloper, N.; Terning, J. Dimming supernovae without cosmic acceleration. Phys. Rev. Lett. 2002, 88, 161302. [Google Scholar] [CrossRef] [PubMed] [Green Version]
- Csáki, C.; Kaloper, N.; Terning, J. Effects of the intergalactic plasma on supernova dimming via photon–axion oscillations. Phys. Lett. B 2002, 535, 33–36. [Google Scholar] [CrossRef] [Green Version]
- Jain, P.; Panda, S.; Sarala, S. Electromagnetic polarization effects due to axion-photon mixing. Phys. Rev. D 2002, 66, 085007. [Google Scholar] [CrossRef] [Green Version]
- Christensson, M.; Fairbairn, M. Photon–axion mixing in an inhomogeneous universe. Phys. Lett. B 2003, 565, 10–18. [Google Scholar] [CrossRef]
- Dupays, A.; Rizzo, C.; Roncadelli, M.; Bignami, G.F. Looking for light pseudoscalar bosons in the binary pulsar system J0737-3039. Phys. Rev. Lett. 2005, 95, 211302. [Google Scholar] [CrossRef] [Green Version]
- Massó, E.; Redondo, J. Evading astrophysical constraints on axion-like particles. J. Cosmol. Astropart. Phys. 2005, 2005, 015. [Google Scholar] [CrossRef]
- Fairbairn, M.; Rashba, T.; Troitsky, S. Transparency of the Sun to gamma rays due to axionlike particles. Phys. Rev. Lett. 2007, 98, 201801. [Google Scholar] [CrossRef] [Green Version]
- Mirizzi, A.; Raffelt, G.G.; Serpico, P.D. Signatures of axionlike particles in the spectra of TeV gamma-ray sources. Phys. Rev. D 2007, 76, 023001. [Google Scholar] [CrossRef] [Green Version]
- De Angelis, A.; Roncadelli, M.; Mansutti, O. Evidence for a new light spin-zero boson from cosmological gamma-ray propagation? Phys. Rev. D 2007, 76, 121301. [Google Scholar] [CrossRef] [Green Version]
- Hooper, D.; Serpico, P.D. Detecting axionlike particles with gamma ray telescopes. Phys. Rev. Lett. 2007, 99, 231102. [Google Scholar] [CrossRef] [PubMed] [Green Version]
- Hochmuth, K.A.; Sigl, G. Effects of axion-photon mixing on gamma-ray spectra from magnetized astrophysical sources. Phys. Rev. D 2007, 76, 123011. [Google Scholar] [CrossRef] [Green Version]
- De Angelis, A.; Mansutti, O.; Roncadelli, M. Axion-like particles, cosmic magnetic fields and gamma-ray astrophysics. Phys. Lett. B 2008, 659, 847–855. [Google Scholar] [CrossRef] [Green Version]
- Simet, M.; Hooper, D.; Serpico, P.D. Milky Way as a kiloparsec-scale axionscope. Phys. Rev. D 2008, 77, 063001. [Google Scholar] [CrossRef] [Green Version]
- De Angelis, A.; Mansutti, O.; Persic, M.; Roncadelli, M. Photon propagation and the very high energy γ-ray spectra of blazars: How transparent is the Universe? Mon. Not. Astron. R. Soc. 2009, 394, L21. [Google Scholar] [CrossRef] [Green Version]
- Mirizzi, A.; Montanino, D. Stochastic conversions of TeV photons into axion-like particles in extragalactic magnetic fields. J. Cosmol. Astropart. Phys. 2009, 12, 004. [Google Scholar] [CrossRef] [Green Version]
- Chelouche, D.; Rabadan, R.; Pavolv, S.S.; Castejon, F. Spectral Signatures of Photon-Particle Oscillations from Celestial Objects. Astrophys. Suppl. J. 2009, 180, 1. [Google Scholar] [CrossRef]
- Chelouche, D.; Guendelman, E. Cosmic Analogs of the Stern-Gerlach Experiment and the Detection of Light Bosons. Astrophys. J. 2009, 699, L5. [Google Scholar] [CrossRef] [Green Version]
- Burrage, C.; Davis, A.-C.; Shaw, D.J. Detecting chameleons: The astronomical polarization produced by chameleonlike scalar fields. Phys. Rev. D 2009, 79, 044028. [Google Scholar] [CrossRef] [Green Version]
- Sánchez-Conde, M.A.; Paneque, D.; Bloom, E.; Prada, F.; Domínguez, A. Hints of the existence of axionlike particles from the gamma-ray spectra of cosmological sources. Phys. Rev. D 2009, 79, 123511. [Google Scholar] [CrossRef]
- Bassan, N.; Roncadelli, M. Photon-axion conversion in Active Galactic Nuclei? arXiv 2009, arXiv:0905.3752. [Google Scholar]
- Bassan, N.; Mirizzi, A.; Roncadelli, M. Axion-like particle effects on the polarization of cosmic high-energy gamma sources. J. Cosmol. Astropart. Phys. 2010, 2010, 010. [Google Scholar] [CrossRef]
- Mena, O.; Razzaque, S.; Villaescusa-Navarro, F. Signatures of photon and axion-like particle mixing in the gamma-ray burst jet. J. Cosmol. Astropart. Phys. 2011, 2011, 030. [Google Scholar] [CrossRef] [Green Version]
- Domínguez, A.; Sánchez-Conde, M.A.; Prada, F. Axion-like particle imprint in cosmological very-high-energy sources. J. Cosmol. Astropart. Phys. 2011, 2011, 020. [Google Scholar] [CrossRef]
- Gill, R.; Heyl, J.S. Constraining the photon-axion coupling constant with magnetic white dwarfs. Phys. Rev. D 2011, 84, 085001. [Google Scholar] [CrossRef] [Green Version]
- Agarwal, N.; Kamal, A.; Jain, P. Alignments in quasar polarizations: Pseudoscalar-photon mixing in the presence of correlated magnetic fields. Phys. Rev. D 2011, 83, 065014. [Google Scholar] [CrossRef] [Green Version]
- Payez, A.; Cudell, J.R.; Hutsemekers, D. Can axionlike particles explain the alignments of the polarizations of light from quasars? Phys. Rev. D 2011, 84, 085029. [Google Scholar] [CrossRef] [Green Version]
- De Angelis, A.; Galanti, G.; Roncadelli, M. Relevance of axionlike particles for very-high-energy astrophysics. Phys. Rev. D 2011, 84, 105030, Erratum in Phys. Rev. D 2013, 87, 109903. [Google Scholar] [CrossRef] [Green Version]
- Fairbairn, M.; Rashba, T.; Troitsky, S. Photon-axion mixing and ultra-high energy cosmic rays from BL Lac type objects: Shining light through the Universe. Phys. Rev. D 2011, 84, 125019. [Google Scholar] [CrossRef] [Green Version]
- Horns, D.; Meyer, M. Indications for a pair-production anomaly from the propagation of VHE gamma-rays. J. Cosmol. Astropart. Phys. 2012, 2012, 033. [Google Scholar] [CrossRef] [Green Version]
- Horns, D.; Maccione, L.; Mirizzi, A.; Roncadelli, M. Probing axionlike particles with the ultraviolet photon polarization from active galactic nuclei in radio galaxies. Phys. Rev. D 2012, 85, 085021. [Google Scholar] [CrossRef] [Green Version]
- Horns, D.; Maccione, L.; Meyer, M.; Mirizzi, A.; Montanino, D.; Roncadelli, M. Hardening of TeV gamma spectrum of active galactic nuclei in galaxy clusters by conversions of photons into axionlike particles. Phys. Rev. D 2012, 86, 075024. [Google Scholar] [CrossRef] [Green Version]
- Wouters, D.; Brun, P. Irregularity in gamma ray source spectra as a signature of axionlike particles. Phys. Rev. D 2012, 86, 043005. [Google Scholar] [CrossRef] [Green Version]
- Tavecchio, F.; Roncadelli, M.; Galanti, G.; Bonnoli, G. Evidence for an axion-like particle from PKS 1222+216? Phys. Rev. D 2012, 86, 085036. [Google Scholar] [CrossRef] [Green Version]
- Agarwal, N.; Aluri, P.K.; Jain, P.; Khanna, U.; Tiwari, P. A complete 3D numerical study of the effects of pseudoscalar–photon mixing on quasar polarizations. Eur. Phys. J. C 2012, 72, 1928. [Google Scholar] [CrossRef] [Green Version]
- Perna, R.; Ho, W.C.G.; Verde, L.; Adelsberg, M.; Jimenez, R. Signatures of photon-axion conversion in the thermal spectra and polarization of neutron stars. Astrophys. J. 2012, 748, 116. [Google Scholar] [CrossRef]
- Friedland, A.; Giannotti, M.; Wise, M. Constraining the axion-photon coupling with massive stars. Phys. Rev. Lett. 2013, 110, 061101. [Google Scholar] [CrossRef] [Green Version]
- Carosi, G.; Friedland, A.; Giannotti, M.; Pivovaroff, M.J.; Ruz, J.; Vogel, J.K. Probing the axion-photon coupling: Phenomenological and experimental perspectives. A snowmass white paper. arXiv 2013, arXiv:1309.7035. [Google Scholar]
- Conlon, J.P.; David Marsh, M.C. Excess astrophysical photons from a 0.1–1 keV cosmic axion background. Phys. Rev. Lett. 2013, 111, 151301. [Google Scholar] [CrossRef] [Green Version]
- Meyer, M.; Horns, D.; Raue, M. First lower limits on the photon-axion-like particle coupling from very high energy gamma-ray observations. Phys. Rev. D 2013, 87, 035027. [Google Scholar] [CrossRef] [Green Version]
- Abramowski, A.; Acero, F.; Aharonian, F.; Ait Benkhali, F.; Akhperjanian, A.G.; Angüner, E.; Anton, G.; Balenderan, S.; Balzer, A.; Barnacka, A.; et al. Constraints on axionlike particles with H.E.S.S. from the irregularity of the PKS 2155–304 energy spectrum. Phys. Rev. D 2013, 88, 102003. [Google Scholar] [CrossRef] [Green Version]
- Galanti, G.; Roncadelli, M. Comment on “Irregularity in gamma ray source spectra as a signature of axion-like particles”. arXiv 2013, arXiv:1305.2114. [Google Scholar]
- Meyer, M.; Horns, D. Impact of oscillations of photons into axion-like particles on the very-high energy gamma-ray spectrum of the blazar PKS1424+240. arXiv 2013, arXiv:1310.2058. [Google Scholar]
- Meyer, M.; Montanino, D.; Conrad, J. On detecting oscillations of gamma rays into axion-like particles in turbulent and coherent magnetic fields. J. Cosmol. Astropart. Phys. 2014, 2014, 003. [Google Scholar] [CrossRef] [Green Version]
- Angus, S.; Conlon, J.P.; Marsh, M.C.D.; Powell, A.; Witkowski, L.T. Soft X-ray excess in the Coma cluster from a cosmic axion background. J. Cosmol. Astropart. Phys. 2014, 2014, 026. [Google Scholar] [CrossRef] [Green Version]
- Rubtsov, G.I.; Troitsky, S.V. Breaks in gamma-ray spectra of distant blazars and transparency of the Universe. JETP Lett. 2014, 100, 355–359. [Google Scholar] [CrossRef] [Green Version]
- Wouters, D.; Brun, P. Anisotropy test of the axion-like particle Universe opacity effect: A case for the Cherenkov Telescope Array. J. Cosmol. Astropart. Phys. 2014, 2014, 016. [Google Scholar] [CrossRef] [Green Version]
- Harris, J.; Chadwick, P.M. Photon-axion mixing within the jets of active galactic nuclei and prospects for detection. J. Cosmol. Astropart. Phys. 2014, 10, 018. [Google Scholar] [CrossRef] [Green Version]
- Meyer, M.; Conrad, J. Sensitivity of the Cherenkov Telescope Array to the detection of axion-like particles at high gamma-ray opacities. J. Cosmol. Astropart. Phys. 2014, 2014, 016. [Google Scholar] [CrossRef] [Green Version]
- Ayala, A.; Domínguez, I.; Giannotti, M.; Mirizzi, A.; Straniero, O. Revisiting the Bound on Axion-Photon Coupling from Globular Clusters. Phys. Rev. Lett. 2014, 113, 191302. [Google Scholar] [CrossRef] [Green Version]
- Biteau, J.; Williams, D.A. The extragalactic background light, the Hubble constant, and anomalies: Conclusions from 20 years of TeV gamma-ray observations. Astrophys. J. 2015, 812, 60. [Google Scholar] [CrossRef] [Green Version]
- Payez, A.; Evoli, C.; Fischer, T.; Giannotti, M.; Mirizzi, A.; Ringwald, A. Revisiting the SN1987A gamma-ray limit on ultralight axion-like particles. J. Cosmol. Astropart. Phys. 2015, 2015, 006. [Google Scholar] [CrossRef] [Green Version]
- Tavecchio, F.; Roncadelli, M.; Galanti, G. Photons to axion-like particles conversion in Active Galactic Nuclei. Phys. Lett. B 2015, 744, 375–379. [Google Scholar] [CrossRef] [Green Version]
- Berenji, B.; Gaskins, J.; Meyer, M. Constraints on axions and axionlike particles from Fermi Large Area Telescope observations of neutron stars. Phys. Rev. D 2016, 93, 045019. [Google Scholar] [CrossRef] [Green Version]
- Ajello, M.; Anderson, B.; Baldini, L.; Barbiellini, G.; Bastieri, D.; Bellazzini, R.; Bissaldi, E.; Blandford, R.D.; Bloom, E.D.; Bonino, R. Search for spectral irregularities due to photon–axionlike-particle oscillations with the Fermi Large Area Telescope. Phys. Rev. Lett. 2016, 116, 161101. [Google Scholar]
- Day, F. Cosmic axion background propagation in galaxies. Phys. Lett. B 2016, 753, 600–611. [Google Scholar] [CrossRef] [Green Version]
- Schlederer, M.; Sigl, G. Constraining ALP-photon coupling using galaxy clusters. J. Cosmol. Astropart. Phys. 2016, 2016, 038. [Google Scholar] [CrossRef] [Green Version]
- Kohri, K.; Kodama, H. Axion-like particles and recent observations of the cosmic infrared background radiation. Phys. Rev. D 2017, 96, 051701. [Google Scholar] [CrossRef] [Green Version]
- Sigl, G. Astrophysical haloscopes. Phys. Rev. D 2017, 96, 103014. [Google Scholar] [CrossRef] [Green Version]
- Kartavtsev, A.; Raffelt, G.; Vogel, H. Extragalactic photon-ALP conversion at CTA energies. J. Cosmol. Astropart. Phys. 2017, 2017, 024. [Google Scholar] [CrossRef] [Green Version]
- Marsh, M.C.D.; Russell, H.R.; Fabian, A.C.; McNamara, B.R.; Nulsen, P.; Reynolds, C.S. A new bound on axion-like particles. J. Cosmol. Astropart. Phys. 2017, 2017, 036. [Google Scholar] [CrossRef] [Green Version]
- Bauer, M.; Neubert, M.; Thamm, A. Collider probes of axion-like particles. J. High Energy Phys. 2017, 2017, 044. [Google Scholar] [CrossRef] [Green Version]
- Vogel, H.; Laha, R.; Meyer, M. Diffuse axion-like particle searches. arXiv 2017, arXiv:1712.01839. [Google Scholar]
- Montanino, D.; Vazza, F.; Mirizzi, A.; Viel, M. Enhancing the spectral hardening of cosmic TeV photons by mixing with axionlike particles in the magnetized cosmic web. Phys. Rev. Lett. 2017, 119, 101101. [Google Scholar] [CrossRef] [Green Version]
- CAST Collaboration. New CAST limit on the axion–photon interaction. Nat. Phys. 2017, 13, 584–590. [Google Scholar] [CrossRef]
- Berg, M.; Conlon, J.P.; Day, F.; Jennings, N.; Krippendorf, S.; Powell, A.J.; Rummel, M. Constraints on axion-like particles from X-ray observations of NGC1275. Astrophys. J. 2017, 847, 101. [Google Scholar] [CrossRef] [Green Version]
- Conlon, J.P.; Day, F.; Jennings, N.; Krippendorf, S.; Rummel, M. Constraints on axion-like particles from non-observation of spectral modulations for X-ray point sources. J. Cosmol. Astropart. Phys. 2017, 2017, 005. [Google Scholar] [CrossRef] [Green Version]
- Day, F.; Krippendorf, S. Searching for axion-like particles with X-ray polarimeters. Galaxies 2018, 6, 45. [Google Scholar] [CrossRef] [Green Version]
- Zhang, C.; Liang, Y.-F.; Li, S.; Liao, N.-H.; Feng, L.; Yuan, Q.; Fan, Y.-Z.; Ren, Z.-Z. New bounds on axionlike particles from the Fermi Large Area Telescope observation of PKS 2155-304. Phys. Rev. D 2018, 97, 063009. [Google Scholar] [CrossRef] [Green Version]
- Cardoso, V.; Dias, Ó.J.C.; Hartnett, G.S.; Middleton, M.; Pani, P.; Santos, J.E. Constraining the mass of dark photons and axion-like particles through black-hole superradiance. J. Cosmol. Astropart. Phys. 2018, 2018, 043. [Google Scholar] [CrossRef] [Green Version]
- Moroi, T.; Nakayama, K.; Tang, Y. Axion-photon conversion and effects on 21 cm observation. Phys. Lett. B 2018, 783, 301–305. [Google Scholar] [CrossRef]
- Galanti, G.; Roncadelli, M. Behavior of axionlike particles in smoothed out domainlike magnetic fields. Phys. Rev. D 2018, 98, 043018. [Google Scholar] [CrossRef] [Green Version]
- Galanti, G.; Roncadelli, M. Extragalactic photon–axion-like particle oscillations up to 1000 TeV. JHEAp 2018, 20, 1–17. [Google Scholar] [CrossRef]
- Galanti, G.; Tavecchio, F.; Roncadelli, M.; Evoli, C. Blazar VHE spectral alterations induced by photon–ALP oscillations. Mon. Not. Astron. R. Soc. 2019, 487, 123. [Google Scholar] [CrossRef] [Green Version]
- Galanti, G.; Tavecchio, F.; Landoni, M. Fundamental physics with blazar spectra: A critical appraisal. Mon. Not. Astron. R. Soc. 2020, 491, 5268. [Google Scholar] [CrossRef]
- Galanti, G.; Roncadelli, M.; De Angelis, A.; Bignami, G.F. Hint at an axion-like particle from the redshift dependence of blazar spectra. Mon. Not. Astron. R. Soc. 2020, 493, 1553. [Google Scholar] [CrossRef]
- Meyer, M.; Petrushevska, T.; Fermi-LAT Collaboration. Search for Axionlike-Particle-Induced Prompt γ-Ray Emission from Extragalactic Core-Collapse Supernovae with the Fermi Large Area Telescope. Phys. Rev. Lett. 2020, 124, 231101, Erratum ibid. 2020, 125, 119901. [Google Scholar] [CrossRef]
- Li, H.-J.; Guo, J.-G.; Bi, X.-J.; Lin, S.-J.; Yin, P.-F. Limits on axionlike particles from Mrk 421 with 4.5-year period observations by ARGO-YBJ and Fermi-LAT. Phys. Rev. D 2021, 103, 083003. [Google Scholar] [CrossRef]
- Li, H.-J. Relevance of VHE Blazar Spectra Models with Axion-like Particles. arXiv 2021, arXiv:2112.14145. [Google Scholar] [CrossRef]
- Galanti, G. Axion-like particles and high energy astrophysics. arXiv 2019, arXiv:1911.09372. [Google Scholar]
- Reynolds, C.S.; Marsh, M.C.D.; Russell, H.R.; Fabian, A.C.; Smith, R.; Tombesi, F.; Veilleux, S. Astrophysical limits on very light axion-like particles from Chandra grating spectroscopy of NGC 1275. Astrophys. J. 2020, 890, 59. [Google Scholar] [CrossRef] [Green Version]
- Schallmoser, S.; Krippendorf, S.; Chadha-Day, F.; Weller, J. Updated Bounds on Axion-Like Particles from X-ray Observations. arXiv 2021, arXiv:2108.04827. [Google Scholar]
- Sisk-Reynés, J.; Matthews, J.H.; Reynolds, C.S.; Russell, H.R.; Smith, R.N.; Marsh, M.C.D. New constraints on light axion-like particles using Chandra transmission grating spectroscopy of the powerful cluster-hosted quasar H1821+643. Mon. Not. Astron. R. Soc. 2021, 510, 1264. [Google Scholar] [CrossRef]
- Matthews, J.H.; Reynolds, C.S.; Marsh, M.C.D.; Sisk-Reynés, J.; Rodman, P.E. How do Magnetic Field Models Affect Astrophysical Limits on Light Axion-like Particles? An X-ray Case Study with NGC 1275. arXiv 2022, arXiv:2202.08875. [Google Scholar]
- Galanti, G. Photon-ALP interaction as a measure of initial photon polarization. arXiv 2022, arXiv:2202.10315. [Google Scholar]
- Galanti, G. Photon-ALP oscillations inducing modifications to photon polarization. arXiv 2022, arXiv:2202.11675. [Google Scholar]
- Galanti, G.; Roncadelli, M.; Tavecchio, F. ALP induced polarization effects on photons from galaxy clusters. arXiv 2022, arXiv:2202.12286. [Google Scholar]
- Available online: https://www.cta-observatory.org/ (accessed on 15 January 2022).
- Available online: https://www.hawc-observatory.org/ (accessed on 15 January 2022).
- Egorov, A.E.; Topchiev, N.P.; Galper, A.M.; Dalkarov, O.D.; Leonov, A.A.; Suchkov, S.I.; Yurkin, Y.T. Dark matter searches by the planned gamma-ray telescope GAMMA-400. J. Cosmol. Astropart. Phys. 2020, 2020, 049. [Google Scholar] [CrossRef]
- Available online: http://english.ihep.cas.cn/lhaaso/ (accessed on 15 January 2022).
- Available online: https://taiga-experiment.info/taiga-hiscore/ (accessed on 15 January 2022).
- Huang, X.; Lamperstorfer, A.S.; Tsai, Y.-L.S.; Xu, M.; Yuan, Q.; Chang, J.; Dong, Y.-W.; Hu, B.-L.; Lü, J.-G.; Wang, L.; et al. Perspective of monochromatic gamma-ray line detection with the High Energy cosmic-Radiation Detection (HERD) facility onboard China’s space station. Astropart. Phys. 2016, 78, 35–42. [Google Scholar] [CrossRef] [Green Version]
- Bähre, R.; Döbrich, B.; Dreyling-Eschweiler, J.; Ghazaryan, S.; Hodajerdi, R.; Horns, D.; Januschek, F.; Knabbe, E.-A.; Lindner, A.; Notz, D.; et al. Any light particle search II—Technical design report. J. Instrum. 2013, 8, T09001. [Google Scholar] [CrossRef] [Green Version]
- Capparelli, L.M.; Cavoto, G.; Ferretti, J.; Giazotto, F.; Polosa, A.D.; Spagnolo, P. Axion-like particle searches with sub-THz photons. Phys. Dark Univ. 2016, 12, 37. [Google Scholar] [CrossRef] [Green Version]
- Armengaud, E.; Attié, D.; Basso, S.; Brun, P.; Bykovskiy, N.; Carmona, J.M.; Castel, J.F.; Cebrián, S.; Cicoli, M.; Civitani, M.; et al. Physics potential of the international axion observatory (IAXO). J. Cosmol. Astropart. Phys. 2019, 2019, 047. [Google Scholar] [CrossRef] [Green Version]
- Avignone, F.T., III. Potential for large germanium detector arrays for solar-axion searches utilizing the axio-electric effect for detection. Phys. Rev. D 2009, 79, 035015. [Google Scholar] [CrossRef] [Green Version]
- Avignone, F.T., III; Crewick, R.J.; Nussinov, S. Can large scintillators be used for solar-axion searches to test the cosmological axion–photon oscillation proposal? Phys. Lett. B 2009, 681, 122–124. [Google Scholar] [CrossRef] [Green Version]
- Avignone, F.T., III; Crewick, R.J.; Nussinov, S. The experimental challenge of detecting solar axion-like particles to test the cosmological ALP-photon oscillation hypotheses. Astropart. Phys. 2011, 34, 640–642. [Google Scholar] [CrossRef] [Green Version]
- Kahn, Y.; Safdi, B.R.; Thaler, J. Broadband and resonant approaches to axion dark matter detection. Phys. Rev. Lett. 2016, 117, 141801. [Google Scholar] [CrossRef]
- Breit, G.; Wheeler, J.A. Collision of two light quanta. Phys. Rev. 1934, 46, 1087. [Google Scholar] [CrossRef]
- Galanti, G.; Piccinini, F.; Roncadelli, M.; Tavecchio, F. Estimating γγ absorption for ultrahigh-energy photons with lepton and hadron production. Phys. Rev. D 2020, 102, 123004. [Google Scholar] [CrossRef]
- Dobrynina, A.; Kartavtsev, A.; Raffelt, G. Photon-photon dispersion of TeV gamma rays and its role for photon-ALP conversion. Phys. Rev. D 2015, 91, 083003, Erratum ibid. 2015, 91, 109902. [Google Scholar] [CrossRef] [Green Version]
- Gelmini, G.B.; Nussinov, S.; Yanagida, T. Does nature like Nambu-Goldstone bosons? Nucl. Phys. B 1983, 219, 31–40. [Google Scholar] [CrossRef]
- Kim, J.H. Light pseudoscalars, particle physics and cosmology. Phys. Rep. 1987, 150, 1–177. [Google Scholar] [CrossRef]
- Cheng, H.Y. The strong CP problem revisited. Phys. Rep. 1988, 158, 1–89. [Google Scholar] [CrossRef]
- Kim, J.E.; Carosi, G. Axions and the strong CP problem. Rev. Mod. Phys. 2010, 82, 557. [Google Scholar] [CrossRef] [Green Version]
- Marsch, D.J.E. Axion cosmology. Phys. Rep. 2016, 643, 1. [Google Scholar] [CrossRef] [Green Version]
- Grilli di Cortona, G.; Hardy, E.; Vega, J.P.; Villagoro, G. The QCD axion, precisely. J. High Energy Phys. 2016, 2016, 034. [Google Scholar] [CrossRef]
- Peccei, R.D.; Quinn, H.R. CP Conservation in the Presence of Pseudoparticles. Phys. Rev. Lett. 1977, 38, 1440. [Google Scholar] [CrossRef] [Green Version]
- Peccei, R.D.; Quinn, H.R. Constraints imposed by CP conservation in the presence of pseudoparticles. Phys. Rev. D 1977, 16, 1791. [Google Scholar] [CrossRef]
- Weinberg, S. A new light boson? Phys. Rev. Lett. 1978, 40, 223. [Google Scholar] [CrossRef]
- Wilczek, F. Problem of Strong P and T Invariance in the Presence of Instantons. Phys. Rev. Lett. 1978, 40, 279. [Google Scholar] [CrossRef]
- Cheng, S.L.; Geng, C.Q.; Ni, W.T. Axion-photon couplings in invisible axion models. Phys. Rev. D 1995, 52, 3132. [Google Scholar] [CrossRef] [Green Version]
- Donnely, T.W.; Freedman, S.J.; Lytel, R.S.; Peccei, R.D.; Schwartz, M. Do axions exist? Phys. Rev. D 1978, 18, 1607. [Google Scholar] [CrossRef]
- Zehnder, A.; Gabathuler, K.; Vuilleumier, J.L. Search for axions in specific nuclear gamma-transitions at a power reactor. Phys. Lett. B 1982, 110, 419–422. [Google Scholar] [CrossRef]
- Dine, M.; Fischler, W.; Srednicki, M. A simple solution to the strong CP problem with a harmless axion. Phys. Lett. B 1981, 104, 199–202. [Google Scholar] [CrossRef]
- Wise, B.; Georgi, H.; Glashow, S.L. SU (5) and the Invisible Axion. Phys. Rev. Lett. 1981, 47, 402. [Google Scholar] [CrossRef]
- Kim, J. Weak-Interaction Singlet and Strong CP Invariance. Phys. Rev. Lett. 1979, 43, 103. [Google Scholar] [CrossRef]
- Shifman, M.A.; Vainshtein, A.I.; Zakharov, V.I. Can confinement ensure natural CP invariance of strong interactions? Nucl. Phys. B 1980, 166, 493–506. [Google Scholar] [CrossRef]
- Zhitnitsky, A.R. On Possible Suppression of the Axion Hadron Interactions. Sov. Nucl. J. Phys. 1980, 31, 260. [Google Scholar]
- Holman, R.; Hsu, S.D.H.; Kephart, T.W.; Kolb, E.W.; Watkins, R.; Widrow, L.M. Solutions to the strong-CP problem in a world with gravity. Phys. Lett. B 1992, 282, 132–136. [Google Scholar] [CrossRef] [Green Version]
- Kamionkowski, M.; March-Russell, J. Planck-scale physics and the Peccei-Quinn mechanism. Phys. Lett. B 1992, 282, 137–141. [Google Scholar] [CrossRef] [Green Version]
- Ghigna, S.; Lusignoli, M.; Roncadelli, M. Instability of the invisible axion. Phys. Lett. B 1992, 283, 278–281. [Google Scholar] [CrossRef]
- Barr, S.M.; Seckel, D. Planck-scale corrections to axion models. Phys. Rev. D 1992, 46, 539. [Google Scholar] [CrossRef] [PubMed]
- Sikivie, P. Experimental tests of the “invisible” axion. Phys. Rev. Lett. 1984, 51, 1415, Erratum ibid. 1984, 52, 695. [Google Scholar] [CrossRef]
- Heisenberg, W.; Euler, H.; Phys, Z. Folgerungen aus der diracschen theorie des positrons. Zeitschrift für Physik 1936, 98, 714–732. [Google Scholar] [CrossRef]
- Weisskopf, V.S.; Dan, K. Über die elektrodynamik des vakuums auf grund des quanten-theorie des elektrons. Vidensk. Selsk. Mat. Fys. Medd. 1936, 14, 1–39. [Google Scholar]
- Urry, C.M.; Padovani, P. Unified schemes for radio-loud active galactic nuclei. Pub. Astron. Soc. Pac. 1995, 107, 803. [Google Scholar] [CrossRef] [Green Version]
- Robson, I. Active Galactic Nuclei; Wiley: New York, NY, USA, 1996. [Google Scholar]
- Krolik, J.A. Active Galactic Nuclei: From the Central Black Hole to the Galactic Environment; Princeton University Press: Princeton, NJ, USA, 1999. [Google Scholar]
- Aharonian, F.A. Very High Energy Cosmic Gamma Radiation; World Scientific: Singapore, 2004. [Google Scholar]
- Tavecchio, F.; Bonnoli, G.; Galanti, G. On the distribution of fluxes of gamma-ray blazars: Hints for a stochastic process? Mon. Not. Astron. R. Soc. 2020, 497, 1294. [Google Scholar] [CrossRef]
- Ghisellini, G. Radiative Processes in High Energy Astrophysics; Springer: Berlin, Germany, 2013. [Google Scholar]
- Maraschi, L.; Ghisellini, G.; Celotti, A. A jet model for the gamma-ray emitting blazar 3C 279. Astrophys. J. 1992, 397, L5–L9. [Google Scholar] [CrossRef]
- Sikora, M.; Begelman, M.G.; Rees, M.J. Comptonization of diffuse ambient radiation by a relativistic jet: The source of gamma rays from blazars? Astrophys. J. 1994, 421, 153–162. [Google Scholar] [CrossRef]
- Bloom, S.D.; Marscher, A.P. An analysis of the synchrotron self-compton model for the multi–wave band spectra of blazars. Astrophys. J. 1996, 461, 657. [Google Scholar] [CrossRef]
- Tavecchio, F.; Maraschi, L.; Ghisellini, G. Constraints on the physical parameters of TeV blazars. Astrophys. J. 1998, 509, 608. [Google Scholar] [CrossRef] [Green Version]
- Mannheim, K. The proton blazar. Astron. Astrophys. 1993, 269, 67–76. [Google Scholar]
- Mannheim, K. TeV gamma-rays from proton blazars. Space Sci. Rev. 1996, 75, 331–340. [Google Scholar] [CrossRef] [Green Version]
- The IceCube Collaboration; Fermi-LAT; MAGIC; The IceCube Collaboration; AGILE; ASAS-SN; HAWC; HESS; INTEGRAL; Kanata; et al. Multimessenger observations of a flaring blazar coincident with high-energy neutrino IceCube-170922A. Science 2018, 361, 1378. [Google Scholar] [CrossRef] [PubMed] [Green Version]
- Zhang, H.; Chen, X.; Böttcher, M. Synchrotron polarization in blazars. Astrophys. J. 2014, 789, 66. [Google Scholar] [CrossRef] [Green Version]
- Krawczynski, H. The polarization properties of inverse compton emission and implications for blazar observations with the gems x-ray polarimeter. Astrophys. J. 2011, 744, 30. [Google Scholar] [CrossRef] [Green Version]
- Hoffmeister, C. 354 neue Veränderliche. Astron. Nachrich. 1929, 236, 5655. [Google Scholar] [CrossRef]
- Liu, T.H.; Bai, J.M. Absorption of 10–200 GeV gamma rays by radiation from broad-line regions in blazars. Astrophys. J. 2006, 653, 1089. [Google Scholar] [CrossRef] [Green Version]
- Poutanen, J.; Stern, B. GeV Breaks in Blazars as a Result of Gamma-ray Absorption Within the Broad-Line Region. Astrophys. J. 2010, 717, L118. [Google Scholar] [CrossRef]
- Tavecchio, F.; Mazin, D. Intrinsic absorption in 3C 279 at GeV–TeV energies and consequences for estimates of the extragalactic background light. Mon. Not. Astron. R. Soc. 2009, 392, L40. [Google Scholar] [CrossRef] [Green Version]
- Galanti, G.; Landoni, M.; Tavecchio, F.; Covino, S. Probing the absorption of gamma-rays by IR radiation from the dusty torus in FSRQs with the Cherenkov telescope array. Mon. Not. Astron. R. Soc. 2020, 495, 3463. [Google Scholar] [CrossRef]
- Available online: https://www.mpi-hd.mpg.de/hfm/HESS (accessed on 15 January 2022).
- Available online: https://magic.mpp.mpg.de/ (accessed on 15 January 2022).
- Available online: https://veritas.sao.arizona.edu/ (accessed on 15 January 2022).
- Available online: http://tevcat.uchicago.edu/ (accessed on 15 January 2022).
- Heitler, W. The Quantum Theory of Radiation; Oxford University Press: Oxford, UK, 1960. [Google Scholar]
- Nikishov, A. Absorption of high energy photons in the universe. Sov. Phys. JETP 1962, 14, 393. [Google Scholar]
- Gould, R.J.; Schreder, G.P. Pair production in photon-photon collisions. Phys. Rev. 1967, 155, 1404. [Google Scholar] [CrossRef]
- Fazio, G.G.; Stecker, F.W. Predicted High Energy Break in the Isotropic Gamma Ray Spectrum: A Test of Cosmological Origin. Nature 1970, 226, 135. [Google Scholar] [CrossRef] [PubMed] [Green Version]
- Madau, P.; Pozzetti, L. Deep galaxy counts, extragalactic background light and the stellar baryon budget. Mon. Not. Astron. R. Soc. 2000, 312, L9–L15. [Google Scholar] [CrossRef] [Green Version]
- Franceschini, A.; Rodighiero, G. The extragalactic background light revisited and the cosmic photon-photon opacity. Astron. Astrophys. 2017, 603, A34. [Google Scholar] [CrossRef]
- Dominquez, A.; Primack, J.R.; Rosario, D.J.; Prada, F.; Gilmore, R.C.; Faber, S.M.; Koo, D.C.; Somerville, R.S.; Pérez-Torres, M.A.; Pérez-González, P.; et al. Extragalactic background light inferred from AEGIS galaxy-SED-type fractions. Mon. Not. Astron. R. Soc. 2011, 410, 2556–2578. [Google Scholar] [CrossRef] [Green Version]
- Dwek, E.; Krennrich, F. The extragalactic background light and the gamma-ray opacity of the universe. Astropart. Phys. 2013, 43, 112. [Google Scholar] [CrossRef] [Green Version]
- De Angelis, A.; Galanti, G.; Roncadelli, M. Transparency of the Universe to gamma rays. Mon. Not. Astron. R. Soc. 2013, 432, 3245. [Google Scholar] [CrossRef] [Green Version]
- Kronberg, P.P. Extragalactic magnetic fields. Rept. Prog. Phys. 1994, 57, 325–382. [Google Scholar] [CrossRef]
- Grasso, D.; Rubinstein, H.R. Magnetic fields in the early Universe. Phys. Rep. 2001, 348, 163–266. [Google Scholar] [CrossRef] [Green Version]
- Wang, C.; Lai, D. Axion-Photon Propagation in Magnetized Universe. J. Cosmol. Astropart. Phys. 2016, 6, 006. [Google Scholar] [CrossRef] [Green Version]
- Masaki, E.; Aoki, A.; Soda, J. Photon-axion conversion, magnetic field configuration, and polarization of photons. Phys. Rev. D 2017, 96, 043519. [Google Scholar] [CrossRef] [Green Version]
- Neronov, A.; Vovk, I. Evidence for Strong Extragalactic Magnetic Fields from Fermi Observations of TeV Blazars. Science 2010, 328, 73. [Google Scholar] [CrossRef] [PubMed] [Green Version]
- Durrer, R.; Neronov, A. Cosmological magnetic fields: Their generation, evolution and observation. Astron. Astrophys. Rev. 2016, 21, 62. [Google Scholar] [CrossRef] [Green Version]
- Pshirkov, M.S.; Tinyakov, P.G.; Urban, F.R. New Limits on Extragalactic Magnetic Fields from Rotation Measures. Phys. Rev. Lett. 2016, 116, 191302. [Google Scholar] [CrossRef] [Green Version]
- Rees, M.J.; Setti, G. Model for the Evolution of Extended Radio Sources. Nature 1968, 219, 127. [Google Scholar] [CrossRef]
- Hoyle, F. Magnetic Fields and Highly Condensed Objects. Nature 1969, 223, 936. [Google Scholar] [CrossRef]
- Kronberg, P.P.; Lesch, H.; Hopp, U. Magnetization of the Intergalactic Medium by Primeval Galaxies. Astrophys. J. 1999, 511, 56. [Google Scholar] [CrossRef]
- Cowie, L.; Songaila, A.; Kim, T.-S.; Hu, E. The Metallicity and Internal Structure of the Lyman-Alpha Forest Clouds. Astron. J. 1995, 109, 1522. [Google Scholar] [CrossRef]
- Furlanetto, S.; Loeb, A. Intergalactic Magnetic Fields from Quasar Outflows. Astrophys. J. 2001, 556, 619–634. [Google Scholar] [CrossRef]
- Ciotti, L.; Pellegrini, S.; Negri, S.; Ostriker, J.P. The Effect of the AGN Feedback on the Interstellar Medium of Early-Type Galaxies: 2D Hydrodynamical Simulations of the Low-Rotation Case. Astrophys. J. 2017, 835, 15. [Google Scholar] [CrossRef] [Green Version]
- Bertone, S.; Vogt, C.; Ensslin, T. Magnetic field seeding by galactic winds. Mon. Not. Astron. R. Soc. 2006, 370, 319–330. [Google Scholar] [CrossRef]
- Vazza, F.; Brüggen, M.; Gheller, C.; Wang, P. On the amplification of magnetic fields in cosmic filaments and galaxy clusters. Mon. Not. Roy. Astron. Soc. 2014, 445, 3706–3722. [Google Scholar] [CrossRef] [Green Version]
- Gheller, C.; Vazza, F.; Brüggen, M.; Alpaslan, M.; Holwerda, B.W.; Hopkins, A.M.; Liske, J. Evolution of cosmic filaments and of their galaxy population from MHD cosmological simulations. Mon. Not. Astron. R. Soc. 2016, 462, 448. [Google Scholar] [CrossRef] [Green Version]
- Xu, H.; Li, H.; Collins, D.C.; Li, S.; Norman, M.L. Turbulence and Dynamo in Galaxy Cluster Medium: Implications on the Origin of Cluster Magnetic Fields. Astrophys. Lett. J. 2009, 698, L14. [Google Scholar] [CrossRef] [Green Version]
- Donnert, J.; Dolag, K.; Lesch, H.; Müller, E. Cluster magnetic fields from galactic outflows. Mon. Not. Astron. R. Soc. 2009, 392, 1008. [Google Scholar] [CrossRef] [Green Version]
- Govoni, F.; Feretti, L. Magnetic fields in clusters of galaxies. Int. J. Mod. Phys. D 2004, 13, 1549–1594. [Google Scholar] [CrossRef]
- Feretti, L.; Giovannini, G.; Govoni, F.; Murgia, M. Clusters of galaxies: Observational properties of the diffuse radio emission. Astron. Astrophys. Rev. 2012, 20, 54. [Google Scholar] [CrossRef]
- Bonafede, A.; Feretti, L.; Murgia, M.; Govoni, F.; Giovannini, G.; Dallacasa, D.; Dolag, K.; Taylor, G.B. The Coma cluster magnetic field from Faraday rotation measures. Astron. Astrophys. 2010, 513, A30. [Google Scholar] [CrossRef] [Green Version]
- Kuchar, P.; Enlin, T.A. Magnetic power spectra from Faraday rotation maps. Astron. Astrophys. 2011, 529, A13. [Google Scholar] [CrossRef] [Green Version]
- Hudson, D.S.; Mittal, R.; Reiprich, T.H.; Nulsen, P.E.J.; Andernach, H.; Sarazin, C.L. What is a cool-core cluster? A detailed analysis of the cores of the X-ray flux-limited HIFLUGCS cluster sample. Astron. Astrophys. 2010, 513, A37. [Google Scholar] [CrossRef] [Green Version]
- Felten, J.E.; Gould, R.J.; Stein, W.A.; Woolf, N.J. X-Rays from the Coma Cluster of Galaxies. Astrophys. J. 1966, 146, 955. [Google Scholar] [CrossRef]
- Houston, B.P.; Wolfendale, A.W.; Young, E.C.M. Cosmic gamma rays from galaxy clusters. Phys. J. G Nucl. Phys. 1984, 10, L147–L150. [Google Scholar] [CrossRef]
- Dennison, B. Formation of radio halos in clusters of galaxies from cosmic-ray protons. Astrophys. J. 1980, 239, L93–L96. [Google Scholar] [CrossRef]
- Colafrancesco, S.; Marchegiani, P. Warming rays in cluster cool cores. Astron. Astrophys. 2008, 484, 51–65. [Google Scholar] [CrossRef]
- Timokhin, A.N.; Aharonian, F.A.; Yu, A. On the non-thermal high energy radiation of galaxy clusters. Neronov. Astron. Astrophys. 2004, 417, 391. [Google Scholar] [CrossRef]
- Hinshaw, G.; Weiland, J.L.; Hill, R.S.; Odegard, N.; Larson, D.; Bennett, C.L.; Wright, E.L. Five-year Wilkinson microwave anisotropy probe (WMAP) observations: Data processing, sky maps, and basic results. Astrophys. Suppl. J. 2009, 180, 225. [Google Scholar] [CrossRef] [Green Version]
- Aleksić, J.; Alvarez, E.A.; Antonelli, L.A.; Antoranz, P.; Asensio, M.; Backes, M.; Barrio, J.A.; Bastieri, D.; Becerra González, J.; Bednarek, W.; et al. Mrk 421 active state in 2008: The MAGIC view, simultaneous multi-wavelength observations and SSC model constrained. Astron. Astrophys. 2012, 542, A100. [Google Scholar] [CrossRef] [Green Version]
- Aleksić, J.; Antonelli, L.A.; Antoranz, P.; Asensio, M.; Backes, M.; Barres de Almeida, U.; Barrio, J.A.; Bednarek, W.; Berger, K.; Bernardini, E.; et al. The simultaneous low state spectral energy distribution of 1ES 2344+514 from radio to very high energies. Astron. Astrophys. 2013, 556, A67. [Google Scholar] [CrossRef] [Green Version]
- Albert, J.; Aliu, E.; Anderhub, H.; Antonelli, L.A.; Antoranz, P.; Backes, M.; Baixeras, C.; Barrio, J.A.; Bartko, H.; Bastieri, D.; et al. Very-High-Energy Gamma Rays from a Distant Quasar: How Transparent Is the Universe? Science 2008, 320, 1752. [Google Scholar] [CrossRef] [Green Version]
- Aleksić, J.; Antonelli, L.A.; Antoranz, P.; Backes, M.; Barrio, J.A.; Bastieri, D.; Becerra González, J.; Bednarek, W.; Berdyugin, A.; Berger, K.; et al. MAGIC Discovery of Very High Energy Emission from the FSRQ PKS 1222+21. Astrophys. J. 2011, 730, L8. [Google Scholar] [CrossRef]
- Wagner, S.; Behera, B. Hess Observations of Quasars. In Proceedings of the 10th HEAD Meeting, BAAS, Honolulu, HI, USA, 5 July 2010; Volume 42. [Google Scholar]
- Tavecchio, F.; Becerra-Gonzalez, J.; Ghisellini, G.; Stamerra, A.; Bonnoli, G.; Foschini, L.; Maraschi, L. On the origin of the gamma-ray emission from the flaring blazar PKS 1222+216. Astron. Astrophys. 2011, 534, A86. [Google Scholar] [CrossRef] [Green Version]
- Nalewajko, K.; Begelman, M.C.; Cerutti, B.; Uzdensky, D.A.; Sikora, M. Energetic constraints on a rapid gamma-ray flare in PKS 1222+216. Mon. Not. Astron. R. Soc. 2012, 425, 2519. [Google Scholar] [CrossRef]
- Dermer, C.; Murase, K.; Takami, H. Variable Gamma-ray Emission Induced by Ultra-High Energy Neutral Beams: Application to 4C+21.35. Astrophys. J. 2012, 755, 147. [Google Scholar] [CrossRef] [Green Version]
- Tanaka, Y.T.; Stawarz, Ł.; Thompson, D.J.; D’Ammando, F.; Fegan, S.J.; Lott, B.; Wood, D.L.; Cheung, C.C.; Finke, J.; Buson, S.; et al. Fermi Large Area Telescope detection of bright γ-ray outbursts from the peculiar quasar 4C +21.35. Astrophys. J. 2011, 733, 19. [Google Scholar] [CrossRef] [Green Version]
- Tavecchio, F.; Ghisellini, G. The Spectrum of the Broad-Line Region and the High-Energy Emission of Powerful Blazars. Mon. Not. Astron. R. Soc. 2008, 386, 945–952. [Google Scholar] [CrossRef]
- Ghisellini, G.; Tavecchio, F. The blazar sequence: A new perspective. Mon. Not. Astron. R. Soc. 2008, 387, 1669–1680. [Google Scholar] [CrossRef]
- Celotti, A.; Ghisellini, G. The power of blazar jets. Mon. Not. Astron. R. Soc. 2008, 385, 283–300. [Google Scholar] [CrossRef] [Green Version]
- Begelman, M.C.; Blandford, R.D.; Rees, M.J. Theory of extragalactic radio sources. Rev. Mod. Phys. 1984, 56, 255–351. [Google Scholar] [CrossRef]
- O’Sullivan, S.P.; Gabuzda, D.C. Magnetic field strength and spectral distribution of six parsec-scale active galactic nuclei jets. Mon. Not. Astron. R. Soc. 2009, 400, 26–42. [Google Scholar] [CrossRef] [Green Version]
- Moss, D.; Shukurov, A. Turbulence and Magnetic Fields in Elliptical Galaxies. Mon. Not. Astron. R. Soc. 1996, 279, 229–239. [Google Scholar] [CrossRef] [Green Version]
- Ghisellini, G.; Maraschi, L.; Tavecchio, F. The Fermi blazars’ divide. Mon. Not. Astron. R. Soc. 2009, 396, L105–L109. [Google Scholar] [CrossRef] [Green Version]
- Tavecchio, F.; Ghisellini, G.; Ghirlanda, G.; Foschini, L.; Maraschi, L. TeV BL Lac objects at the dawn of the Fermi era. Mon. Not. Astron. R. Soc. 2010, 401, 1570–1586. [Google Scholar] [CrossRef] [Green Version]
- Ghisellini, G.; Tavecchio, F. Canonical high-power blazars. Mon. Not. Astron. R. Soc. 2009, 397, 985–1002. [Google Scholar] [CrossRef]
- Pudritz, R.E.; Hardcastle, M.J.; Gabuzda, D.C. Magnetic Fields in Astrophysical Jets: From Launch to Termination. Space Sci. Rev. 2012, 169, 27–72. [Google Scholar] [CrossRef] [Green Version]
- Jansson, R.; Farrar, G.R. A New Model of the Galactic Magnetic Field. Astrophys. J. 2012, 757, 14. [Google Scholar] [CrossRef]
- Jansson, R.; Farrar, G.R. The galactic magnetic field. Astrophys. J. 2012, 761, L11. [Google Scholar] [CrossRef] [Green Version]
- Unger, M.; Farrar, G.R. Uncertainties in the Magnetic Field of the Milky Way. arXiv 2017, arXiv:1707.02339. [Google Scholar]
- Pshirkov, M.S.; Tinyakov, P.G.; Kronberg, P.P.; Newton-McGee, K.J. Deriving the Global Structure of the Galactic Magnetic Field from Faraday Rotation Measures of Extragalactic Sources. Astrophys. J. 2011, 738, 192. [Google Scholar] [CrossRef] [Green Version]
- Yao, J.M.; Manchester, R.N.; Wang, N. A New Electron-density Model for Estimation of Pulsar and FRB Distances. Astrophys. J. 2017, 835, 29. [Google Scholar] [CrossRef] [Green Version]
- Aharonian, F.; Akhperjanian, A.; Barrio, J.; Bernlöhr, K.; Börst, H.; Bojahr, H.; Bolz, O.; Contreras, J.; Cortina, J.; Denninghoff, S.; et al. The TeV Energy Spectrum of Markarian 501 Measured with the Stereoscopic Telescope System of HEGRA during 1998 and 1999. Astrophys. J. 2001, 546, 898. [Google Scholar] [CrossRef]
- Bonnoli, G.; Tavecchio, F.; Ghisellini, G.; Sbarrato, T. An emerging population of BL Lacs with extreme properties: Towards a class of EBL and cosmic magnetic field probes? Mon. Not. Astron. R. Soc. 2015, 451, 611. [Google Scholar] [CrossRef] [Green Version]
- Costamante, L.; Bonnoli, G.; Tavecchio, F.; Ghisellini, G.; Tagliaferri, G.; Khangulyan, D. The NuSTAR view on hard-TeV BL Lacs. Mon. Not. Astron. R. Soc. 2018, 477, 4257–4268. [Google Scholar] [CrossRef]
- Vovk, I.; Taylor, A.M.; Semikoz, D.; Neronov, A. Fermi/LAT Observations of 1ES 0229+200: Implications for Extragalactic Magnetic Fields and Background Light. Astrophys. J. 2012, 747, L14. [Google Scholar] [CrossRef] [Green Version]
- Aharonian, F.; Akhperjanian, A.G.; De Almeida, U.B.; Bazer-Bachi, A.R.; Behera, B.; Beilicke, M.; Bernlöhr, K.; Boisson, C.; Bolz, O.; Borrel, V. New constraints on the mid-IR EBL from the HESS discovery of VHE γ-rays from 1ES 0229+200. Astron. Astrophys. 2007, 475, L9–L13. [Google Scholar] [CrossRef] [Green Version]
- Bernlöhr, K.; Barnacka, A.; Becherini, Y.; Bigas, O.B.; Carmona, E.; Colin, P.; Decerprit, G.; Di Pierro, F.; Dubois, F.; Farnier, C.; et al. Monte Carlo design studies for the Cherenkov Telescope Array. Astropart. Phys. 2013, 43, 171. [Google Scholar] [CrossRef]
- Acharyya, A.; Agudo, I.; Angüner, E.O.; Alfaro, R.; Alfaro, J.; Alispach, C.; Aloisio, R.; Alves Batista, R.; Amans, J.-P.; Amati, L.; et al. Monte Carlo studies for the optimisation of the Cherenkov Telescope Array layout. Astropart. Phys. 2019, 111, 35–53. [Google Scholar] [CrossRef] [Green Version]
- Stecker, F.W.; Glashow, S.L. New tests of Lorentz invariance following from observations of the highest energy cosmic γ-rays. Astropart. Phys. 2001, 16, 97–99. [Google Scholar] [CrossRef] [Green Version]
- Tavecchio, F.; Bonnoli, G. On the detectability of Lorentz invariance violation through anomalies in the multi-TeV γ-ray spectra of blazars. Astron. Astrophys. 2016, 585, A25. [Google Scholar] [CrossRef] [Green Version]
- Dzhatdoev, T.A.; Khalikov, E.V.; Kircheva, A.P.; Lyukshin, A.A. Electromagnetic cascade masquerade: A way to mimic axion-like particle mixing effects in blazar spectra. Astron. Astrophys. 2017, 603, A59. [Google Scholar] [CrossRef] [Green Version]
- Tavecchio, F.; Ghisellini, G.; Foschini, L.; Bonnoli, G.; Ghirlanda, G.; Coppi, P. The intergalactic magnetic field constrained by Fermi/LAT observations of the TeV blazar 1ES 0229+200. Mon. Not. Astron. R. Soc. 2010, 406, L70–L74. [Google Scholar]
- Vernetto, S.; Lipari, P. Absorption of very high energy gamma rays in the Milky Way. Phys. Rev. D 2016, 94, 063009. [Google Scholar] [CrossRef] [Green Version]
- Kosowsky, A. Cosmic Microwave Background Polarization. Ann. Phys. 1996, 246, 49. [Google Scholar] [CrossRef] [Green Version]
- Rybicki, G.B.; Lightman, A.P. Radiative Processes in Astrophysics; Wiley: New York, NY, USA, 1979. [Google Scholar]
- Yang, C.-Y.; Lowell, A.; Zoglauer, A.; Tomsick, J.; Chiu, J.-L.; Kierans, C.; Sleator, C.; Boggs, S.; Chang, H.-K.; Jean, P.; et al. The polarimetric performance of the Compton Spectrometer and Imager (COSI). Proc. SPIE 2018, 10699, 642. [Google Scholar]
- De Angelis, A.; Tatischeff, V.; Tavani, M.; Oberlack, U.; Grenier, I.; Hanlon, L.; Walter, R.; Argan, A.; von Ballmoos, P.; Bulgarelli, A.; et al. The e-ASTROGAM mission. Exp. Astron. 2017, 44, 25–82. [Google Scholar] [CrossRef] [Green Version]
- Tatischeff, V.; De Angelis, A.; Tavani, M.; Grenier, I.; Oberlack, U.; Hanlon, L.; Walter, R.; Argan, A.; von Ballmoos, P.; Bulgarelli, A.; et al. The e-ASTROGAM gamma-ray space observatory for the multimessenger astronomy of the 2030s. arXiv 2018, arXiv:1805.06435. [Google Scholar]
- Kierans, C.A. AMEGO: Exploring the Extreme Multimessenger Universe. arXiv 2021, arXiv:2101.03105. [Google Scholar]
- Depaola, G.O.; Kozameh, C.N.; Tiglio, M.H. A method to determine the polarization of high energy gamma rays. Astropart. Phys. 1999, 10, 175. [Google Scholar] [CrossRef] [Green Version]
Figure 1.
Photon-photon-ALP vertex with coupling constant .

Figure 2.
conversion in the external magnetic field .

Figure 3.
Schematic view of a oscillation in the external magnetic field .

Figure 4.
Feynman diagram for the Primakoff process.

Figure 5.
A schematic picture of blazars. (Credit [171]).
Figure 5.
A schematic picture of blazars. (Credit [171]).

Figure 6.
Feynman diagrams for the photon pair-production process. The diagram on the left corresponds to the t channel, whereas the one on the right corresponds to the u channel.
Figure 6.
Feynman diagrams for the photon pair-production process. The diagram on the left corresponds to the t channel, whereas the one on the right corresponds to the u channel.

Figure 7.
Source redshifts at which the optical depth takes fixed values as a function of the observed hard photon energy ; the y-scale on the right side shows the distance in Mpc for nearby sources. The curves from bottom to top correspond to a photon survival probability of (the horizon), , and . For kpc the photon survival probability is larger than for any value of . (Credit [203]).

Figure 8.
The values of the emitted spectral index with the corresponding error bars are plotted versus z for all blazars in . (Credit [118]).
Figure 8.
The values of the emitted spectral index with the corresponding error bars are plotted versus z for all blazars in . (Credit [118]).

Figure 9.
Same as Figure 8, but with superimposed the best-fit regression line with . (Credit [118]).

Figure 10.
Left panel: the values of with the corresponding error bars are plotted versus z for all considered blazars in the case , . Superimposed is the horizontal straight best-fit regression line with and . Right panel: Same as left panel, but corresponding to the case , . Superimposed is the horizontal straight best-fit regression line with and . (Credit [118]).

Figure 11.
Horizontal fitting straight line in conventional physics. The values of with the corresponding error bars are plotted versus z for all blazars belonging to . Superimposed is the horizontal straight regression line with . The light blue strip encompasses of the sources and its total width is 0.94, which equals of the mean value . (Credit [118]).

Figure 12.
The values of with the corresponding error bars are plotted versus z for all considered blazars within in the ALP scenario. The light blue strip encompasses of the sources. Left panel: Case . Superimposed is the horizontal straight best-fit regression line with and the width of the light blue strip is which equals of the value . Right panel: Case . Superimposed is the horizontal straight best-fit regression line with and the width of the light blue strip is which equals of the value . (Credit [118]).

Figure 13.
Effective optical depth as a function of the energy for VHE photons propagating in the BLR of PKS 1222+216. The blue long-dashed line corresponds to the process . The other three lines pertain to our model containing ALPs. Specifically, the violet dashed-dotted line corresponds to , the green short-dashed line to and the red solid line to . (Credit [76]).

Figure 14.
Red points at high energy and open red squares at VHE are the spectrum of PKS 1222+216 recorded by Fermi/LAT and the one observed by MAGIC. The black points represent the same data once further corrected for the photon-ALP oscillation effect in the case (). So, they are obtained from the red points and the open red squares by means of Equation (119). The gray data points below are irrelevant for the present discussion (details can be found in [238]). In addition, the dashed and solid curves show the SED resulting from the considered two blobs which account for the -ray emission at high energy and VHE, respectively. (Credit [76]).

Figure 15.
DLSME model—Behavior of the angle between and the fixed fiducial z-direction (equal for all domains) inside . The solid black line is the new smooth version, while the broken gray line represents the usual jump of from one domain to the next in the DLSHE model. The horizontal solid and broken lines partially overlap. For illustrative simplicity, we have chosen the same length for all domains. The blazar is on the extreme left of the figure while the observer is on the extreme right. (Credit [114]).

Figure 16.
Number of domains as a function of their size in the case . (Credit [115]).
Figure 16.
Number of domains as a function of their size in the case . (Credit [115]).

Figure 17.
Behaviour of versus the observed energy for . In all the figures we have taken a random distribution of the domain length : we have chosen a power law distribution function as described in the text. We take a smoothing parameter with for the transition from one magnetic field domain to the following one. The dotted-dashed black line corresponds to conventional physics, the solid light-gray line to the median of all the realizations of the propagation process and the solid yellow line to a single realization with a random distribution of the domain lengths and of the orientation angles of the magnetic field inside the domains. The filled area is the envelope of the results on the percentile of all the possible realizations of the propagation process at 68% (dark blue), 90% (blue) and 99% (light blue), respectively. In the upper-left panel we have chosen , in the upper-right panel , in the lower-left panel and in the lower-right panel . (Credit [115]).


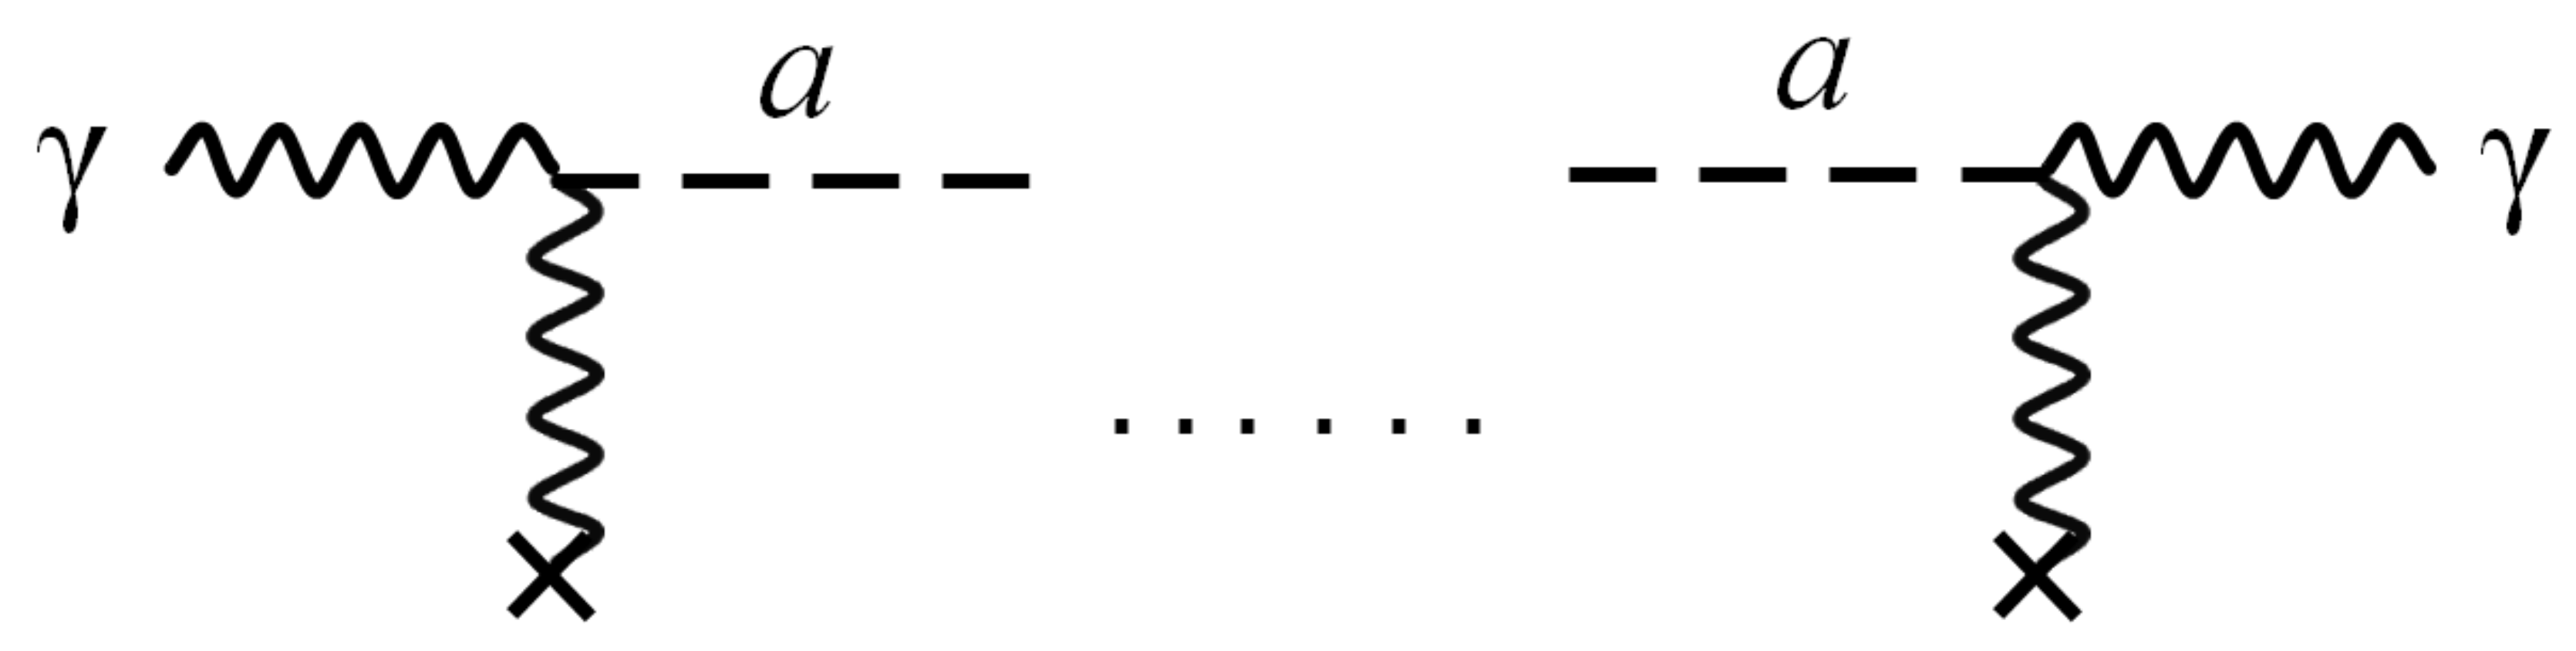
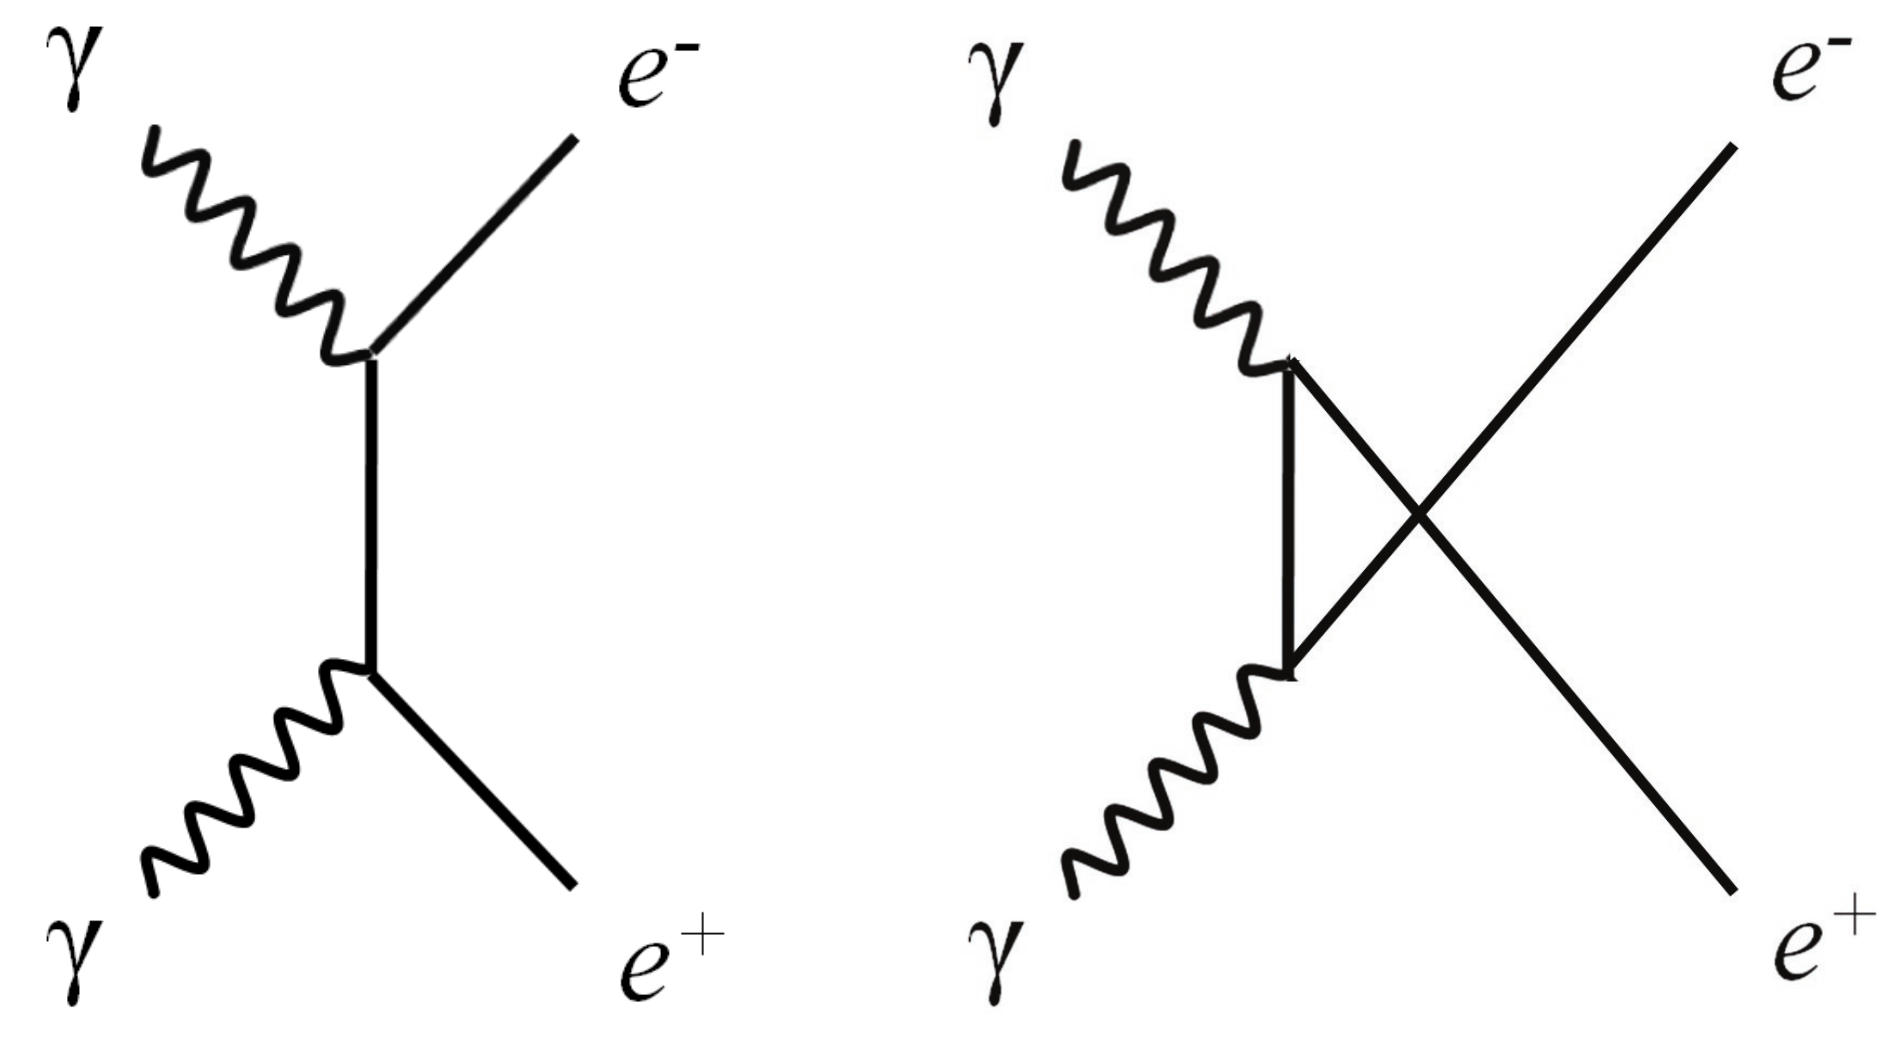
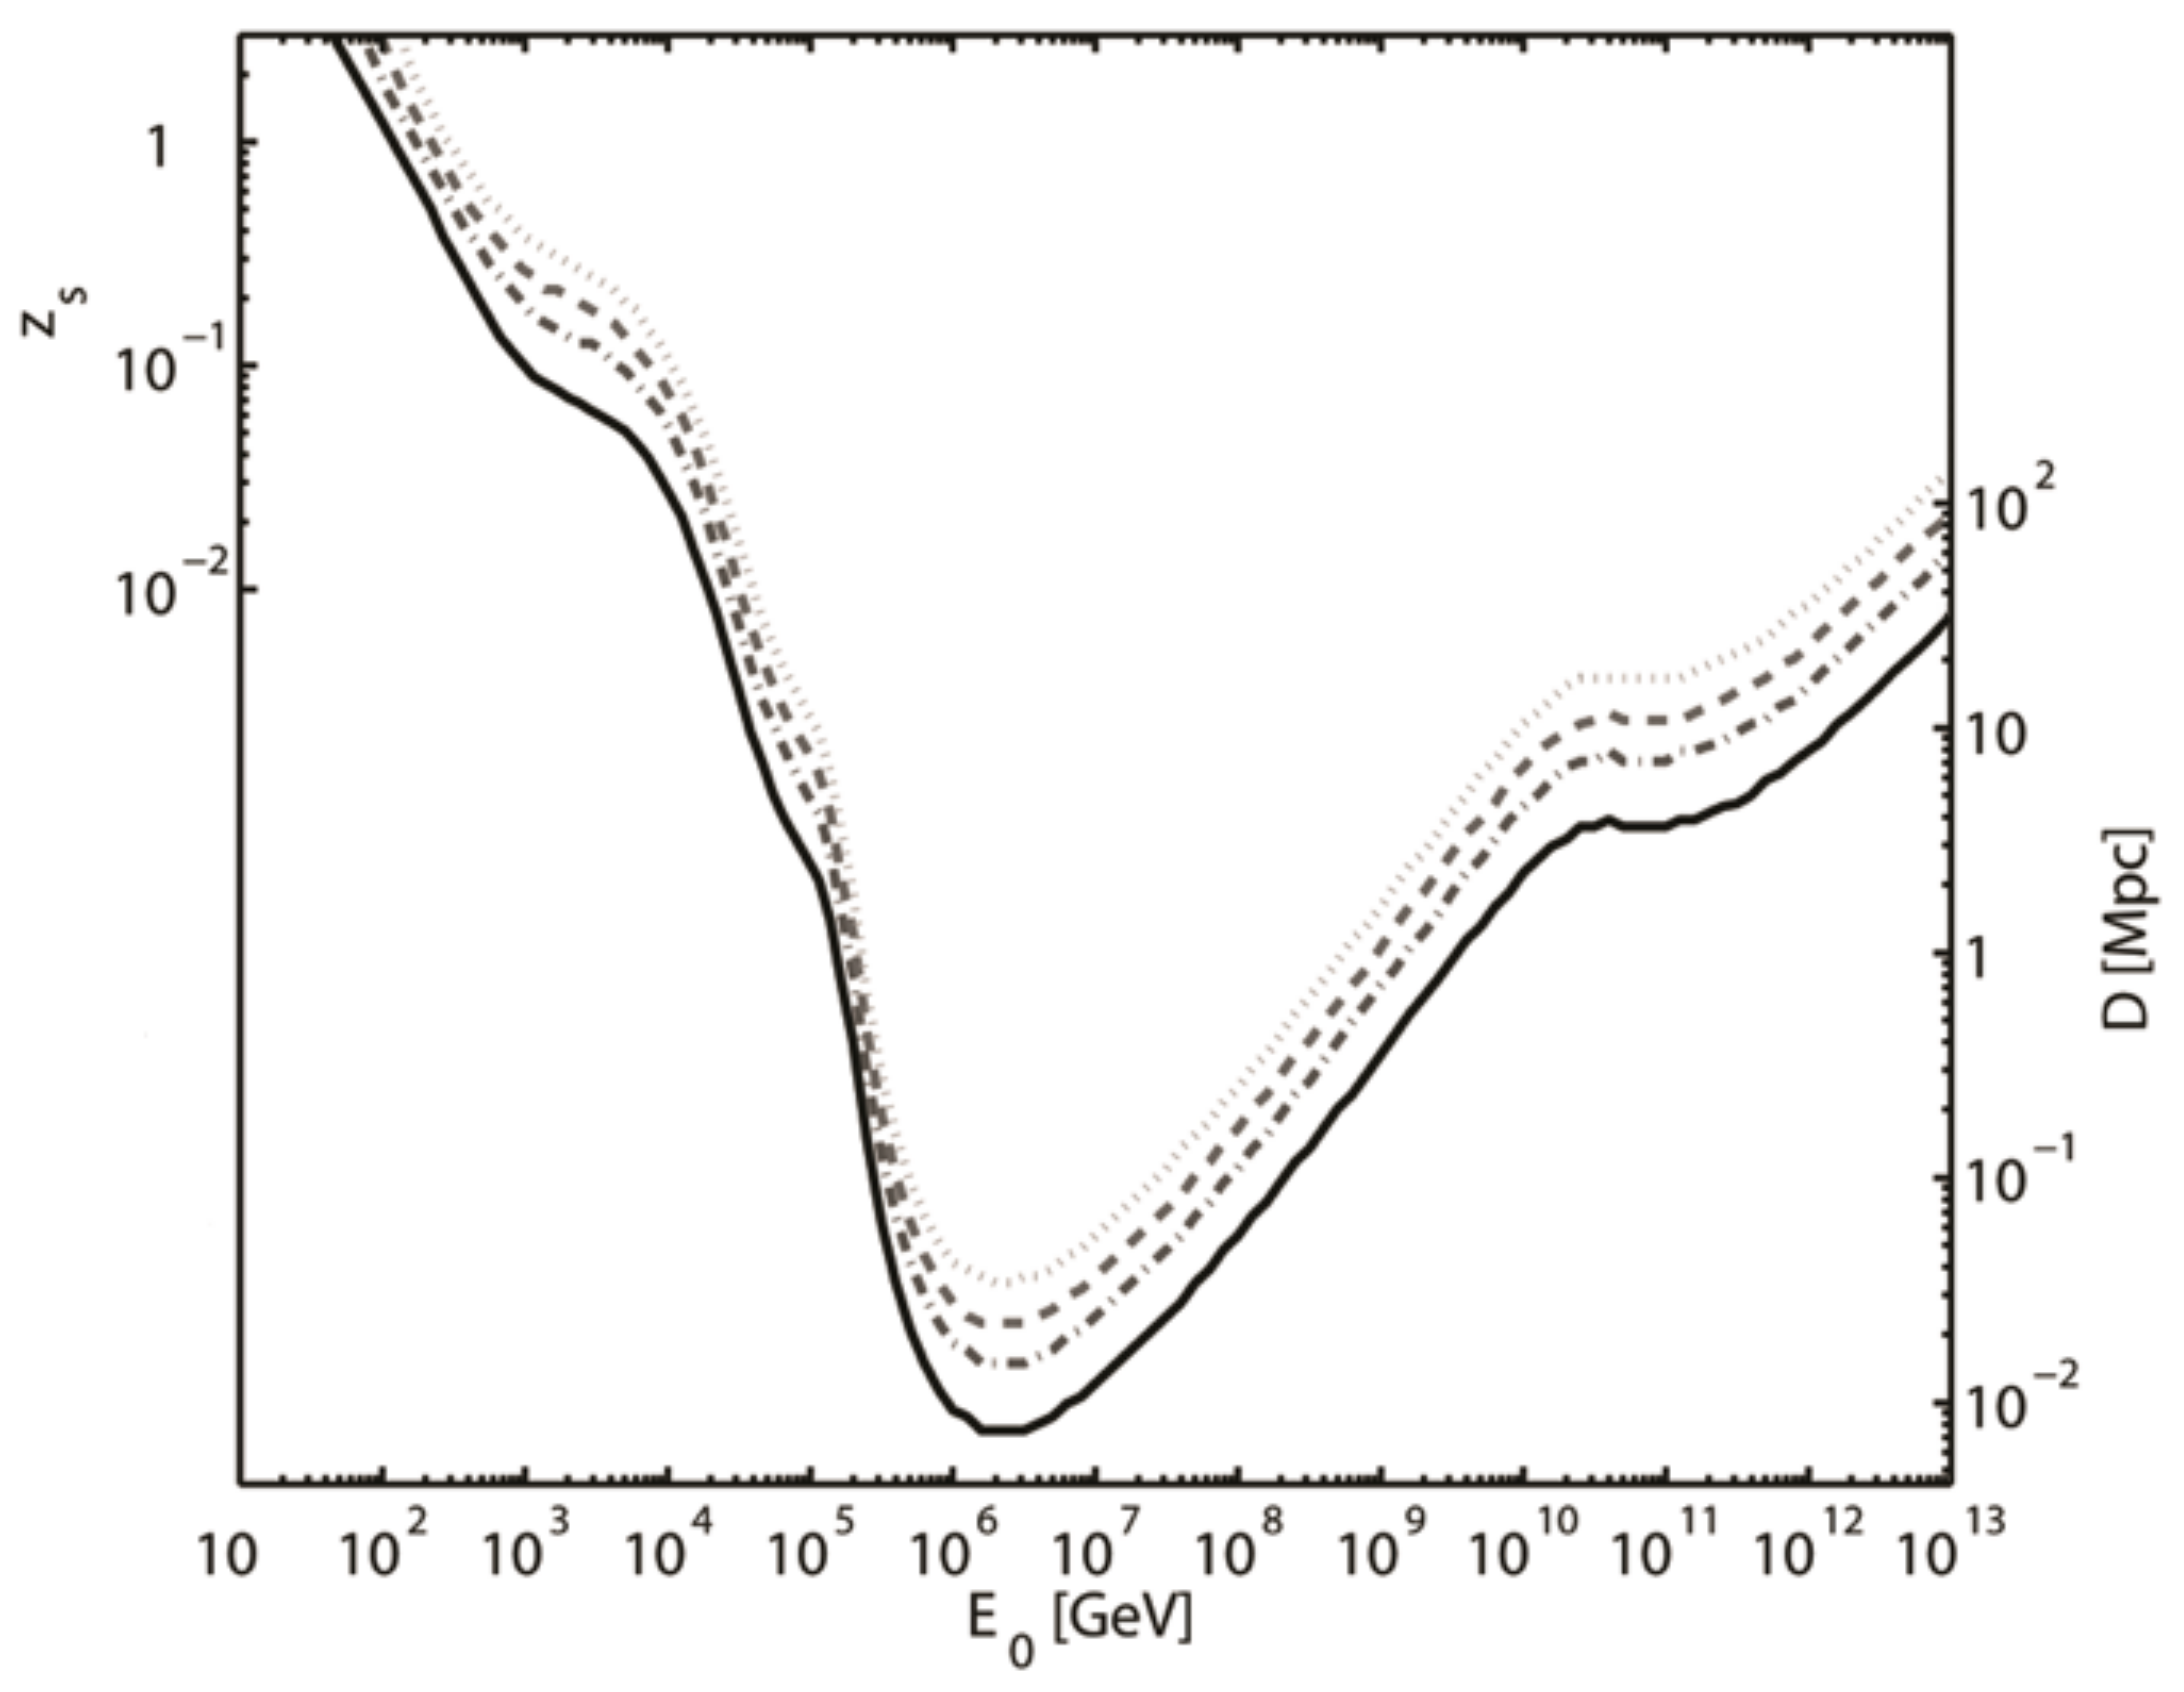
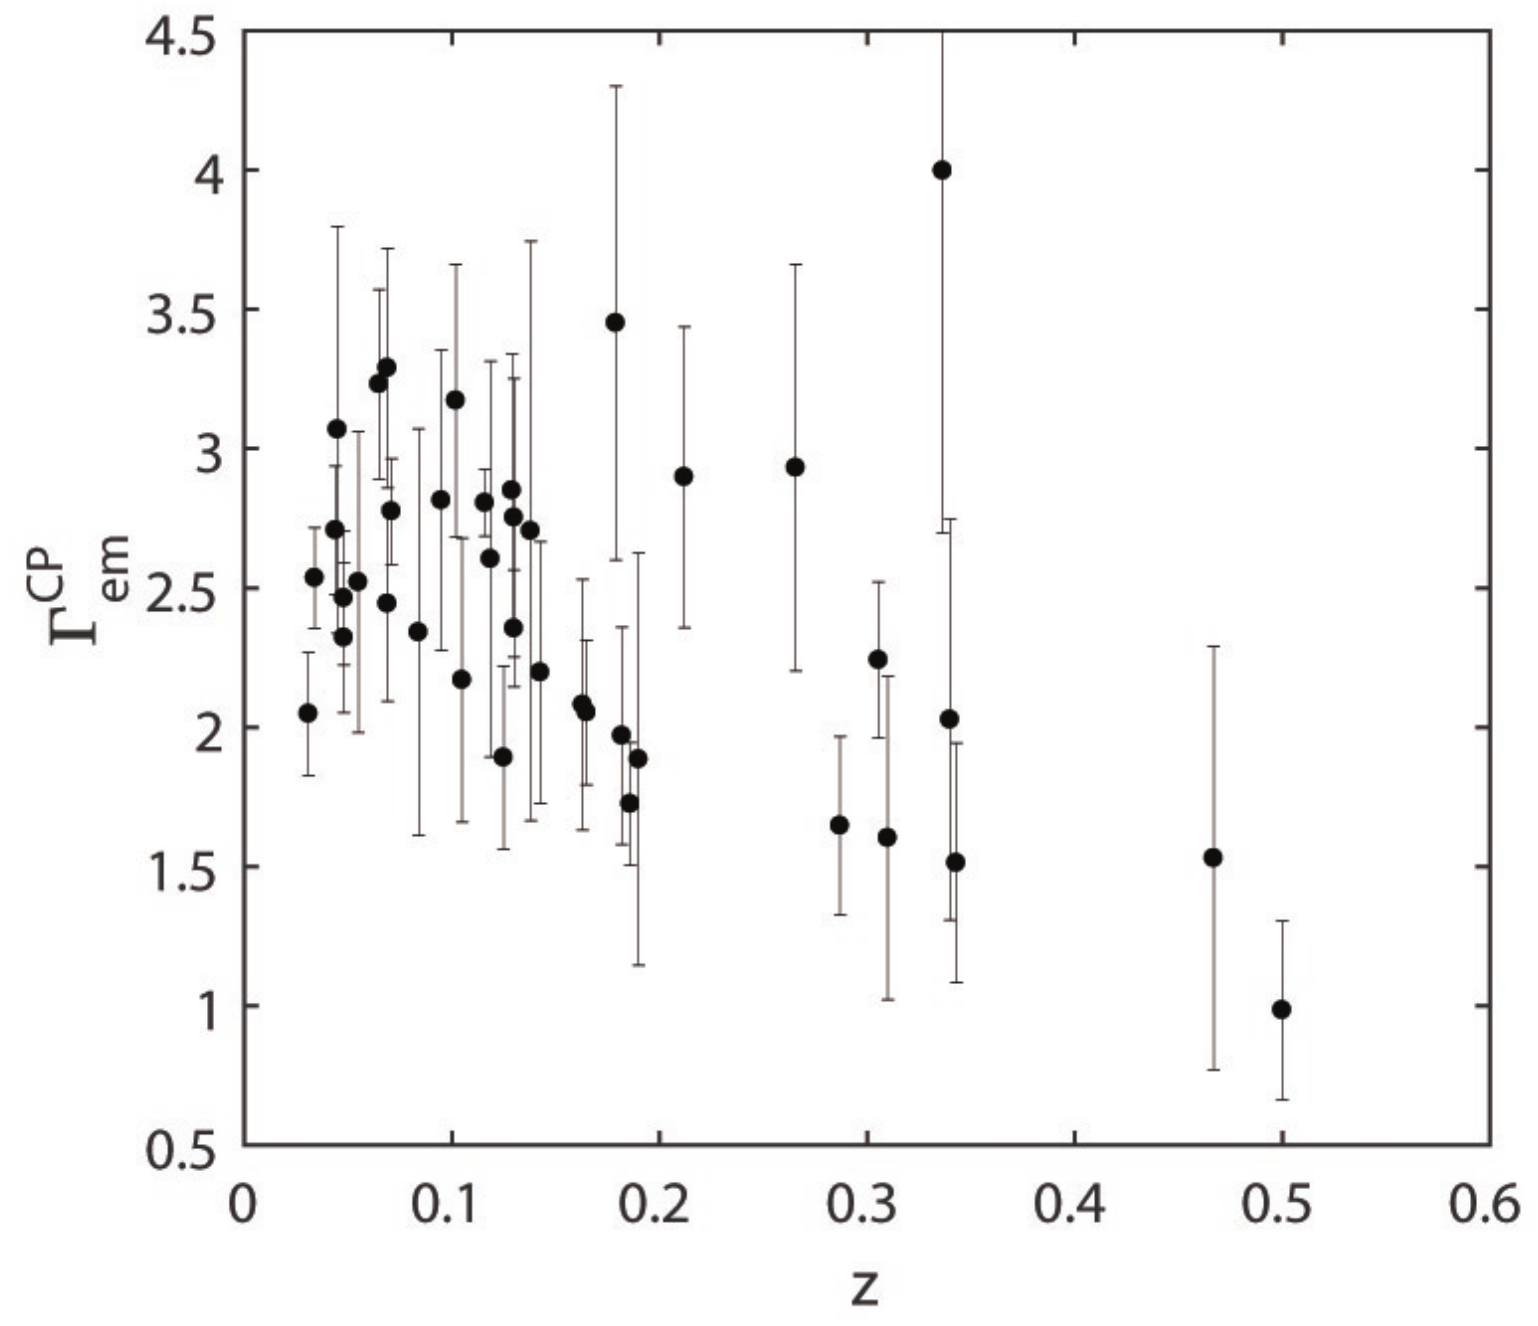
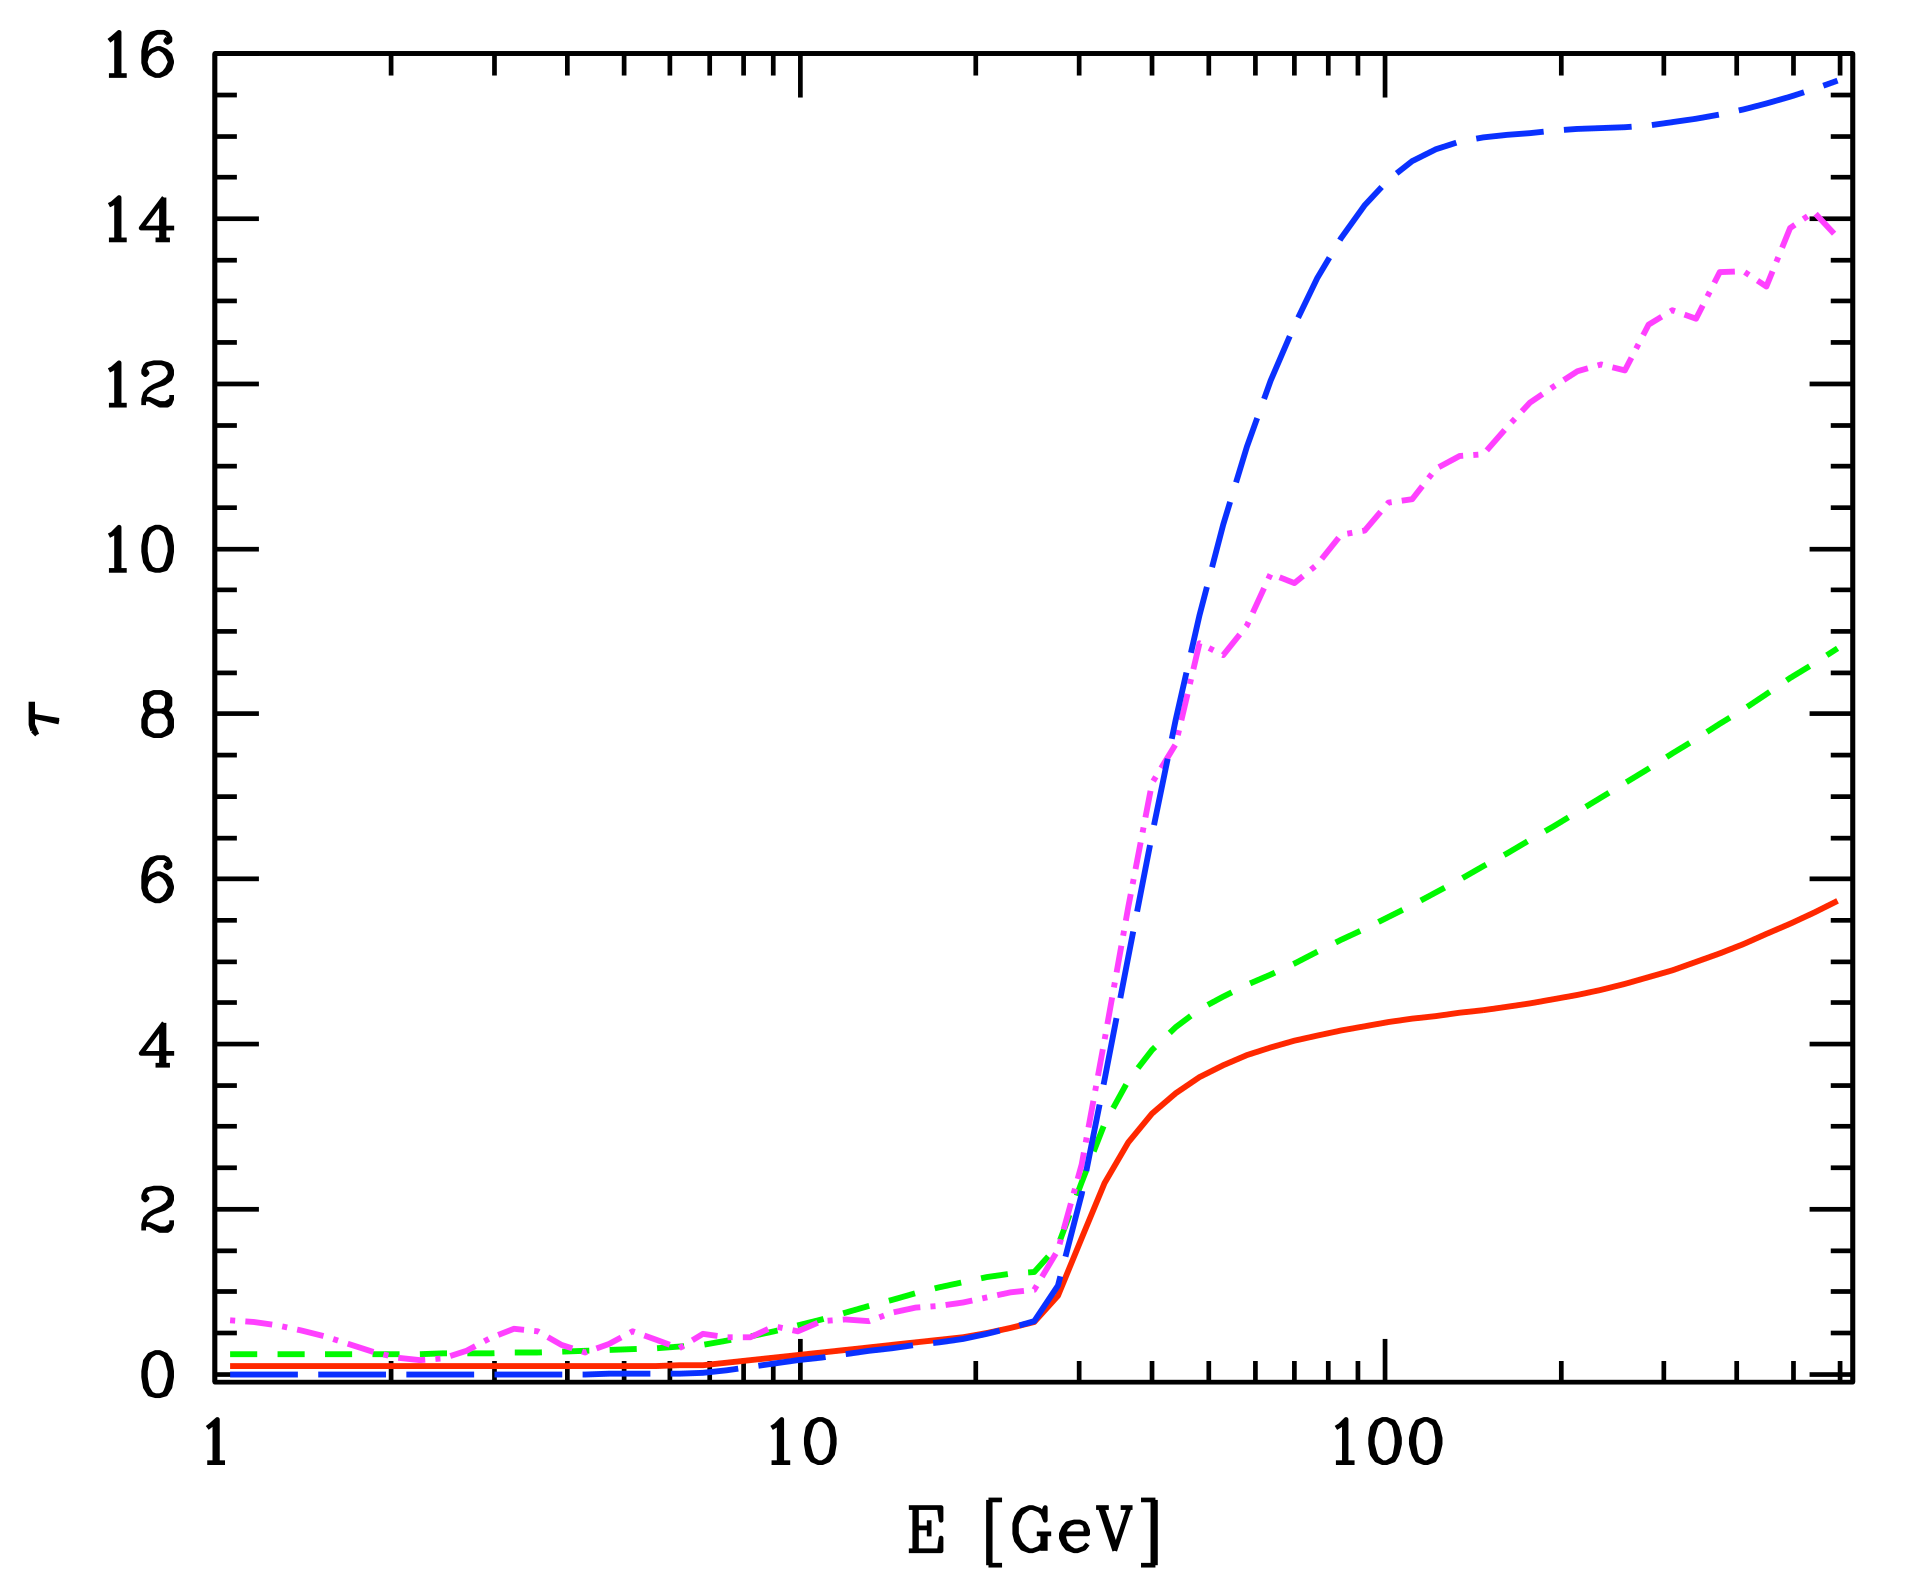
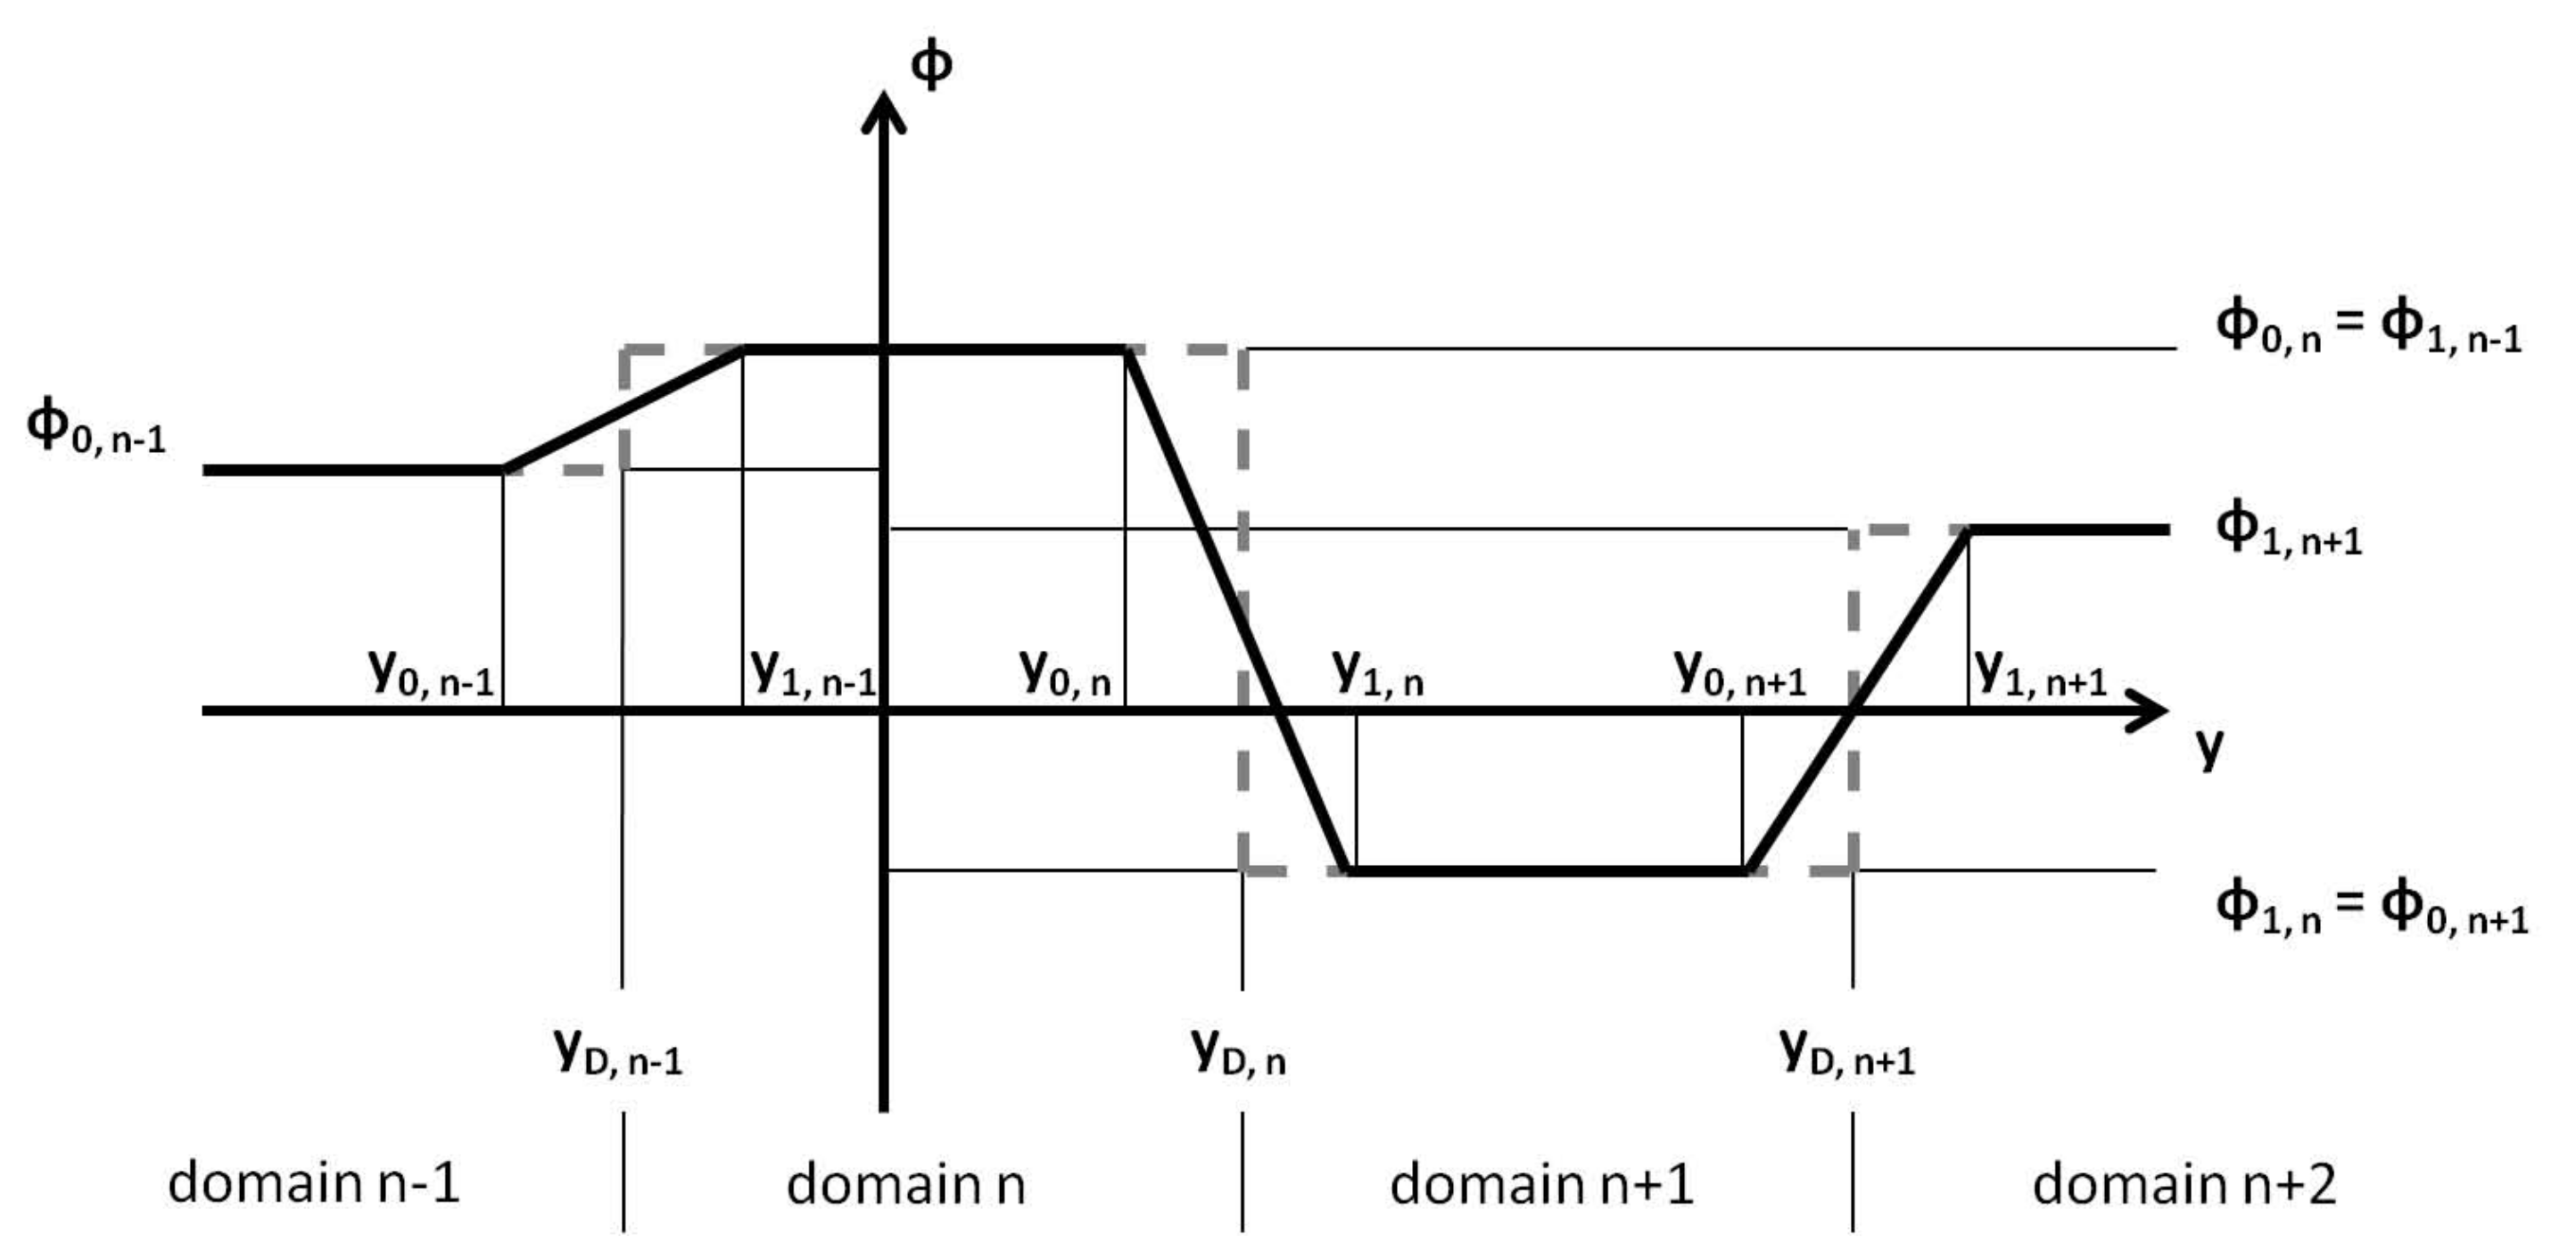
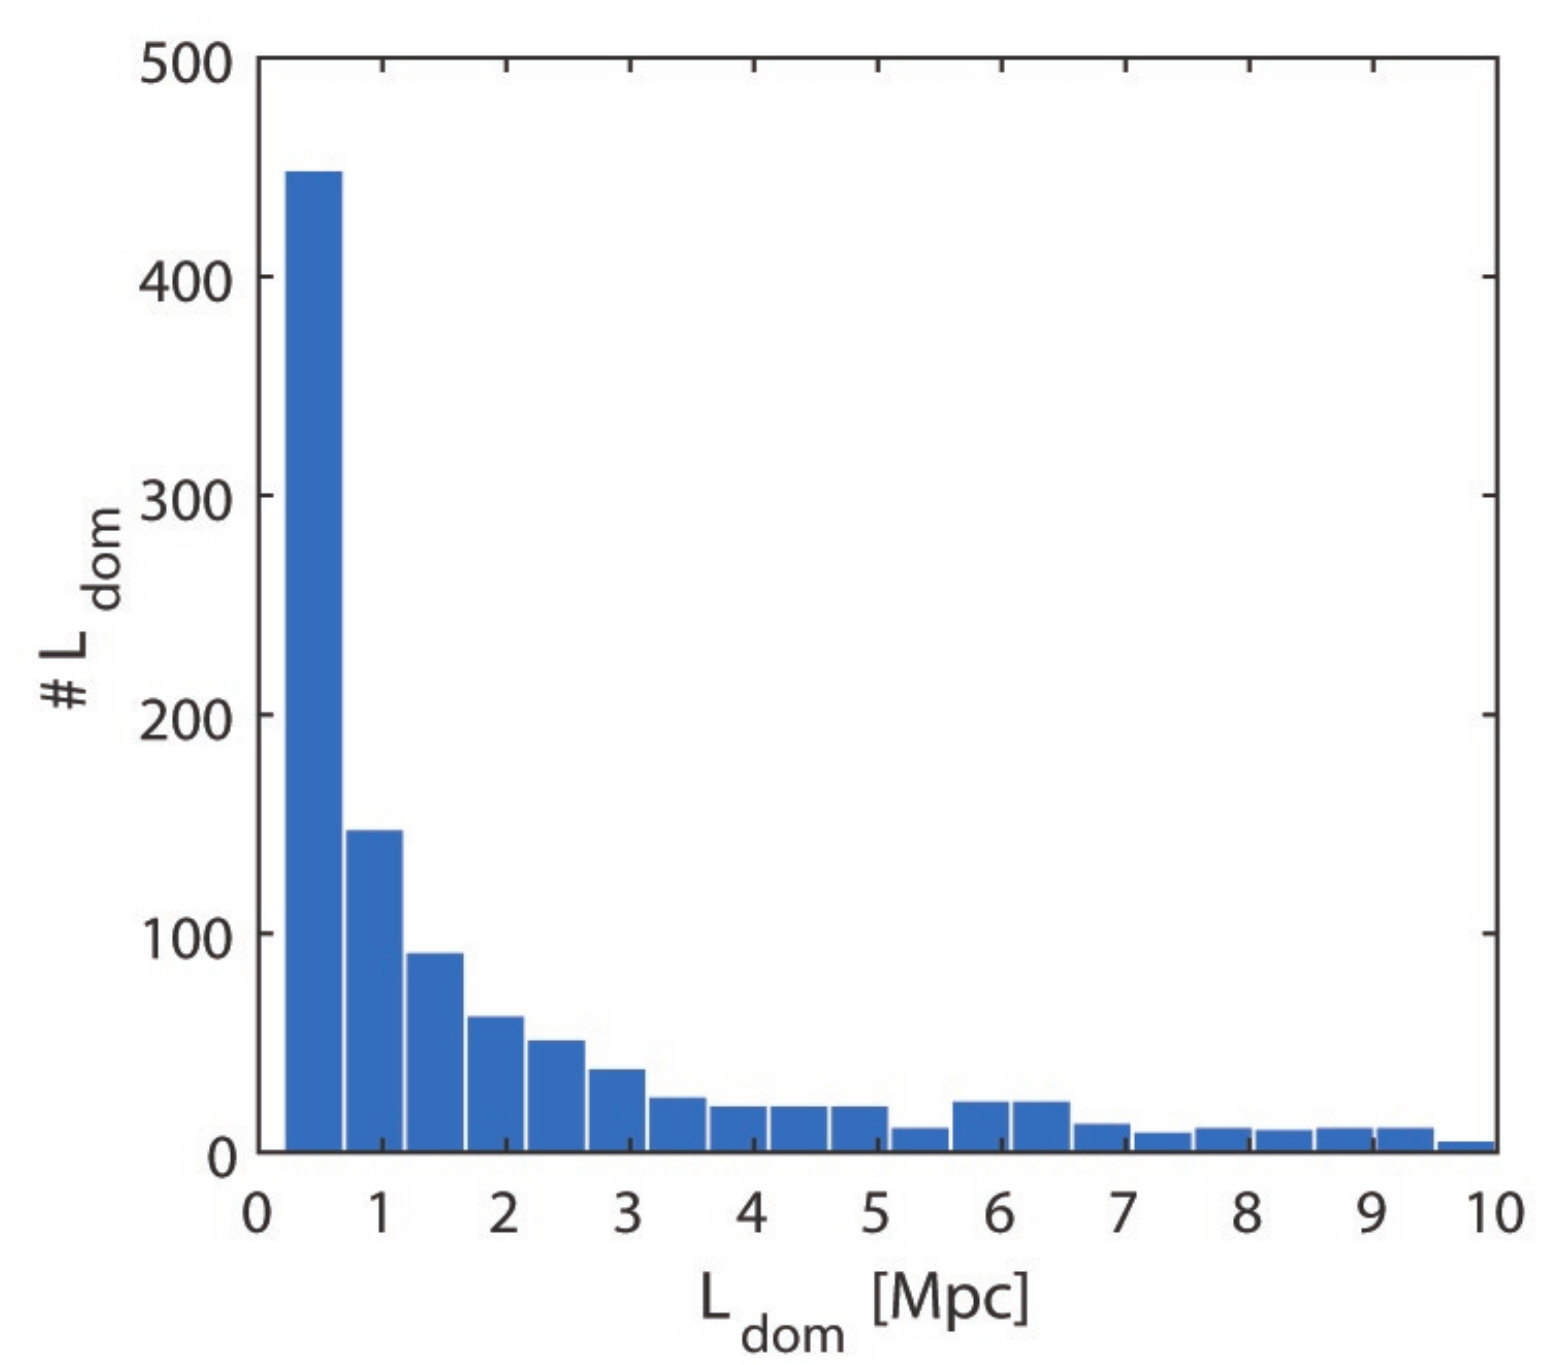
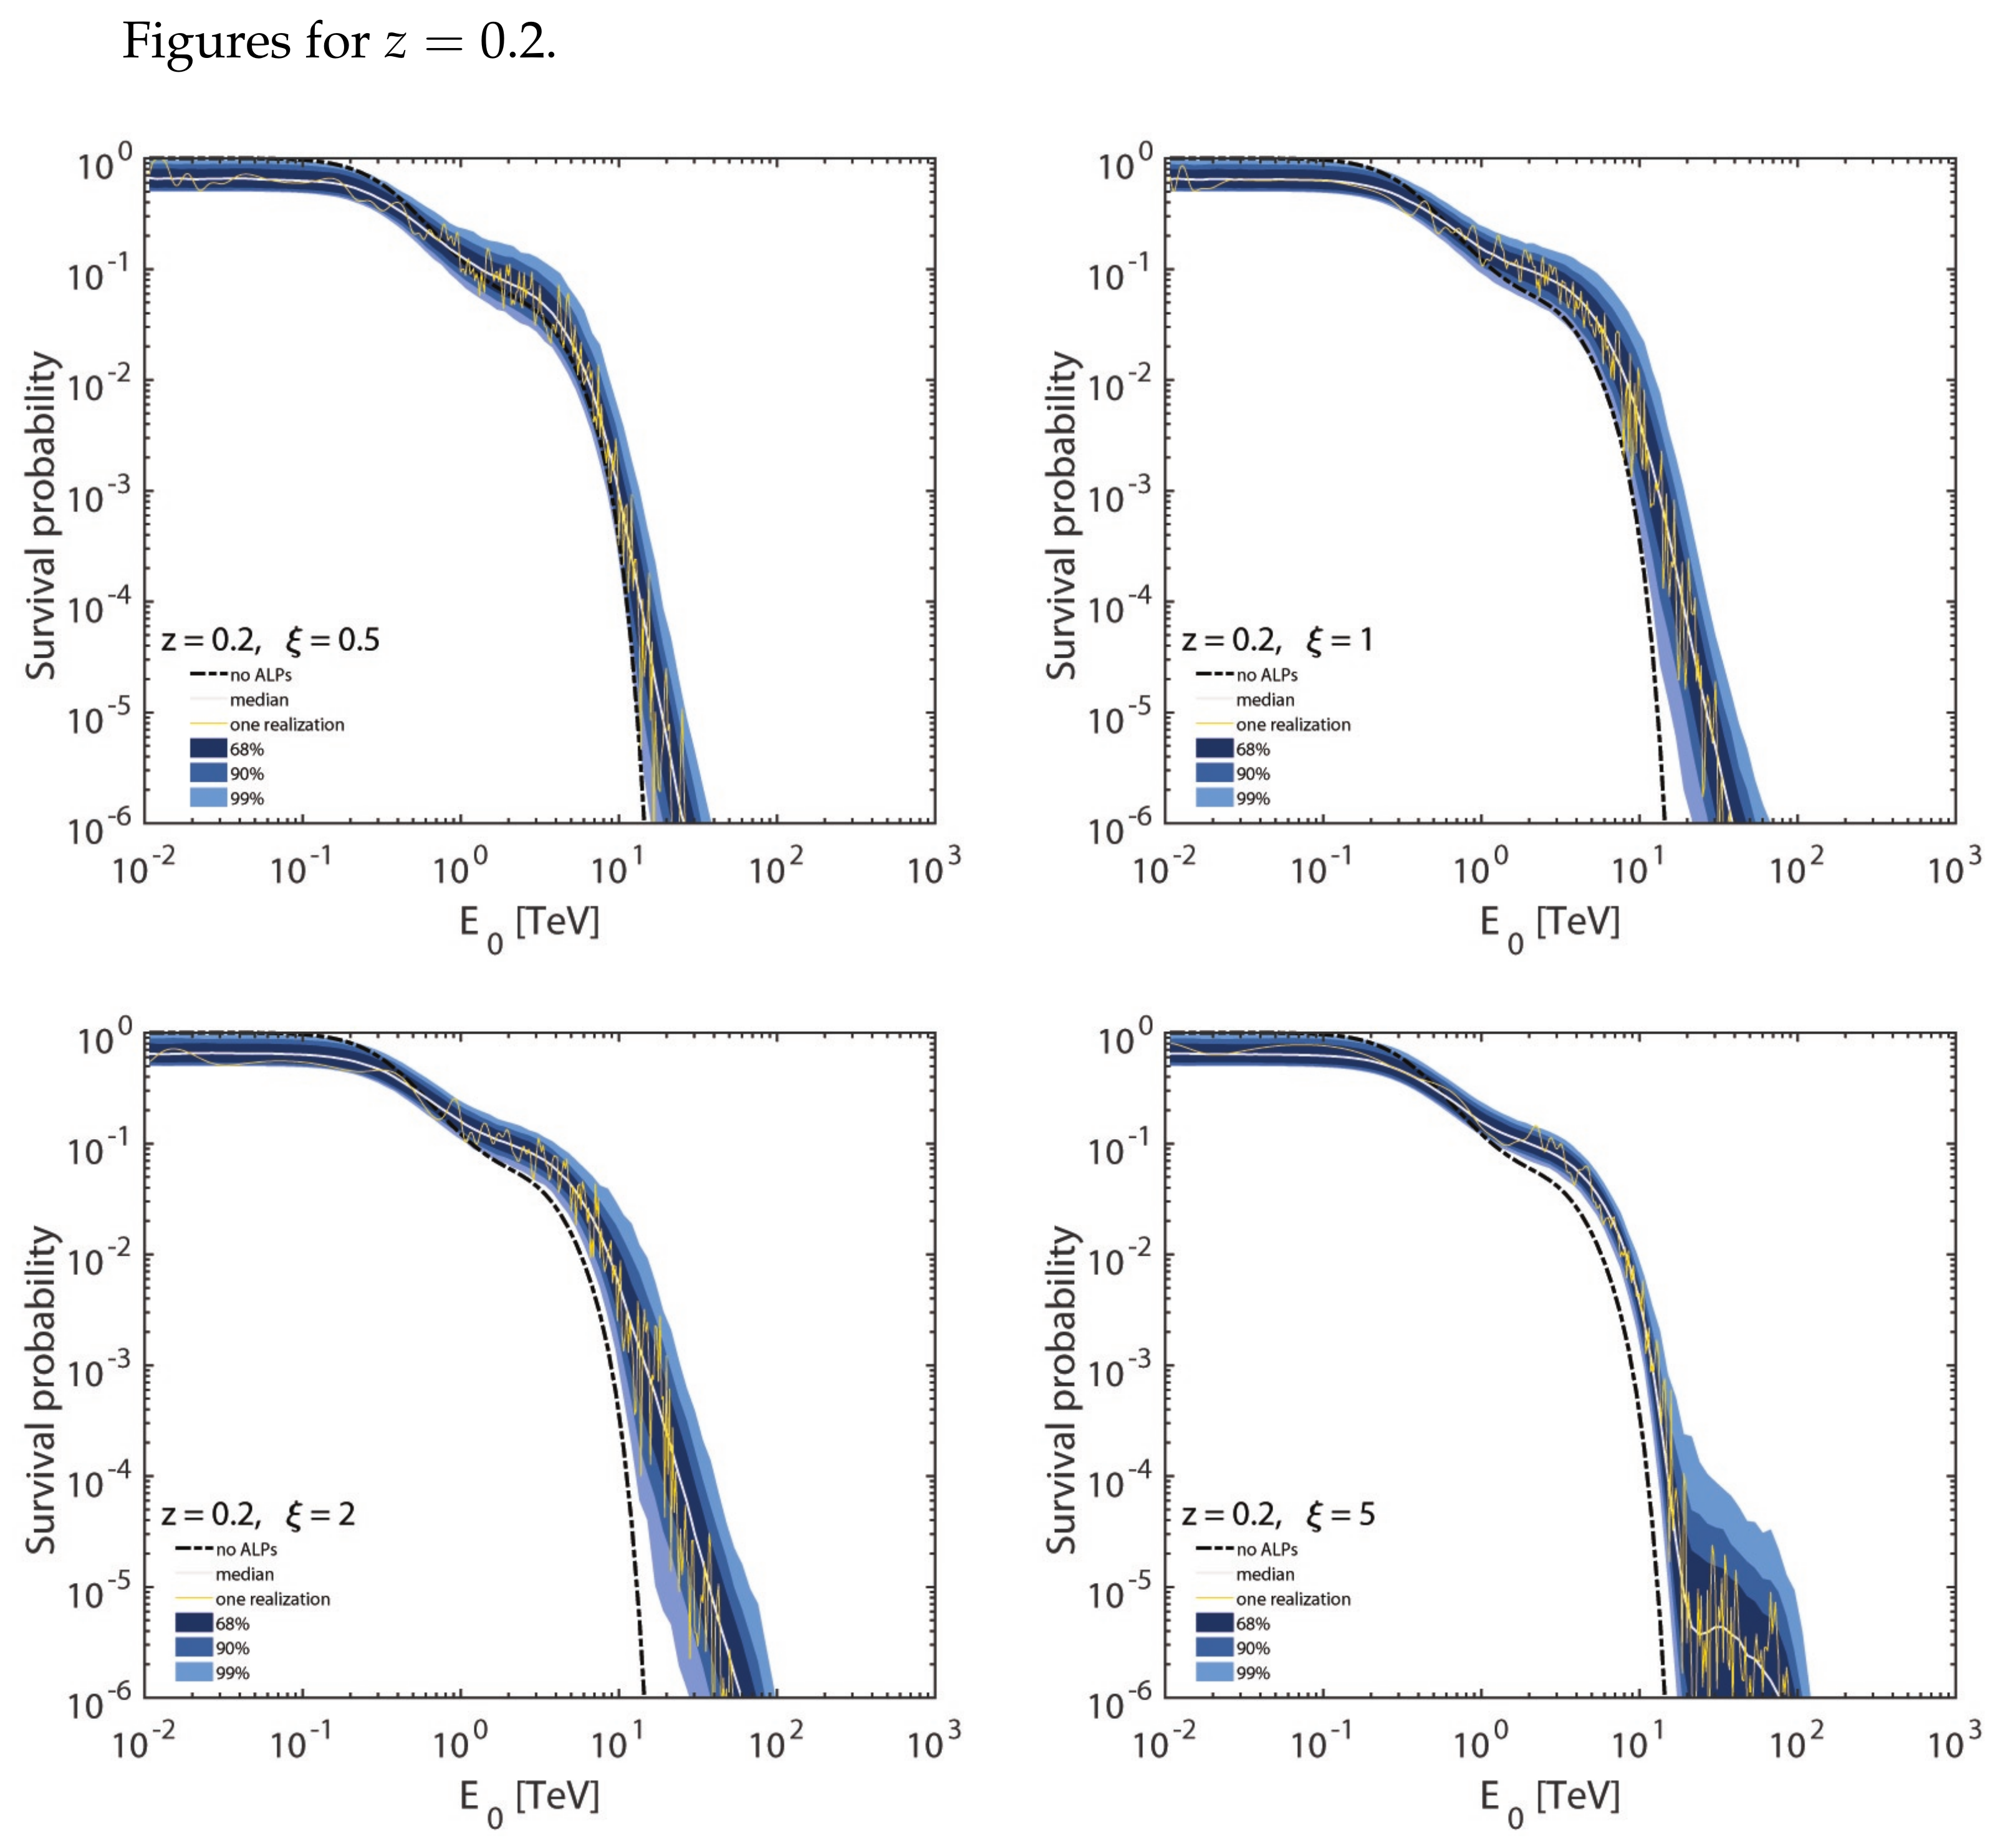
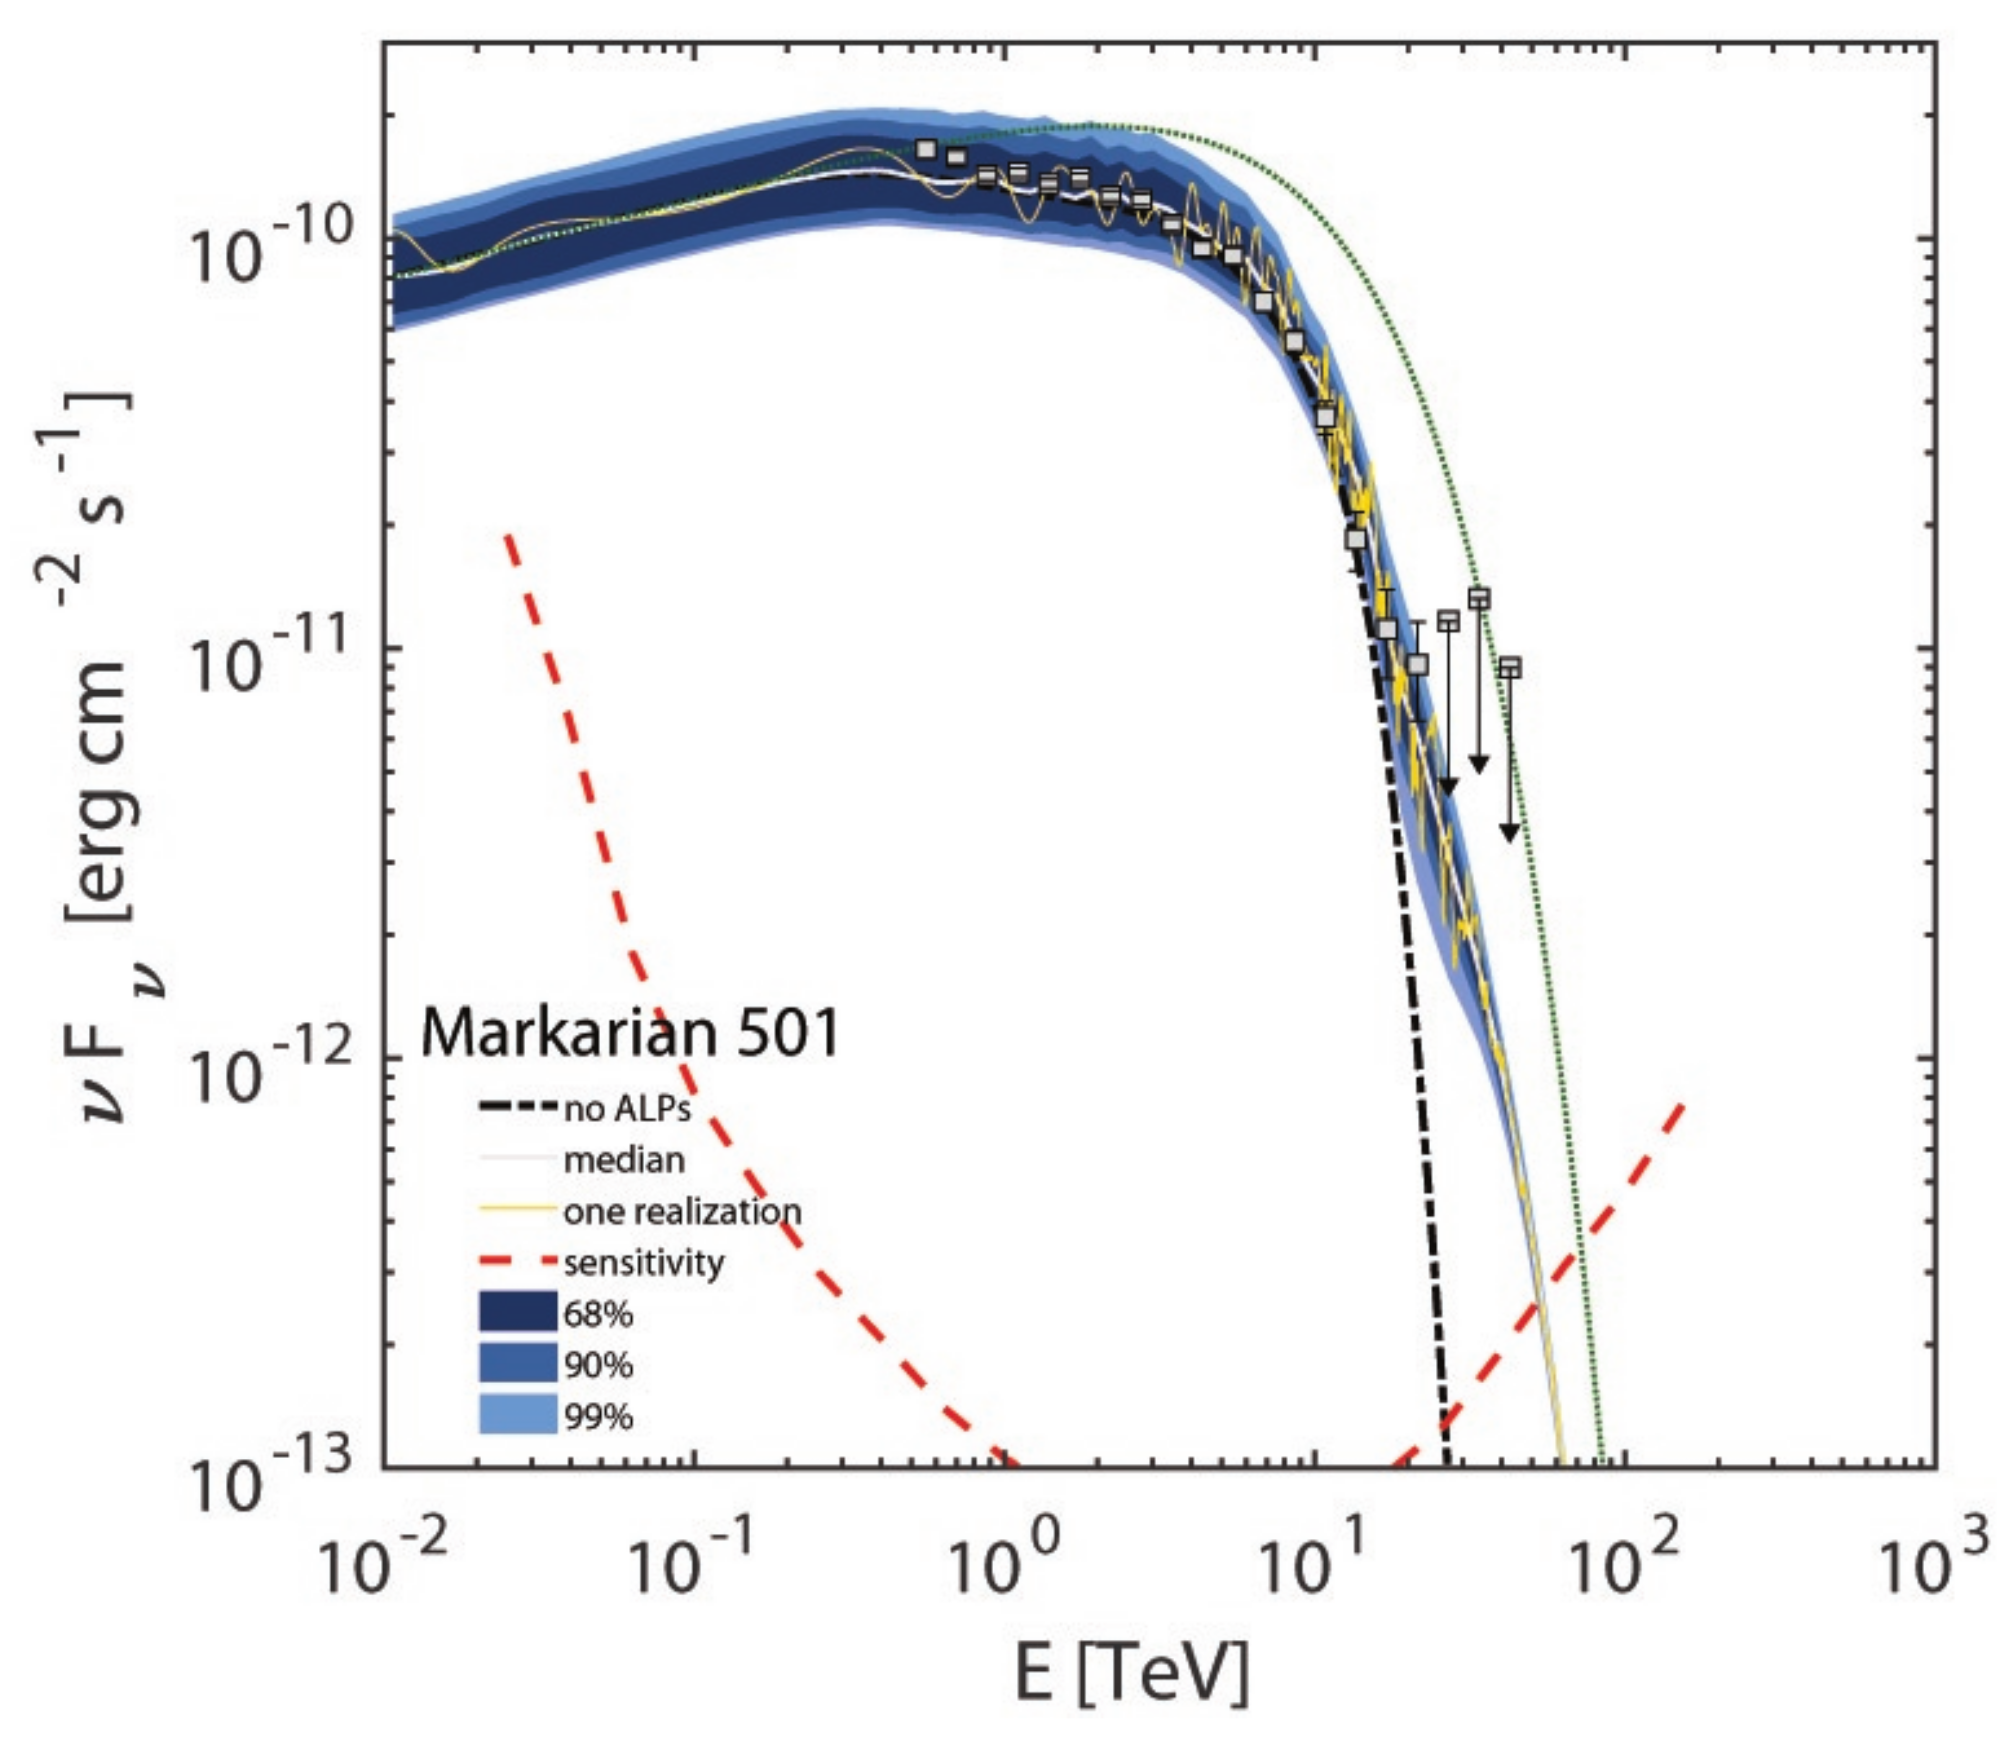
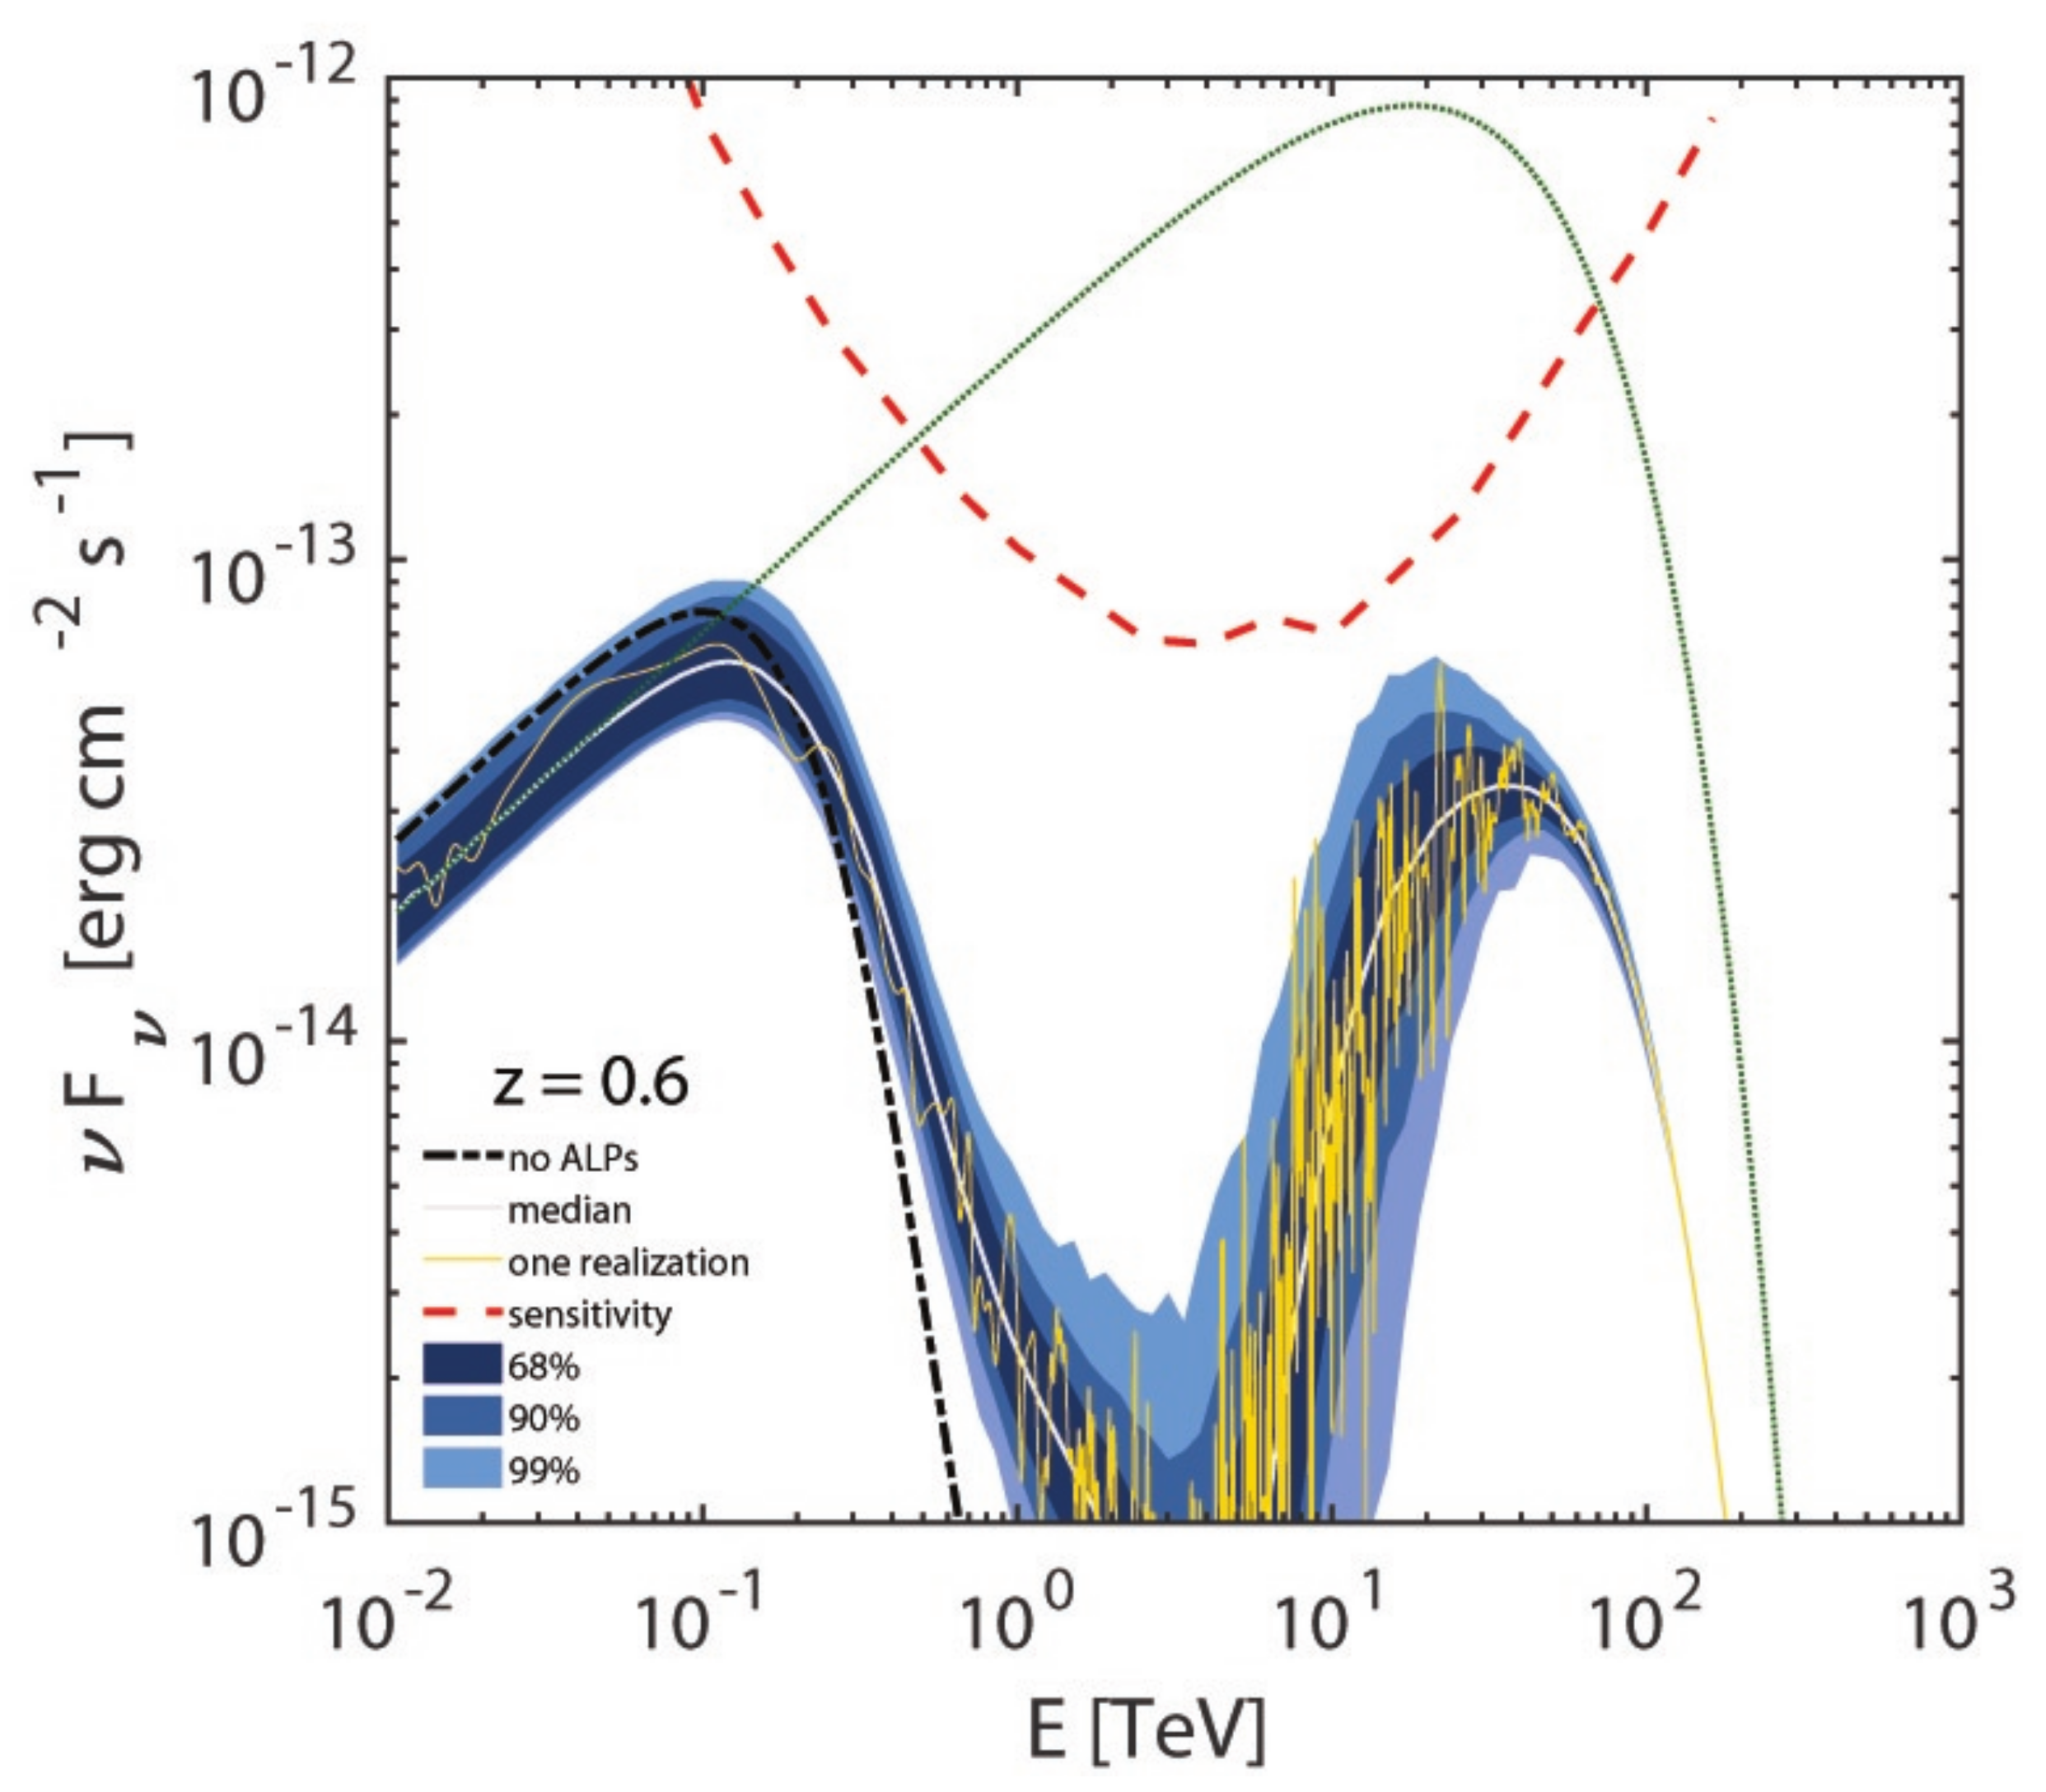
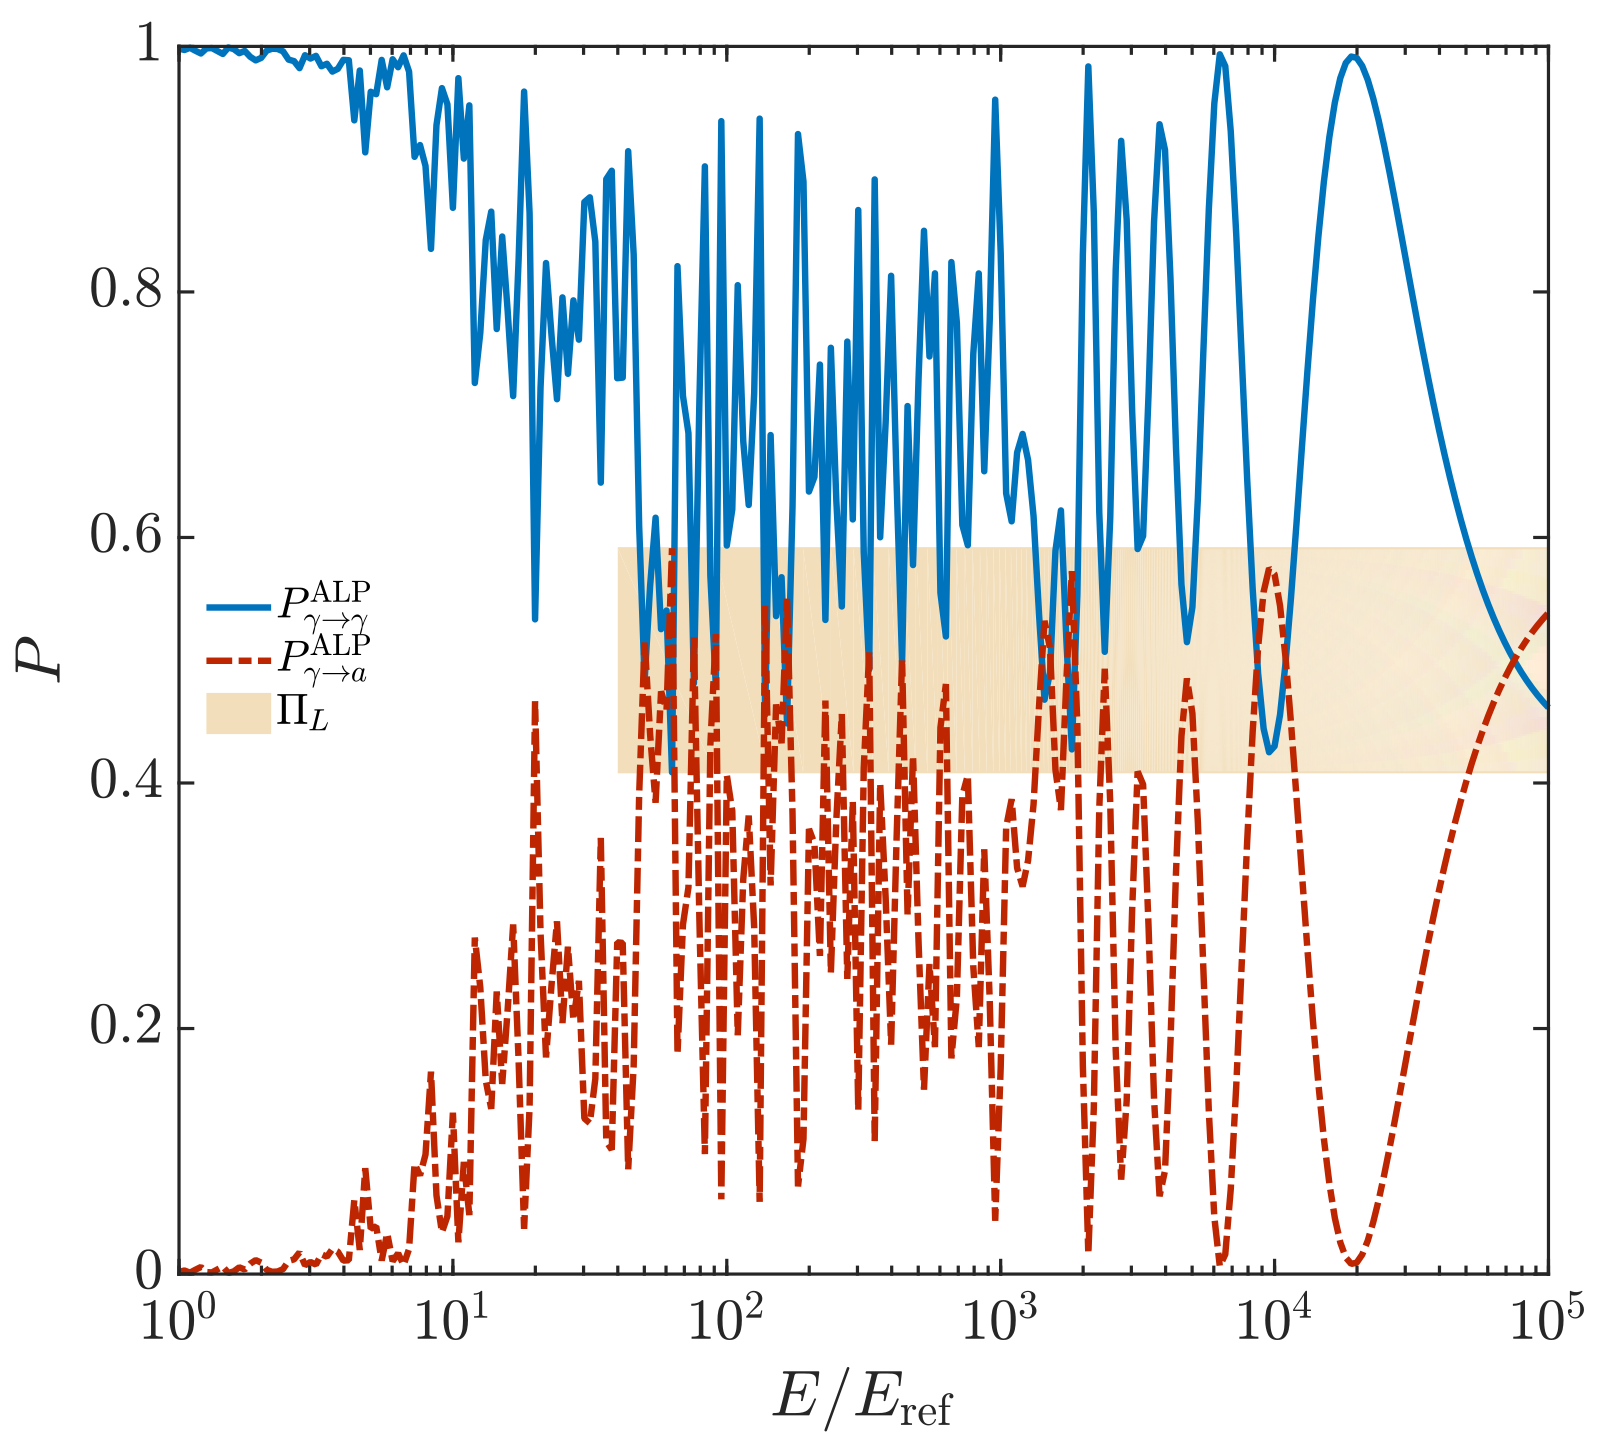
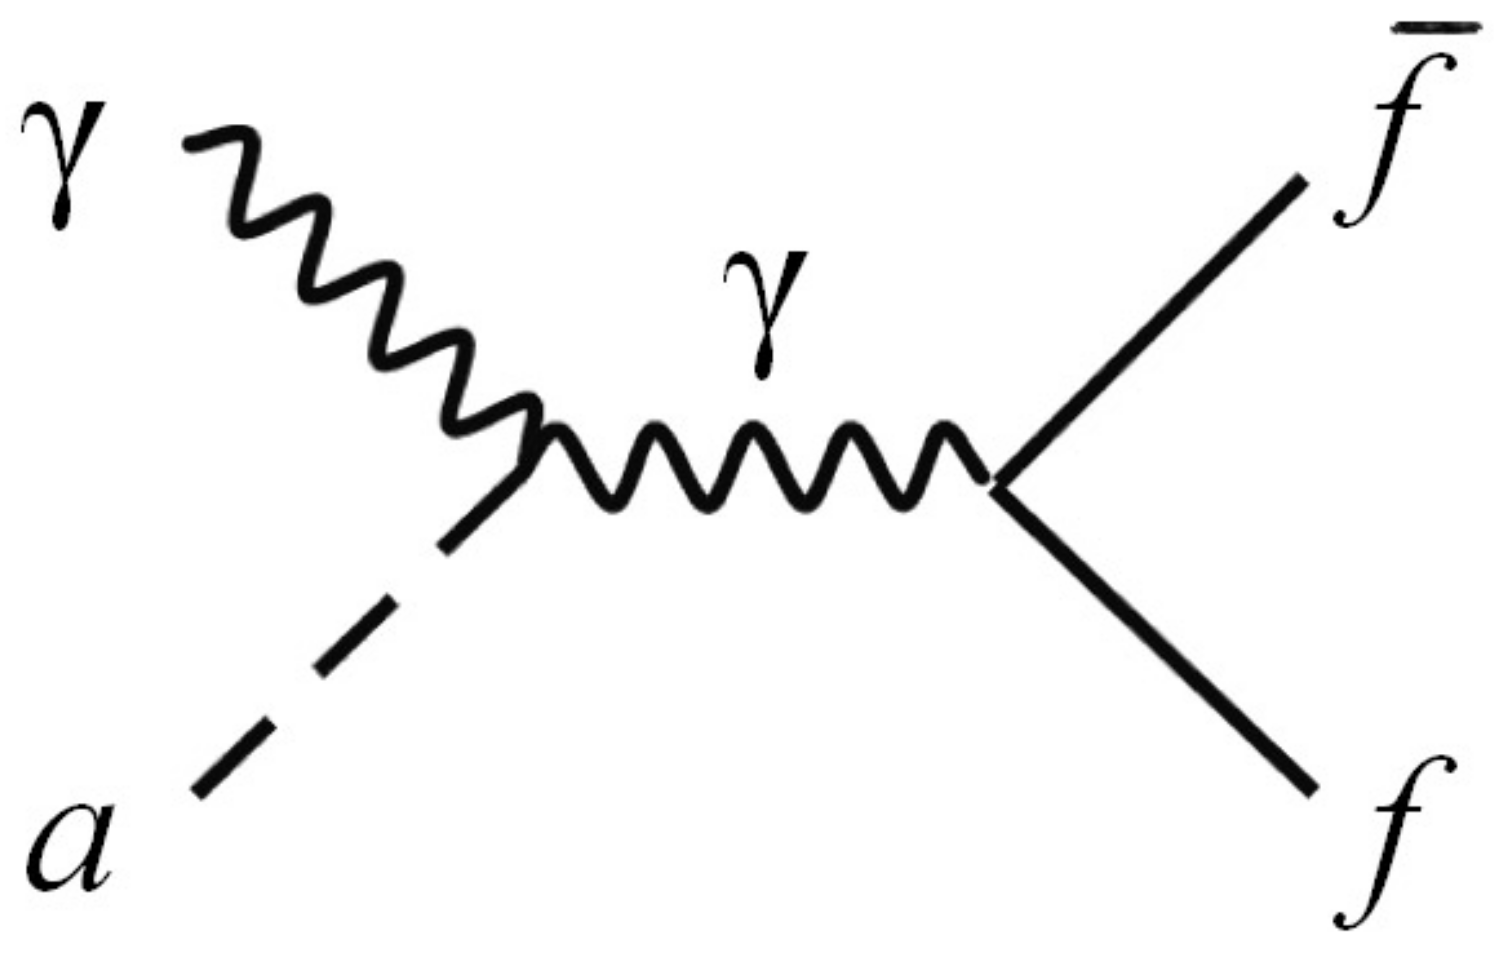
Figure 24.
We exhibit the oscillation length versus the observed energy E in the various regions crossed by the photon/ALP beam. The upper panel refers to the propagation in the jet: in this case strongly depends on the value of at different distances from the emission region. We plot at (i) the emission distance (solid line), (ii) (dashed line) and (iii) (dotted line). In the central panel we draw the behaviour of versus E in the extragalactic space while in the lower panel the behaviour of versus E in the Milky Way. (Credit [116]).

Figure 25.
We exhibit the observed SED of Markarian 501 versus the observed energy E. The dotted-dashed black line corresponds to conventional physics, the solid light-gray line to the median of all the realizations of the photon/ALP propagation process and the solid yellow line to a single realization with a random distribution of the domain lengths and of the orientation angles of the extragalactic magnetic field. The dotted green line is the intrinsic SED and the dashed red line represents the CTA sensitivity for the South site and 50 h of observation. The filled area is the envelope of the results on the percentile of all the possible realizations of the propagation process at (dark blue), (blue) and (light blue), respectively. The light gray squares are the spectrum detected by HEGRA [257]. (Credit [116]).

Figure 26.
Same as Figure 25 but for 1ES 0229+200. The dark gray squares are the spectrum detected by Fermi/LAT [260] while the light gray squares are the spectrum observed by HESS [261]. (Credit [116]).

Figure 27.
Same as Figure 25 but for a BL Lac at in the case of observation of the BL Lac along the direction of the galactic pole. (Credit [116]).

Figure 28.
Same as Figure 25 but for a BL Lac at in the case of observation of the BL Lac along the direction of the galactic plane. (Credit [116]).

Figure 29.
Measure of the initial photon degree of linear polarization . We show and with respect to the energy E ( represents a generic reference energy). The yellow area represents the overlap between and and thus the measure of . In the model photons have been emitted with . The inferred value is very close.

Figure 30.
Photon survival probability in the presence of photon-ALP interaction (left panel) and corresponding final degree of linear polarization (central panel) with respect to the energy for photons produced in the central region of the galaxy cluster. In the (right panel) the probability density function of at is reported. The initial degree of linear polarization is . See the text for the system parameter choice.

Figure 31.
Photon survival probability in the presence of photon-ALP interaction (left panel) and corresponding final degree of linear polarization (central panel) with respect to the energy for photons produced at the blazar jet base. In the (right panel) the probability density function of at is reported. The initial degree of linear polarization is . See the text for the system parameter choice.

Table 1.
Values of in the case of conventional physics and within the ALP scenario, for all blazars belonging to . The first column indicates the number of fit parameters, the second column concerns conventional physics and the third column refers to the ALP scenario for and our benchmark values of . The number in boldface corresponds to the minimum of .
| # of Fit Parameters | |||||
|---|---|---|---|---|---|
| 1 | 2.37 | 2.29 | 1.29 | 1.31 | 1.43 |
| 2 | 1.49 | 1.47 | 1.29 | 1.31 | 1.38 |
| 3 | 1.46 | 1.46 | 1.32 | 1.31 | 1.37 |
Table 2.
Same as Table 1 but for .
Table 2.
Same as Table 1 but for .
| # of Fit Parameters | |||||
|---|---|---|---|---|---|
| 1 | 2.37 | 2.05 | 1.25 | 1.39 | 1.43 |
| 2 | 1.49 | 1.44 | 1.26 | 1.37 | 1.38 |
| 3 | 1.46 | 1.46 | 1.28 | 1.36 | 1.37 |
Publisher’s Note: MDPI stays neutral with regard to jurisdictional claims in published maps and institutional affiliations. |
© 2022 by the authors. Licensee MDPI, Basel, Switzerland. This article is an open access article distributed under the terms and conditions of the Creative Commons Attribution (CC BY) license (https://creativecommons.org/licenses/by/4.0/).
Share and Cite
MDPI and ACS Style
Galanti, G.; Roncadelli, M. Axion-like Particles Implications for High-Energy Astrophysics. Universe 2022, 8, 253. https://doi.org/10.3390/universe8050253
AMA Style
Galanti G, Roncadelli M. Axion-like Particles Implications for High-Energy Astrophysics. Universe. 2022; 8(5):253. https://doi.org/10.3390/universe8050253
Chicago/Turabian StyleGalanti, Giorgio, and Marco Roncadelli. 2022. "Axion-like Particles Implications for High-Energy Astrophysics" Universe 8, no. 5: 253. https://doi.org/10.3390/universe8050253
Note that from the first issue of 2016, this journal uses article numbers instead of page numbers. See further details here.