Abstract
We explore the effect of neutron lifetime and its uncertainty on standard big bang nucleosynthesis (BBN). BBN describes the cosmic production of the light nuclides, , D, +, , and +, in the first minutes of cosmic time. The neutron mean life has two roles in modern BBN calculations: (1) it normalizes the matrix element for weak interconversions, and (2) it sets the rate of free neutron decay after the weak interactions freeze-out. We review the history of the interplay between measurements and BBN, and present a study of the sensitivity of the light element abundances to the modern neutron lifetime measurements. We find that uncertainties dominate the predicted error budget, but these theory errors remain smaller than the uncertainties in observations, even with the dispersion in recent neutron lifetime measurements. For the other light element predictions, contributes negligibly to their error budget. Turning the problem around, we combine present BBN and cosmic microwave background (CMB) determinations of the cosmic baryon density to predict a “cosmologically preferred” mean life of , which is consistent with experimental mean life determinations. We show that if future astronomical and cosmological helium observations can reach an uncertainty of in the mass fraction , this could begin to discriminate between the mean life determinations.
1. Introduction
The origin of the light elements (, D, , , and ) is well explained by big bang nucleosynthesis (BBN) taking place in the early Universe, when the temperature scale was roughly 1 MeV and below, i.e., the energies associated with nuclear reactions [,,,,,,,,]. Because the physics of these energies is well-known, testable predictions of BBN are possible given reliable nuclear cross sections and the subject of this contribution, a well-measured neutron lifetime [].
Standard BBN is the theoretical framework that implements these cross sections in the context of both the Standard Models of particle physics and cosmology, and is the model we will adopt for this paper. For cosmology, we will thus assume CDM. For BBN, this means that the Universe was dominated by photon and neutrino radiation during BBN, with a baryon density consistent with that determined from measurements of the cosmic microwave background (CMB) anisotropies []; it is useful to parameterize the baryon density in terms of baryon-to-photon ratio , with the density of blackbody photons fixed by the temperature: . From the Standard model of electroweak interactions, we will assume that the number of light neutrino flavors is and that there are no other relativistic contributions to the energy density.
Historically, progress in BBN has been tightly linked to progress in the measurement of the neutron lifetime. Until the 1980s, the uncertainties in the prediction of the light element abundances by BBN were dominated by the uncertainty of these three parameters ; this was prior to the CMB determination of the baryon density, the measurement of the number of neutrino flavors at LEP/SLAC [], and the vast improvement in the measurement of the neutron lifetime [,]. For example, the primordial helium mass fraction is sensitive to the variation in each of these quantities, as can be seen in Figure 1 taken from the 1981 analysis in Ref. []. In this figure, the helium mass fraction, is plotted as a function of the baryon-to-photon ratio for three values of and three values for the neutron lifetime1. At the time, BBN provided the best estimate for and (this was pre-LEP/SLAC and direct limits from accelerators on were quite poor []). The values of used here corresponded to what was the “accepted" value for the neutron half-life, min corresponding to a mean life s that came from a 1972 paper by Christensen et al. []; and more recent though very different determinations of min or s by Bondarenko et al. []; and min or s [] by Byrne et al.
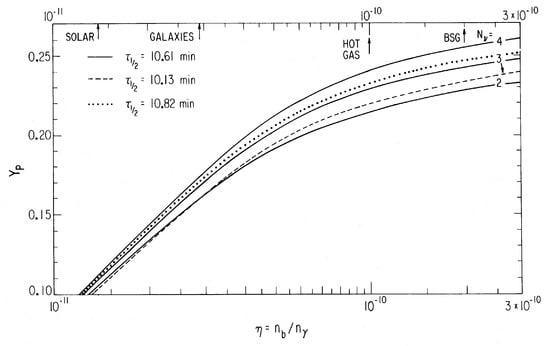
Figure 1.
The helium mass fraction as a function of the baryon-to-photon ratio for three choices of , and 4 and three choices of with . Figure circa 1981 from ref. [].
It is also interesting to note the range in shown in this 1981 figure. It spans values of from (corresponding to mass-to-light ratios typical of the solar neighborhood) to . Today, is quite well determined [,,]: from CMB data alone [], and from a combination of BBN, CMB and light element abundance observations. Clearly, our understanding of the baryon density of the Universe has progressed.
The Review of Particle Properties in 1982 [] quoted an average neutron mean life of s based on the Christensen et al. and Byrne et al. measurements along with a measurement by Kosvintsev et al. [], which gave s. The Bondarenko et al. measurement was excluded as it was “in significant disagreement with the other two precise direct mean life measurements and the inferred value given by Wilkinson 80” []. In the 1984 edition of the Review of Particle Properties [], the Bondarenko measurement was included replacing Kosvintsev 1980 giving s, noting that the origin of the discrepancies between the measurements was not known. Because of the discrepancies, the uncertainty in the mean was inflated by a scale factor of 2.4.
It was not until 1990 that Mampe et al. [] presented a significantly more accurate result s using ultra cold neutrons in a fluid-walled bottle. This had a strong effect on the world average, which was now , based on seven measurements. The discrepancy was largely gone, and the scale factor for the uncertainty was reduced to 1.3, in part due to the withdrawal of the 1980 measurement by Byrne et al.
The evolution of the world average is plotted in Figure 2, showing the average mean lifetime since 1960. These values are collected in Table 1, which only shows years in which the average mean life changed. Here, multiple uncertainties have been combined in quadrature. One clearly sees the marked drop in the value and uncertainty following the Mampe et al. measurement. The impact of this measurement on BBN was immediate [] since, as described in more detail below, the uncertainty in the predicted helium abundance is very sensitive to the uncertainty in the neutron mean lifetime [],
meaning that a drop in the uncertainty from 16 to 3.5 reduced the uncertainty in from 0.0032 to 0.0007, assuming .
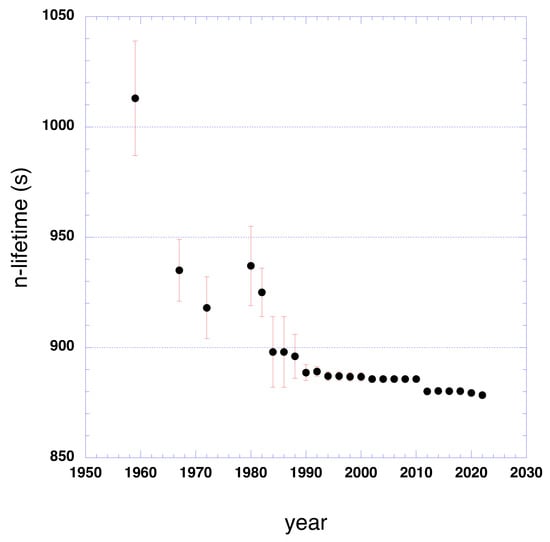
Figure 2.
The average mean lifetime of the neutron as compiled by the Review of Particle Properties/Physics. Please note that the uncertainty in the mean life for more recent measurements is smaller than the symbol showing the mean.

Table 1.
Neutron mean life and uncertainty (in s) as reported by the review of Particle Properties and Review of Particle Physics.
By the time of the 2002 edition of the Review of Particle Physics [], there were enough high-quality direct measurements allowing the Particle Data Group (PDG) to drop measurements with uncertainties larger than 10 s. This led to another impressive drop in the uncertainty of the mean, with s. This drop was largely driven by the measurement of Arzumanov et al. [] and further dropped the uncertainty in to 0.0002, making the dominant source of uncertainty (at the time) other nuclear rates [].
At about this time, WMAP provided the first all-sky measurements of anisotropies in the CMB temperature []. These fluctuations encode a wealth of cosmological parameters, including the baryon density or baryon-to-photon ratio . Using this input from the CMB along with the improvements in the measurements of effectively made BBN a parameter-free theory [].
However, it is certainly reasonable to question whether the quoted uncertainties are truly reflective of the systematic errors included. In 2005, Serebrov et al. [] published a result which was in fact systematically lower than the previous world average, . This value was used in a BBN analysis in Ref. []. As a sole and severely discrepant value, it was not included in the PDG average until 2012 [] when additional low values were reported. The 2012 average was now where the uncertainty has been scaled by a factor of 1.8. This seismic shift in is clearly seen in Figure 2. An ideogram of the seven measurements leading to this average is shown in Figure 3a2. Here, we see the onset of a discrepancy in . The vertical blue rectangle corresponds to the 2012 mean and 1 spread. A review including a discussion of the methods used to obtain can be found in [].
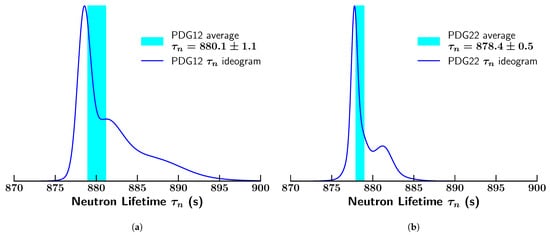
Figure 3.
Ideograms for neutron lifetime measurements. (a) Ideogram for the seven measurements contributing to the PDG average neutron mean life in 2012; (b) Ideogram for the eight measurements contributing to the PDG average neutron mean life in 2022.
Subsequent changes in the world average have been relatively minor—certainly from the perspective of BBN calculations [], where the current value of
based on eight measurements [,,,,,,,,] is used. As the uncertainties in individual measurements continue to drop, the discrepancy appears more pronounced, and the uncertainty already includes a scale factor of 1.8 []. This can be seen in the current ideogram shown in Figure 3b.
Despite the tightness of the world average in Equation (2), the neutron lifetime remains an outstanding puzzle. The results used in Equation (2) are based on confined ultracold neutrons, with earlier experiments using material bottles, and later experiments using magnetic and gravitational traps. The measurements in traps give consistent results, with recent very precise UCN determination [] dominating the weighted averages among them and leading to the sharp peak in Figure 3b. The most recent bottle measurements give lifetimes systematically longer than the trap measurements, leading to the shoulder to the right of the peak in Figure 3b. The resulting dispersion between the trap and bottle measurements is of order , and could stem from systematic differences between the methods. There is, in addition, an in-beam measurement by Yue et al. [] with a relatively high value of s. This differs from the best trap measurement by . We will not here enter further into the current discrepancies, noting only that for a recent discussion of the differences between the ultracold neutron results (the ones used in the PDG average) and the in-beam results, the reader should see [] as well as other articles in this Special Issue.
In what follows, we will first briefly review the role of the neutron lifetime in standard BBN calculations in Section 2. We will also review the current results of BBN based on the latest input nuclear cross-sections (including ) and abundance data. In Section 3, we will discuss the sensitivity of the results to . We will also test the potential effect of the discrepancy instead of Monte Carlo sampling of the Gaussian corresponding to the mean value of (and its uncertainty), but as a test, we will use the ideogram in Figure 3b to sample values of —keeping in mind that this procedure is not fully rigorous. In Section 4, we will take a novel approach to and treat it again as a parameter for which we generate a likelihood function and make a BBN prediction for . Finally, in Section 5, we summarize the current state of BBN with respect to the neutron lifetime.
2. Standard BBN
Standard BBN (SBBN) is built upon Standard Model of nuclear and particle physics, in the background of the Friedmann-Robertson-Walker cosmological model based on Einstein gravity. We assume only the standard set of nuclear and particle interactions and nuclear and particle content3, in particular, with . Furthermore, in SBBN, we assume a radiation-dominated Universe during the epoch of nucleosynthesis. The radiation density can be expressed as
taking into account the contributions of photons, electrons and positrons, and neutrino flavors appropriate for temperatures MeV. The expansion rate of the Universe is determined by the Hubble parameter which can be expressed as
where is Newton’s constant and scales as in a radiation dominated universe.
The cosmic evolution of the light nuclides is plotted in Figure 4; many critical features can be understood analytically, as we now summarize. At temperatures MeV, weak interactions between neutrons and protons maintain equilibrium. These are:
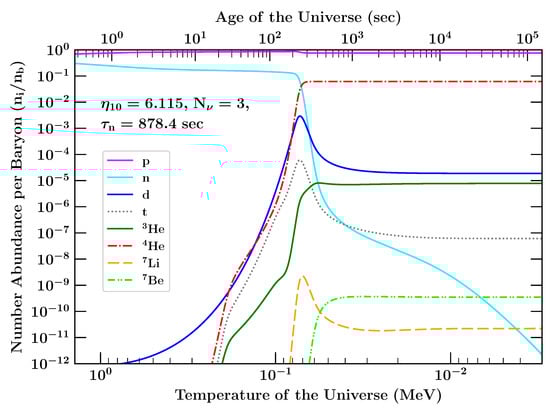
Figure 4.
Time evolution of the light element abundances during BBN. Please note that time (upper axis) increases to the right, and so the temperature is shown to decrease to the right.
As one might expect, the weak interaction rates scale as , where is the Fermi constant. These reactions freeze-out when their interaction rates become slower than the expansion rate of the Universe determined by the Hubble parameter, or in other words, when the mean time between interactions is longer than the age of the Universe, determined by . Thus, the freeze-out condition is set by
Weak freeze-out occurs at MeV, and corresponds to a flattening of the neutron and proton curves in Figure 4. At freeze-out, the neutron-to-proton ratio is given approximately by the Boltzmann factor, , where MeV is the neutron–proton mass difference. The resulting mass fraction of neutrons at freezeout is thus .
After freeze-out, free neutron decays reduce the ratio slightly, which leads to the shallow slope in the neutron and proton curves in Figure 4. Accounting for these decays, before nucleosynthesis begins at time . For s determined by the time when the photo-destruction rates of deuterium freeze-out, and s, we have or . A useful and more elaborate semi-analytic description of freeze-out can be found in [,,].
At , nucleosynthesis activity reaches a crescendo. Deuterons are formed via , and then undergo a series of strong reactions culminating in production. These rapid reactions lead to a dramatic drop in the free n abundance, as seen in Figure 4. Finally, the strong reactions also freeze-out, largely due to the inability to overcome the Coulomb barrier in the expanding and cooling plasma. Then the stable nuclides plateau, while the radioactive species ultimately decay–as shown by the free neutron decay in Figure 4 at late times.
The neutron lifetime plays two roles in BBN calculations. First, it is used to normalize the zero-temperature matrix element for weak interconversions (5). The rates for these reactions scale as . Thus, affects the determination of the freeze-out temperature of these weak interactions. Freeze-out is determined from the competition between the weak interaction rates and the Hubble expansion as in Equation (6). Thus, an increase in the neutron lifetime leads to an increase in the freeze-out temperature leading to more neutrons at freeze-out (recall the n/p ratio scales as prior to freeze-out) and hence more , as seen in Figure 1 and Figure 5.
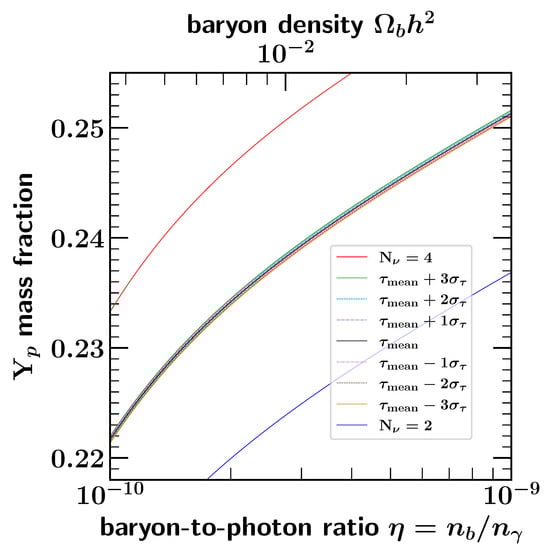
Figure 5.
The helium mass fraction as a function of the baryon-to-photon ratio for three choices of , and 4 and for a spread in values of up to about the mean with .
Second, the neutron lifetime controls the rate of free neutron decay, which occurs between weak freezeout at and the end of the D bottleneck at . These decays lower the ratio. Therefore, an increase in the neutron lifetime leads again to more neutrons left over and hence a higher abundance.
Similar arguments can be made for the dependence of on and . As one can see from Figure 5, increases with increases in all three inputs: , , and . It is interesting to compare Figure 5 with Figure 1. Qualitatively, they are similar. However, there are several jarring differences. First, as remarked earlier, the domain in , did not previously even cover the current best fit of . Second, as has been stressed in the Introduction, the relevant values of are very different. Whereas in Figure 1 values of between 877 s and 937 s, were deemed reasonable. In Figure 5, the 3 spread in curves shown for , covers 876.8 s to 879.8 s. Finally, while the uncertainty in from (for ) and was comparable in Figure 1, as one can plainly see, for the same spread in , the uncertainty due a spread in is almost negligible.
3. Abundance Sensitivities to
In this section, we review the dependence of the light element abundances to . As we discussed earlier, we expect the abundance of to increase with increasing . It is instructive and relatively straightforward to estimate this dependence. As is well-known, the dominant isotope emerging from BBN is with a mass fraction of roughly 25%. In contrast, the abundance (by number) of D and is only of order . Therefore to a good approximation, we can assume that after the deuterium bottleneck, all neutrons will eventually go to and we can write
for the mass fraction, where the second and third expressions are evaluated at the time at the end of the deuterium bottleneck. Recalling that the neutron-to-proton ratio at freeze-out is fixed by the Boltzmann factor , when BBN begins, the ratio is lowered by neutron decays so that
which explicitly shows the direct dependence as well as its indirect influence through the freezeout temperature . The latter is set by the equating the weak interaction rates and the Hubble rate , which gives
We then can trace the effect of shifts by looking at the linearized response to changes in the neutron lifetime:
Then using , , , we can write
Finally using MeV, , , and s, we have
which can be compared with the full numerical dependence (at the best fit value of ) of [] given in Equation (1). Recall that the contributions are comparable and work in the same direction: a longer leads to more due to (1) an earlier weak freezeout and (2) more free neutrons surviving decay.
The numerical scaling of the light element abundances to , and , is
where other inputs, such as nuclear cross-section, have been set at their mean values. These fits update those given in Ref. []. Please note that the exponent in Equation (13) from a numerical fit is close to the estimate in Equation (12). These fits are normalized at the Standard Model value of , the best fit value of [] and Equation (2) for .
The sensitivity of the abundance to the neutron mean life is shown in Figure 6. Typically, because the uncertainty in the neutron mean life is small, BBN predictions for the light element abundances are obtained by combining the BBN likelihood function, , where the abundances cover D, , and , with a CMB likelihood function taken from Planck data [], , where we include the dependence on and do not assume any a priori relation between and [,]. Throughout, we are assuming . We can, however, include the explicit dependence on to form the following likelihood function
where can either be derived from the Gaussian with mean and uncertainty given in Equation (2) or the ideogram in Figure 3b. The projection of this likelihood function (for ) onto the plane is shown in Figure 6. Here, we show the 1, 2, and 3 contours from a Monte Carlo scan over the neutron mean life assuming Equation (2) with a Gaussian distributed uncertainty. The star indicates the peak value of the likelihood function. The tightness of the ellipses is a consequence of the small uncertainty in . This plot is an update of that in []. The expected correlation between the neutron mean lifetime and abundance prediction is clear. It is not perfectly linear because other reaction rate uncertainties significantly contribute to the total uncertainty in as sampled in our Monte Carlo. These include rates for , , and . Please note that marginalizing over determines the theoretical likelihood function discussed below.
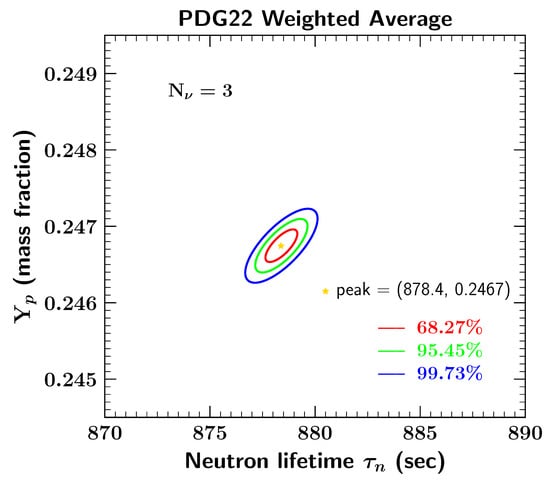
Figure 6.
The sensitivity of the abundance to the neutron mean lifetime, assuming a Gaussian distribution for with mean and uncertainty given by Equation (2). In addition to the peak of the likelihood, denoted by a star, we show the 1, 2, and 3 contours.
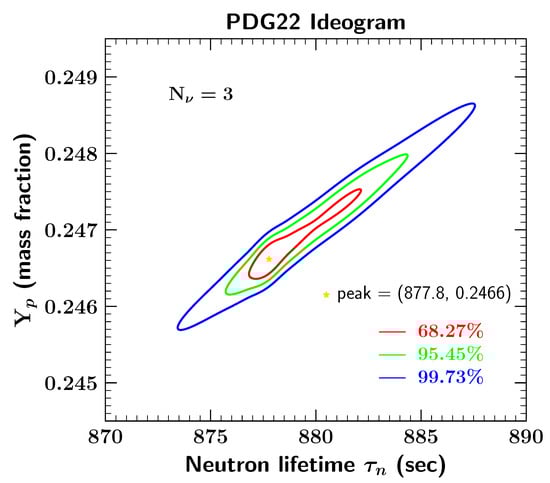
If instead of taking a Gaussian distribution with mean and uncertainty given by Equation (2), we use the distribution indicated by the ideogram in Figure 3b, we obtain the elongated prediction for shown in Figure 7. While the ideogram distribution should not be taken as statistically rigorous, we remind the reader that there is somewhat significant dispersion in the experimental results for (a scale factor of 1.8 was already applied to obtain s) and the Gaussian may mask the true uncertainty.4 The tail end of the ideogram has lifetimes up to about 885 s, leading to significantly more .
It is also common to compare the predictions of BBN to the observations by examining the theoretical and observational likelihood functions [,,]. The theoretical likelihood function can be expressed as a convolution of the BBN theory, dependent on (we again fix ) and the CMB likelihood functions. The combined likelihood is defined by
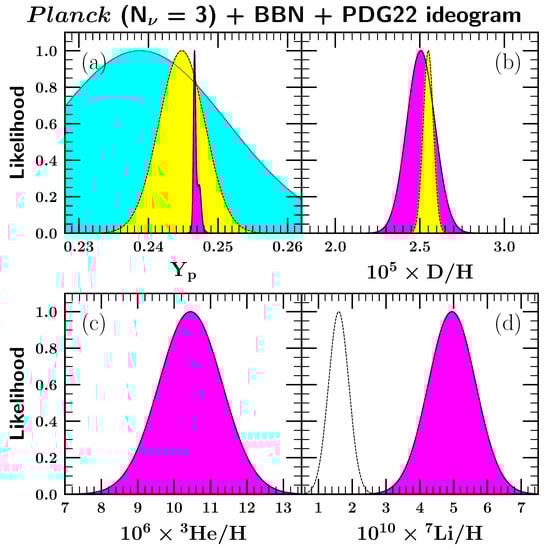
The second proportionality indicates that the combined BBN and CMB likelihood function is given by marginalizing Equation (17) over . We normalize each of the likelihood functions so that at their peaks . Figure 8 shows the comparison of these likelihood functions for (a) (upper left), (b) D/H (upper right), (c) /H (lower left), and (d) /H (lower right). In the case of , we show all three likelihood functions. The combined CMB-BBN likelihood from Equation (18), , is shaded purple. The observational likelihood determined from [,]
is shaded yellow. The CMB-only likelihood, given by
is shaded cyan. Given the observational and CMB uncertainties, the agreement is quite good.
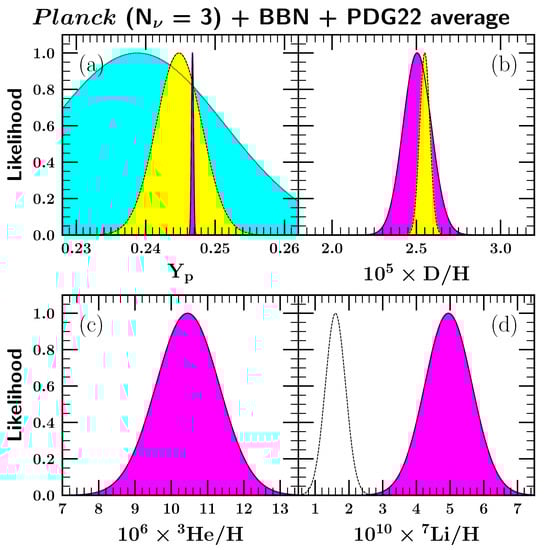
Figure 8.
Light element abundance likelihood functions. Shown are the likelihoods for each of the light nuclides: (a) the mass fraction, , (b) D/H, (c) /H, and (d) . The solid-lined, dark-shaded (purple) curves are the BBN+CMB predictions, based on Planck inputs as discussed in the text. The dashed-lined, light-shaded (yellow) curves show astronomical measurements of the primordial abundances, for all but where reliable primordial abundance measures do not exist. For , the dotted-lined, medium-shaded (cyan) curve shows the independent CMB determination of .
In the case of D/H, the observational likelihood is determined from [,,,,,,,]
The agreement between the CMB and BBN likelihoods as seen in panel (b) of Figure 8 is a major success for early Universe cosmology. We have not shown the observational likelihood function for as there are no unambiguous observations that can be associated with the primordial abundance. Similarly, it has been argued that the long-standing problem associated with [], is no longer well-founded []. The main arguments for associating the observational abundance with the primordial abundance relied on the unambiguous observation of in halo stars, as well as the lack of dispersion in abundances at low metallicity. Both of these arguments are now suspect. We show nevertheless, the abundance from low metallicity by the unshaded likelihood curve at /H [,].
The CMB-BBN likelihoods in Figure 8 are summarized by the predicted abundances
where the central values give the mean, and the error gives the variance. The final number in parentheses gives the value at the peak of the distribution.
For comparison, in Figure 9, we also show the same likelihood functions for each of the light elements, but instead, in our Monte Carlo, choose values of the neutron mean life from the ideogram in Figure 3b, rather than the Gaussian distribution. As one can see, apart from the feature on the high side of the BBN distribution (purple shaded likelihood in panel a), the results are very similar, which emphasizes the lack of sensitivity to the current neutron mean life given the experimental uncertainties, even with the dispersion among recent measurements.
Similarly, the CMB-BBN likelihoods in Figure 9 using the ideogram in Figure 3b can be summarized by the predicted abundances
The most striking effect between the two distributions is the increase by a factor of 2 in the predicted uncertainty in .
Finally, we consider the case in which the errors are dominated by systematics. In this case, it would be inappropriate to use the world average procedure we and the PDG have adopted. Using Equation (1) with s gives , where is the observed error in Equation (19). We see that while this shift is large compared to the theoretical error in Equations (22) and (26), it is small compared to the observed uncertainty. Even if we consider a discrepancy between the in-beam measurement and UCN trap measurements, the change is , and again the shift in the prediction is modest compared to the observed errors. Improvements in the observational abundance are anticipated (see, e.g., []), and levels of are certainly a goal of future observations. The lesson is that the neutron lifetime does not impact the basic BBN concordance, but also that future improvements in both and will make this comparison more interesting, as we now see.
4. BBN ‘Predictions’ of
It is also possible to combine the likelihood function in Equation (17) with an observational likelihood function from Equation (19) to obtain a likelihood function for
A similar exercise was performed in []. This likelihood function (again normalized so that the peak is at ) is shown in Figure 10 by the blue curve. It is characterized by an approximate Gaussian given by
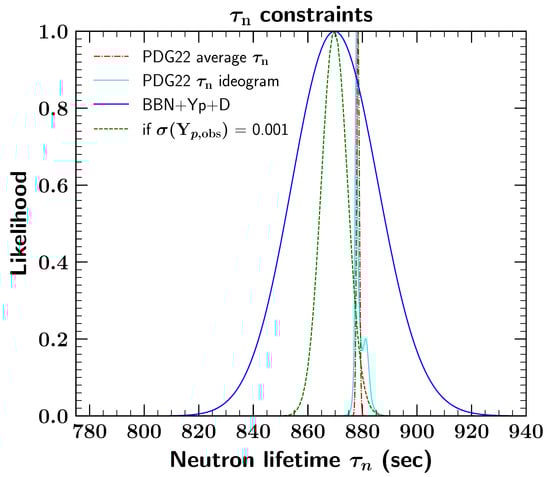
Figure 10.
Comparison of the current and potential future BBN predicted likelihood function for with the experimental likelihood. The solid blue curve shows the current BBN prediction, which is tightened to the green dashed curve if the uncertainty in the helium mass fraction can be reduced to . For comparison, the red dot-dashed curve shows the experimental value for represented by a Gaussian. The distribution represented by the ideogram is shown by the thin cyan solid curve.
Here we use the present uncertainty as in Equation (19). In Figure 10, we compare this BBN ‘prediction’ with the Gaussian given by Equation (2) (red dot-dashed curve), and that given by the ideogram (thin cyan curve). We see that the BBN+CMB result is consistent with both the in-beam and trap results for , but that the errorbars in Equation (31) are too large to discriminate between the shorter and longer experimental measures.
Although we did not discuss it here, the combined BBN and CMB analysis is capable of setting strong constraints on the number of relativistic degrees of freedom at the time of BBN characterized by . Currently, the joint analysis gives [] or a upper limit . The S4 CMB-only sensitivity [] is expected to reach . That means that if BBN is to remain competitive in the determination of , improvements in observations are needed so that the uncertainty in is lowered to 0.001, which is a (perhaps optimistic) goal of the observational program. In that case, we obtain a better determination of shown by the green dashed curve in Figure 10. In this case, we have
This can be compared to the likelihood from Equation (2) shown by the dot-dashed red curve. It is no surprise that it will be very difficult for BBN + CMB to compete with direct experimental measurements of the neutron mean life. However, Equation (32) shows that if the observations attain the goal , then the BBN+CMB prediction will approach the level of the present discrepancy among the experiments, and able to resolve the ∼10 s difference between the Yue et al. beam results [] and the best trap measurements.
5. Summary and Outlook
Motivated by recent interest in the neutron lifetime, we studied the effect of and its uncertainties on BBN in the post-Planck era of precision cosmology. In BBN calculations, the neutron lifetime normalizes the interconversions before weak freezeout, and then controls free neutron decay. The current discrepancy in neutron lifetime variations thus has an impact on cosmology, which we have assessed.
The continued improvements in measurements have played a key role in the present robustness and precision of BBN. In the 1980s, the neutron lifetime was a limiting factor in BBN predictions, and it remains the case that the uncertainty dominates the uncertainty in the predictions. However, as we have shown, modern data lead to tight predictions of the light element abundances–even given the systematic uncertainties in the neutron lifetime measurements. We showed that combining neutron lifetime measurements as in the PDG ideogram somewhat broadens the errors in the prediction, but this change remains far below the observed errors. Even a systematic uncertainty would change the prediction by less than the uncertainty in the astronomical observations, and the change in the other light elements is negligible. This robustness of the BBN predictions represents a triumph of a nuclear experiment, and allows BBN to play a key role in cosmology and particle physics.
Indeed, the precision of BBN nuclear inputs—and that of CMB observations—allows us to turn the problem around and make a joint BBN+CMB prediction of the neutron lifetime. Our result, (Equation (31)), is consistent within an error range in all experimental determinations. This concordance represents the success of the big bang cosmology, but the agreement arises because the errors in the BBN+CMB predictions are too large (at present) to discriminate among the experiments. We can compare this cosmological measurement of the neutron lifetime with another recent astrophysical determination based on the NASA Lunar Prospector measurements of the neutron flux around the Moon: []. We see that the two independent results are consistent with errors. We note that, unlike the lunar result, the cosmologically preferred central value lies somewhat below the laboratory results, though the offset is not statistically significant.
Upcoming experiments and observations can improve the current situation and sharpen the link between the neutron lifetime and cosmology. This is important not only for finding the resolution of the puzzle, but also for BBN. As cosmological measurements become even more precise, it remains important to improve the determination of and other nuclear inputs to the BBN predictions. We look forward to progress on several fronts.
- New neutron lifetime measurements are planned. These include (a) both an upgrade magneto-gravitational trap experiment UCN+, and (b) an upgraded pulsed beam experiment, Beam Lifetime 3 (BL3) []. These can shed new light on and perhaps resolve the puzzle.
- The next generation CMB measurements from CMB-S4 will significantly improve both the determination of and from the CMB []. Improved measurements will be important for BBN to fully exploit these results, particularly .
- The ongoing effort to improve astronomical determinations continues. As we have discussed here and elsewhere [], reaching the ambitious goal of would open a new window on new physics generally and in particular, approaching a precision near that of the present experimental discrepancy.
As these new measurements come in, they will help deepen the links between nuclear physics, particle physics, and early Universe cosmology.
Author Contributions
All work presented was a collaborative effort of T.-H.Y., K.A.O. and B.D.F. All authors have read and agreed to the published version of the manuscript.
Funding
TRIUMF receives federal funding via a contribution agreement with the National Research Council of Canada. The work of K.A.O. is supported in part by DOE grant DE-SC0011842 at the University of Minnesota.
Data Availability Statement
There is no new data to be made available.
Acknowledgments
We are grateful for illuminating discussions with Chen-Yu Liu regarding neutron lifetime measurements. TRIUMF receives federal funding via a contribution agreement with the National Research Council of Canada. The work of K.A.O. is supported in part by DOE grant DE-SC0011842 at the University of Minnesota.
Conflicts of Interest
The authors declare no conflict of interest.
Notes
| 1 | The arrows at the top of the figure correspond to typical baryon densities taken from mass-to-light ratios typical of the solar neighborhood, the central parts of galaxies, hot gas, and binaries and small groups of galaxies (BSG). At the time, it was not clear what object was truly representative of the cosmological average. |
| 2 | For more information about the construction and use of ideograms, see any issue of the Review of Particle Properties or the Review of Particle Physics. |
| 3 | In fact, we assume CDM, so that in addition to these Standard Model particles and interactions, there is (1) a nonzero cosmological constant which will be negligible during BBN, and (2) cold dark matter which we take to be so weakly interacting as to have no effect on BBN. These assumptions can be relaxed; see reviews in refs. [,,]. |
| 4 | Including the in-beam measurement would further increase the dispersion requiring a scale factor of 2.2. |
References
- Walker, T.P.; Steigman, G.; Schramm, D.N.; Olive, K.A.; Kang, H.S. Primordial nucleosynthesis redux. Astrophys. J. 1991, 376, 51–69. [Google Scholar] [CrossRef]
- Olive, K.A.; Steigman, G.; Walker, T.P. Primordial nucleosynthesis: Theory and observations. Phys. Rept. 2000, 333, 389–407. [Google Scholar] [CrossRef]
- Fields, B.D.; Olive, K.A. Big bang nucleosynthesis. Nucl. Phys. 2006, 777, 208–225. [Google Scholar] [CrossRef]
- Fields, B.D.; Molaro, P.; Sarkar, S. Big-Bang Nucleosynthesis. Chin. Phys. C 2014, 38, 339–344. [Google Scholar] [CrossRef]
- Steigman, G. Primordial Nucleosynthesis in the Precision Cosmology Era. Ann. Rev. Nucl. Part. Sci. 2007, 57, 463–491. [Google Scholar] [CrossRef]
- Iocco, F.; Mangano, G.; Miele, G.; Pisanti, O.; Serpico, P.D. Primordial Nucleosynthesis: From precision cosmology to fundamental physics. Phys. Rep. 2009, 472, 1–76. [Google Scholar] [CrossRef]
- Pitrou, C.; Coc, A.; Uzan, J.P.; Vangioni, E. Precision big bang nucleosynthesis with improved Helium-4 predictions. Phys. Rep. 2018, 754, 1–66. [Google Scholar] [CrossRef]
- Cyburt, R.H.; Fields, B.D.; Olive, K.A.; Yeh, T.-H. Big Bang Nucleosynthesis: 2015. Rev. Mod. Phys. 2016, 88, 015004. [Google Scholar] [CrossRef]
- Fields, B.D.; Olive, K.A.; Yeh, T.H.; Young, C. Big-Bang Nucleosynthesis after Planck. J. Cosmol. Astropart. Phys. 2020, 3, 010. [Google Scholar] [CrossRef]
- Particle Data Group; Workman, R.L.; Burkert, V.D.; Crede, V.; Klempt, E.; Thoma, U.; Tiator, L.; Agashe, K.; Aielli, G.; Allanach, B.C.; et al. Review of Particle Physics. Prog. Theor. Exp. Phys. 2022, 2022, 083C01. [Google Scholar]
- Aghanim, N.; Akrami, Y.; Ashdown, M.; Aumont, J.; Baccigalupi, C.; Ballardini, M.; Barreiro, R.B.; Bartolo, N.; Basak, S.; Battye, R. Planck 2018 results. VI. Cosmological parameters. Astron. Astrophys. 2020, 641, A6. [Google Scholar]
- Janot, P.; Jadach, S. Improved Bhabha cross section at LEP and the number of light neutrino species. Phys. Lett. B 2020, 803, 135319. [Google Scholar] [CrossRef]
- Olive, K.A.; Schramm, D.N.; Steigman, G.; Turner, M.S.; Yang, J.M. Big Bang Nucleosynthesis as a Probe of Cosmology and Particle Physics. Astrophys. J. 1981, 246, 557. [Google Scholar] [CrossRef]
- Yang, J.M.; Turner, M.S.; Steigman, G.; Schramm, D.N.; Olive, K.A. Primordial Nucleosynthesis: A Critical Comparison of Theory and Observation. Astrophys. J. 1984, 281, 493–511. [Google Scholar] [CrossRef]
- Ellis, J.R.; Olive, K.A. Constraints on Light Particles From Stellar Evolution. Nucl. Phys. B 1983, 223, 252–268. [Google Scholar] [CrossRef]
- Christensen, C.J.; Nielsen, A.; Bahnsen, A.; Brown, W.K.; Rustad, B.M. Free-Neutron Beta-Decay Half-Life. Phys. Rev. D 1972, 5, 1628–1640. [Google Scholar] [CrossRef]
- Bondarenko, L.N.; Kurguzov, V.V.; Prokofev, Y.A.; Rogov, E.V.; Spivak, P.E. Measurement of the Neutron Half Time. Pisma Zh. Eksp. Teor. Fiz. 1978, 28, 328–333. [Google Scholar]
- Byrne, J.; Morse, J.; Smith, K.F.; Shaikh, F.; Green, K.; Greene, G.L. A New Measurement of the Neutron Lifetime. Phys. Lett. B 1980, 92, 274–278. [Google Scholar] [CrossRef]
- Yeh, T.H.; Shelton, J.; Olive, K.A.; Fields, B.D. Probing physics beyond the standard model: Limits from BBN and the CMB independently and combined. J. Cosmol. Astropart. Phys. 2022, 10, 046. [Google Scholar] [CrossRef]
- Baltrusaitis, R.M.; Becker, J.; Blaylock, G.; Brown, J.S.; Bunnell, K.; Burnett, T.; Cassell, R.; Coffman, D.; Cook, V.; Coward, D.H.; et al. [Particle Data Group]. Decays of the J/ψ into Two Pseudoscalar Mesons. Phys. Lett. B 1982, 111, 1–294. [Google Scholar]
- Kosvintsev, Y.Y.; Kushnir, Y.A.; Morozov, V.I.; Terekhov, G.I. Application of Ultracold Neutrons for Neutron Lifetime Measurement. JETP Lett. 1980, 31, 236. (In Russian) [Google Scholar]
- Wilkinson, D.H. The neutron lifetime. Prog. Part. Nucl. Phys. 1981, 6, 325–332. [Google Scholar] [CrossRef]
- Tanabashi, M.; Hagiwara, K.; Hikasa, K.; Nakamura, K.; Sumino, Y.; Takahashi, F.; Tanaka, J.; Agashe, K.; Aielli, G.; Amsler, C.; et al. Review of Particle Properties. Particle Data Group. Rev. Mod. Phys. 1984, 56, S1–S304. [Google Scholar]
- Mampe, W.; Ageron, P.; Bates, C.; Pendlebury, J.M.; Steyerl, A. Neutron Lifetime Measured With Stored Ultracold Neutrons. Phys. Rev. Lett. 1989, 63, 593–596. [Google Scholar] [CrossRef]
- Olive, K.A.; Schramm, D.N.; Steigman, G.; Walker, T.P. Big Bang Nucleosynthesis Revisited. Phys. Lett. B 1990, 236, 454–460. [Google Scholar] [CrossRef]
- Yeh, T.H.; Olive, K.A.; Fields, B.D. The impact of new d(p,γ)3 rates on Big Bang Nucleosynthesis. J. Cosmol. Astropart. Phys. 2021, 3, 046. [Google Scholar] [CrossRef]
- Hagiwara, K. Review of Particle Physics. Phys. Rev. D 2002, 66, 010001. [Google Scholar] [CrossRef]
- Arzumanov, S.; Bondarenko, L.; Chernavsky, S.; Fomin, A.; Morozov, V.; Panin, Y.; Drexel, W.; Schreckenbach, K.; Geltenbort, P.; Pendlebury, J. Neutron life time value measured by storing ultracold neutrons with detection of inelastically scattered neutrons. Phys. Lett. B 2000, 483, 15–22. [Google Scholar] [CrossRef]
- Cyburt, R.H.; Fields, B.D.; Olive, K.A. The NACRE Thermonuclear Reaction Compilation and Big Bang Nucleosynthesis. New Astron. 1996, 6, 215. [Google Scholar] [CrossRef]
- Spergel, D.N.; Verde, L.; Peiris, H.V.; Komatsu, E.; Nolta, M.R.; Bennett, C.L.; Halpern, M.; Hinshaw, G.; Jarosik, N.; Kogut, A.; et al. First year Wilkinson Microwave Anisotropy Probe (WMAP) observations: Determination of cosmological parameters. Astrophys. J. Suppl. 2003, 148, 175–194. [Google Scholar] [CrossRef]
- Cyburt, R.H.; Fields, B.D.; Olive, K.A. Primordial nucleosynthesis with CMB inputs: Probing the early universe and light element astrophysics. Astropart. Phys. 2002, 17, 87–100. [Google Scholar] [CrossRef]
- Serebrov, A.; Varlamov, V.; Kharitonov, A.; Fomin, A.; Pokotilovski, Y.; Geltenbort, P.; Butterworth, J.; Krasnoschekova, I.; Lasakov, M.; Tal’daev, R.; et al. Measurement of the neutron lifetime using a gravitational trap and a low-temperature Fomblin coating. Phys. Lett. B 2005, 605, 72–78. [Google Scholar] [CrossRef]
- Mathews, G.J.; Kajino, T.; Shima, T. Big Bang nucleosynthesis with a new neutron lifetime. Phys. Rev. D 2005, 71, 021302. [Google Scholar] [CrossRef]
- Beringer, J.; Arguin, J.F.; Barnett, R.M.; Copic, K.; Dahl, O.; Groom, D.E.; Lin, C.J.; Lys, J.; Murayama, H.; Wohl, C.G.; et al. [Particle Data Group]. Review of Particle Physics (RPP). Phys. Rev. D 2012, 86, 010001. [Google Scholar] [CrossRef]
- Wietfeldt, F.E.; Greene, G.L. Colloquium: The neutron lifetime. Rev. Mod. Phys. 2011, 83, 1173–1192. [Google Scholar] [CrossRef]
- Pichlmaier, A.; Varlamov, V.; Schreckenbach, K.; Geltenbort, P. Neutron lifetime measurement with the UCN trap-in-trap MAMBO II. Phys. Lett. B 2010, 693, 221–226. [Google Scholar] [CrossRef]
- Steyerl, A.; Pendlebury, J.M.; Kaufman, C.; Malik, S.S.; Desai, A.M. Quasielastic scattering in the interaction of ultracold neutrons with a liquid wall and application in a reanalysis of the Mambo I neutron-lifetime experiment. Phys. Rev. C 2012, 85, 065503. [Google Scholar] [CrossRef]
- Arzumanov, S.; Bondarenko, L.; Chernyavsky, S.; Geltenbort, P.; Morozov, V.; Nesvizhevsky, V.V.; Panin, Y.; Strepetov, A. A measurement of the neutron lifetime using the method of storage of ultracold neutrons and detection of inelastically up-scattered neutrons. Phys. Lett. B 2015, 745, 79–89. [Google Scholar] [CrossRef]
- Serebrov, A.P.; Kolomensky, E.A.; Fomin, A.K.; Krasnoshchekova, I.A.; Vassiljev, A.V.; Prudnikov, D.M.; Shoka, I.V.; Chechkin, A.V.; Chaikovskiy, M.E.; Varlamov, V.E.; et al. Neutron lifetime measurements with a large gravitational trap for ultracold neutrons. Phys. Rev. C 2018, 97, 055503. [Google Scholar] [CrossRef]
- Pattie, R.W., Jr.; Callahan, N.B.; Cude-Woods, C.; Adamek, E.R.; Broussard, L.J.; Clayton, S.M.; Currie, S.A.; Dees, E.B.; Ding, X.; Engel, E.M.; et al. Measurement of the neutron lifetime using a magneto-gravitational trap and in situ detection. Science 2018, 360, 627–632. [Google Scholar] [CrossRef]
- Ezhov, V.F.; Andreev, A.Z.; Ban, G.; Bazarov, B.A.; Geltenbort, P.; Glushkov, A.G.; Knyazkov, V.A.; Kovrizhnykh, N.A.; Krygin, G.B.; Naviliat-Cuncic, O.; et al. Measurement of the neutron lifetime with ultra-cold neutrons stored in a magneto-gravitational trap. JETP Lett. 2018, 107, 671–675. [Google Scholar] [CrossRef]
- Gonzalez, F.M.; Fries, E.M.; Cude-Woods, C.; Bailey, T.; Blatnik, M.; Broussard, L.J.; Callahan, N.B.; Choi, J.H.; Clayton, S.M.; Currie, S.A.; et al. Improved neutron lifetime measurement with UCNτ. Phys. Rev. Lett. 2021, 127, 162501. [Google Scholar] [CrossRef] [PubMed]
- Yue, A.T.; Dewey, M.S.; Gilliam, D.M.; Greene, G.L.; Laptev, A.B.; Nico, J.S.; Snow, W.M.; Wietfeldt, F.E. Improved Determination of the Neutron Lifetime. Phys. Rev. Lett. 2013, 111, 222501. [Google Scholar] [CrossRef] [PubMed]
- Czarnecki, A.; Marciano, W.J.; Sirlin, A. Neutron Lifetime and Axial Coupling Connection. Phys. Rev. Lett. 2018, 120, 202002. [Google Scholar] [CrossRef] [PubMed]
- Pospelov, M.; Pradler, J. Big Bang Nucleosynthesis as a Probe of New Physics. Ann. Rev. Nucl. Part. Sci. 2010, 60, 539–568. [Google Scholar] [CrossRef]
- Jedamzik, K.; Pospelov, M. Big Bang Nucleosynthesis and Particle Dark Matter. New J. Phys. 2009, 11, 105028. [Google Scholar] [CrossRef]
- Malaney, R.A.; Mathews, G.J. Probing the early universe: A Review of primordial nucleosynthesis beyond the standard Big Bang. Phys. Rept. 1993, 229, 145–219. [Google Scholar] [CrossRef]
- Bernstein, J.; Brown, L.S.; Feinberg, G. Cosmological Helium Production Simplified. Rev. Mod. Phys. 1989, 61, 25. [Google Scholar] [CrossRef]
- Mukhanov, V.F. Nucleosynthesis without a computer. Int. J. Theor. Phys. 2004, 43, 669. [Google Scholar] [CrossRef]
- Froustey, J.; Pitrou, C. Incomplete neutrino decoupling effect on big bang nucleosynthesis. Phys. Rev. D 2020, 101, 043524. [Google Scholar] [CrossRef]
- Aver, E.; Berg, D.A.; Olive, K.A.; Pogge, R.W.; Salzer, J.J.; Skillman, E.D. Improving helium abundance determinations with Leo P as a case study. J. Cosmol. Astropart. Phys. 2021, 3, 027. [Google Scholar] [CrossRef]
- Aver, E.; Berg, D.A.; Hirschauer, A.S.; Olive, K.A.; Pogge, R.W.; Rogers, N.S.J.; Salzer, J.J.; Skillman, E.D. A comprehensive chemical abundance analysis of the extremely metal poor Leoncino Dwarf galaxy (AGC 198691). Mon. Not. R. Astron. Soc. 2021, 510, 373–382. [Google Scholar] [CrossRef]
- Pettini, M.; Cooke, R. A new, precise measurement of the primordial abundance of Deuterium. Mon. Not. R. Astron. Soc. 2012, 425, 2477–2486. [Google Scholar] [CrossRef]
- Cooke, R.; Pettini, M.; Jorgenson, R.A.; Murphy, M.T.; Steidel, C.C. Precision measures of the primordial abundance of deuterium. Astrophys. J. 2014, 781, 31. [Google Scholar] [CrossRef]
- Riemer-Sørensen, S.; Webb, J.K.; Crighton, N.; Dumont, V.; Ali, K.; Kotuš, S.; Bainbridge, M.; Murphy, M.T.; Carswell, R. A robust deuterium abundance; Re-measurement of the z = 3.256 absorption system towards the quasar PKS1937-1009. Mon. Not. R. Astron. Soc. 2015, 447, 2925–2936. [Google Scholar] [CrossRef]
- Balashev, S.A.; Zavarygin, E.O.; Ivanchik, A.V.; Telikova, K.N.; Varshalovich, D.A. The primordial deuterium abundance: SubDLA system at zabs = 2.437 towards the QSO J 1444+2919. Mon. Not. R. Astron. Soc. 2016, 458, 2188–2198. [Google Scholar] [CrossRef]
- Cooke, R.J.; Pettini, M.; Nollett, K.M.; Jorgenson, R. The primordial deuterium abundance of the most metal-poor damped Lyα system. Astrophys. J. 2016, 830, 148. [Google Scholar] [CrossRef]
- Riemer-Sørensen, S.; Kotuš, S.; Webb, J.K.; Ali, K.; Dumont, V.; Murphy, M.T.; Carswell, R.F. A precise deuterium abundance: Remeasurement of the z = 3.572 absorption system towards the quasar PKS1937?101. Mon. Not. R. Astron. Soc. 2017, 468, 3239–3250. [Google Scholar] [CrossRef]
- Zavarygin, E.O.; Webb, J.K.; Dumont, V.; Riemer-Sørensen, S. The primordial deuterium abundance at zabs = 2.504 from a high signal-to-noise spectrum of Q1009 + 2956. Mon. Not. R. Astron. Soc. 2018, 477, 5536–5553. [Google Scholar] [CrossRef]
- Cooke, R.J.; Pettini, M.; Steidel, C.C. One Percent Determination of the Primordial Deuterium Abundance. Astrophys. J. 2018, 855, 102. [Google Scholar] [CrossRef]
- Cyburt, R.H.; Fields, B.D.; Olive, K.A. An Update on the big bang nucleosynthesis prediction for Li-7: The problem worsens. J. Cosmol. Astropart. Phys. 2008, 11, 012. [Google Scholar] [CrossRef]
- Fields, B.D.; Olive, K.A. Implications of the non-observation of 6Li in halo stars for the primordial 7Li problem. J. Cosmol. Astropart. Phys. 2022, 10, 078. [Google Scholar] [CrossRef]
- Ryan, S.G.; Beers, T.C.; Olive, K.A.; Fields, B.D.; Norris, J.E. Primordial Lithium and Big Bang Nucleosynthesis. Astrophys. J. 2000, 530, L57. [Google Scholar] [CrossRef]
- Sbordone, L.; Bonifacio, P.; Caffau, E.; Ludwig, H.-G.; Behara, N.T.; Hernandez, J.I.G.; Steffen, M.; Cayrel, R.; Freytag, B.; Van’t Veer, C. et al. The metal-poor end of the Spite plateau. 1: Stellar parameters, metallicities and lithium abundances. Astron. Astrophys. 2010, 522, A26. [Google Scholar] [CrossRef]
- Salvati, L.; Pagano, L.; Consiglio, R.; Melchiorri, A. Cosmological constraints on the neutron lifetime. J. Cosmol. Astropart. Phys. 2016, 3, 055. [Google Scholar] [CrossRef]
- Abazajian, K.N.; Adshead, P.; Ahmed, Z.; Allen, S.W.; Alonso, D.; Arnold, K.S.; Baccigalupi, C.; Bartlett, J.G.; Battaglia, N.; Benson, B.A.; et al. CMB-S4 Science Book, First Edition. arXiv 2016, arXiv:1610.02743. [Google Scholar]
- Wilson, J.T.; Lawrence, D.J.; Peplowski, P.N.; Eke, V.R.; Kegerreis, J.A. Measurement of the free neutron lifetime using the neutron spectrometer on NASA’s Lunar Prospector mission. Phys. Rev. C 2021, 104, 045501. [Google Scholar] [CrossRef]
- Wietfeldt, F.E.; Biswas, R.; Caylor, J.; Crawford, B.; Dewey, M.S.; Fomin, N.; Greene, G.L.; Haddock, C.C.; Hoogerheide, S.F.; Mumm, H.P.; et al. Comments on Systematic Effects in the NIST Beam Neutron Lifetime Experiment. arXiv 2022, arXiv:2209.15049. [Google Scholar]
Disclaimer/Publisher’s Note: The statements, opinions and data contained in all publications are solely those of the individual author(s) and contributor(s) and not of MDPI and/or the editor(s). MDPI and/or the editor(s) disclaim responsibility for any injury to people or property resulting from any ideas, methods, instructions or products referred to in the content. |
© 2023 by the authors. Licensee MDPI, Basel, Switzerland. This article is an open access article distributed under the terms and conditions of the Creative Commons Attribution (CC BY) license (https://creativecommons.org/licenses/by/4.0/).