
Laser-Induced Breakdown Spectroscopy in Biological Samples: A Review of Experiments with Soft Tissues


1
Facultad de Farmacia, Universidad CEU San Pablo, Urbanización Montepríncipe, Boadilla del Monte, E-28668 Madrid, Spain
2
Escuela Politécnica Superior, Universidad CEU San Pablo, Urbanización Montepríncipe, Boadilla del Monte, E-28668 Madrid, Spain
3
Radiation Oncology, Hospital Universitario Puerta de Hierro, Majadahonda, E-28222 Madrid, Spain
4
Facultad de Medicina, Universidad CEU San Pablo, Urbanización Montepríncipe, Boadilla del Monte, E-28668 Madrid, Spain
*
Author to whom correspondence should be addressed.
Atoms 2024, 12(4), 21; https://doi.org/10.3390/atoms12040021
Submission received: 30 December 2023
/
Revised: 27 February 2024
/
Accepted: 27 March 2024
/
Published: 1 April 2024
Abstract
:This article reviews the advances made during the past two decades in the application of Laser-Induced Breakdown Spectroscopy (LIBS) to biological samples, specifically soft tissues (both animal and human). The first sections include a historical overview and a summary of the biomedical relevance of analyzing metals in these tissues. Next, statistical methods employed in some works are presented, along with a detailed description of the innovations developed in experimental systems. The remainder of the review reports the approaches used in the experiments, focusing on a description of the advances that have enabled the successful application of LIBS to soft tissues. The results are evaluated, and the major challenges remaining for this type of sample are discussed. The aim of this review is to provide useful information that encourages future research on LIBS for biological samples.
1. Introduction
Since the discovery of lasers in the 1960s, the interaction of laser light with matter has been a field of intense research. Early works [1] characterized the laser-induced plasma (LIP) created when a beam is focused onto a sample. In the following years, several applications appeared and the spectroscopic study of the optical emission from plasma was called LIBS (Laser-Induced Breakdown Spectroscopy). Its distinguishing features, such as no sample preparation, high sensitivity, real-time analytical procedure, and standoff capabilities, made it very popular. Since then, although LIBS analytical applications are feasible for solids, liquids, and gases, it has been in solid materials where the technique has mostly been employed, providing a large body of knowledge in many fields (some of them can be observed in [2]). In the 2000s, the advances in instrumentation allowed for the development of high-resolution spectrometers and intensified charge-coupled device (CCD) detectors with temporal resolution and powerful laser sources. These technological accomplishments made possible the determination of concentrations at the part-per-million level and spatial resolution in rapid analysis (100 μm), which allowed the LIBS technique to be successfully applied to biological samples [3]. Although other techniques have been employed as tools for the multi-elemental analysis of samples, such as LA-ICP-OES, LA-ICP-MS, and μXRF, the ability of LIBS to detect any type of sample without preparation and to work remotely and in real-time means that this technique is more versatile and more easily adaptable to the limitations of biomedical samples than others. These latter experiments involved the laser ablation of soft tissues, which is challenging from a technical point of view. The identification and quantification of elements present in these samples have an intrinsic complexity due to the difficulties in controlling ablation efficiency and surface damage. Pioneering works dealt with animal tissues [4,5]. A few years later, human samples were employed to obtain biomedical implications [6,7]. The heterogeneous nature of these samples required spatially resolved analysis to obtain the distribution of the particles of interest, as can be seen in [8]. Moreover, the specificity of histopathology samples requires analytical techniques to become sufficiently versatile to be applied in conventional procedures, and Moncayo et al. achieved this by LIBS in 2017 [9].
Improvements in spatial resolution were obtained by advances in optical configurations and sample preparation. The accomplishment of 10 μm of resolution (cellular level) allowed the LIBS mapping of surfaces to enable multi-elemental imaging of biological tissues. For pioneering works see [10], which paved the way for the development of LIBS medical imaging techniques for medical purposes. This technical advance, together with others, like an increase in the acquisition rate (kHz frequency) and continuous focusing during mapping, allowed for 3D imaging of particles of interest in an entire organ or its evolution in time [11], which has implications for diagnostic purposes. Particularly important is the evolution of particles created for theranostic purposes, which improves radiosensitization in tissues. Such LIBS experiments with Gd-based nanoparticles were successfully performed by Gimenez et al. in 2016 [12].
The huge amount of data recorded in former experiments made necessary not only the technological advances already cited but also new methods for data processing. The complexity of the spectra in multi-elemental samples, where spectral intensities must be analyzed to produce the LIBS imaging, requires computerized statistical methods and advanced algorithms to be performed.
Despite the technological and methodological advances, some aspects of the LIBS technique remain unclear. Theoretically, the formation and evolution of plasma in its early stages have not been completely described. Experimentally, the matrix effects of some samples and the self-absorption of plasma may produce systematic errors [13] if these aspects are not taken into consideration.
It can be stated that during the past two decades, LIBS applied to biology has been properly established, with this technique being utilized across various disciplines for several applications. The outcomes have progressively improved, achieving consistency in methodology. This has been documented in the reviews that have recently compiled the achieved advancements. In 2012, Ref. [14] conducted a comprehensive review of LIBS applications in biology, with a focus on trace elemental mapping in such samples. In [15,16], progress in LIBS-based imaging was the focus. Moreover, in 2019, Ref. [17] provided an overview of the results and methods that had been employed in disciplines related to human and animal health. In 2021, Ref. [18] highlighted the issue of elemental mapping, and Ref. [19] in 2023 focused on plants. We suggest these reviews for readers interested in these topics.
In this work, our purpose was to review recent advances in LIBS applied to biological samples (animal and human soft tissues) during the last 20 years, particularly related to experimental details. Instead of the typical chronological compilation of results in most of the published reviews, we tried to classify the advances by specialized areas and report advances in methodologies, experimental arrangements, etc., along with works on these areas to avoid confusion arising from attempts to generalize results and methods from other areas.
The objective is to provide useful information to be used as a tool for the development of future research in this field, where researchers from other disciplines (medicine, biology, veterinary, etc.) are collaborating in the progress of this technique.
2. Metal Concentration in Soft Tissues
The investigation of the analytical composition of human soft tissues allows for the identification of a high number of malignancies. Thus, various analytical techniques have been employed for diagnostic purposes, such as LA-ICP-MS, SEM, ELISA, etc. The following provides a short overview of the importance of detecting specific elements in medical diagnostics, with the objective of providing valuable insights for LIBS studies involving biological samples.
In the context of cancer, it is well established that a fundamental characteristic of cancer cells is their ability for sustained and chronic proliferation. The extensive documentation of genome maintenance and repair defects in human tumors, coupled with the widespread destabilization of gene copies and nucleotide sequences, results in the intrinsic genome instability observed in most human cancer cells [20]. Consequently, liquid biopsy is a laboratory test conducted on a sample of blood, urine, or other body fluid to detect cancer cells originating from a tumor or small fragments of DNA, RNA, or other molecules released by tumor cells into human body fluids. Given that phosphorus atoms and nucleotides are stoichiometric in the nucleic acid skeleton, their concentration may be used as an abnormal growth indicator for this type of test.
The Ca/Mg ratio increases or decreases corresponding to cell proliferation or apoptosis, respectively. Notably, among various metals, concentrations of calcium (Ca) and magnesium (Mg) are markedly elevated in malignant prostate tumors compared to benign prostate tumors. Moreover, intranuclear Ca levels have shown an increase with aging, suggesting potential pathological significance in prostate growth disorders. It is noteworthy that a high dietary intake of calcium is positively correlated with an increased risk of prostate cancer.
Magnesium (Mg) plays a crucial role in numerous biological processes, for example, in the synthesis of organic molecules, cell proliferation, glucose homeostasis, etc. Inadequate magnesium intake or low serum magnesium concentrations have been related to various diseases and health conditions, including diabetes mellitus, breast cancer, and colorectal cancer. Furthermore, a higher ratio of serum calcium to magnesium has been associated with aggressive clinicopathological characteristics in patients undergoing radical prostatectomy [21] and seen in vitro [22]. It has been hypothesized that alterations in this ratio could lead to the increased development of new and recurrent breast cancer [23].
Disruptions in zinc (Zn) and copper (Cu) homeostasis can be seen in several malignancies and in head and neck cancer. For example, hepatic copper content exceeding 250 μg/g of dry weight serves as clear evidence of Wilson’s disease. Imbalance in this homeostasis is observed as an elevation or decrease in copper and zinc ions in serum or tissue levels, but, in head and neck cancer, these deviations stand out from those of other malignancies. Consequently, the concentrations of Zn and Cu ions become promising targets for further research into the development and progression of head and neck cancer [24].
Additionally, deviations in the concentration distribution of copper, zinc, and iron (Fe) resulting from brain metal homeostasis have been linked to neurodegenerative disorders, including Parkinson’s, Alzheimer’s, and Huntington’s disease [25].
Regarding the tin (Sn) element, measurements of its concentration are important given that organotin compounds (tin atoms attached to organic groups) have toxic effects even in low doses and have been identified in human blood and liver samples [26]. These components, found in plastics, antifoam in paints, wood preservatives, and pesticides, have the potential to contaminate food.
Similarly, aluminum (Al) atoms are implicated in allergy-related adverse events and toxicological effects, which are thought to be produced by contamination from Al salts employed in vaccines [27].
In summary, deviations from normal metal concentrations in tissues may serve as potential indicators of diseases in their early stages.
Thus, data about these abundances in human tissues are highly required. Some valuable information has already been compiled. Copper is notably abundant in the liver, brain, and bones, and to a lesser extent in the kidney, heart, and pancreas. The estimated total copper content in the human body is approximately 12 mg for a newborn infant and from 50 to 120 mg for an adult. In Table 1, typical values for Cu, Zn, and Fe in various tissues are provided [28].
Similarly, values of Cu and Fe content in patients with hepatitis C are also reported in [29].
Metals have not only been employed as diagnostics but also as therapeutic agents, with platinum (Pt) being a prominent example, given that Pt derivatives are widely employed as anticancer drugs. Although the mechanism of action of cisplatin is not fully understood, it inhibits DNA synthesis by generating cross-links within and between DNA strands. Protein and RNA synthesis are inhibited to a lesser extent. Cisplatin also exhibits immunosuppressive, radiosensitizing, and antibacterial properties.
Similarly, metals have been employed to enhance radiosensitization, representing an effective approach for increasing local tumor control while limiting the toxicity associated with radiotherapies. Nanoparticles containing high-Z elements (such as gadolinium, hafnium, gold, and silver) are recognized as radiosensitizers due to their interaction with X-rays through various mechanisms. These include the production of Photoelectric, Compton, and Auger electrons, thus generating additional secondary electrons. The localized energy release in proximity to high-Z atoms leads to an intensified killing effect of X-rays on cells. Such studies have been performed not only in vitro but also in vivo, as can be seen in [30]. Therefore, obtaining LIBS-based imaging of the nanoparticles used together with tagging techniques provides elements to be used as teragnostic agents [31,32].
3. Experimental Systems
Over the last 20 years, many technological advances have occurred. There has been a huge improvement in laser and optoelectronic devices, which are fundamental in LIBS experimental systems. Nonetheless, there is an intrinsic complexity when ablating soft material, mainly due to the diverse consequences in both surface damage and ablation efficiency.
Advances in the experimental systems used to analyze animal and human soft tissues will be reviewed in detail. For simplicity, the section has been divided into three sub-sections: instrumental configurations, samples, and calibration issues.
3.1. Instrumental Configuration
The typical setup in any LIBS experiment consists of five elements (Figure 1): laser source, focusing and light collection (lenses, mirrors, fiber optics), spectrometer, light detection, and computer (data analysis).
Moreover, the inhomogeneity characteristics of the samples make it necessary to average the measurements, typically a range of 10–20 individual measurements, and change the location of the plasma in the sample. For this, LIBS systems usually move the sample, instead of the laser beam, because a fixed plasma plume provides better repeatability. Commercial X-Y-Z translators are usually employed and sometimes the sample is rotated. Here, taking into consideration the perishable nature of some soft tissues, the use of thermostable sample holders is recommended. Such holders are common in microscopy and are commercially available [18]. A few authors have used vacuum or inert atmospheres to improve signal intensity or as lens protection. For example, Refs. [11,36] employed Ar in a very simple setup and Ref. [6] made measurements in a vacuum.
The typical parameters that have been employed in the instrumental configurations for soft tissues in LIBS experiments are introduced below; although, depending on the originality of each experiment, several values might have been optimized before measurements were performed. Recently, Ref. [37] dealt with this topic, adjusting several experimental parameters, which were collectively correlated. This means that the optimization of sample preparation, laser pulse energy, focusing, and detection delay needed to be performed in each individual experiment. Fortunately, the authors found a robust methodology by an iterative process that could be easily followed for the samples used in histopathological analysis.
Next, the influence of the experimental parameters is shown individually for several configurations.
3.1.1. Laser Source
The majority of lasers employed in LIBS experiments, due to their excellent performances in power and repeatability, are the Q-switched Nd:YAG systems with nanosecond pulses at their fundamental wavelength of 1064 nm. In some experiments, frequency doubler crystals have been employed to generate the second and third harmonic to use 532 nm or 266 nm wavelengths [4,11]. Also with Nd:YAG lasers, the use of femtosecond pulses has increased considerably during the last ten years due to the higher frequencies required in this type of application, although this implies lower sensitivity due to their minor heating and ablated volume compared to nanosecond pulses [18].
In addition, sometimes, other laser systems have been successfully employed. For example, Ref. [38] used a Ti-Sapphire fs-laser system (775 nm wavelength) and Ref. [39] used the Ar-F excimer laser (193 nm wavelength). Here, it is worth highlighting that light absorption coefficients for biological tissues have lower values in the near-infrared than in the ultraviolet region. Therefore, better ablation efficiency is obtained with infrared lasers, as can be appreciated in Figure 2.
In this kind of experiment, the energy per pulse is a critical parameter, not only regarding the plasma emissivity but also the sample damage. Few laser systems have the ability to modify the energy per pulse generated; therefore, this is usually changed by external devices (a combination of a polarizer and a half-wave plate). Many authors reported good performance in soft tissues for Nd-YAG systems, with energy/pulse in the range of 2–20 mJ (see, for example, [10]). On the other hand, Refs. [6,7,40,41] employed energies as high as 80–160 mJ/pulse. In the case of other types of lasers, Ref. [39] employed a 38 mJ/pulse with an excimer laser and Ref. [38] used a 1.6 mJ/pulse with a Ti-Sapphire laser. In the case of imaging applications, lower energy is required to obtain good spatial resolution. For example, values of 120 μJ/pulse and 500 μJ/pulse were reported by [12,42], respectively.
3.1.2. Focusing and Light Collection
A laser beam is usually guided by prisms focused by convex lenses to create plasma. In general, the appropriate convergence of the ray is a paramount parameter for plasma emissivity and spatial resolution. Here, it is important to recall that most analytical LIBS measurements are focused slightly below the surface of the sample to improve the plasma emission [43]. In the particular case of imaging applications, the focus is even more important. Thus, in [42], an optical microscope was modified to achieve better focusing, as can be seen in Figure 3.
To improve the spatial resolution, a higher numerical aperture has been used (for example, 10 μm resolution in [11] with 15× objective magnification). However, sensitivity was lower and the parameters for the best signal-to-noise ratio needed to be optimized before performing the experiment. Moreover, this group employed triangular focusing to keep a constant value of the distance lens to the sample, despite the irregularities of the surface (Figure 4). This system consisted of a laser pointer and a monitoring camera mapping the sample, which allowed for continuous autofocusing action. The light emitted by the plasma was collected to be guided to the spectrometer. Sometimes, two convex lenses in a 4f optical arrangement, that were known to have no magnification, were employed [8]. This is useful to know if partial regions or all the volume of the plasma was collected.
3.1.3. Spectrometer
The collected light from the plasma is dispersed by spectrometers. This is a wide field of research and, here, only applications to biological samples will be dealt with. For this, Czerny–Turner and Echelle spectrometers have been widely employed. The former allows higher sensitivity but less wavelength range than the latter. Here, the multi-elemental nature of the biological samples should be considered because, depending on the spectral resolution, line interference may occur. The focal length and slit width of the spectrometer and the number of lines/mm in the grating are key parameters to improve resolution. Sometimes, even two or more spectrometers may be used simultaneously (Figure 5) to observe a wider wavelength range, as in [9].
For optimal spectral resolution, light should be imaged on the input slit with the appropriate numerical aperture to achieve complete filling of the diffraction grating. Moreover, spherical and flat mirrors should be used, instead of lenses, due to their lack of aberrations. Also, if a fiber optic were appropriately connected to the spectrometer, the light collection system would be very suitable, due to its fixed aperture and repeatability.
3.1.4. Light Detection and Data Processing
Spectrometers are used together with light detectors to record the data of the spectra. Typical detectors of photons are photomultipliers (best efficiency), diode-arrays, and Intensified Charged Coupled Device (ICCD) detectors. In the case of analysis by LIBS for soft tissues during the last 20 years, ICCD cameras have been the most common devices because of their unique characteristics that allow for the simultaneous recording of the spectra, delay time, and integration time selection. These are key parameters because, as is well known, at the early stages of the plasma evolution, an intense background continuum is emitted that must be avoided.
Authors have reported that spectra taken in air had a good signal-to-noise ratio in the range of 1–5 μs. The recording of data has been addressed by either commercial software (Andor, Labview, Matlab, etc.) or homemade software. Typical tasks are the fitting and measuring of line profiles, subtraction of background, averaging spectra, etc. Discrimination or classification of selected data is often required; thus, programming is needed. In the case of LIBS imaging, spatial variables must be considered, and the huge amount of data requires not only laser systems with higher frequencies (typically kHz) but also processing and extracting information prior to image-making.
3.2. Samples
One of the advantages of the LIBS technique is its applicability to any type of sample, practically without any preparation. When a laser is focused, the particles of the sample always leave the surface with high velocity and high emissivity. However, when quantification of the elements in the sample is needed, some preparation procedures are required. Until the year 2000, LIBS experiments were almost exclusively applied to solid targets (metal alloy analysis, quality control in manufacturing, etc.), and some systematic experimental errors appeared regarding sample handling. One of the most important was the “matrix effects”, in which there were variations provoked between the intensities of the plume plasma and the real concentrations in the sample. Several procedures were described to avoid this effect. An extensive review dealing with sample preparation techniques can be seen in [44].
However, as hardly any experiments were performed with soft tissues until the year 2000, the application of LIBS to them has been challenging with respect to sample preparation. First, to avoid contamination, a number of laser pulses were always used for cleaning, prior to recording the data. In earlier experiments, where only qualitative knowledge was required, there was hardly any preparation of samples. For example, in [39,41], pig tissues were taken by using a scalpel and stored until the recording of data. Kanawade reported that spectra of muscle tissue showed poor reproducibility in comparison to fat, nerve, and skin tissue due to its softer nature. In [5], a scalpel was similarly used to obtain chicken tissues that were stored at −20 °C until the experiment. Then, the samples were placed inside a cooling unit mounted on an X-Y translator. The unit was built from a circulation bath with a hole drilled in the top to allow entry of the laser beam. Likewise, Ref. [6] collected human samples from mastectomy or colostomy specimens and stored them at −80 °C, performing the measurements under a vacuum with the samples cooled to −196 °C by using liquid nitrogen. It is worth highlighting that in these cases, the authors reported the best signal/noise ratio for solidified samples. In [4], samples were employed that had been embedded in paraffin wax after being taken from a dog (hemangiosarcoma and normal liver). Glass slides were selected as substrates, reporting that they were advantageous with respect to aluminum and Teflon because glass transmitted the laser light and also because interferences were present in the case of aluminum and Teflon. Prior to recording the spectra, chicken blood samples, easily available, were used as targets to improve the parameters of the experimental setup. In [42], very simple samples were employed to detect nucleic acids. The solution with these was manually deposited (deposits of approximately 2 mm in diameter) on a 75 μm thick polyimide support (Atlantec Tech.). This type of support did not contain phosphorus and allowed for strong adsorption in a drying oven (50 °C). In 2013, Ref. [45] used samples that were lyophilized, grounded with agate mortar, and compressed into a pellet (10 ton/cm2) to ensure homogeneity. In 2015, Ref. [36] studied the spectra of pelletized samples together with real tissues from excised skin samples of melanoma-implanted mice. The skin samples were fixed, embedded, sliced, and stained with hematoxylin and eosin (H&E). For pelletization, excised melanomas and dermis were dried and pelletized in a mold under 1 ton of pressure for 1 min. The authors reported that only for the pellet sample, an increasing trend in the signal intensity with the number of laser shots was detected, which was explained by the geometry of the crater produced on the surface. In [7], samples from slices of human liver were fixed in formalin with a concentration of 4%, processed in paraffin, mounted on glass slides, and, finally, deparaffinized in xylene. The authors reported that the glass slides had diverse elemental compositions, showing spectra from Ca, Na, K, Sr, Al, Si, Ti, and Ba and, therefore, interference with the sample was problematic. In Figure 6, craters are shown after laser ablation in this type of sample.
In 2012–2013, the work of Motto-Ros et al. [8,10] used samples prepared for scanning an organ with good resolution. To obtain them, mouse kidneys (previously injected with a solution containing Gd nanoparticles) were frozen at −20 °C and then sliced to a thickness of 150 μm. To ensure the best contrast between tissue and substrate, slices were deposited on a pure polyethylene substrate. Finally, the samples were stored at −80 °C until recording of the spectra. The authors reported that these samples allowed for the mapping of a biological organ with a spatial resolution of 100 μm. In Figure 7, a slice used in the experiment is shown. The same group [11] in 2014 used epoxy-embedded samples (typical protocol for electron microscopy experiments) and improved the spatial resolution to 10 μm in mouse kidneys. These samples were obtained by slicing the organ that previously had been frozen to −80 °C. The thickness of the slides was 100 μm and they were placed on a Petri dish and frozen at −80 °C. These samples were hard enough to produce a tiny crater, as can be seen in the figure, where the surface of the sample after scanning by LIBS is shown.
In 2017, Moncayo [9] employed samples used with microscope histopathological examination, which involved standard pathological sample preparation procedures for human biopsies. The procedure was formalin fixation and paraffin embedding (FFPE) and the preparation of hematoxylin and eosin-stained (HES) sections for microscopic optical evaluation. After mapping the surface with LIBS spectra, they reported complete compatibility of LIBS and histopathological images. In the same year, Ref. [40] leveraged samples used for histopathology were kept in 10% neutral buffered formalin immediately after surgery (or biopsy) and cut into slices with dimensions of 5 × 5 × 2 mm3. The samples came from breast, colon, larynx, and tongue cancers from 120 patients.
Liquid samples were employed in 2015 [38]. The authors used the surface of a filter (Milipore) impregnated with blood to analyze the presence of the ovarian cancer biomarker CA125 by LIBS. Previously, homogeneous distribution in the filter was achieved and some procedures were performed to dry the particles.
3.3. Calibration Procedures
The measurement of absolute concentrations using the LIBS technique has encountered challenges since its beginnings, primarily due to the potential presence of matrix effects in the sample and self-absorption in some spectral lines. Historically, these challenges have been overcome by employing methods that obtain the concentration of an element based on other known data. Briefly, once the plasma has been characterized, comparisons of intensities from different elements have been performed, with one of them having a known concentration. Calibration curves (intensity versus concentration) have also been plotted, using reference samples with different concentrations of one or more elements (curve of growth and Csigma curves [13,46], respectively). Calibration-free methods have also been used, where Boltzmann plots have been generated for all of the elements in the sample, imposing the unitary value to the sum of concentrations [47].
However, to date, none of these methods has been applied to soft tissue samples because new difficulties arise with this type of material. Specifically, the sample contains elements in a number and concentration range much higher than in typical samples, and may even present higher heterogeneity. This is why quantitative aspects in soft tissues remain challenging. Therefore, particular strategies have been employed in several experiments. Sometimes, even in the same experiment, several calibrations have been applied. For example, Ref. [40] used the CN bond emissive line at 418.10 nm for breast tissues and the N I emissive line at 746.83 nm for other tissues. Alternatively, Ref. [5] used the spectral line of Ca I at 422.6 nm because it was strong for all the spectra taken. In [6], the spectral line of C I at 247.8 nm was employed due to the acceptance that carbon was not relevant for the malignancy of the tissues, which was the most common procedure to calibrate spectra. In [8], a calibration procedure was presented to quantify the Gd concentration, which was based on using a set of samples prepared from solutions with increasing concentrations of Gd deposited on the substrate. In [48], standard samples were prepared for calibrating measurements of lithium concentration in tissues. To obtain this, they immersed thyroids from untreated subjects into lithium solutions with 0, 0.28, 0.37, 0.55, and 1.10 ppm. In [49], a multivariate calibration strategy was employed by using a model tissue. This was prepared with a set of samples containing Fe, Mg, Zn, Cu, and Mn, with concentrations in the range in which they occur in human body tissues. In any case, these procedures were aimed at particular experiments; thus, new approaches are required for obtaining systematic calibrations in this type of sample.
4. Statistical Methods
Nowadays, the development of higher-frequency lasers and faster detection systems has increased the amount of data to be processed in LIBS experiments. Moreover, the inhomogeneous nature of samples and the employment of LIBS-based imaging result in a huge volume of data to be processed when handling biological samples. Then, statistical methods are required for appropriate data processing and several strategies have been used. A comprehensive review of these methods may be found in [50,51]. However, in this work, only some examples of the most used methods when dealing with soft tissues will be provided. These are summarized in Table 2, where statistical tools are divided into supervised and unsupervised, based on classification with a dependent variable or not, respectively.
Common methods used for classification are based on descriptive statistics (ANOVA, CA, HCA, PCA, SOM, etc.), whilst quantitative relationships are obtained by methods of regression (MLR, LDA, PLSDA, etc.) and prediction methods (NNA).
4.1. Classification
Classification is basically developed by PCA methods. A Principal Component Model is a set of orthogonal axes determined as maximum variance directions (see Figure 8). All objects in a data sample can be represented as a sum of Principal Components multiplied by the corresponding load. The number of these new dimensions is determined to maximize the variance by several criteria.
In Cluster Analysis, data are classified into clusters based on their similarities. Sometimes, both methods are used together in Hierarchical Cluster Analysis (HCA), where groups are obtained according to the value of the variances between the members. This is represented by the dendrogram shown in Figure 9.
Analysis of Variance (ANOVA) is used to determine if there are statistically significant differences between groups. For example, Ref. [6] employed this method to differentiate malignant and non-neoplastic tissues.
Self-Organizing Maps (SOM) is an unsupervised learning method for clustering aimed at reducing the number of variables and depicting them with maps to visualize the data analysis. This method was introduced by Kohonen in 1982 [54] and, since then, very few works have exploited its capabilities for the analysis of LIBS spectra of biological tissues (an example can be seen in [52]). Figure 10 is shown only to emphasize the performance of the method for imaging applications, where LIBS measurements of ancient potsherds were analyzed.
4.2. Quantification
In general, the concentration of samples is predicted after a calibration model is constructed based on previously known data that are related to each other by regression methods. There are many of these procedures, but the most common are Multivariate Linear Regression (MLR), Linear Discriminant Analysis (LDA), and Partial Least Square Discriminant Analysis (PLSDA). Prediction is obtained by the estimation of Y-values for new X-values based on previously known data. For example, Ref. [5] employed PLSDA to identify several tissues.
Neural Network Analysis (NNA) is part of the Machine Learning Algorithms that are built with different layers, like biological neural networks. The model is trained with some data and, after, the algorithm allows prediction with new data. In the end, some parameters check the quality of the prediction (Figure 11). Sometimes this is employed together with SOM.
In [49], the authors trained the ANN with a set of samples prepared as a human tissue model, together with a NIST standard reference sample. As a consequence, concentrations of Cu, Fe, Mn, Mg, and Zn were successfully predicted in human cancer tissue samples.
5. Results
In this section, we review the advances developed in the most relevant applications of LIBS in (animal or human) soft tissues during the last 20 years. During this time, the improvement in technological capabilities and methodologies has allowed LIBS to increase the fields of application. These have been classified into seven fields to simplify the search for new developments. However, several cited works contain advances in more than one of the fields simultaneously, which have been classified with the most original research. Although the area of knowledge is broad, the main emphasis is on research relevant to human tissues.
5.1. Tissue Differentiation
Biological tissues were distinguished by studying LIBS spectra in 2009 [5] by studying samples from chicken brain, lung, spleen, liver, and kidney that were taken in blocks of approximately 5–10 mm3 that were frozen. Afterwards, the spectra of the most intense spectral lines (Table 4) for 16 important elements in the biological samples were recorded. The analysis of the data consisted of using simultaneously three techniques (CA, PLSDA, and NNA) for classifying a large amount of data in each LIBS spectrum for the 200–780 nm spectral range.
In the case of [39], four tissue types were classified (fat, muscle, nerve, and skin) of six ex-vivo pig heads. Tissue samples were taken by using a scalpel, and emission lines of C, H, O, Cl, Na, K, and N were recorded by focusing the laser pulse on them. Statistical analysis methods were required to achieve a successful differentiation of the tissues, although they reported that spectra of muscle tissue showed poorer reproducibility due to its very soft nature.
Even though fat and nerve tissues have very similar compositions, Ref. [41] achieved a spectral differentiation for samples of pigs, as shown in Figure 12. The spectra were recorded within a time frame of 6 h post-mortem. Statistical analysis of ratio values was exploited to differentiate the tissues. Namely, 18 peaks were selected as the most prominent lines, which provided 153 intensity ratio values. For classification, the number of variables was reduced by PCA and LDA statistical methods. It was found that the best performance was obtained with lines of C, O, and K.
In [56], the authors were able to distinguish between microdrops of plasma from Alzheimer’s disease and those of healthy control samples. To improve classification and diagnose Alzheimer’s disease, advanced statistical methods were tested, and Quadratic Discriminant Analysis was finally selected, obtaining a classification accuracy of 80%. Other cases of tissues with very similar compositions were glioma and the infiltrating tissues obtained in brain tumor surgery. In [57], this kind of sample was studied, with half embedded in paraffin for pathological examination and half prepared on glass slides for LIBS measurements. They consisted of 1200 spectra that were statistically analyzed. In the work, predictive data clustering was applied together with supervised learning methods in order to improve the diagnosis accuracy. Recently, in [58], Janovszky employed a model that allowed for the differentiation of six types of tissues taken from swine (porcine). Nevertheless, they highlighted the strong matrix effect caused by organic tissues. Therefore, to convert LIBS intensity maps to concentration maps, matrix-matched external calibration was required. As a result of this approach, the lung, heart, brain, kidney, liver, and muscle tissues were predicted with an accuracy better than 95%. In [59], an advanced prototype for the differentiation of tissues by LIBS in laser osteotomy was constructed. Namely, they designed a custom-made Echelle spectrometer in connection to a common fiber optic for both beam delivery and light collection that was fitted inside the narrow channel of an endoscope. This LIBS setup, together with multivariate data analysis, accomplished successful differentiation between tissues (muscle, fat, and bone marrow from porcine specimens), with cross-validated sensitivity and specificity of 90.2% and 96.7, respectively.
5.2. Targetting Tumors
Cancer diagnosis is extremely complicated and often relies on the interpretation of biopsy samples. Moreover, cancer survival rates show a great dependence on the time elapsed before detection. Therefore, diagnostic procedures to identify cancerous tumors in the early stages are crucial for successful treatment. In order to target tumors, contrast agents are employed, which are molecules that accumulate in tumors and are detectable by different techniques (for example, magnetic resonance, particle-induced X-ray emission, transmission electron microscopy, etc.). LIBS detects the elements of the contrast agent and has some advantages compared to other techniques. The advantages have increased during the last few years because contrast agents have been improved by including nanoparticles that may act as contrast agents and radiation dose enhancement, being detected by LIBS without the interference of labeling, which is needed in other techniques.
The first time that normal and malignant cells were distinguished from histological sections with LIBS was in 2004, when [4] compared line intensity ratios of some elements. Namely, they analyzed tissue from canine hemangiosarcoma and found that intensity ratios of Ca/K, Cu/K, and Na/K were clearly different in normal and malignant samples. The lines employed were 393.4, 396.9, 610.3, and 612.2 nm for Ca, 394.4 and 396.2 for Al, 589.0 and 589.6 nm for Na, 324.8 and 327.4 for Cu, and 766.5 nm for K. In Figure 13, one example is shown for the spectra recorded with a 1 μs delay, 10 μs gate width, and an average of 10 spectra for the sample on a glass substrate rotating during the recording of data.
For human samples, in 2010, it was reported [6] that the Ca and Mg spectral lines recorded by LIBS from breast and colorectal tissues clearly had more intensity in tumors than in non-neoplastic samples (see Figure 14), using lines at 373.6 nm and 422.6 nm for calcium and at 280.2 nm and 285.2 nm for magnesium.
In 2015, Ref. [36] studied the spectra of elements with biological interest in homogenized pellets and real tissues from excised skin samples of melanoma-implanted mice. Data were recorded with a delay of 0.2 μs and a gate width of 1.05 ms in an argon atmosphere for the elements Mg, Ca, Na, H, Na, K, O, and Cl in the range 200–900 nm. It was concluded that intensity was higher for Mg and Ca in melanomas than in the dermis. Two years later, tissues were examined by LIBS in [40] from a variety of human carcinomas including breast, tongue, larynx, and colon samples. In total, 60 samples (30 normal + 30 cancerous) were examined. As can be seen in Figure 15, Ca lines had higher intensity for the cancerous tissues. The effect was even stronger for the intensity ratios of Ca II/K I, Ca I/K I, and Na I/K I. These authors studied the parameters of the whole plasma and found that plasma temperature and electron density were also higher for cancerous tissues. In 2022, Ref. [49] successfully differentiated malign and benign liver tissues by detecting trace amounts of biometals by LIBS on a single shot. Previously, a model of calibration was developed by using samples prepared with concentrations selected in the ranges in which they occur in the human soft body tissues. These, together with certified reference material, were used to train an ANN model that finally predicted the malignity of the tissues.
5.3. Multi-Elemental Soft Tissue Imaging
The use of LIBS to perform spatially resolved analysis, providing the compositional mapping of a sample with μm resolution, was well established for hard materials some years ago (see [60]). In 2012, the work of Motto-Ros et al. [8] demonstrated for the first time the effectiveness of LIBS for the elemental mapping of soft tissues. Here, thin sections of mouse kidneys deposited onto plastic slides were analyzed by LIBS. Na, Ca, Cu, and Gd, naturally contained in the organ or artificially injected in the form of Gd-based nanoparticles, were detected with a resolution of 100 μm, obtaining the multi-elemental mapping shown in Figure 16.
In 2013, the same group [10] used an optical microscope (×40 magnification) to focus a laser pulse, being fully compatible with optical microscopy of the sample surface. The samples were injected with gadolinium-based nanoparticles.
Information of the renal distribution of the nanoparticles without any labeling 24 h later and a detection limit for Gd of 30 ppm for data from a single laser shot were found. The mapping was performed in the range of 285–315 nm for a total number of 15 lines of Gd II, Fe II, Ca II, and Si I. One year later, works in [11,61] obtained a spatial resolution for the mapping of 10 μm, which was a breakthrough in technological advancement (cellular-level degree of information).
This was possible by using a lower numerical aperture for the objective than in earlier works and also because of the better ablation control reported when using epoxy-embedded samples compared with previous samples. The multi-elemental imaging was constructed with lines of Gd, Si, Na, and Fe in the spectral range of 315–350 nm, recorded hours after intravenous administration of AGuIX gadolinium-based particles. The whole experiment is summarized in Figure 17.
Although AguIX had successfully been used for theranostic purposes in cancer radiotherapy, their mechanism of elimination remained unclear. To solve this, the work in [62] performed the first LIBS imaging at the entire organ scale.
Finally, Ref. [12] obtained LIBS imaging of soft tissues in 3D, as can be seen in Figure 18. This was performed by two procedures: slicing the epoxy-embedded kidney in consecutive sections (200 μm thickness) and repeating the 2D LIBS scan of the same renal region, performing seven scans. The study recorded spectra of Gd, Ca, and Na of the nanoparticles AguIX previously injected in mice.
5.4. Detection of Biomarkers
One of the key approaches used to diagnose cancers is to detect protein biomarkers. To improve the current techniques for detection, Ref. [38] applied a new method called Tag-LIBS. This consists of tagging nanoparticles to antibodies that bind to specific biomarkers and analyzing the spectra of the nanoparticles by LIBS. This procedure was tested for detecting the cancer biomarker Cancer Antigen 125 (CA 125). Titanium dioxide particles and iron oxide particles were tagged to the antibodies that were mixed in a suspension that was used for the analysis of human blood plasma spiked with Ca 125. Afterwards, LIBS spectra were recorded and Ti (334.94 nm) and Fe (261.19 and 404.58 nm) spectral lines were analyzed. In Figure 19, the average spectra of 100 laser pulses show the clear detection of the biomarkers. The sensitivity of the tag-LIBS assay was with a limit of detection that was two orders of magnitude smaller than that with the current techniques (ELISA).
The authors of [63] employed LIBS for the specific determination of the HER2 biomarker on the surface of breast cancer cell lines. This biomarker was employed with photon-upconversion nanoparticles (UCNP), which were detected by LIBS applied to the Y II emission line at 437.49 nm. In relation to this field, it is worth mentioning that the review [17] included this type of study as a new research trend called LIBS-based liquid biopsy. This work reports some interesting works in this innovatory field.
5.5. Histopathological Analysis
During the last twenty years, the identification and quantification of metals in soft tissues has been a field of research because it has emerged as an important source of information for medical diagnostics. Current procedures are performed in histology laboratories where formalin fixation, paraffin embedding (FFPE), and the preparation of hematoxylin-eosin-stained (HES) sections for microscopic optical evaluation are involved. Although this has emerged as the worldwide gold standard for histopathological analysis, the use of stains suffers from limitations such as long preparation times and poor sensitivity.
Moncayo et al. leveraged advances in LIBS imaging to propose in 2017 the proof of concept for the complementarity of LIBS-based imaging with conventional histopathology [9]. They analyzed endogenous elements in paraffin-embedded skin biopsies, including healthy skin tissue, cutaneous metastasis of melanoma, Merkel-cell carcinoma, and squamous cell carcinoma. A dedicated instrumental configuration was proposed, where histopathology samples and optical microscopy were included in the LIBS setup (Figure 20). Spectra were recorded studying spectral lines of biological interest (P, Cu, Zn, Fe, Al, Mg, Na, Si). The images obtained by LIBS and in histopathological procedures can be compared in the following figure (see b) and d) subfigures) for healthy skin.
Using this procedure, the authors achieved visualization of the three layers of the skin in perfect agreement with microscopic pathological examination after HES staining. Moreover, lesions in tumors were characterized, observing the clear distinctions in the distribution of elements by LIBS. The authors concluded that LIBS may help pathologists establish diagnoses in a complementary and compatible way for a wide range of medical applications.
Consequently, in [27], the same group studied foreign materials that are present in tissues after surgery. The current approach is to perform histochemical staining of the tissue with chelators of the metal of interest, which has limitations of poor sensitivity and one element being detected per dye. On the contrary, LIBS analysis allowed for the detection of the elements present in the sample with one single spectrum. Therefore, the pathologists selected some biopsies in which exogenous material was identified, and LIBS analysis was performed. This was completely successful as the identification of Al in a cutaneous granuloma, or Ti, W, and Cu in lymph nodes and the skin, allowed the pathologist to make some assumptions about the presence of these foreign metals (tattoo pigments, melanoma metastasis, components of the instruments in surgery, etc.).
5.6. Detection and Quantification of Nucleic Acids
Modern biology and industry require the accurate quantification of nucleic acids in many areas. The methods employed to measure this in 2008 were based on fluorescence labeling, which has some important limitations. This same year, the works in [42] accomplished the accurate quantification of nucleic acids by LIBS, without preliminary labeling. The method was based on the same stoichiometry for Phosphorus atoms and the nucleic acid skeleton. Therefore, the known accurate quantification of atoms achieved by the LIBS technique allows for accurate measurements of nucleic acid concentrations to be obtained.
In Figure 21, the phosphorus emission from the nucleic acid is clearly detected; the 253.563 nm spectral line was selected for the data analysis due to the lack of spectral interferences with other atoms. To perform the measurements, deposits of oligonucleotides were mapped by LIBS using a microscope to focus the laser pulse and an X-Y-Z motorized translator to move the sample. In the experiment, a huge amount of data were recorded, and statistical data analysis was required. The final result allowed a limit of detection of 105 nucleotides/μm2.
The work in [64] was focused on the experimental importance of the changes in the spectra produced after plasma formation. The authors performed measurements on pellets of guanine (Merck > 98%) and adenine (Fluka > 99%) and obtained the evolution of electron density, temperature, and intensities of different atomic/ionic and molecular spectra.
5.7. Detection of Wilson’s Disease
Wilson’s disease is a congenital neurological disorder with a prevalence (in 2013) of 1–4 affected per 100,000 people, resulting in hepatic accumulation. A content higher than 250 μg Cu per gram of dried human liver tissue confirms Wilson’s disease diagnosis, while a content of 50 μg/g is considered to denote a healthy liver. In this year, the gold standard for diagnosis was determination by biopsy, which is not a fast procedure. In [7], the authors were able to measure, very quickly, the concentration of Cu by LIBS in both the diseased liver and the biopsy samples. Spectra were taken from healthy and diseased samples and the differences are obvious in Figure 22. After the data analysis, a limit of detection of 20 μg/g was obtained.
6. Future Trends
In this work, the articles on Laser-Induced Breakdown Spectroscopy (LIBS) applied to (animal or human) soft tissues over the past 20 years were reviewed. During this period, multi-element imaging of biological samples has been achieved, and diseases have been detected, for the first time, with this technique. These are pioneering works that lay the foundations for the further development of a robust body of work in the field.
The main challenges of LIBS have remained and, in some cases, been magnified, by the special characteristics of the samples. Thus, plasma self-absorption and matrix effects continue to be the primary sources of systematic errors when attempting to make precise measurements. On the other hand, although LIBS is characterized by not requiring prior sample treatment, biological tissues are obtained by several methods that add complexity to the process. In fact, advances in the speed of measurement processing and the emergence of statistical and computational methods in data treatment have enabled authors to deal with the massive amount of information obtained from these samples.
It is evident that, being pioneering works that establish the basic foundations of the technique, some challenges remain to be addressed to allow for wider application. For example, in many of the articles, experiments relied on the most persistent lines, because one very important difficulty was the low sensitivity of the technique. However, this type of line is likely to be self-absorbed. To obtain precise measurements, additional effort is required and a prior selection of the lines to be used must be performed. In this regard, precise knowledge of their atomic parameters (transition probabilities, energy levels, etc.) will allow for the obtaining of values such as plasma temperature and electron density, enabling the study of thermodynamic equilibrium and optically thin conditions required for precise measurements of emitted line intensities. In addition, to overcome the difficulties of quantification for complex samples, the improvement of the existing calibration procedures is required.
Were measurement accuracies to be improved, an exciting field of research would be opened. The results reported during these past 20 years show that the automated identification of malignant tissues and diseases, as well as the evolution of particle distribution in organs, are possible. Therefore, promising applications of this technique can be implemented. Developing this for a wide range of biomedical areas is a challenging task. Furthermore, the path has just been opened for real-time diagnosis in either standard samples or during laser surgery procedures. For example, Ref. [59] has paved the way for the development of smart-endoscopic laser scalpels. To achieve this, it is necessary to accurately measure many spectral lines to feed databases for establishing protocols to be used in such applications. Additionally, there are some elements in tissues of great interest, for which sample sensitivity needs to be improved.
The emphasis of this work was to present the experimental details of the latest advances in the hope that this may encourage future research in this field.
Author Contributions
Conceptualization, J.M.; methodology, J.M.; software, J.M., P.G. and J.V.; validation, J.M.; Statistical methods, P.G.; investigation, J.M.; Medical concepts, J.V.; writing—original draft preparation, J.M.; writing—review and editing, J.M.; All authors have read and agreed to the published version of the manuscript.
Funding
This work was supported by the Fundacion Universitaria San Pablo CEU, project FUSP-PPC-22-045.
Conflicts of Interest
The authors declare no conflicts of interest.
Acronyms
List of acronyms used in this review. 1 In alphabetical order.
| Acronym 1 | Definition |
| Ar-F | Argon Fluoride |
| CCD | Charge-Coupled Device |
| DNA | Deoxyribonucleic Acid |
| ELISA | Enzyme-Linked Immunoassay |
| FFPE | Formalin Fixation and Paraffin Embedding |
| fs-laser | Femtosecond Laser |
| HES | Hematoxylin and Eosin-Stained |
| ICCD | Intensified Charge-Coupled Device |
| LA-ICP-MS | Laser Ablation Inductively Coupled Plasma Mass Spectrometry |
| LA-ICP-OES | Laser Ablation Inductively Coupled Plasma Optical Emission Spectroscopy |
| LIBS | Laser-Induced Breakdown Spectroscopy |
| LIP | Laser-Induced Plasma |
| μXRF | Synchrotron and Laboratory X-ray Fluorescence |
| Nd:YAG | Neodymium-doped Yttrium Aluminum Garnet |
| RNA | Ribonucleic Acid |
| SEM | Scanning Electron Microscopy |
| UCNP | UpConversion NanoParticles |
References
- Radziemski, L.J.; Loree, T.R.; Cremers, D.A. Laser-Induced Breakdown Spectroscopy (LIBS): A New Spectrochemical Technique. In Optical and Laser Remote Sensing; Killinger, D.K., Mooradian, A., Eds.; Springer: Berlin/Heidelberg, Germany, 1983; pp. 303–307. ISBN 978-3-540-39552-2. [Google Scholar]
- Hahn, D.W.; Nicolo’omenetto, N.N. Focal Point Laser-Induced Breakdown Spectroscopy (LIBS), Part I: Review of Basic Diagnostics and Plasma-Particle Interactions: Still-Challenging Issues within the Analytical Plasma Community. Appl. Spectrosc. 2010, 64, 335A–366A. [Google Scholar] [CrossRef]
- Rehse, S.J.; Salimnia, H.; Miziolek, A.W. Laser-Induced Breakdown Spectroscopy (LIBS): An Overview of Recent Progress and Future Potential for Biomedical Applications. J. Med. Eng. Technol. 2012, 36, 77–89. [Google Scholar] [CrossRef]
- Kumar, A.; Yueh, Y.; Singh, J.P.; Burgess, S. Characterization of Malignant Tissue Cells by Laser-Induced Breakdown Spectroscopy. Appl. Opt. 2004, 43, 5399–5403. [Google Scholar] [CrossRef] [PubMed]
- Yueh, F.Y.; Zheng, H.; Singh, J.P.; Burgess, S. Preliminary Evaluation of Laser-Induced Breakdown Spectroscopy for Tissue Classification. Spectrochim. Acta Part B At. Spectrosc. 2009, 64, 1059–1067. [Google Scholar] [CrossRef]
- El-Hussein, A.; Kassem, A.K.; Ismail, H.; Harith, M.A. Exploiting LIBS as a Spectrochemical Analytical Technique in Diagnosis of Some Types of Human Malignancies. Talanta 2010, 82, 495–501. [Google Scholar] [CrossRef] [PubMed]
- Grolmusová, Z.; Horňáčková, M.; Plavčan, J.; Kopáni, M.; Babál, P.; Veis, P. Laser Induced Breakdown Spectroscopy of Human Liver Samples with Wilson’s Disease. EPJ Appl. Phys. 2013, 63, 20801. [Google Scholar] [CrossRef]
- Motto-Ros, V.; Sancey, L.; Ma, Q.L.; Lux, F.; Bai, X.S.; Wang, X.C.; Yu, J.; Panczer, G.; Tillement, O. Mapping of Native Inorganic Elements and Injected Nanoparticles in a Biological Organ with Laser-Induced Plasma. Appl. Phys. Lett. 2012, 101, 223702. [Google Scholar] [CrossRef]
- Moncayo, S.; Trichard, F.; Busser, B.; Sabatier-Vincent, M.; Pelascini, F.; Pinel, N.; Templier, I.; Charles, J.; Sancey, L.; Motto-Ros, V. Multi-Elemental Imaging of Paraffin-Embedded Human Samples by Laser-Induced Breakdown Spectroscopy. Spectrochim. Acta Part B At. Spectrosc. 2017, 133, 40–44. [Google Scholar] [CrossRef]
- Motto-Ros, V.; Sancey, L.; Wang, X.C.; Ma, Q.L.; Lux, F.; Bai, X.S.; Panczer, G.; Tillement, O.; Yu, J. Mapping Nanoparticles Injected into a Biological Tissue Using Laser-Induced Breakdown Spectroscopy. Spectrochim. Acta. Part B At. Spectrosc. 2013, 87, 168–174. [Google Scholar] [CrossRef]
- Sancey, L.; Motto-Ros, V.; Busser, B.; Kotb, S.; Benoit, J.M.; Piednoir, A.; Lux, F.; Tillement, O.; Panczer, G.; Yu, J. Laser Spectrometry for Multi-Elemental Imaging of Biological Tissues. Sci. Rep. 2014, 4, 6065. [Google Scholar] [CrossRef]
- Gimenez, Y.; Busser, B.; Trichard, F.; Kulesza, A.; Laurent, J.M.; Zaun, V.; Lux, F.; Benoit, J.M.; Panczer, G.; Dugourd, P.; et al. 3D Imaging of Nanoparticle Distribution in Biological Tissue by Laser-Induced Breakdown Spectroscopy. Sci. Rep. 2016, 6, 29936. [Google Scholar] [CrossRef] [PubMed]
- Aragón, C.; Aguilera, J.A. Characterization of Laser Induced Plasmas by Optical Emission Spectroscopy: A Review of Experiments and Methods. Spectrochim. Acta Part B At. Spectrosc. 2008, 63, 893–916. [Google Scholar] [CrossRef]
- Kaiser, J.; Novotný, K.; Martin, M.Z.; Hrdlička, A.; Malina, R.; Hartl, M.; Adam, V.; Kizek, R. Trace Elemental Analysis by Laser-Induced Breakdown Spectroscopy—Biological Applications. Surf. Sci. Rep. 2012, 67, 233–243. [Google Scholar] [CrossRef]
- Busser, B.; Moncayo, S.; Coll, J.L.; Sancey, L.; Motto-Ros, V. Elemental Imaging Using Laser-Induced Breakdown Spectroscopy: A New and Promising Approach for Biological and Medical Applications. Coord. Chem. Rev. 2018, 358, 70–79. [Google Scholar] [CrossRef]
- Jolivet, L.; Leprince, M.; Moncayo, S.; Sorbier, L.; Lienemann, C.P.; Motto-Ros, V. Review of the Recent Advances and Applications of LIBS-Based Imaging. Spectrochim. Acta Part B At. Spectrosc. 2019, 151, 41–53. [Google Scholar] [CrossRef]
- Gaudiuso, R.; Melikechi, N.; Abdel-Salam, Z.A.; Harith, M.A.; Palleschi, V.; Motto-Ros, V.; Busser, B. Laser-Induced Breakdown Spectroscopy for Human and Animal Health: A Review. Spectrochim. Acta Part B At. Spectrosc. 2019, 152, 123–148. [Google Scholar] [CrossRef]
- Limbeck, A.; Brunnbauer, L.; Lohninger, H.; Pořízka, P.; Modlitbová, P.; Kaiser, J.; Janovszky, P.; Kéri, A.; Galbács, G. Methodology and Applications of Elemental Mapping by Laser Induced Breakdown Spectroscopy. Anal. Chim. Acta 2021, 1147, 72–98. [Google Scholar] [CrossRef] [PubMed]
- Modlitbová, P.; Pořízka, P.; Kaiser, J. Laser-Induced Breakdown Spectroscopy as a Promising Tool in the Elemental Bioimaging of Plant Tissues. TrAC Trends Anal. Chem. 2020, 122, 115729. [Google Scholar] [CrossRef]
- Hanahan, D.; Weinberg, R.A. Hallmarks of Cancer: The next Generation. Cell 2011, 144, 646–674. [Google Scholar] [CrossRef]
- Kim, S.W.; Lee, Y.J.; Chung, J.-W.; Ha, Y.-S.; Choi, S.H.; Lee, J.N.; Kim, B.S.; Kim, H.T.; Kim, T.-H.; Yoo, E.S.; et al. A Higher Ratio of Serum Calcium to Magnesium Is Associated with Aggressive Clinicopathological Characteristics in the Patients Who Underwent Radical Prostatectomy. Korean J. Urol. Oncol. 2018, 16, 25–31. [Google Scholar] [CrossRef]
- Sun, Y.; Selvaraj, S.; Varma, A.; Derry, S.; Sahmoun, A.E.; Singh, B.B. Increase in Serum Ca2+/Mg2+ Ratio Promotes Proliferation of Prostate Cancer Cells by Activating TRPM7 Channels. J. Biol. Chem. 2013, 288, 255–263. [Google Scholar] [CrossRef] [PubMed]
- Sahmoun, A.E.; Singh, B.B. Does a Higher Ratio of Serum Calcium to Magnesium Increase the Risk for Postmenopausal Breast Cancer? Med. Hypotheses 2010, 75, 315–318. [Google Scholar] [CrossRef]
- Ressnerova, A.; Raudenska, M.; Holubova, M.; Svobodova, M.; Polanska, H.; Babula, P.; Masarik, M.; Gumulec, J. Zinc and Copper Homeostasis in Head and Neck Cancer: Review and Meta-Analysis. Curr. Med. Chem. 2016, 23, 1304–1330. [Google Scholar] [CrossRef]
- Barnham, K.J.; Bush, A.I. Biological Metals and Metal-Targeting Compounds in Major Neurodegenerative Diseases. Chem. Soc. Rev. 2014, 43, 6727–6749. [Google Scholar] [CrossRef] [PubMed]
- Sadighara, P.; Jahanbakhsh, M.; Nazari, Z.; Mostashari, P. The Organotin Contaminants in Food: Sources and Methods for Detection: A Systematic Review and Meta-Analysis. Food Chem. X 2021, 12, 100154. [Google Scholar] [CrossRef] [PubMed]
- Busser, B.; Moncayo, S.; Trichard, F.; Bonneterre, V.; Pinel, N.; Pelascini, F.; Dugourd, P.; Coll, J.L.; D’Incan, M.; Charles, J.; et al. Characterization of Foreign Materials in Paraffin-Embedded Pathological Specimens Using in Situ Multi-Elemental Imaging with Laser Spectroscopy. Mod. Pathol. 2018, 31, 378–384. [Google Scholar] [CrossRef]
- Gurusamy, K.; Davidson, B.R. Trace Element Concentration in Metastatic Liver Disease—A Systematic Review. J. Trace Elem. Med. Biol. 2007, 21, 169–177. [Google Scholar] [CrossRef]
- Arain, S.A.; Kazi, T.G.; Afridi, H.I.; Talpur, F.N.; Mughal, M.A.; Shah, F.; Arain, S.S.; Panhwar, A.H. Estimation of Copper and Iron Burden in Biological Samples of Various Stages of Hepatitis C and Liver Cirrhosis Patients. Biol. Trace Elem. Res. 2014, 160, 197–205. [Google Scholar] [CrossRef]
- Chen, Y.; Yang, J.; Fu, S.; Wu, J. Gold Nanoparticles as Radiosensitizers in Cancer Radiotherapy. Int. J. Nanomed. 2020, 15, 9407–9430. [Google Scholar] [CrossRef]
- Liu, Y.; Zhang, P.; Li, F.; Jin, X.; Li, J.; Chen, W.; Li, Q. Metal-Based NanoEnhancers for Future Radiotherapy: Radiosensitizing and Synergistic Effects on Tumor Cells. Theranostics 2018, 8, 1824–1849. [Google Scholar] [CrossRef]
- Retif, P.; Pinel, S.; Toussaint, M.; Frochot, C.; Chouikrat, R.; Bastogne, T.; Barberi-Heyob, M. Nanoparticles for Radiation Therapy Enhancement: The Key Parameters. Theranostics 2015, 5, 1030–1044. [Google Scholar] [CrossRef] [PubMed]
- Maier-Hauff, K.; Ulrich, F.; Nestler, D.; Niehoff, H.; Wust, P.; Thiesen, B.; Orawa, H.; Budach, V.; Jordan, A. Efficacy and Safety of Intratumoral Thermotherapy Using Magnetic Iron-Oxide Nanoparticles Combined with External Beam Radiotherapy on Patients with Recurrent Glioblastoma Multiforme. J. Neurooncol. 2011, 103, 317–324. [Google Scholar] [CrossRef] [PubMed]
- Verry, C.; Dufort, S.; Villa, J.; Gavard, M.; Iriart, C.; Grand, S.; Charles, J.; Chovelon, B.; Cracowski, J.L.; Quesada, J.L.; et al. Theranostic AGuIX Nanoparticles as Radiosensitizer: A Phase I, Dose-Escalation Study in Patients with Multiple Brain Metastases (NANO-RAD Trial). Radiother. Oncol. 2021, 160, 159–165. [Google Scholar] [CrossRef] [PubMed]
- Bonvalot, S.; Rutkowski, P.L.; Thariat, J. NBTXR3, a First-in-Class Radioenhancer Hafnium Oxide Nanoparticle, plus Radiotherapy versus Radiotherapy Alone in Patients with Locally Advanced Soft-Tissue Sarcoma (Act.In.Sarc): A Multicentre, Phase 2-3, Randomised, Controlled Trial. Lancet Oncol. 2019, 20, 1148–1159. [Google Scholar] [CrossRef] [PubMed]
- Moon, Y.; Han, J.H.; Lee, J.J.; Choi, S.; Kim, Y.C.; Jeong, S. Differentiation of Cutaneous Melanoma from Surrounding Skin Using Laser-Induced Breakdown Spectroscopy. In Proceedings of the 2016 Conference on Lasers and Electro-Optics (CLEO), San Jose, CA, USA, 5–10 June 2016. [Google Scholar]
- Šindelářová, A.; Pořízka, P.; Modlitbová, P.; Vrlíková, L.; Kiss, K.; Kaška, M.; Prochazka, D.; Vrábel, J.; Buchtová, M.; Kaiser, J. Methodology for the Implementation of Internal Standard to Laser-Induced Breakdown Spectroscopy Analysis of Soft Tissues. Sensors 2021, 21, 900. [Google Scholar] [CrossRef]
- Markushin, Y.; Sivakumar, P.; Connolly, D.; Melikechi, N. Tag-Femtosecond Laser-Induced Breakdown Spectroscopy for the Sensitive Detection of Cancer Antigen 125 in Blood Plasma. Anal. Bioanal. Chem. 2015, 407, 1849–1855. [Google Scholar] [CrossRef] [PubMed]
- Kanawade, R.; Mehari, F.; Knipfer, C.; Rohde, M.; Tangermann-Gerk, K.; Schmidt, M.; Stelzle, F. Pilot Study of Laser Induced Breakdown Spectroscopy for Tissue Differentiation by Monitoring the Plume Created during Laser Surgery—An Approach on a Feedback Laser Control Mechanism. Spectrochim. Acta Part B At. Spectrosc. 2013, 87, 175–181. [Google Scholar] [CrossRef]
- Ghasemi, F.; Parvin, P.; Reif, J.; Abachi, S.; Mohebbifar, M.R.; Razzaghi, M.R. Laser Induced Breakdown Spectroscopy for the Diagnosis of Several Malignant Tissue Samples. J. Laser Appl. 2017, 29, 042005. [Google Scholar] [CrossRef]
- Mehari, F.; Rohde, M.; Kanawade, R.; Knipfer, C.; Adler, W.; Klämpfl, F.; Stelzle, F.; Schmidt, M. Investigation of the Differentiation of Ex Vivo Nerve and Fat Tissues Using Laser-Induced Breakdown Spectroscopy (LIBS): Prospects for Tissue-Specific Laser Surgery. J. Biophotonics 2016, 9, 1021–1032. [Google Scholar] [CrossRef]
- Le Meur, J.; Menut, D.; Wodling, P.; Salmon, L.; Thro, P.Y.; Chevillard, S.; Ugolin, N. First Improvements in the Detection and Quantification of Label-Free Nucleic Acids by Laser-Induced Breakdown Spectroscopy: Application to the Deoxyribonucleic Acid Micro-Array Technology. Spectrochim. Acta Part B At. Spectrosc. 2008, 63, 465–473. [Google Scholar] [CrossRef]
- Russo, R.E.; Mao, X.; Liu, H.; Gonzalez, J.; Mao, S.S. Laser Ablation in Analitycal Chemistry-A Review. Talanta 2002, 57, 425–451. [Google Scholar] [CrossRef] [PubMed]
- Jantzi, S.C.; Motto-Ros, V.; Trichard, F.; Markushin, Y.; Melikechi, N.; De Giacomo, A. Sample Treatment and Preparation for Laser-Induced Breakdown Spectroscopy. Spectrochim. Acta Part B At. Spectrosc. 2016, 115, 52–63. [Google Scholar] [CrossRef]
- Marín-Roldan, A.; Manzoor, S.; Moncayo, S.; Navarro-Villoslada, F.; Izquierdo-Hornillos, R.C.; Caceres, J.O. Determination of the Postmortem Interval by Laser Induced Breakdown Spectroscopy Using Swine Skeletal Muscles. Spectrochim. Acta Part B At. Spectrosc. 2013, 88, 186–191. [Google Scholar] [CrossRef]
- Aragón, C.; Aguilera, J.A. CSigma Graphs: A New Approach for Plasma Characterization in Laser-Induced Breakdown Spectroscopy. J. Quant. Spectrosc. Radiat. Transf. 2014, 149, 90–102. [Google Scholar] [CrossRef]
- Ciucci, A.; Palleschi, V.; Rastelli, S.; Salvetti, A.; Singh, D.P.; Tognoni, E. CF-LIPS: A New Approach to LIPS Spectra Analysis. Laser Part. Beams 1999, 17, 793–797. [Google Scholar] [CrossRef]
- Ahmed, I.; Yang, J.; Law, A.W.L.; Manno, F.A.M.; Ahmed, R.; Zhang, Y.; Lau, C. Rapid and in Situ Optical Detection of Trace Lithium in Tissues. Biomed. Opt. Express 2018, 9, 4459. [Google Scholar] [CrossRef] [PubMed]
- Akinyi, O.E.; Kalambuka, A.H.; Dehayem-Kamadjeu, A. Evaluation of a Peak-Free Chemometric Laser-Induced Breakdown Spectroscopy Method for Direct Rapid Cancer Detection via Trace Metal Biomarkers in Tissue. J. Spectrosc. 2022, 2022, 1874173. [Google Scholar] [CrossRef]
- Brunnbauer, L.; Gajarska, Z.; Lohninger, H.; Limbeck, A. A Critical Review of Recent Trends in Sample Classification Using Laser-Induced Breakdown Spectroscopy (LIBS). TrAC Trends Anal. Chem. 2023, 159, 116859. [Google Scholar] [CrossRef]
- Li, L.N.; Liu, X.F.; Yang, F.; Xu, W.M.; Wang, J.Y.; Shu, R. A Review of Artificial Neural Network Based Chemometrics Applied in Laser-Induced Breakdown Spectroscopy Analysis. Spectrochim. Acta Part B At. Spectrosc. 2021, 180, 106183. [Google Scholar] [CrossRef]
- Prochazka, D.; Mazura, M.; Samek, O.; Rebrošová, K.; Pořízka, P.; Klus, J.; Prochazková, P.; Novotný, J.; Novotný, K.; Kaiser, J. Combination of Laser-Induced Breakdown Spectroscopy and Raman Spectroscopy for Multivariate Classification of Bacteria. Spectrochim. Acta Part B At. Spectrosc. 2018, 139, 6–12. [Google Scholar] [CrossRef]
- Lin, X.; Sun, H.; Gao, X.; Xu, Y.T.; Wang, Z.X.; Wang, Y. Discrimination of Lung Tumor and Boundary Tissues Based on Laser-Induced Breakdown Spectroscopy and Machine Learning. Spectrochim. Acta Part B At. Spectrosc. 2021, 180, 106200. [Google Scholar] [CrossRef]
- Kohonen, T. Essentials of the Self-Organizing Map. Neural Netw. 2013, 37, 52–65. [Google Scholar] [CrossRef] [PubMed]
- Pagnotta, S.; Legnaioli, S.; Campanella, B.; Grifoni, E.; Lezzerini, M.; Lorenzetti, G.; Palleschi, V.; Poggialini, F.; Raneri, S. Micro-Chemical Evaluation of Ancient Potsherds by μ-LIBS Scanning on Thin Section Negatives. Mediterr. Archaeol. Archaeom. 2018, 18, 171–178. [Google Scholar] [CrossRef]
- Gaudiuso, R.; Ewusi-Annan, E.; Xia, W.; Melikechi, N. Diagnosis of Alzheimer’s Disease Using Laser-Induced Breakdown Spectroscopy and Machine Learning. Spectrochim. Acta Part B At. Spectrosc. 2020, 171, 105931. [Google Scholar] [CrossRef] [PubMed]
- Teng, G.; Wang, Q.; Cui, X.; Chen, G.; Wei, K.; Xu, X.; Idrees, B.S.; Nouman Khan, M. Predictive Data Clustering of Laser-Induced Breakdown Spectroscopy for Brain Tumor Analysis. Biomed. Opt. Express 2021, 12, 4438. [Google Scholar] [CrossRef] [PubMed]
- Janovszky, P.; Kéri, A.; Palásti, D.J.; Brunnbauer, L.; Domoki, F.; Limbeck, A.; Galbács, G. Quantitative Elemental Mapping of Biological Tissues by Laser-Induced Breakdown Spectroscopy Using Matrix Recognition. Sci. Rep. 2023, 13, 10089. [Google Scholar] [CrossRef] [PubMed]
- Abbasi, H.; Guzman, R.; Cattin, P.C.; Zam, A. All-Fiber-Optic LIBS System for Tissue Differentiation: A Prospect for Endoscopic Smart Laser Osteotomy. Opt. Lasers Eng. 2022, 148, 106765. [Google Scholar] [CrossRef]
- Romero, D.; Laserna, J.J. Multielemental Chemical Imaging Using Laser-Induced Breakdown Spectrometry. Anal. Chem. 1997, 69, 2871–2876. [Google Scholar] [CrossRef] [PubMed]
- Sancey, L.; Motto-Ros, V.; Kotb, S.; Wang, X.; Lux, F.; Panczer, G.; Yu, J.; Tillement, O. Laser-Induced Breakdown Spectroscopy: A New Approach for Nanoparticle’s Mapping and Quantification in Organ Tissue. J. Vis. Exp. 2014, e51353. [Google Scholar] [CrossRef]
- Sancey, L.; Kotb, S.; Truillet, C.; Appaix, F.; Marais, A.; Thomas, E.; Van Der Sanden, B.; Klein, J.P.; Laurent, B.; Cottier, M.; et al. Long-Term in Vivo Clearance of Gadolinium-Based AGuIX Nanoparticles and Their Biocompatibility after Systemic Injection. ACS Nano 2015, 9, 2477–2488. [Google Scholar] [CrossRef]
- Pořízka, P.; Vytisková, K.; Obořilová, R.; Pastucha, M.; Gábriš, I.; Brandmeier, J.C.; Modlitbová, P.; Gorris, H.H.; Novotný, K.; Skládal, P.; et al. Laser-Induced Breakdown Spectroscopy as a Readout Method for Immunocytochemistry with Upconversion Nanoparticles. Microchim. Acta 2021, 188, 147. [Google Scholar] [CrossRef] [PubMed]
- Diaz, L.; Rubio, L.; Camacho, J.J. Time Evolution of the Infrared Laser Induced Breakdown Spectroscopy of DNA Bases Guanine and Adenine. Appl. Phys. A Mater. Sci. Process. 2013, 110, 847–851. [Google Scholar] [CrossRef]
Figure 1.
Typical schematic setup in LIBS experiments.

Figure 2.
Crater produced by laser: (a) 266 nm radiation; (b) 1064 nm radiation. Figure reproduced from the original paper [10].
Figure 2.
Crater produced by laser: (a) 266 nm radiation; (b) 1064 nm radiation. Figure reproduced from the original paper [10].

Figure 3.
The modified optical microscope used for both focusing the laser and taking optical images of the sample simultaneously. Figure reproduced from the original paper [42].
Figure 3.
The modified optical microscope used for both focusing the laser and taking optical images of the sample simultaneously. Figure reproduced from the original paper [42].

Figure 4.
Triangular focusing and 4f optical arrangement. Figure reproduced from the original paper [8].
Figure 4.
Triangular focusing and 4f optical arrangement. Figure reproduced from the original paper [8].

Figure 5.
Two spectrometers used simultaneously. Figure reproduced from the original paper [9].
Figure 5.
Two spectrometers used simultaneously. Figure reproduced from the original paper [9].

Figure 6.
Photographs of slices of human silver liver in paraffin with magnification 35 (a) and 150 (b) made by scanning electron microscope. Figure reproduced from the original paper [7].
Figure 6.
Photographs of slices of human silver liver in paraffin with magnification 35 (a) and 150 (b) made by scanning electron microscope. Figure reproduced from the original paper [7].

Figure 7.
(a) Slice of a mouse kidney used for the experiment. Figure reproduced from the original paper [8]. (b) Image of craters taken by SEM in the epoxy-embedded sample, reproduced from the original paper [11].

Figure 8.
Plot with spectral data in PC1, PC2, and PC3 axis. Figure reproduced from the original paper [53].
Figure 8.
Plot with spectral data in PC1, PC2, and PC3 axis. Figure reproduced from the original paper [53].

Figure 9.
Dendogram outlining the groups of the experiment for the classification of tissues. Figure reproduced from the original paper [5].
Figure 9.
Dendogram outlining the groups of the experiment for the classification of tissues. Figure reproduced from the original paper [5].

Figure 10.
LIBS spectra images of 6 samples, made from the 4 segments obtained with SOM, before (up) and after (down) recombination in the color space. Figure reproduced from the original paper [55].
Figure 10.
LIBS spectra images of 6 samples, made from the 4 segments obtained with SOM, before (up) and after (down) recombination in the color space. Figure reproduced from the original paper [55].

Figure 11.
Prediction results using NNA (error bars represent standard deviation of 10 spectra). Figure reproduced from the original paper [5].
Figure 11.
Prediction results using NNA (error bars represent standard deviation of 10 spectra). Figure reproduced from the original paper [5].

Figure 12.
Differentiation of spectral lines in nerve and fat tissues of pigs: (A) nerve tissue; (B) fat tissue. Figure reproduced from the original paper [41].
Figure 12.
Differentiation of spectral lines in nerve and fat tissues of pigs: (A) nerve tissue; (B) fat tissue. Figure reproduced from the original paper [41].

Figure 13.
Spectra for malignant and normal tissues of the liver of a dog. Figure reproduced from the original paper [4].
Figure 13.
Spectra for malignant and normal tissues of the liver of a dog. Figure reproduced from the original paper [4].

Figure 14.
Intensity of Ca spectral lines: (a) breast tissue; (b) colorectal tissue. Figure reproduced from the original paper [6].
Figure 14.
Intensity of Ca spectral lines: (a) breast tissue; (b) colorectal tissue. Figure reproduced from the original paper [6].

Figure 15.
Spectra for cancerous and normal tissues. Figure adapted from the original paper [40], where wavelength identification of lines is reported. In the original paper, tongue, larynx, and colon tissues are also included (not here for better image resolution), showing similar behavior. Average from 2000 spectra, (a) 260–450 nm range and (b) 450–700 nm range.

Figure 16.
Multielemental image produced by LIBS. Colors are shown in scale with the intensity of lines at 318.13, 324.75, 330.49, and 342.25 nm of Ca II, Ca I, Na I, and Gd II, respectively. In the upper part, a natural light photograph of the kidney is shown. Figure reproduced from the original paper [8].

Figure 17.
Steps in LIBS imaging for soft tissues: (a) sample preparation; (b) setup of LIBS; (c) spectra recorded by single shot in three regions of the kidney; (d) mapping in arbitrary color for Gd and Na; (e) calibration curve; (f) SEM image of the sample after the experiment. Figure reproduced from the original paper [11].

Figure 18.
3D LIBS imaging of the kidney, showing the distribution of Gd (a), Ca (b), and Na (c) in light intensity for green, violet, and red colors, respectively. Figure adapted from the original paper [12].
Figure 18.
3D LIBS imaging of the kidney, showing the distribution of Gd (a), Ca (b), and Na (c) in light intensity for green, violet, and red colors, respectively. Figure adapted from the original paper [12].

Figure 19.
LIBS spectra of the sample containing the tagged particles with several CA 125 concentrations: green: 1 U/mL; brown: 0.1 U/mL; blue: 0.01 U/mL, and cyan: 0 U/mL. Figure reproduced from the original paper [38].
Figure 19.
LIBS spectra of the sample containing the tagged particles with several CA 125 concentrations: green: 1 U/mL; brown: 0.1 U/mL; blue: 0.01 U/mL, and cyan: 0 U/mL. Figure reproduced from the original paper [38].

Figure 20.
LIBS experiment with skin biopsies: (a) schematic LIBS setup for analysis of FFPE samples; (b) high-resolution HES histological images of a healthy skin sample; (c) single shot tissue spectrum covering 270–340 nm for detecting Mg, Si, Fe, Cu, Al, and Na; (d) Na, P, Mg, Fe, and Ca LIBS images for the sample. Figure reproduced from the original paper [9].

Figure 21.
Spectrum of nucleic acid in aminosilane gel. Figure reproduced from the original paper [42].
Figure 21.
Spectrum of nucleic acid in aminosilane gel. Figure reproduced from the original paper [42].

Figure 22.
Spectra of several samples, where differences in Cu line intensities are clear. Figure reproduced from the original paper [7].
Figure 22.
Spectra of several samples, where differences in Cu line intensities are clear. Figure reproduced from the original paper [7].


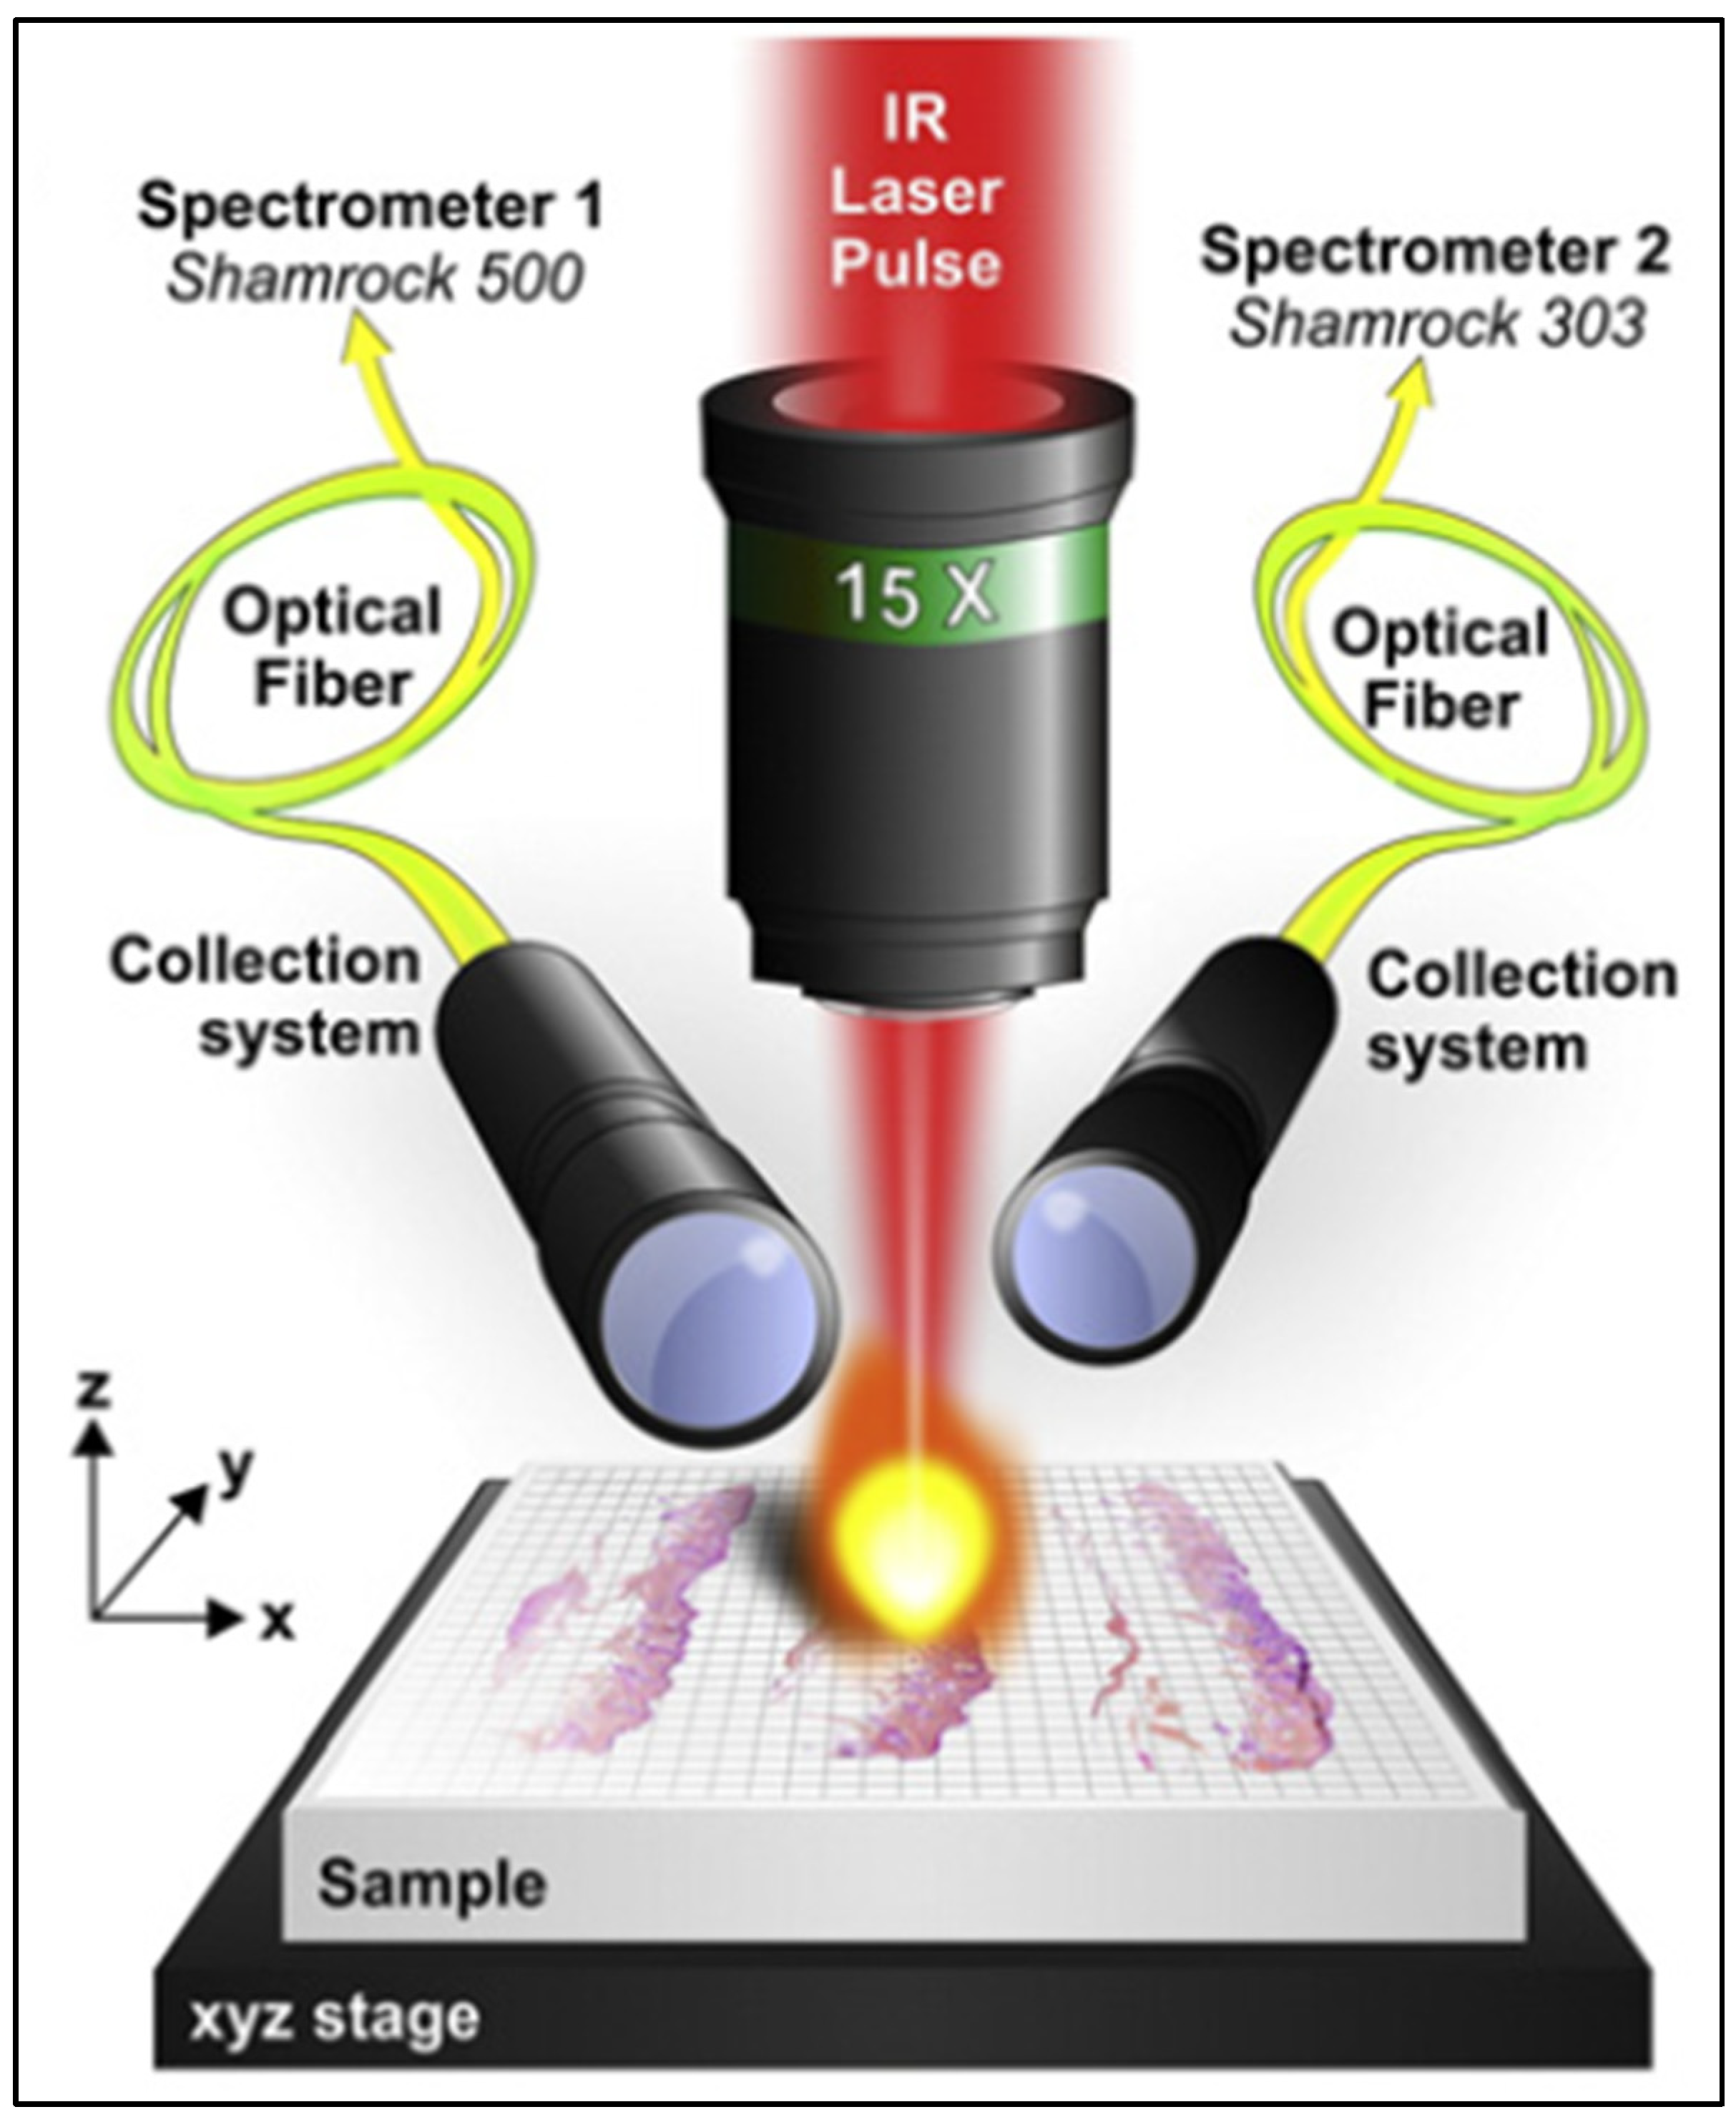
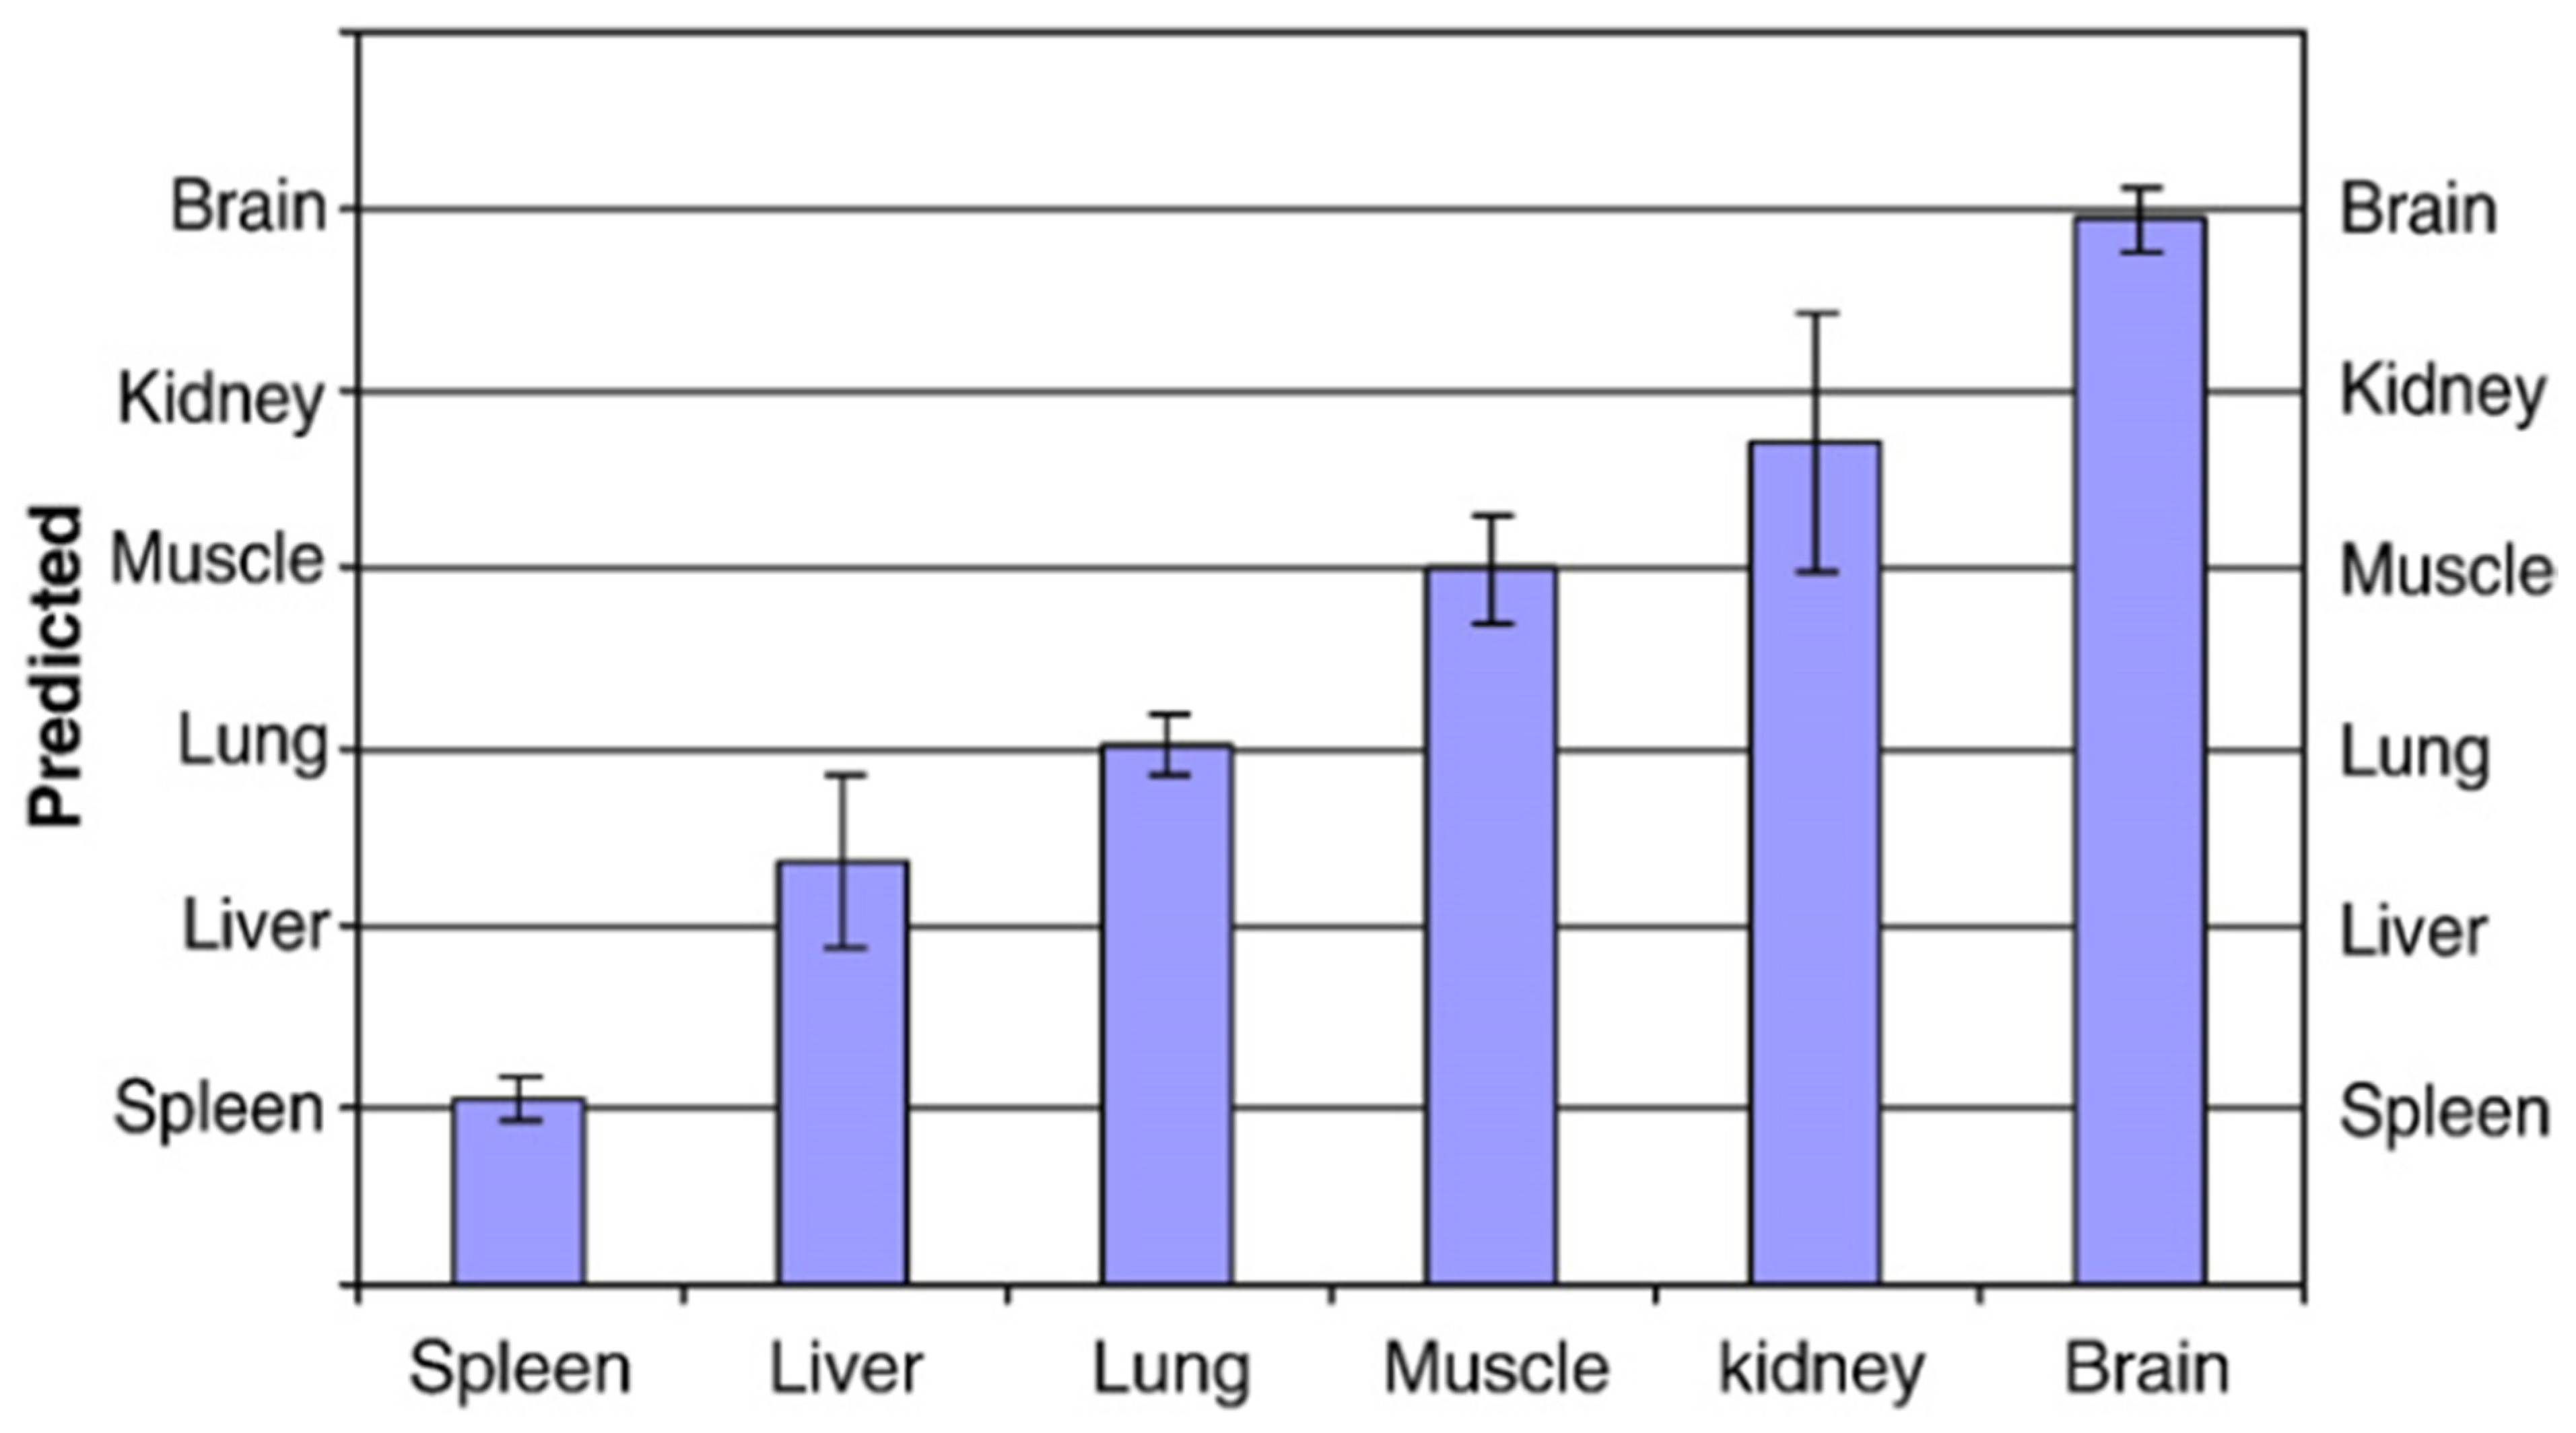
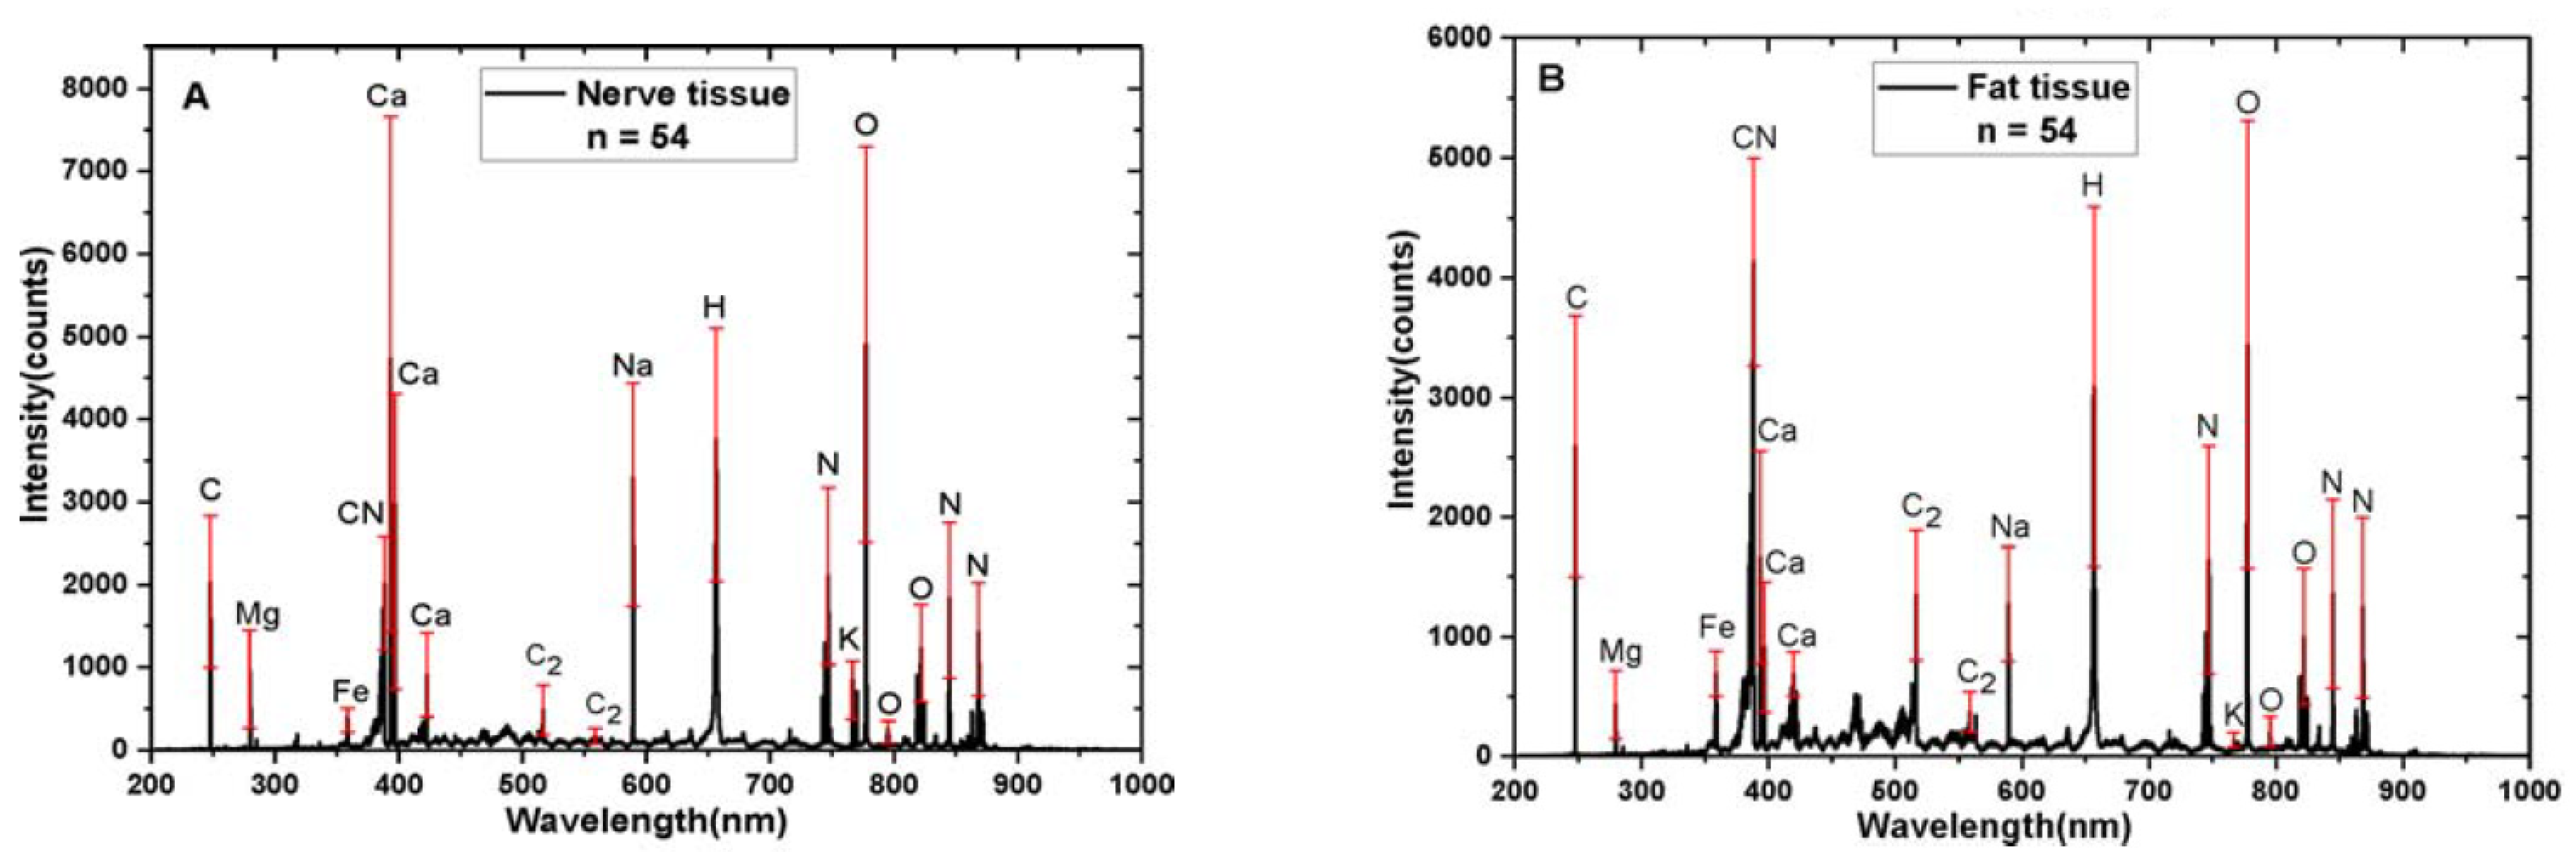
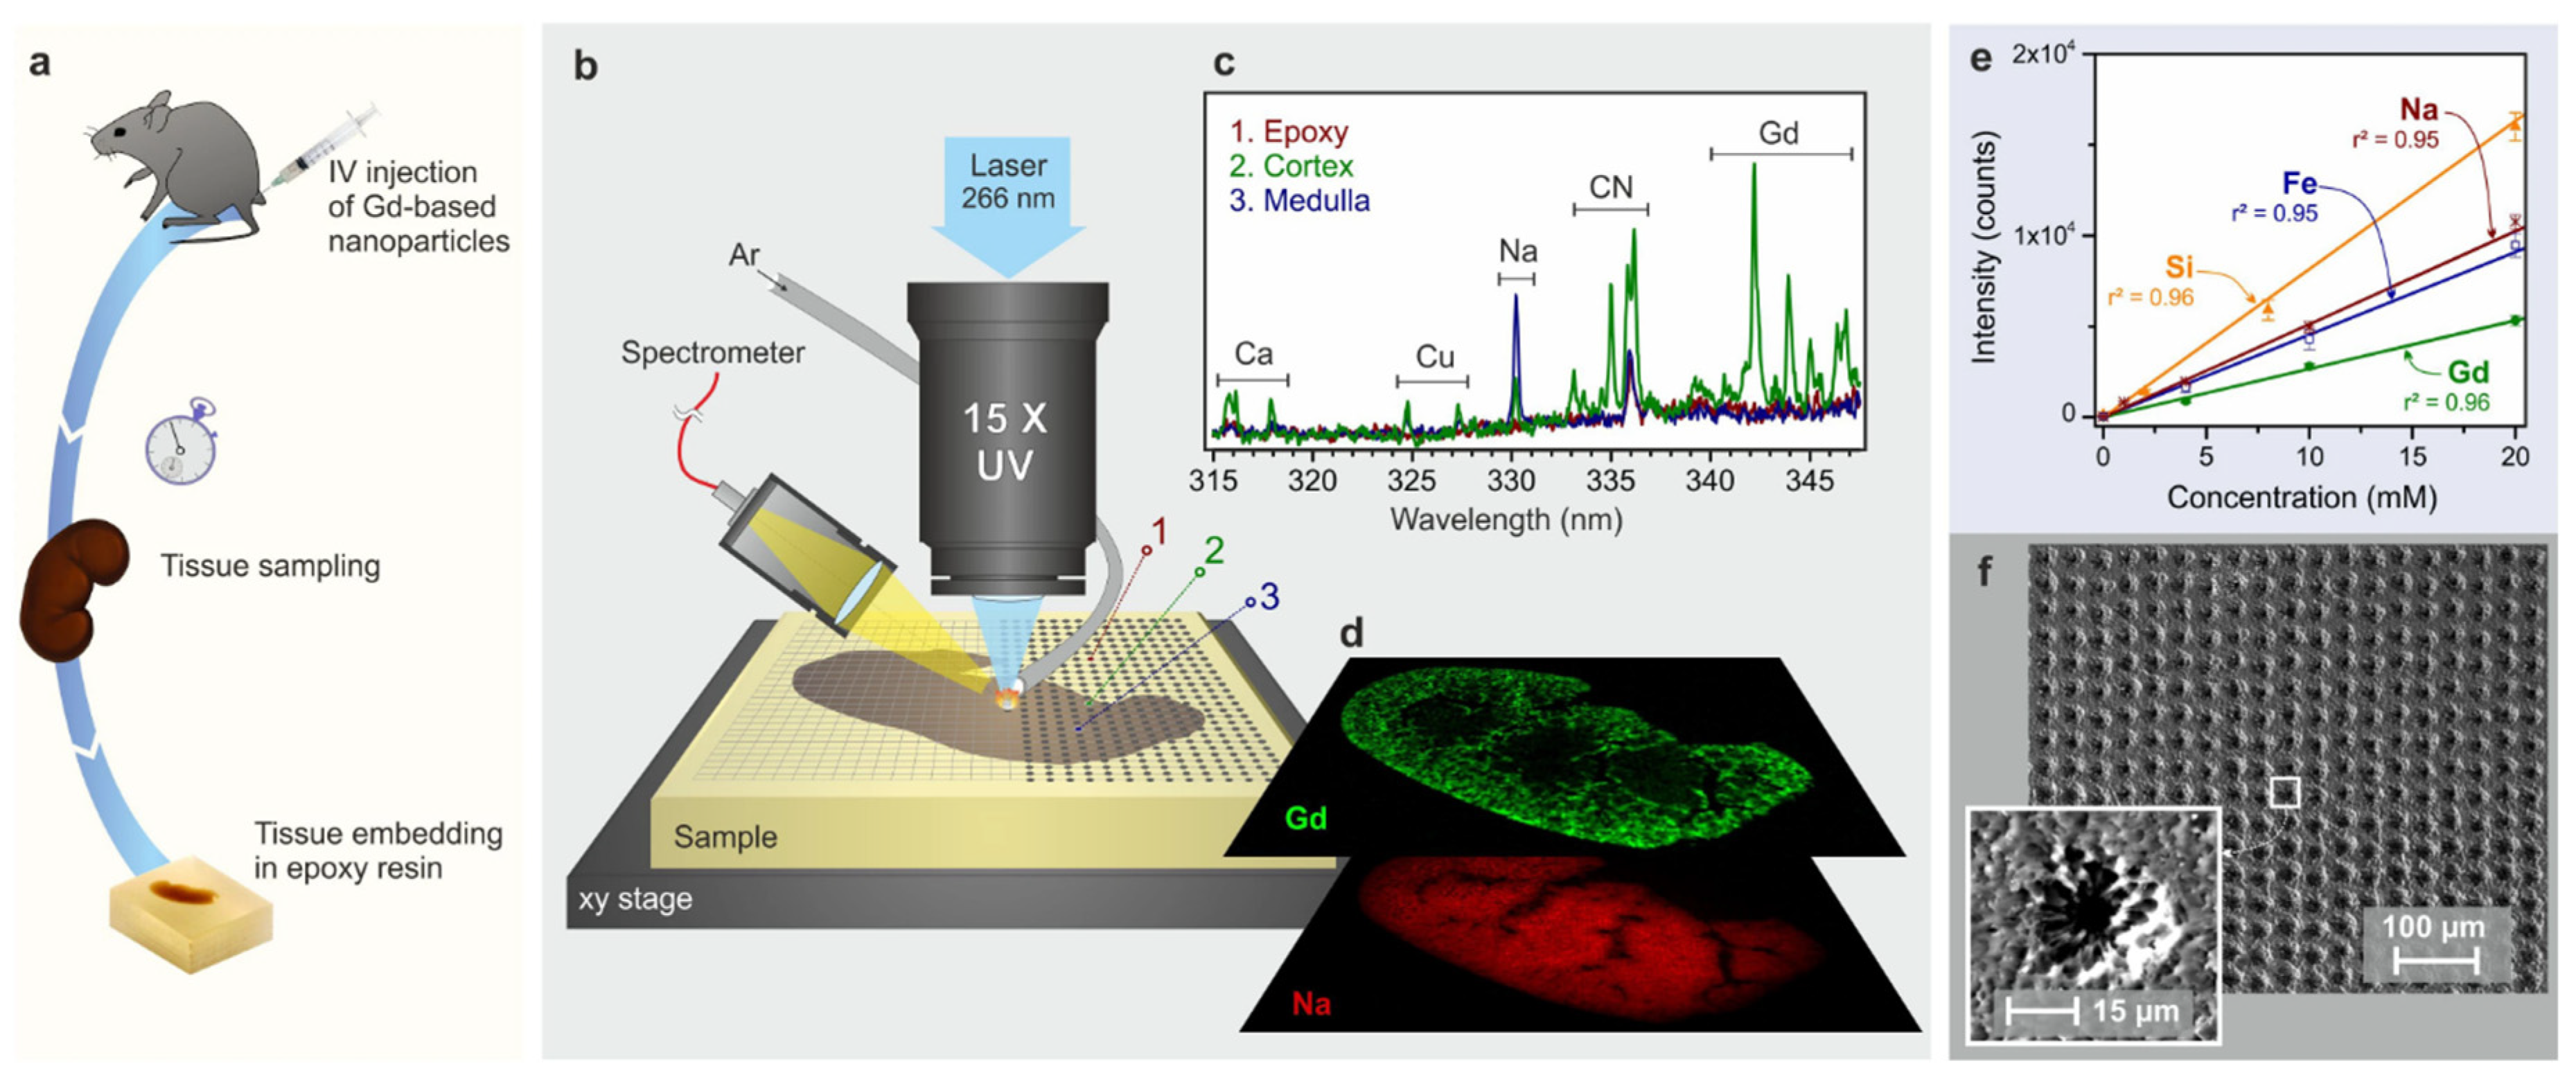
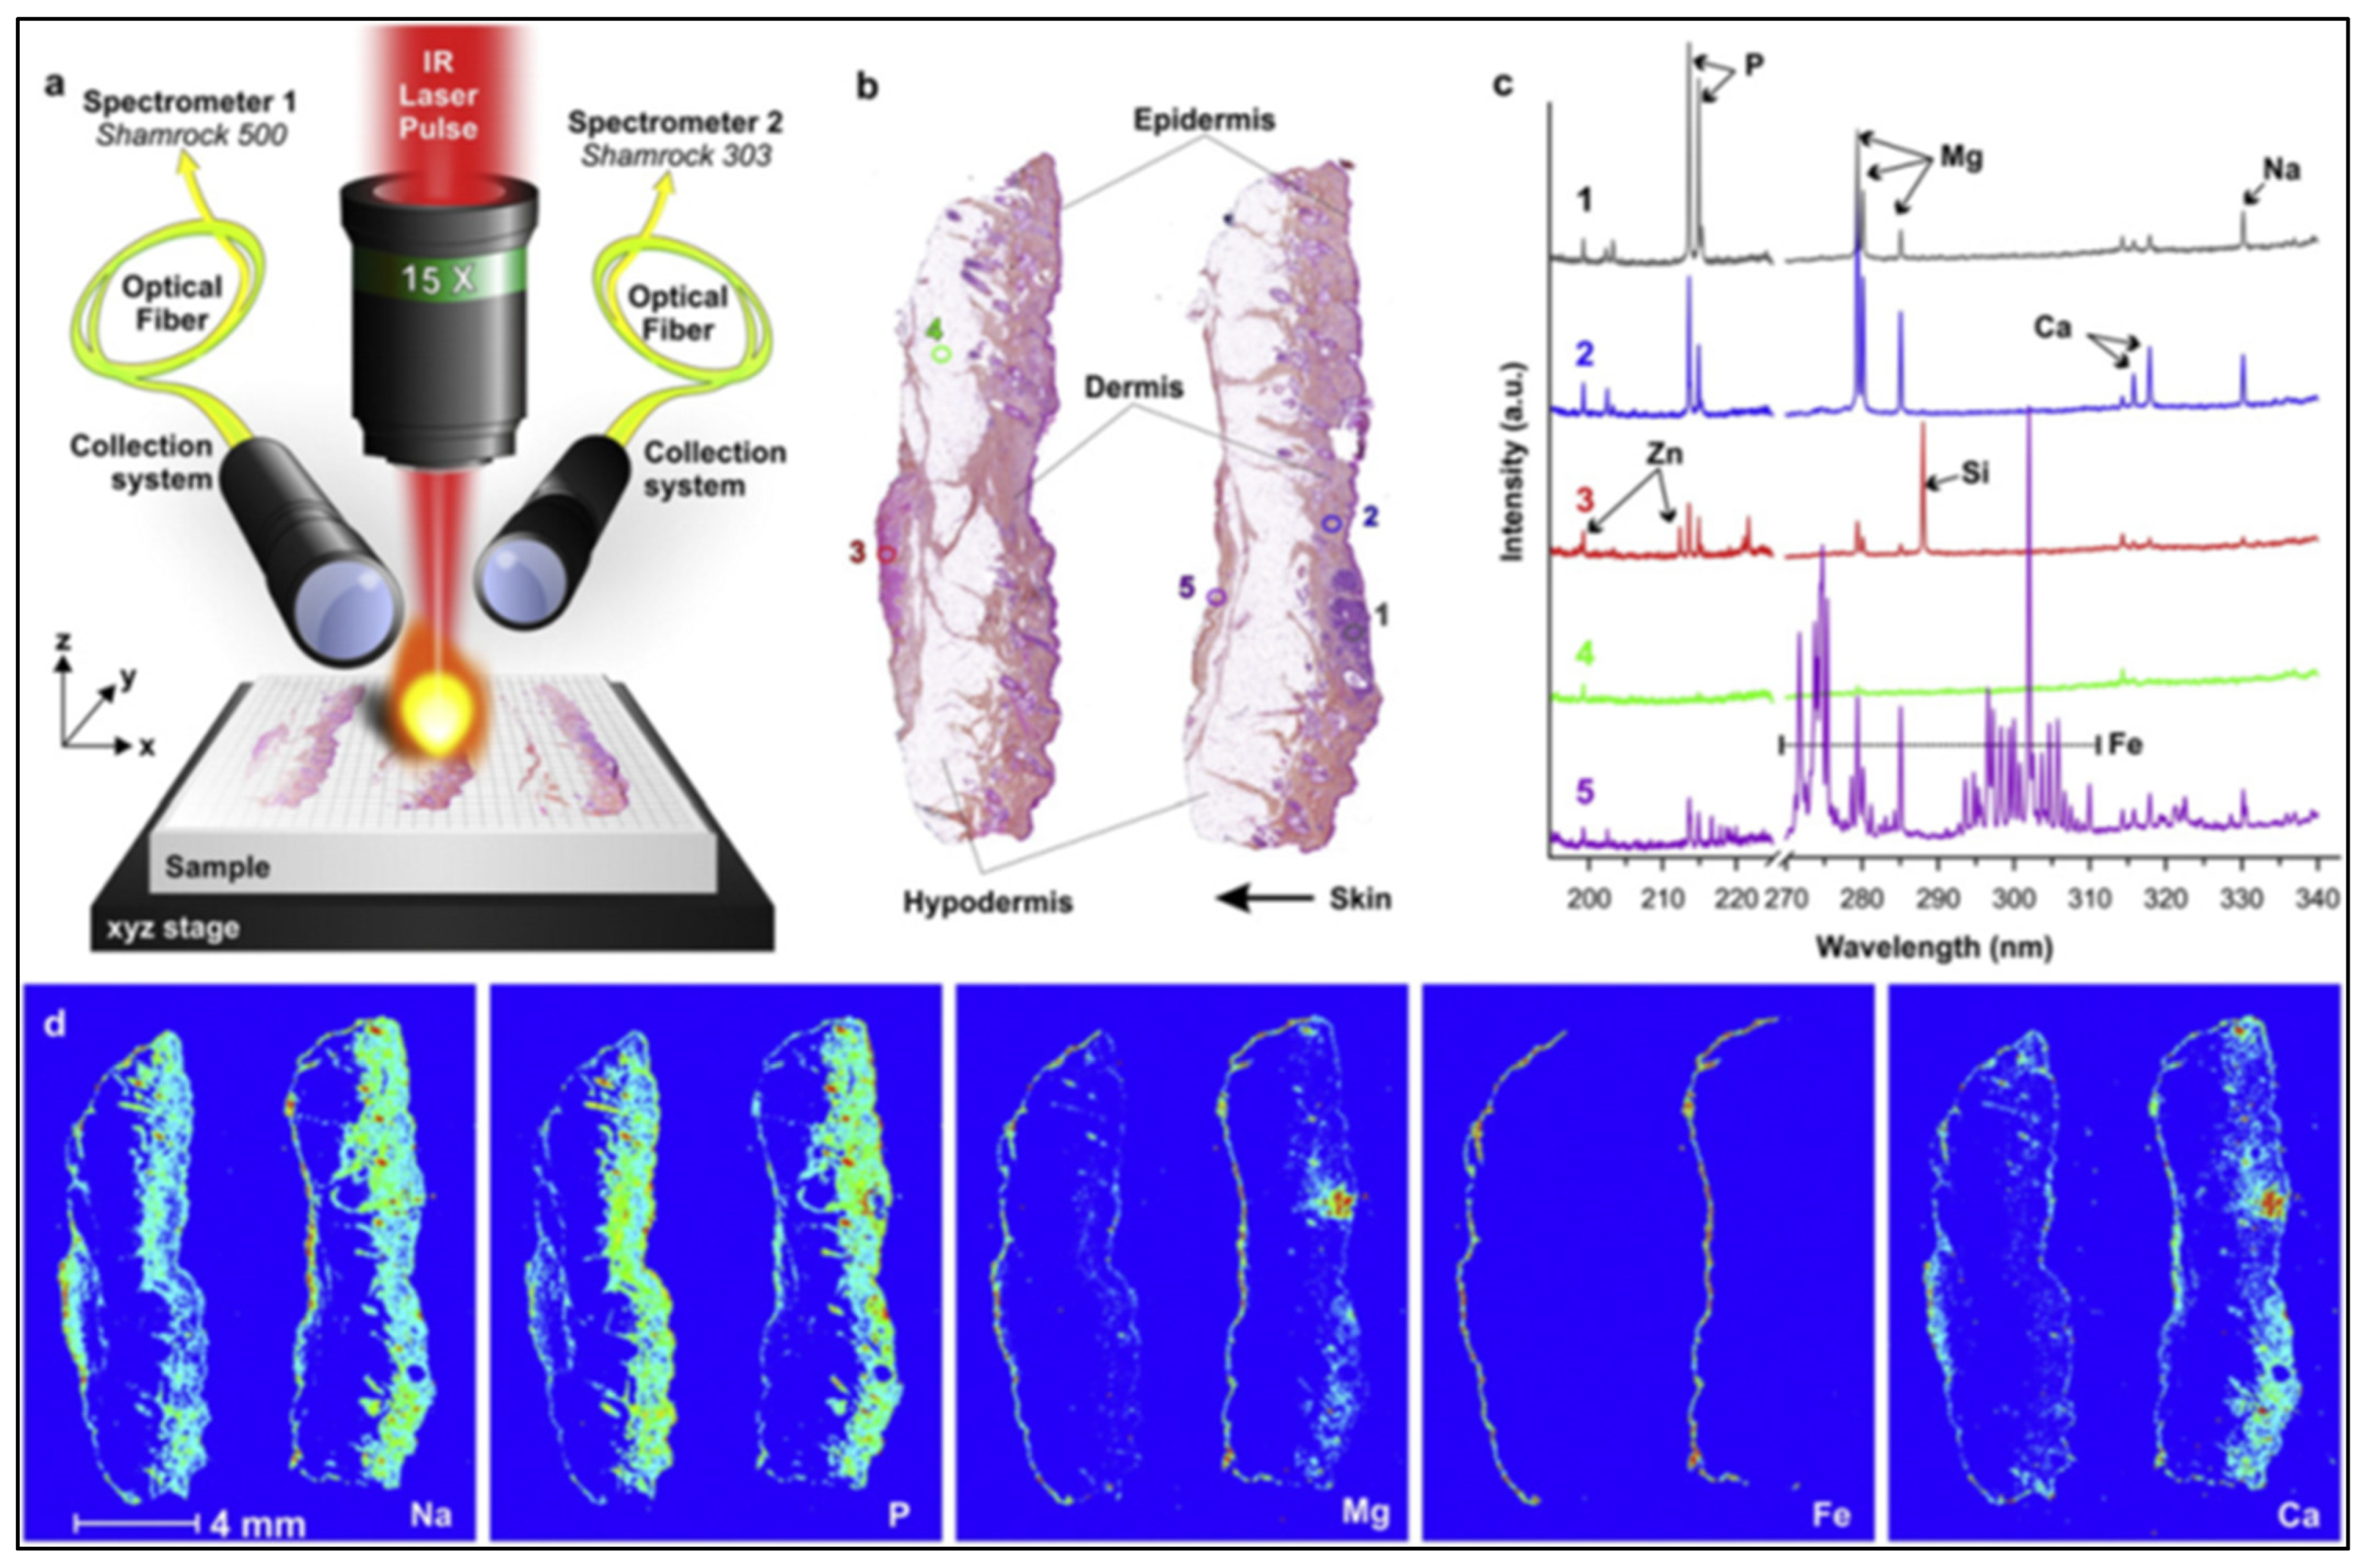
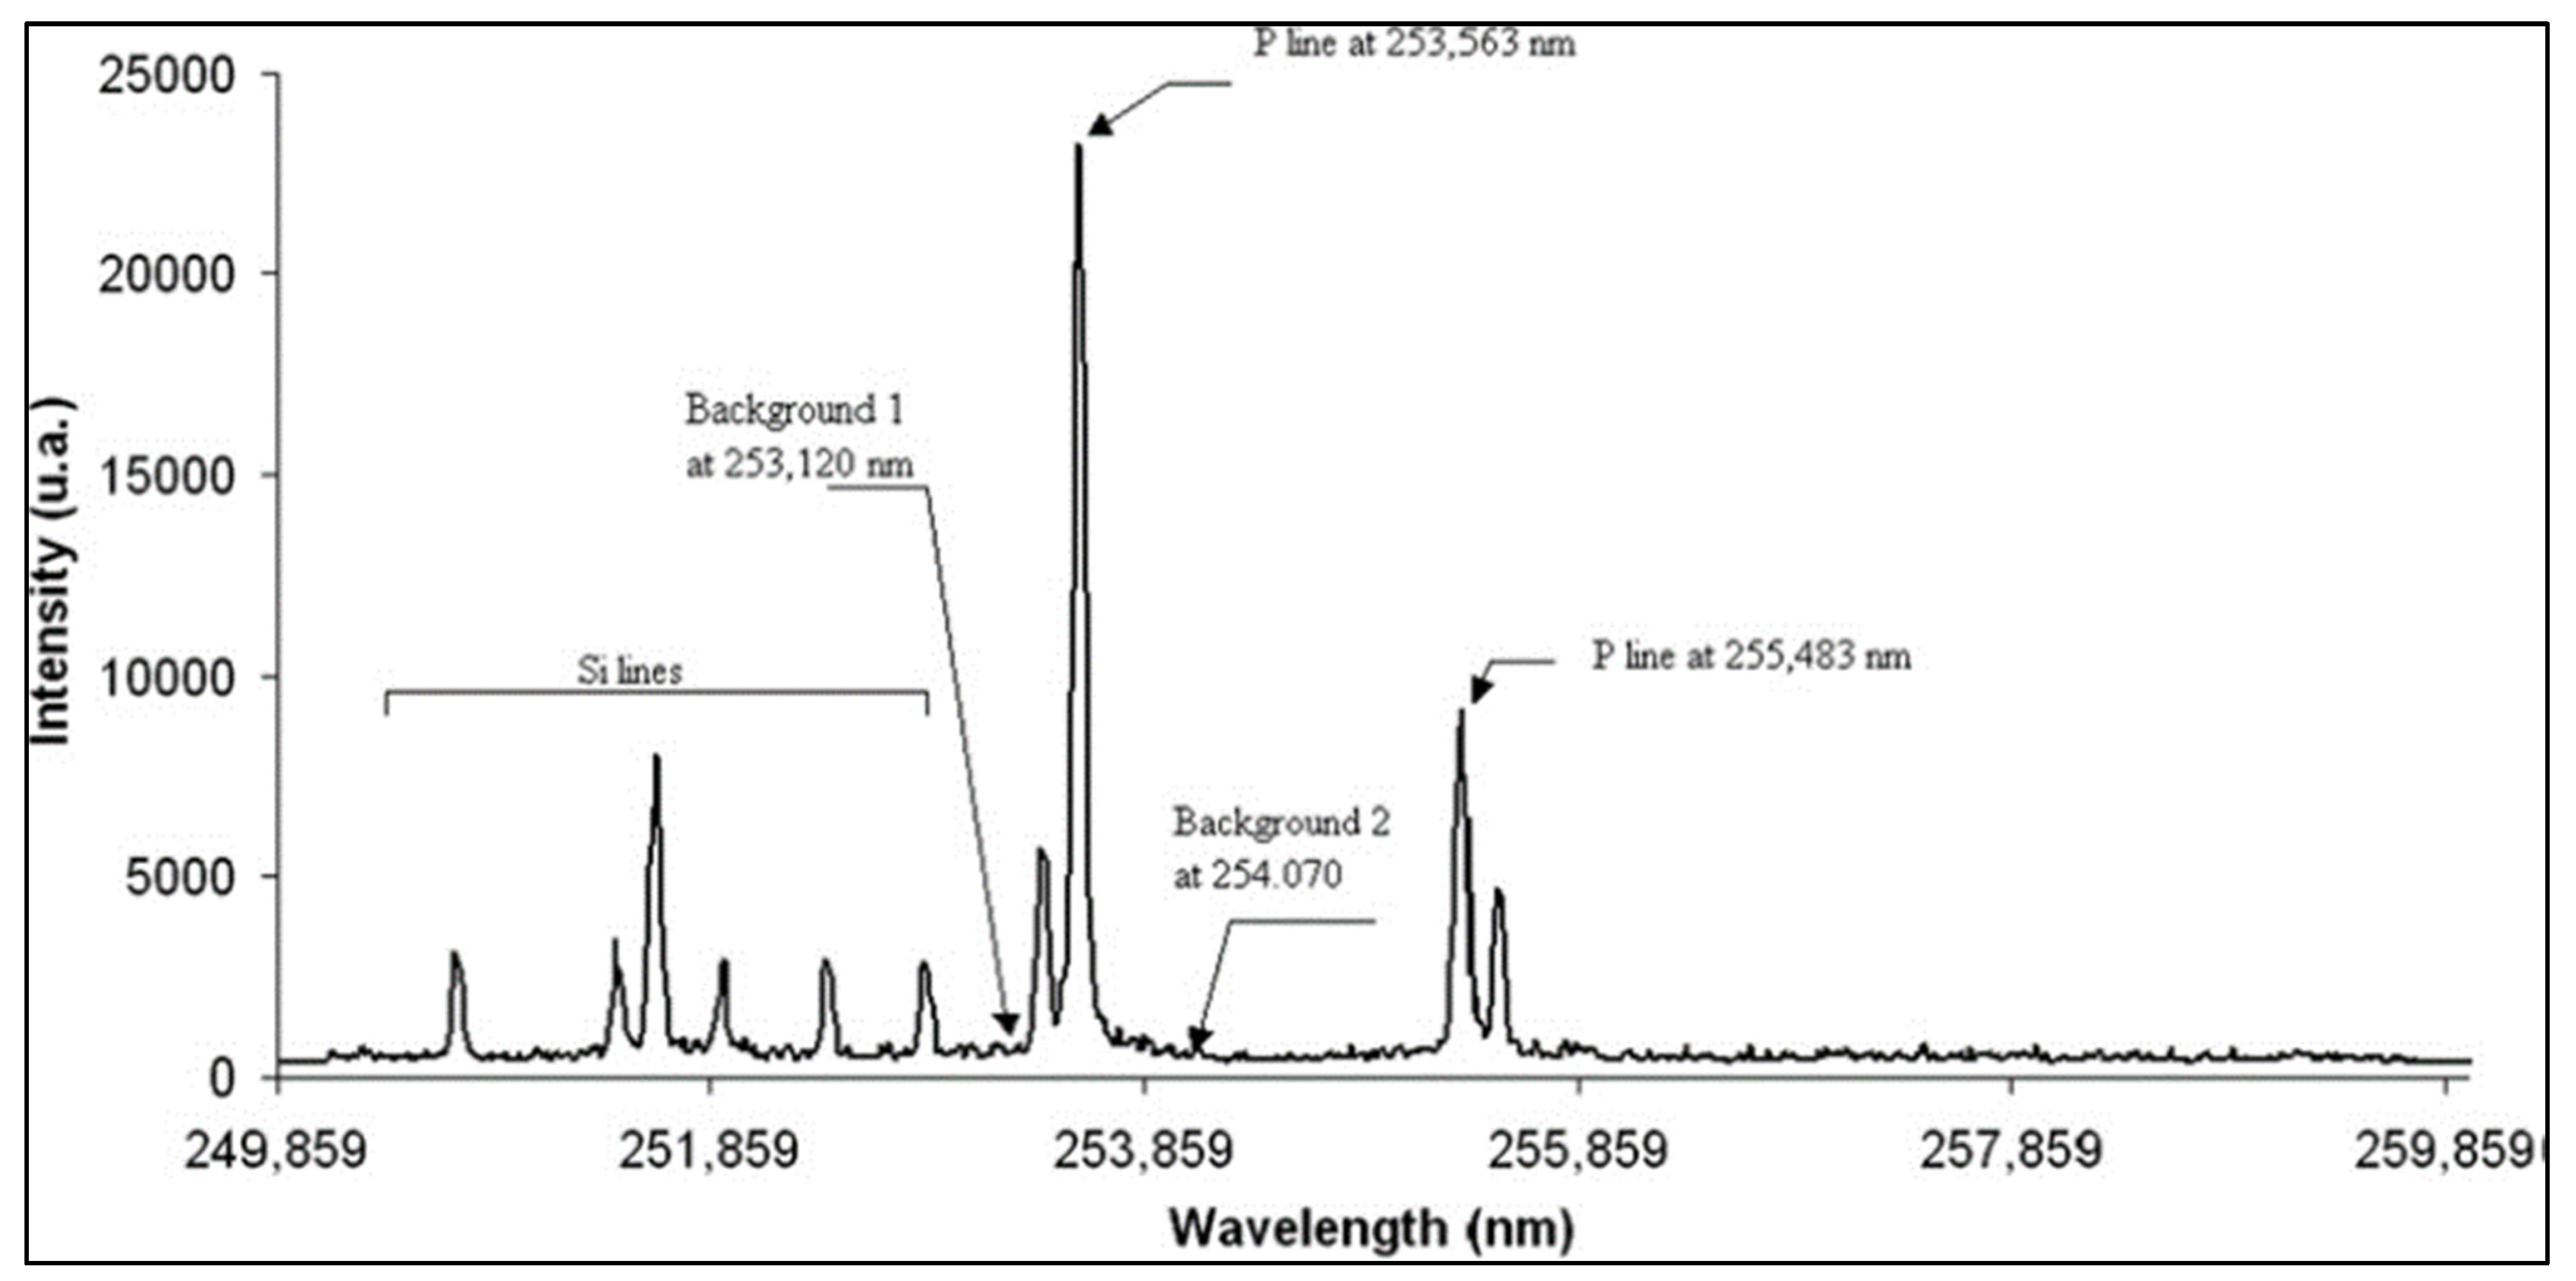
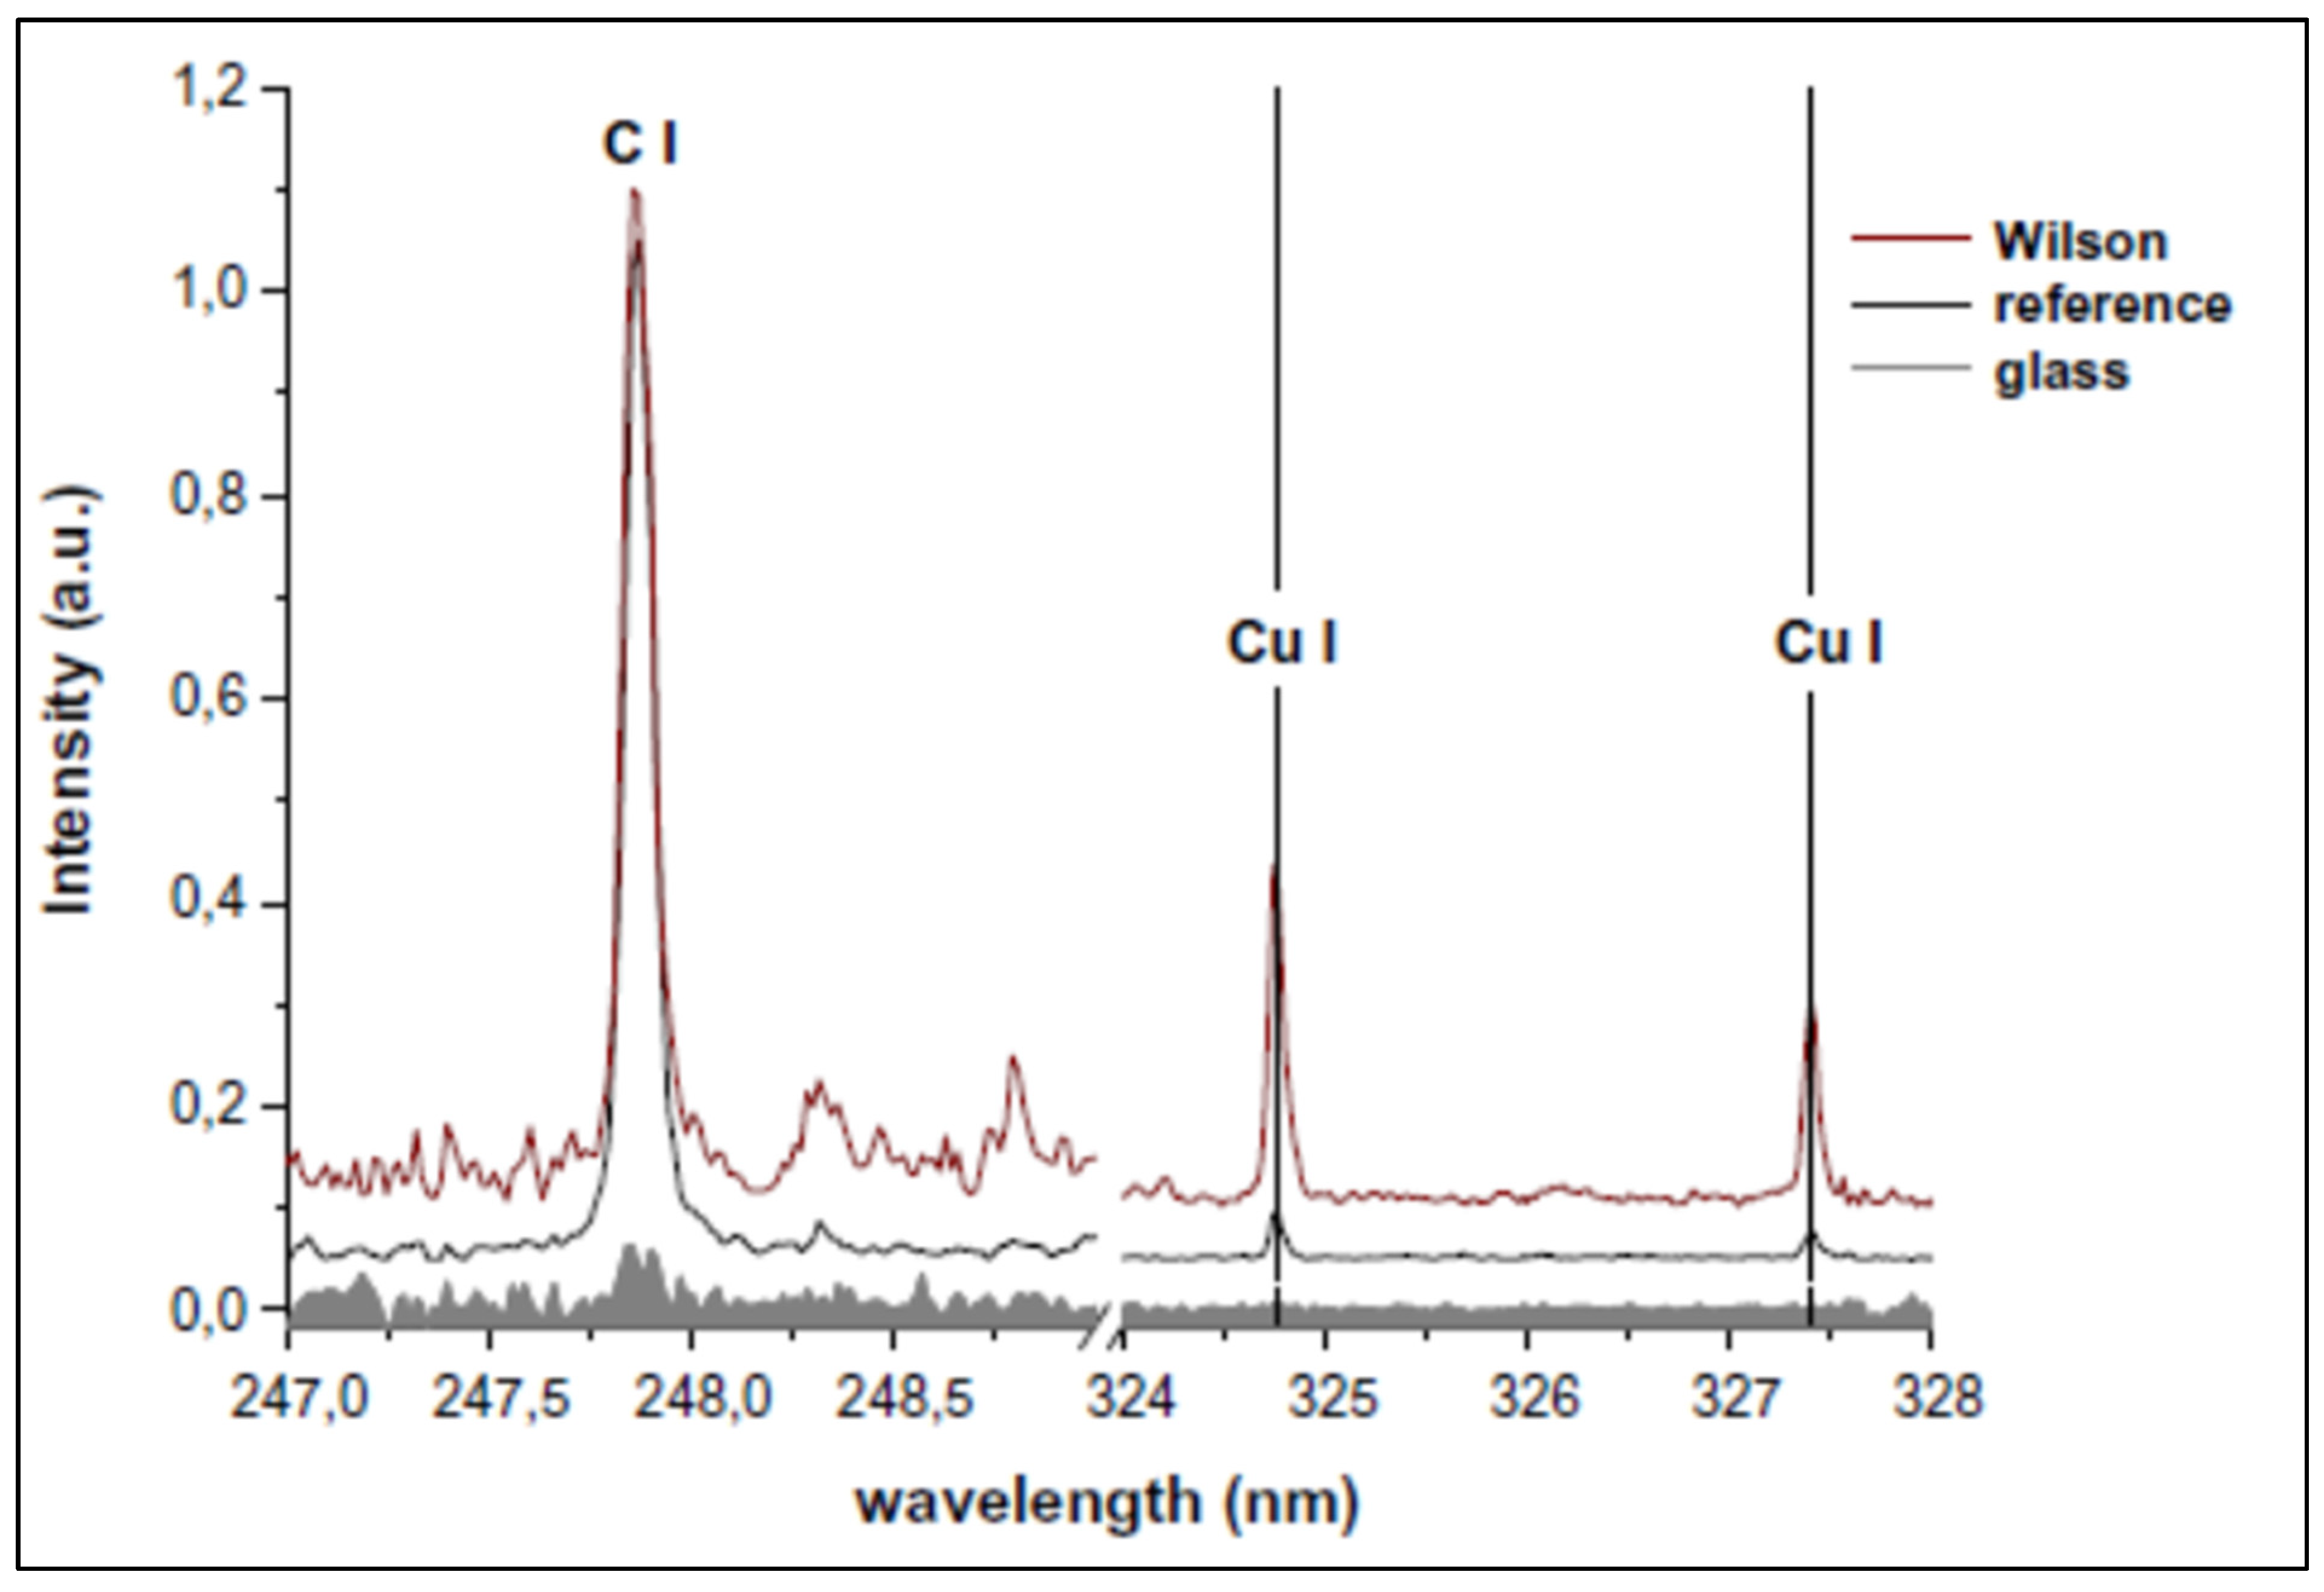
Table 1.
Comparison of trace element concentrations in several tissues.
| Type of Tissue 1 | Iron (μg/g) | Copper (μg/g) | Zinc (μg/g) | |||
|---|---|---|---|---|---|---|
| Wet | Dry | Wet | Dry | Wet | Dry | |
| Secondary live tumour | 68 | 413.3 | 2.0 | 17.0 | 1028.5 | 333.4 |
| Normal controls | 218 | 160 | 4.8 | 44.2 | 2281.5 | 302 |
| Cancer controls | 238 | 151 | 4.7 | 54.8 | 4364 | 338.1 |
| Surrounding non-tumour tissue | 268 | --- | 5.4 | --- | 3395.1 | --- |
1 Values for iron, copper, and zinc for some human tissues (figure reproduced from the original paper [28]).
Table 2.
Summary of selected experiments that employed statistical methods.
| Year | Author | Statistical Methods 1 | Objective | |
|---|---|---|---|---|
| Unsupervised | Supervised | |||
| 2008 | Meur et al. [42] | MLR | Detection of DNA by measurements of P spectral line. | |
| 2009 | Yueh et al. [5] | PCA CA HCA | PLSDA NNA | Differentiation between normal tissues from different organs by analyzing intensities of spectral lines from 16 elements. |
| 2010 | El-Hussein et al. [6] | ANOVA | Detection of cancer in breast and colorectal tissue samples by the measurement of the intensity of the Ca and Mg spectral lines. | |
| 2013 | Grolmusova et al. [7]. | ANOVA | Detection of Wilson’s disease by comparison of Cu/C ratios for the intensities of spectral lines. | |
| 2013 | Kanawade et al. [39] | PCA | LDA | Differentiation of tissues by analysis of C, H, Cl, Na, K, and N spectra. |
| 2015 | Moon et al. [36] | PCA | LDA | Detection of melanoma by measurements of Mg and Ca spectral lines. |
| 2016 | Mehari et al. [41] | PCA | LDA | Differentiation of soft tissues (fat, muscle, nerve, and skin) by comparison of spectral line intensities. |
| 2018 | Prochazca et al. [52] | SOM | Classification of bacterial strains by studying their complete spectral fingerprint. | |
| 2021 | Lin et al. [53] | PCA | Differentiation of lung tumor and boundary tissues. | |
1 A list of acronyms is shown in Table 3.
Table 3.
List of acronyms for the statistical methods employed in Table 2.
Table 3.
List of acronyms for the statistical methods employed in Table 2.
| Acronym 1 | Definition |
|---|---|
| ANOVA | Analysis of Variance |
| CA | Cluster Analysis |
| HCA | Hierarchical Cluster Analysis |
| LDA | Linear Discriminant Analysis |
| MLR | Multivariate Linear Regression |
| NNA | Neural Network Analysis |
| PCA | Principal Components Analysis |
| PLSDA | Partial Least Square Discriminant Analysis |
| SOM | Self Organizing Maps |
1 In alphabetical order.
Table 4.
Spectral lines studied in biological samples.
| Element | Spectral Line 1 (nm) |
|---|---|
| Ca | 422.673, 396.847, 431.865 |
| Al | 309.270, 396.152 |
| Fe | 371.993, 404.581 |
| Cu | 324.754, 327.390 |
| Na | 330.237, 588.995, 589.592 |
| Zn | 330.294, 307.206, 307.590 |
| Cr | 357.869 |
| Mg | 279.553, 285.213 |
| K | 404.414, 404.721, 766.491, 769.898 |
| P | 255.328, 253.565 |
| C | 247.857 |
| Li | 670.796 |
| Ni | 341.476, 352.454 |
| Mo | 317.035 |
| Sn | 603.770 |
| Sc | 498.345 |
1 Table reproduced from the original paper [5].
Disclaimer/Publisher’s Note: The statements, opinions and data contained in all publications are solely those of the individual author(s) and contributor(s) and not of MDPI and/or the editor(s). MDPI and/or the editor(s) disclaim responsibility for any injury to people or property resulting from any ideas, methods, instructions or products referred to in the content. |
© 2024 by the authors. Licensee MDPI, Basel, Switzerland. This article is an open access article distributed under the terms and conditions of the Creative Commons Attribution (CC BY) license (https://creativecommons.org/licenses/by/4.0/).
Share and Cite
MDPI and ACS Style
Manrique, J.; Garrido, P.; Velasco, J. Laser-Induced Breakdown Spectroscopy in Biological Samples: A Review of Experiments with Soft Tissues. Atoms 2024, 12, 21. https://doi.org/10.3390/atoms12040021
AMA Style
Manrique J, Garrido P, Velasco J. Laser-Induced Breakdown Spectroscopy in Biological Samples: A Review of Experiments with Soft Tissues. Atoms. 2024; 12(4):21. https://doi.org/10.3390/atoms12040021
Chicago/Turabian StyleManrique, Javier, Pedro Garrido, and Joaquín Velasco. 2024. "Laser-Induced Breakdown Spectroscopy in Biological Samples: A Review of Experiments with Soft Tissues" Atoms 12, no. 4: 21. https://doi.org/10.3390/atoms12040021
Note that from the first issue of 2016, this journal uses article numbers instead of page numbers. See further details here.