Review

Laboratory Hydrogen-Beta Emission Spectroscopy for Analysis of Astrophysical White Dwarf Spectra

by
Christian G. Parigger
1,*,
Kyle A. Drake
1,
Christopher M. Helstern
1 and
Ghaneshwar Gautam
2
1
Physics and Astronomy Department, University of Tennessee Space Institute, University of Tennessee, Center for Laser Applications, 411 B.H. Goethert Parkway, Tullahoma, TN 37388-9700, USA
2
Physics Department, Fort Peck Community College, 605 Indian Avenue, Poplar, MT 59255, USA
*
Author to whom correspondence should be addressed.
Atoms 2018, 6(3), 36; https://doi.org/10.3390/atoms6030036
Submission received: 29 May 2018 / Revised: 27 June 2018 / Accepted: 28 June 2018 / Published: 1 July 2018
(This article belongs to the Special Issue Stark Broadening of Spectral Lines in Plasmas)

Abstract

:
This work communicates a review on Balmer series hydrogen beta line measurements and applications for analysis of white dwarf stars. Laser-induced plasma investigations explore electron density and temperature ranges comparable to white dwarf star signatures such as Sirius B, the companion to the brightest star observable from the earth. Spectral line shape characteristics of the hydrogen beta line include width, peak separation, and central dip-shift, thereby providing three indicators for electron density measurements. The hydrogen alpha line shows two primary line-profile parameters for electron density determination, namely, width and shift. Both Boltzmann plot and line-to-continuum ratios yield temperature. The line-shifts recorded with temporally- and spatially-resolved optical emission spectroscopy of hydrogen plasma in laboratory settings can be larger than gravitational redshifts that occur in absorption spectra from radiating white dwarfs. Published astrophysical spectra display significantly diminished Stark or pressure broadening contributions to red-shifted atomic lines. Gravitational redshifts allow one to assess the ratio of mass and radius of these stars, and, subsequently, the mass from cooling models.

1. Introduction

The investigation of spectral characteristics from stellar objects leads to an understanding of their characteristics. Measurement of sun spectra allows one to infer surface temperature. Hydrogen Balmer series absorption spectra are communicated in Rowland tables [1,2] that map the sun. The equivalent widths [3] of the hydrogen alpha line, H α , hydrogen beta line, H β , and hydrogen gamma line, H γ from the sun amount to 0.402 nm, 0.368 nm, and 0.286 nm, respectively. White dwarf spectra that show hydrogen lines are designated as DA stars. The white dwarf (WD) companion to Sirius A, designated as Alpha Canis Majoris B ( α CMa B ) [4], reveals significant hydrogen spectra at a temperature of 26 kK [5]. For comparison with the sun spectra, H γ of Sirius B shows an equivalent width [6] of 3.1 nm.
Laboratory measurements with so-called optical emission spectroscopy in a high-current arc [7,8] suggest that observed gravitational redshifts in WD spectra [9,10] may require corrections due to contributions from Stark-effect caused redshifts [11]. Radiative-transfer considerations [12] however confirm that the Stark or pressure shifts have no material or substantial effect on the measurement of gravitational redshifts. With an observed redshift uncertainty between 5 and 10 km/s [12], the pressure shifts are smaller than the error margins. A recent discussion [13] elaborates on the computation of Stark line profiles in successive layers of an WD atmosphere, and concludes that the Stark effect does not cause substantial redshifts.
Laser-induced breakdown spectroscopy [14,15] measures optical emission from the micro-plasma, and the first few Balmer series hydrogen lines can be utilized to determine electron density and temperature [16,17,18,19,20,21,22,23,24,25]. The generalized theory of Stark broadening in the analysis of laser-induced plasma experiments [16,17] show hydrogen beta, H β , profiles at densities of up to ∼8 × 10 17 cm 3 . For higher densities and from a theory point-of-view, quadrupole and higher order effects need to be considered [18,19,20]. Extensive hydrogen modeling [21], including recent systematic experimental efforts [22,23], and detailed analysis of Balmer series lines including the H β peak separation [24,25] reflect the level of knowledge about laboratory plasma. In view of astrophysical WD absorption data [5], laboratory spectra and analysis are essential for determination of astrophysical WD characterization. Experiments utilize frequently other macroscopic measurement methods including photography [26]. H β is of interest due to providing better accuracy [27,28,29] than H α for an electron density of the order of 10 17 cm 3 .
The analysis of measurements and the theory of Balmer-series hydrogen lines and broadening phenomena [27,28,29,30,31,32,33,34,35,36,37] show significant progress towards understanding of a variety of laboratory and astrophysical conditions. Plasma spectroscopy research [27,28,29,30,31] and extensive line shape considerations [32,33,34,35,36,37] show substantial efforts towards collecting experimental evidence and computational modeling of hydrogen lines. Plasma emission spectra recorded in the laboratory [8] are analyzed, and subsequently, absorption spectra are determined to fit astrophysical WD spectra [38,39,40]. Laser-induced breakdown in a laboratory cell [17,22,23] can generate conditions suitable for developing diagnosis of DA type white dwarfs.
A generally accepted method for the determination of the mass of WDs is based on gravitational redshifts [10]. In this approach [41], the mean gravitational redshift, v g , is determined first to find the mass-radius ratio,
v g = c Δ λ λ = G c M R ,
where c and G are the speed of light and gravitational constant, respectively. The symbols M and R indicate, respectively, the mass and radius of the WD. The redshift, Δ λ , at the wavelength, λ , of the selected line is usually extracted by fitting a line shape to recorded absorption profiles.
The gravitational redshift is commonly expressed in units of km/s, with WD mass, M, and radius, R, in solar units,
v g [ km / s ] = 0.636 M R .
From effective temperature and from evolutionary cooling models [42], the average mass of 449 non-binary DA stars [41] equals 0.65 times the mass of the sun. Details of WD spectra are further investigated by utilizing sufficiently bright light sources for direct measurement of plasma absorption spectra [43,44].
Regarding Sirius B, analysis of Extreme Ultraviolet Explorer data [45] concludes with a set of parameters to describe this white dwarf Sirius A companion. Table 1 displays the inferred [45] important characteristics, namely, temperature, gravity, mass, and radius.
The estimate of the electron density, N H I , of the interstellar hydrogen, H I column to Sirius B, is usually quoted [45] as a logarithm, log N H I = 17.72 ± 0.1 , or N H I = ( 5.25 ± 1.25 ) × 10 17 cm 2 .
The Sirius B gravitational redshift, v Sirius B , value is according to previous measurement of primarily H α [9], v Sirius B = 89 ± 16 km / s . A gravitational redshift of 89 km/s implies a wavelength-shift of 0.144 nm at H β , and 0.195 nm at H α .
Measurements from the Hipparcos satellite, operated between 1989 and 1993 by the European Space Agency, indicate slightly different parameters for Sirius B when compared to the data in Table 1. Table 2 summarizes the measurements for Sirius B and Procyon B based on Hipparcos parallaxes [46].
Knowledge of the WD mass of course is important to determine whether the mass is close to the Chandrasekhar limit of 1.44× solar mass [47]. Additionally, a WD in a binary star configuration that exists within the Roche limit [48] of the larger companion may contribute sufficient mass to lead to a supernova.
Typical sizes of WDs are comparable to the earth but with a mass similar to that of the sun. Investigations of H β widths, peak separations, and central dip-shifts in the laboratory further elucidate an understanding of white dwarf stars. This work focuses on various aspects of hydrogen Balmer series measurements of laser-induced plasma, including recently communicated findings in the laboratory [22,23] for conditions encountered for DA type WDs. Laser-induced plasma experiments consistently confirm H β central dip-shifts.

2. Results

The laboratory results of the hydrogen beta line, H β , and hydrogen alpha line, H α , of the Balmer series are reviewed first. Selected data from the WD Montreal data base [5] are communicated along with approaches that are common in the astrophysics communities. However, considering the vast variety of scientific papers devoted to the study of astrophysical objects in the optical region, this review presents aspects of laboratory H β spectroscopy and its application to white dwarf stars.

2.1. Laboratory Experiments

Line-of-sight and radially resolved data, obtained by Abel inversion, are modeled using computed asymmetric profiles [34]. Detailed experiments on H β emission spectroscopy [23] explore the radial distribution of laser-induced plasma in hydrogen gas.
The determination of electron density, N e , from the hydrogen beta line frequently employs well-established empirical identities [21,24,25],
N e [ cm 3 ] = Δ w H β [ nm ] 4.8 1.46808 × 10 17 ,
log N e [ cm 3 ] = 16.661 + 1.416 log Δ λ ps [ nm ] ,
or utilizes results from generalized line shape theory [16] in analysis of laser-induced laboratory plasma [17]. The fitted asymmetric H β profiles indicate central dip-shifts. A systematic study [22] confirms H β central wavelength shifts and relates the central dip-shift [22,49,50], Δ δ ds , to electron density, N e ,
Δ δ ds [ nm ] = 0.14 N e [ cm 3 ] 10 17 0.67 ± 0.03 .
The empirical formulae for determination of electron density are summarized in Appendix A. Typical H β and H α spectra in Appendix B illustrate the central dip-shift and widths. Recently communicated central dip-shifts [22] apply for the N e range of (2–20) × 10 17 cm 3 , thereby extending the previous electron density range for Equation (5), obtained from arc and electromagnetically-driven shock tube results [49,50] that are communicated in graphical representation of central dip-shift versus electron density.
For different time delays, τ , from plasma initiation, Figure 1 and Figure 2a display recorded and fitted line-of-sight and Abel-inverted spectra for hydrogen gas in a cell at a pressure of 1.06 × 10 5 Pa, and Figure 2b shows the center H β portion at a cell pressure of 1.32 × 10 5 Pa.
The line shape of the hydrogen beta line, H β , due to the Stark effect [51] is described by a Holtsmark profile when considering ion broadening only [52]. However, when accounting for various line broadening phenomena [53] such as effects from Debye shielding, ion and electron broadening, and ion–ion correlations [27,28], the hydrogen beta line profile shows modified central dip and Lorentz line shape asymptotic behavior in the wings. However, deviations from Lorentz line shapes may become noticeable due to incomplete collisions that are not addressed in impact broadening models. These incomplete collisions occur precisely for frequency detuning of the order of several line-widths. Moreover, from a theory point of view, there is need to consider quadrupole and higher order effects for electron densities of the order of 10 18 cm 3 [18,19,20]. Consideration of asymmetries and dip-shifts further alter the H β line profile. Appendix C illustrates comparisons of experimental laboratory hydrogen alpha data with Holtsmark, Doppler, and Lorentz line shapes.

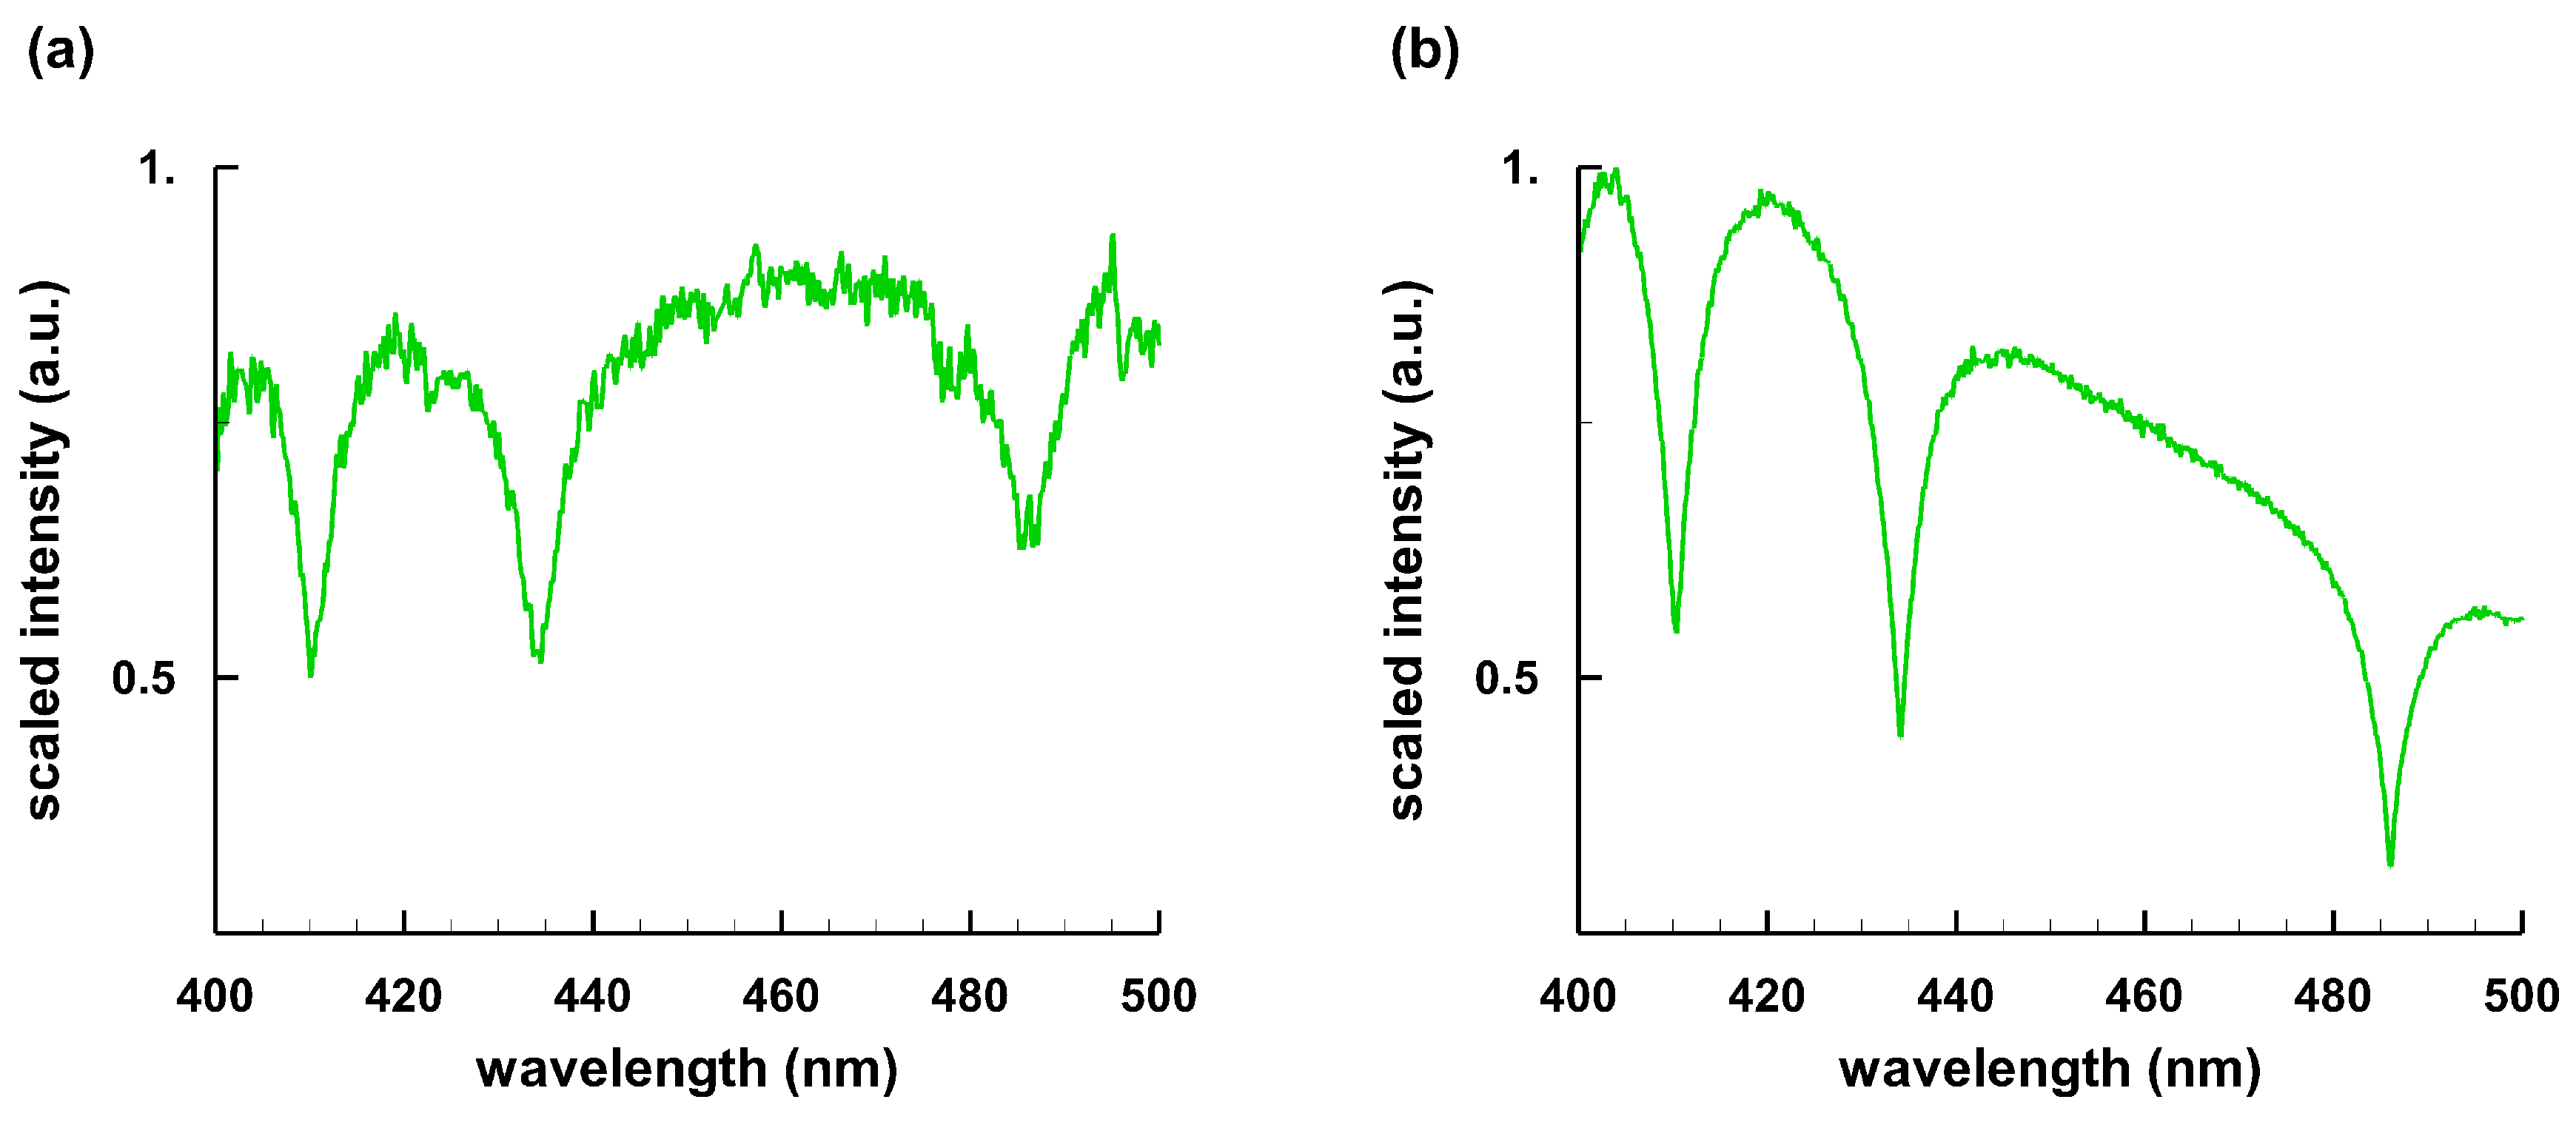
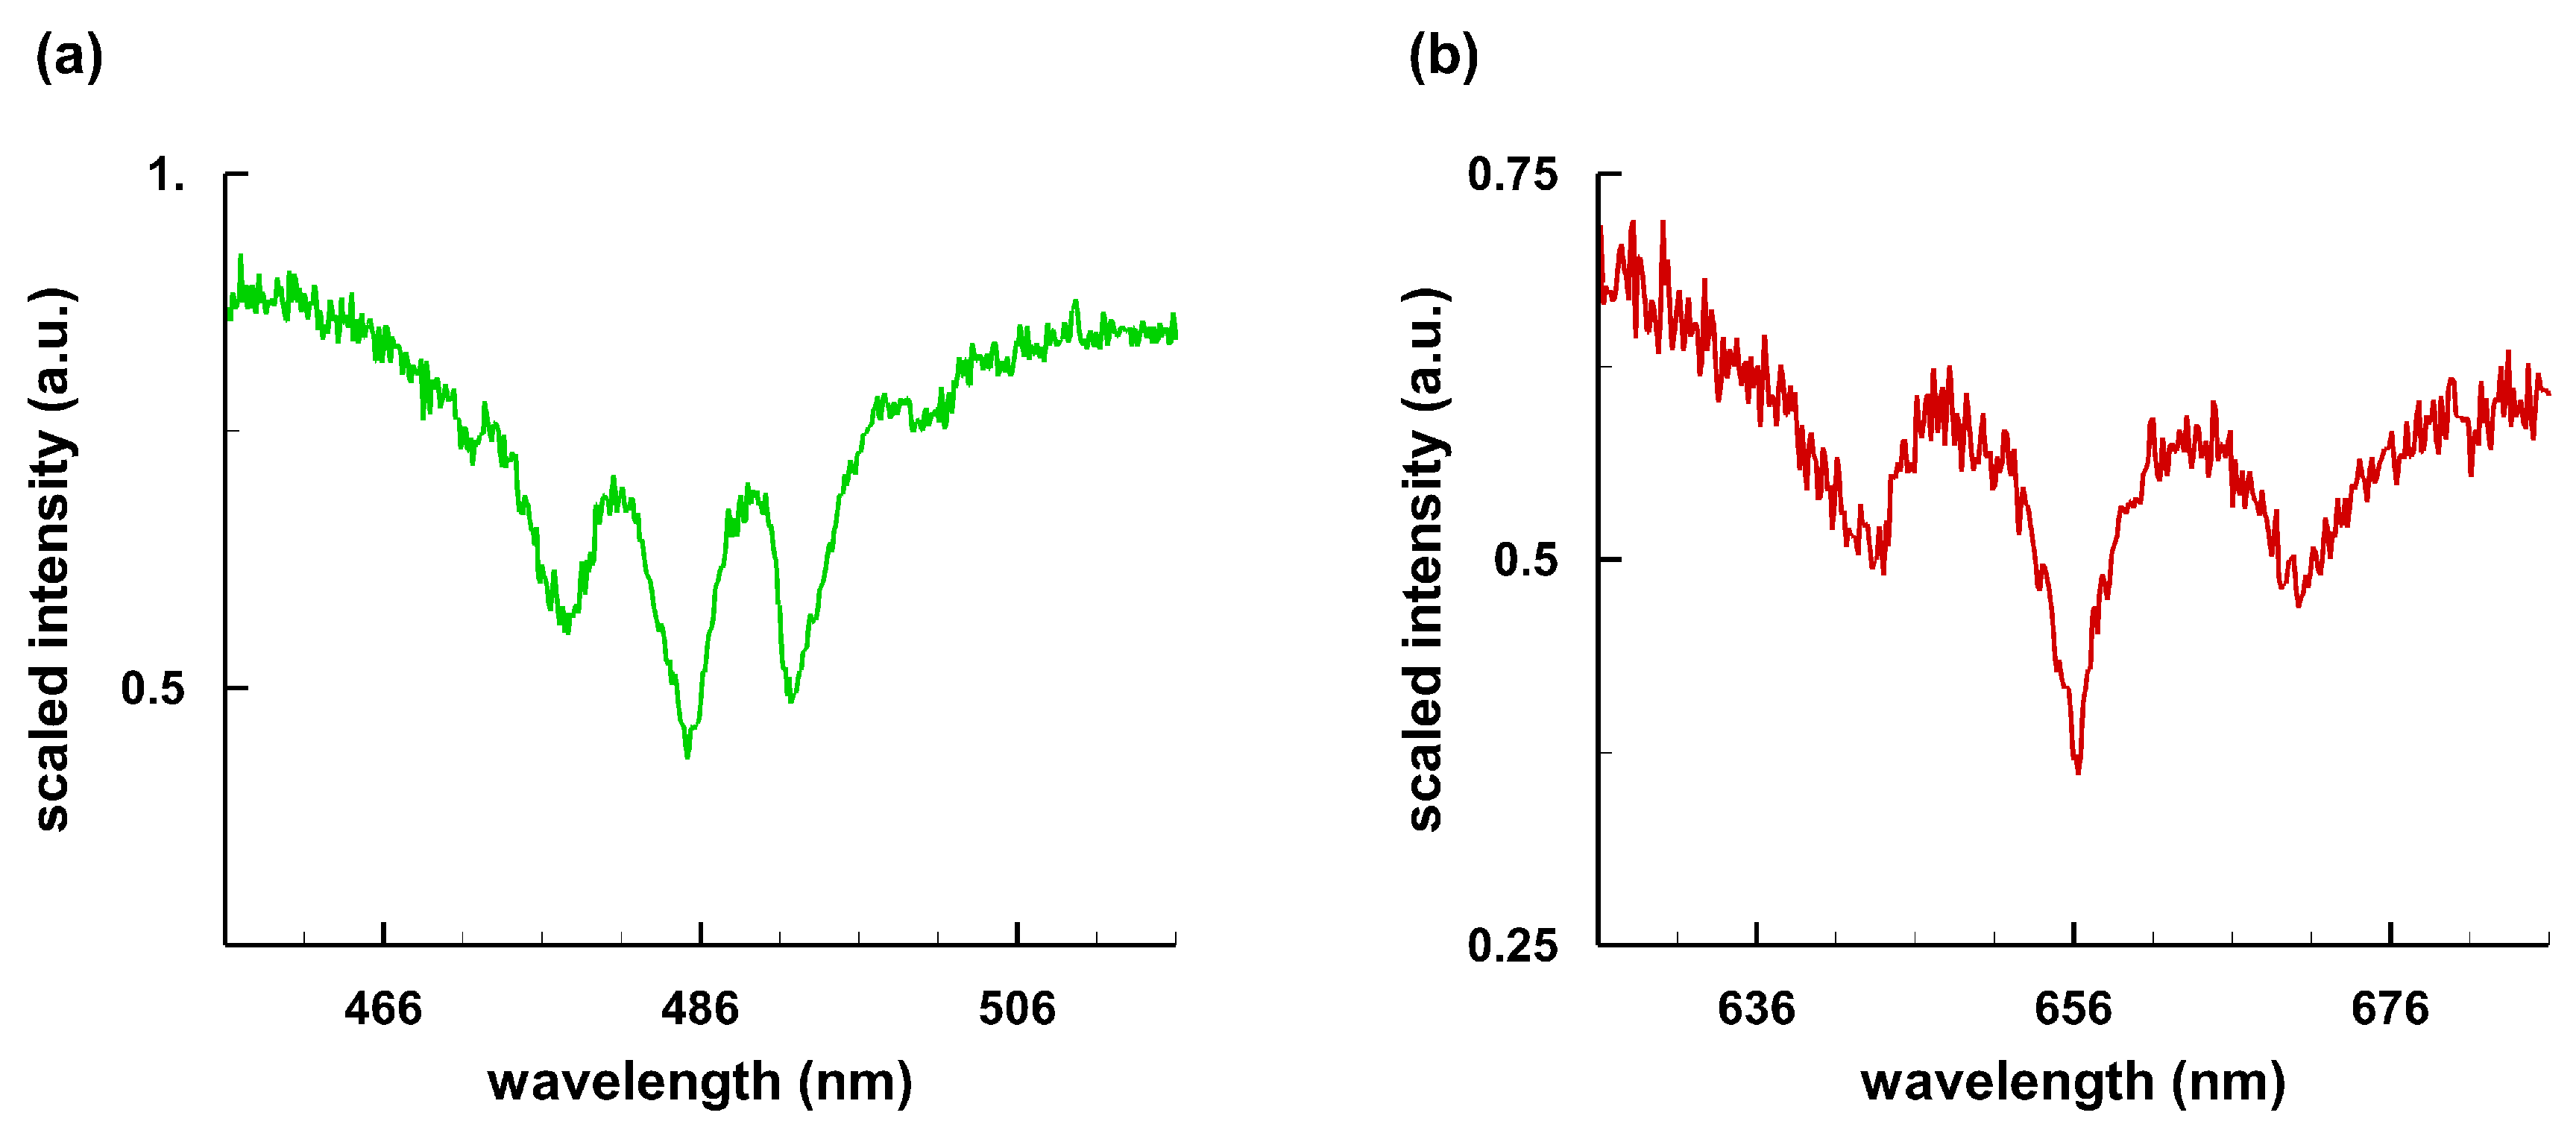
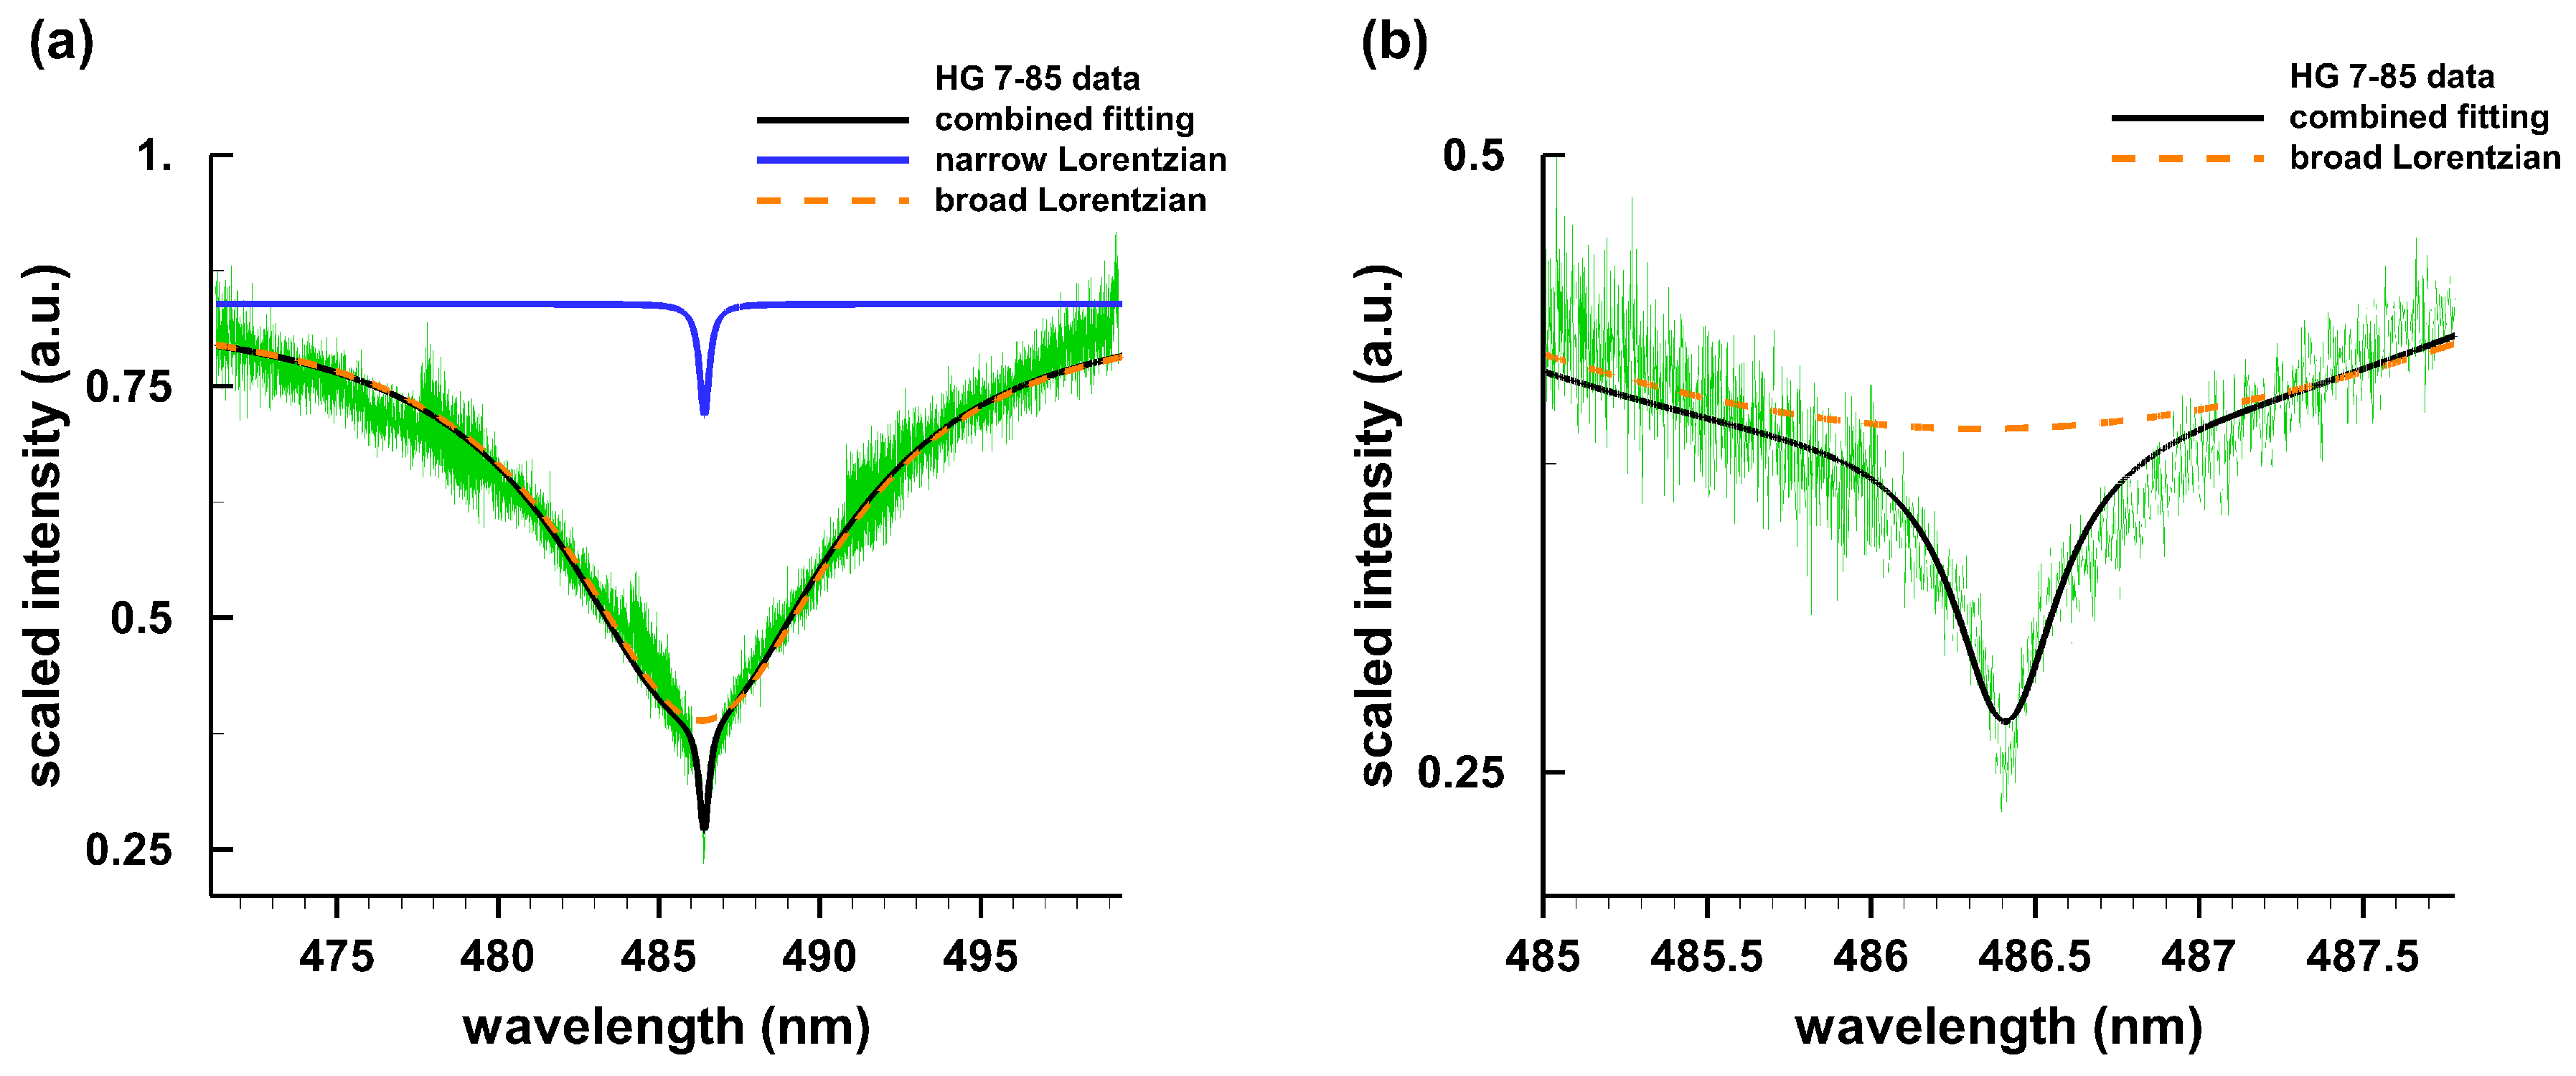
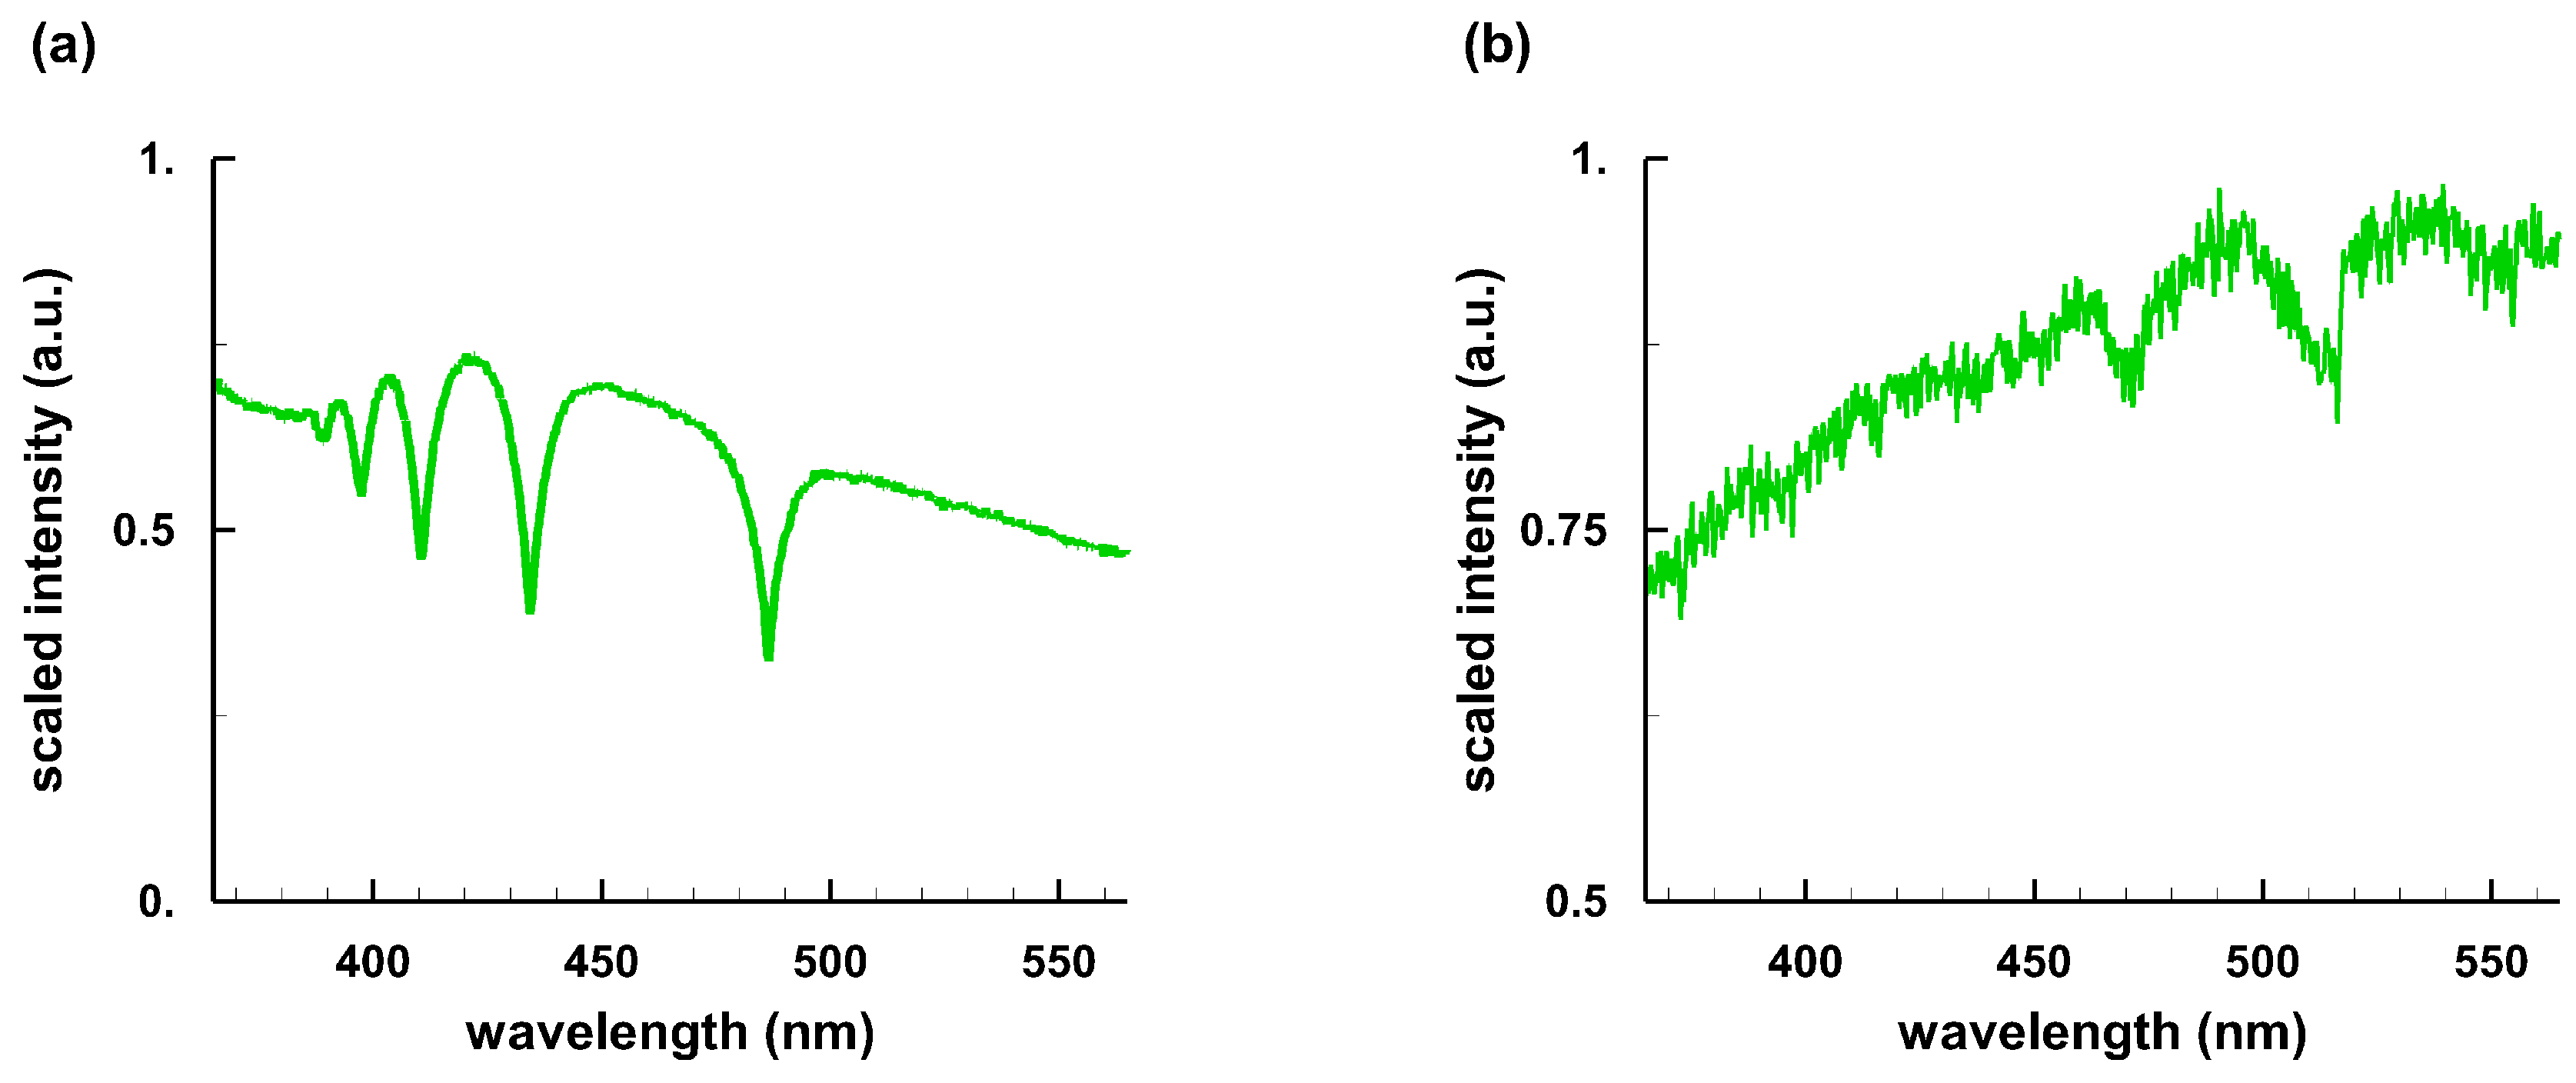
2.2. Astrophysical White Dwarf Spectra

Figure 3 illustrates spectra from Sirius B and Procyon B, indicating hydrogen Balmer series lines and C 2 Swan molecular spectra in absorption, respectively. The resolving power, R, for the Sirius B spectrum in Figure 3a equals R 555 , or a spectral resolution of 0.88 nm that is too coarse for determination of the expected 0.144-nm redshift. Procyon B ( α CMi B) is further evolved [54] in its life time, and it shows a temperature of 8 kK. Procyon B is classified as DQZ type WD and reveals molecular spectra of C 2 due to a carbon-rich and metal-rich atmosphere. Sirius B ( α CMa B) reveals a temperature of 26 kK [55] and a typical spectrum for DA white dwarfs. These two stars form the so-called Winter Triangle with Betelgeuse of the constellation Orion.
Figure 4 and Figure 5 display selected DA and magnetic DA (DAH) hydrogen absorption lines [55,56,57]. Spectra recorded with resolving powers of 800 to 1800 (spectral resolution of 0.61 to 0.27 nm at the H β 486.14-nm wavelength) rarely if at all show evidence of the hydrogen beta central peak separation. At N e of 1 × 10 17 cm 3 , the peak separation and central dip-shift in the laboratory micro-plasma would, respectively, amount to 1.3 nm and 0.14 nm, but again, radiative transfer considerations (e.g., see Reference [13]) indicate that the astrophysical WD spectra do not show significant Stark shifts.
Selected data records of the Sloan digital sky survey [58,59] presents 9316 spectroscopically confirmed white dwarfs, and several WD stars are further analyzed [60]. As an example of a magnetic DA type star (DAH), the Zeeman triplets are nicely recognizable in Figure 5. Magnetic white dwarfs pose challenges [61,62] in the modeling of the recorded absorption spectra. Figure 5 also compares H β and H α Zeeman-split and asymmetric Stark-broadened line shapes.
The H β and H α profiles in Figure 5 indicate Zeeman-split blue- and red-peak separations, respectively, of σ β = 14.6 nm and σ α = 26.6 nm. The ratio of the H α peak separation, σ α , and H β peak separation, σ β ,
σ α σ β = 1.82 = λ α λ β 2 ,
is equal to the square of the ratio of H α and H β wavelengths, as expected, although the line shapes appear asymmetric due to Stark broadening. For H α and H β , the Zeeman-splits amount to an energy shift 0.038 eV on each side of line center. The shifts in Figure 5 imply magnetic fields of the order of 500 Tesla , also indicated in the computed H α Zeeman triplet [61] for a magnetic field of 500 Tesla. The electron density estimate equals 3.1 × 10 17 cm 3 , determined from FWHM of the central absorption of H β , Δ w H β = 10 ± 1 nm, and H α , Δ w H α = 2.7 ± 0.5 nm.
Several of the previously discussed white dwarf spectra show a spectral resolution of the order of 1000. However, it would be not unusual to achieve resolving powers of 40,000 (or 0.012 nm at the H β wavelength) with Echelle spectrometers, for instance, when using the so-called HIRES Echelle spectrometer [63]. The analysis utilizes readily available software, or already extracted sections of an Echelle spectrum. The overall spectral record is composed of parts from different spectral order. Figure 6 shows data for HG 7-85 from the Hyades cluster.
The data displayed in Figure 6 are available at KOA [64] following observations [65] on 28–29 October 2012. Figure 6a displays the overlays from Echelle orders, and it shows a broad Lorentzian (dashed) with FWHM of 10 nm, centered at 486.22 nm. Fitting of the composite Echelle spectra is accomplished using publicly available software [66]. The width implies an electron density of 3.1 × 10 17 cm 3 . The expanded core of the spectrum indicates a shift of 0.3 nm—coincidentally, if time-resolved emission spectroscopy were applied to characterize laboratory plasma, a shift of 0.3 nm (strictly speaking a dip-shift of resolved H β blue and red peaks) would indicate N e of 3.1 × 10 17 cm 3 as well. Figure 6b illustrates a narrow Lorentzian of width 0.19 nm. A FWHM of 0.19 nm would yield an electron density of 0.012 × 10 17 cm 3 . Comparisons with H β laboratory results however would suggest that the spectrum is composed of broad and narrow H β components. The narrow component would imply an electron density that is over two orders of magnitude smaller than that for the broad component.
The gravitational shift of HG 7-85 [65] is 44.3 km/s. Using Equation (1), the corresponding wavelength shift at 486.14 nm amounts to Δ λ = 0.072 nm . Note that the center wavelength of the broad Lorentzian fit is at 486.22 nm, or shifted by 0.08 nm . Clearly, further modeling of the atmosphere condition for this Hyades WD would be needed to evaluate the accuracy of this inference. However, the appearance of the H β spectrum from HG 7-85 could very well indicate absorption from a dense and two orders of magnitude less dense WD atmosphere, as perhaps suggested for other WDs by including carbon, nitrogen, and oxygen in WD atmospheres models [39].

3. Discussion

Broadly speaking, laboratory measurements of the hydrogen Balmer series in the optical region of the electromagnetic spectrum show significant applications in the study of white dwarfs. The research efforts on modeling line shapes extend over several decades if not centuries. At an electron density of 10 17 cm 3 , H β and H α widths are well over one order of magnitude larger than Stark-effect redshifts that are measured in laboratory plasma.
However, astrophysical data obtained with increased resolution available at observatories motivate and require accurate measurements of the line shapes and the gravitational redshifts. Accurate laboratory data, modeling and advances in theory are expected to contribute to precise inferences about white dwarf stars, especially for WDs with radiation temperatures in excess of the order of 26 kK or that of Sirius B.

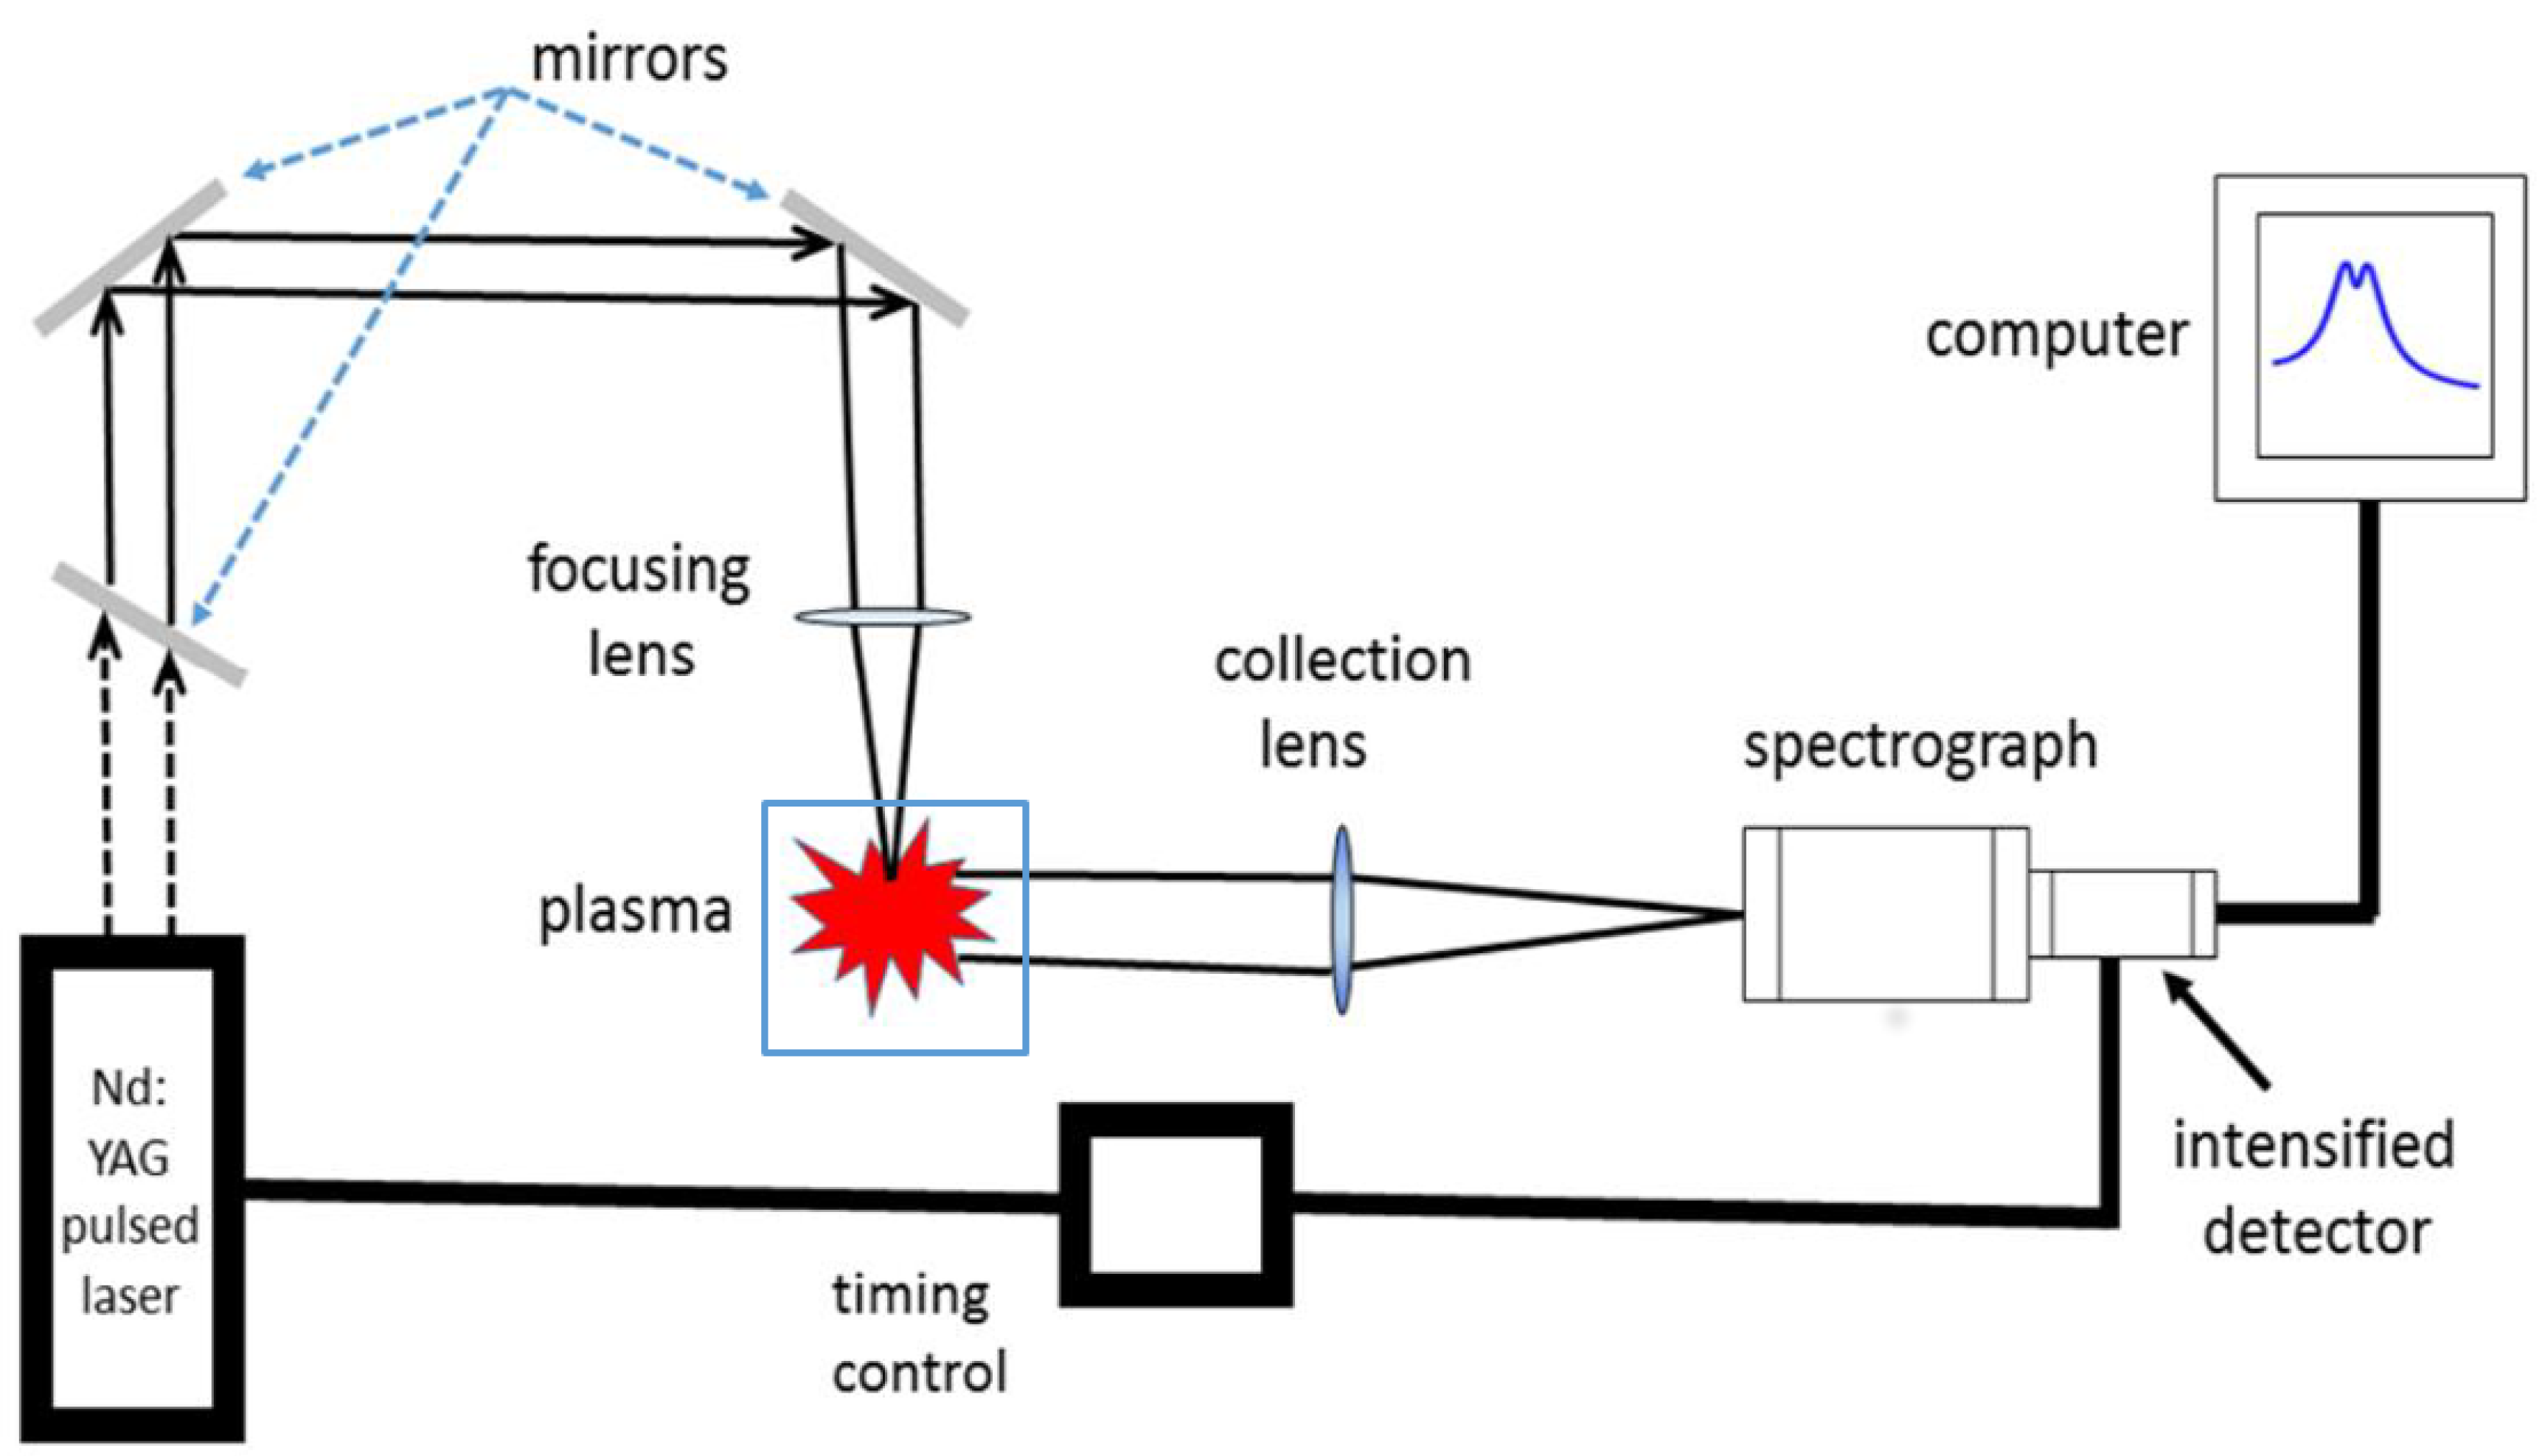
4. Materials and Methods

The experimental arrangement for the laboratory studies include a pulsed, Q-switched, Nd:YAG laser device operated at pulse-widths of 6 to 13 ns using different models. Figure 7 illustrates the schematic for laser-induced plasma experiments inside a laboratory cell.
Laser-induced optical breakdown is accomplished by focusing 150 mJ per pulse of fundamental 1064-nm radiation to achieve of the order of 1000 GW/cm 2 in a cell containing hydrogen gas. Typically, crossed Czerny–Turner spectrometers of 0.25-nm or 0.64-nm focal length disperse the hydrogen lines. In addition, studies of plasma in air or following laser ablation contribute to the set of investigations. A photomultiplier, linear intensified diode array or an intensified charge-coupled device record spectrometer-dispersed light.
Usual sensitivity correction, wavelength calibration, and detector background subtraction deliver data records suitable for analysis that includes de-convolution from the detection system transfer function. An overview video [67] of the measurement protocol provides sufficient detail for laser-induced breakdown spectroscopy for atomic and diatomic molecular analysis [68].
Spectral resolutions for linear diode arrays or ICCDs of the order of 0.1 nm with the 0.64-m Jobin Yvon (JY) and 0.25 nm with the 0.25-m Jarrel–Ash spectrometers, or resolving powers of the order of 5000 and 2000, provide sufficient resolution for the measurement of full-width-half-maximum H β and H α lines. For the experiments with a photomultiplier and moving a 3600 grooves/mm holographic grating of the JY spectrometer, H β and H α spectral resolution of 0.02 nm is realized. Measurements of redshifts with diode arrays or ICCDs require sufficient resolving power for electron densities, N e , of nominally 1 × 10 17 cm 3 . However, redshifts for N e of 10 × 10 17 cm 3 are large enough to achieve acceptable error margins.
For H β and H α , the ratio of width to central dip-shift and redshift amounts to 32 and 24, respectively, at 1 × 10 17 cm 3 with a weak N e dependency as indicated in Appendix A. Noteworthy, for the experiments with a photomultiplier and moving 3600 grooves / mm grating of the JY spectrometer, the H α spectral resolution of 0.02 nm is realized, or a resolving power of 33,000 at 656.28 nm. For H β , spectral resolving powers of the order of 50,000 at 486.14 nm or a resolution of 0.01 nm with the JY spectrometer would in principle be available when using a photomultiplier that preferably would need to be gated for accurate measurements at longer time delays of say 175 ns to block the early and intense plasma radiation as the line emerges from the free electron background radiation.
The analysis of the recorded line profiles, over and above the evaluation of the FWHM, includes fitting of tabulated profiles [27,28], fitting to Voigt profiles or Lorentz profiles, and, recently, fitting to asymmetric hydrogen beta profiles [34]. The latter approach allows one to efficiently analyze Abel-inverted data sets in investigations of radial plasma expansion phenomena.

5. Conclusions

The laboratory laser-induced plasma investigations using temporally- and spatially-resolved spectroscopy clearly indicate direct application to determination of astrophysical white dwarf parameters. Data collection with a resolving power of the order of 50,000 to 75,000 or better appears to be desirable for astrophysical and laboratory spectra to determine accurate hydrogen beta line profile parameters for the encountered white dwarf spectral redshifts and electron densities.
Moreover, the line shape of especially the hydrogen beta line deserves further theoretical attention to exactly reconcile asymmetries and shifts noticeable in laboratory optical emission spectroscopy and in part discernible in recorded astrophysical absorption spectra.

Author Contributions

C.G.P. conceived, designed, and performed the experiments; K.A.D. and G.G. contributed to the analysis of the spectra; K.A.D., G.G., and C.M.H. assisted in extensive literature searches; G.G. assisted in the collection of the data; and C.G.P. outlined and wrote the paper.

Funding

The authors appreciate the support in part by the Center for Laser Application, a State of Tennessee funded Accomplished Center of Excellence at the University of Tennessee Space Institute.

Acknowledgments

This research made use of the Keck Observatory Archive (KOA), which is operated by the W. M. Keck Observatory and the NASA Exoplanet Science Institute (NExScI), under contract with the National Aeronautics and Space Administration. One of us (CGP) thanks P. Dufour for promptly responding with text files of WD spectra listed at the Montreal white dwarf database, SDSS-III Science Archive Scientist Benjamin Alan Weaver for his support with SDSS data, Lasker Data Science Fellow G. Narayan for sending text files of data from the Gemini Observatory and the Multiple Mirror Telescope, and B. Zuckerman and Beth Klein for communication exchanges about their Hyades study.

Conflicts of Interest

The authors declare no conflict of interest. The funding sponsors had no role in the design of the study; in the collection, analyses, or interpretation of data; in the writing of the manuscript, and in the decision to publish the results.

Abbreviations

The following abbreviations are used in this manuscript:
cspeed of light
CMaCanis Majoris—big dog
CMiCanis Minoris—little dog
Δ w H α hydrogen alpha FWHM
Δ λ H α hydrogen alpha redshift
Δ w H β hydrogen beta FWHM
Δ λ ps hydrogen beta peak separation
Δ λ ds hydrogen beta central dip-shift
DAdwarf A—hydrogen lines are present
DAHdwarf A with magnetic field
DQZdwarf Q and Z—carbon and metal rich atmosphere
FWHMfull width at half maximum
Ggravitational constant
H β hydrogen beta line
H α hydrogen alpha line
HIREShigh resolution spectrometer
ICCDintensified charge coupled device
JAJarrel-Ash
JYJobin Yvon
KOAKeck observatory archive
λ α wavelength of H α
λ β wavelength of H β
MWD mass
MWD mass in solar units
N H I electron interstellar density of the hydrogen column
N e electron density
RWD radius
RWD radius in solar units
σ α blue- and red-peak Zeeman separation for H α
σ β blue- and red-peak Zeeman separation for H β
SDSSSloan digital sky survey
τ time delay from optical breakdown
v g gravitational redshift
WDwhite dwarf
χ ( β ) integral describing predominant Holtsmark contribution
Λ ( β ) integral describing predominant Lorentz contribution
Δ ( β ) integral describing predominant Doppler contribution
β ration of electric and normal field strength
Felectric field strength
F 0 normal field strength
CGPChristian Gerhard Parigger
CMHChristopher Matthew Helstern
KADKyle Anthony Drake
GGGhaneshwar Gautam

Appendix A. Formulae for Determination of Electron Density from Hβ and Hα Profiles

The set of empirical formulae for H β and H α derive from various laboratory measurements of laser-induced plasma in gases and laser ablation [69]. Linear log-log fitting yields the formulae for H β electron densities in the range of 0.03 to 8 × 10 17 cm 3 for widths of 3 to 20 nm,
Δ w H β [ nm ] = 4.5 N e [ cm 3 ] 10 17 0.71 ± 0.03 .
The peak-separation of the two H β shifted peaks,
Δ λ ps [ nm ] = 1.3 N e [ cm 3 ] 10 17 0.61 ± 0.03 .
The central dip-shift [22],
Δ λ ds [ nm ] = 0.14 N e [ cm 3 ] 10 17 0.67 ± 0.03 ,
provide further measures of the electron density. For electron densities, N e , higher than 7 × 10 17 cm 3 , especially the redshift of the central dip allows one to determine N e up to 20 × 10 17 cm 3 [22].
The H α width and redshift formulae,
Δ w H α [ nm ] = 1.3 N e [ cm 3 ] 10 17 0.64 ± 0.03 ,
Δ λ H α [ nm ] = 0.055 N e [ cm 3 ] 10 17 0.97 ± 0.03 ,
apply to electron densities of the order of 0.01 to 100 × 10 17 cm 3 . The formulae for electron density determination from H α are consistent within error margins of reported gas-liner pinch data and diagnosis using Thomson scattering and simultaneous spectroscopic measurements [70].
Electron densities, N e , determined from H β widths are preferred due the 5% to 10% accuracy that can be achieved [30]. This is in part due to the larger width for H β than for H α indicated in Equations (A1) and (A3), or due to the H β peak separation that can be utilized for electron density diagnostics [25]. Table A1 displays measured shifts of the central H β dip and the computed electron density using Equation (A3). The H β widths are too wide for time delays smaller than 175 ns and for the selected measurement window, but the results are consistent with the H α widths.
Table A1. Average H β central dip-shifts, widths, and electron densities, N e , from dip-shifts and widths for selected time delays of optical breakdown in 0.76 × 10 5 Pa hydrogen gas [22].
Time Delay (ns)H β Dip-Shift (nm)H β Width (nm)N e from Dip-Shift (10 17 cm 3 )N e from Width (10 17 cm 3 )
251.02 ± 0.15-20 (15–24)- (H α : 17)
500.83 ± 0.15-14 (11–19)- (H α : 14)
750.77 ± 0.1∼2513 (10–15)∼11
1000.65 ± 0.1∼23 ± 410 (7.7–12)∼10
1250.58 ± 0.1∼21 ± 48.4 (6.3–11)∼8.8
1500.50 ± 0.1∼15 ± 36.7 (4.8–8.9)∼5.5
1750.42 ± 0.111 ± 25.2 (3.5–7.2)3.5
2000.37 ± 0.19 ± 14.3 (2.7–6.1)2.7
2250.32 ± 0.18 ± 0.53.5 (2.0–5.2)2.3
2500.26 ± 0.057.5 ± 0.52.5 (1.8–3.3)2.1
2750.24 ± 0.057.0 ± 0.52.2 (1.6–3.0)1.9
Previous laser-induced plasma work [17] addresses determination of electron density from full widths at half-maximum of the Balmer series hydrogen-beta line, H β , peak-separation of H β , and comparisons with hydrogen-alpha line, H α , results. Re-analysis in view of the central dip-shifts in Figure 1a,b of Reference [17] shows values of 0.5 ± 0.025 nm and 0.33 ± 0.025 nm, respectively, that lead to N e of 6.7 ± 0.5 × 10 17 cm 3 and 3.6 ± 0.4 × 10 17 cm 3 . These values are consistent with the determined N e from in the last column of Table 2 in Reference [17].

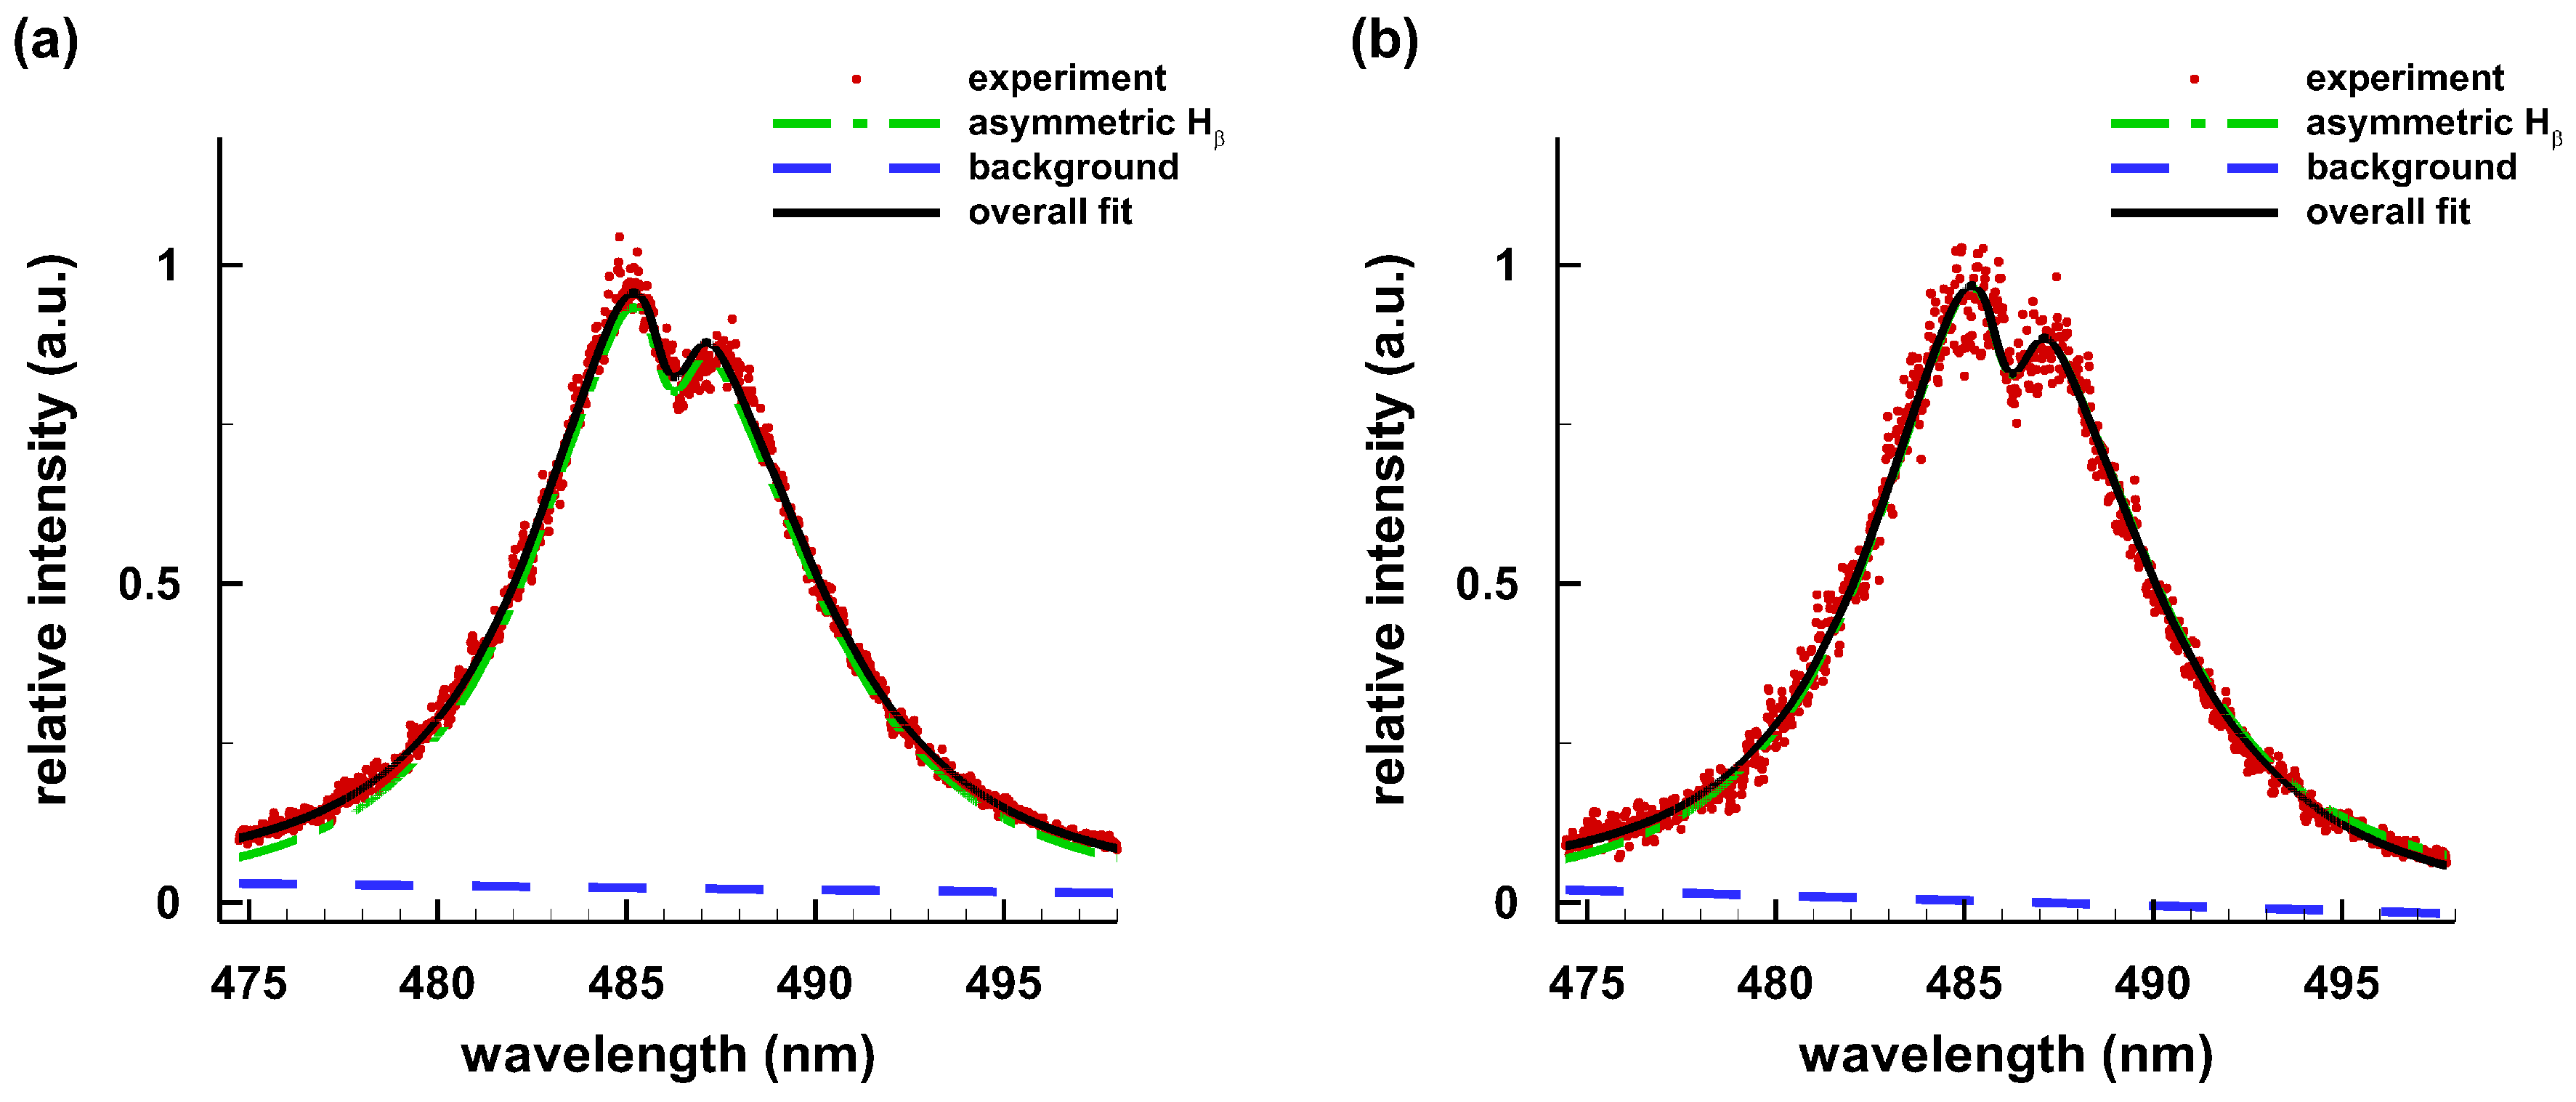
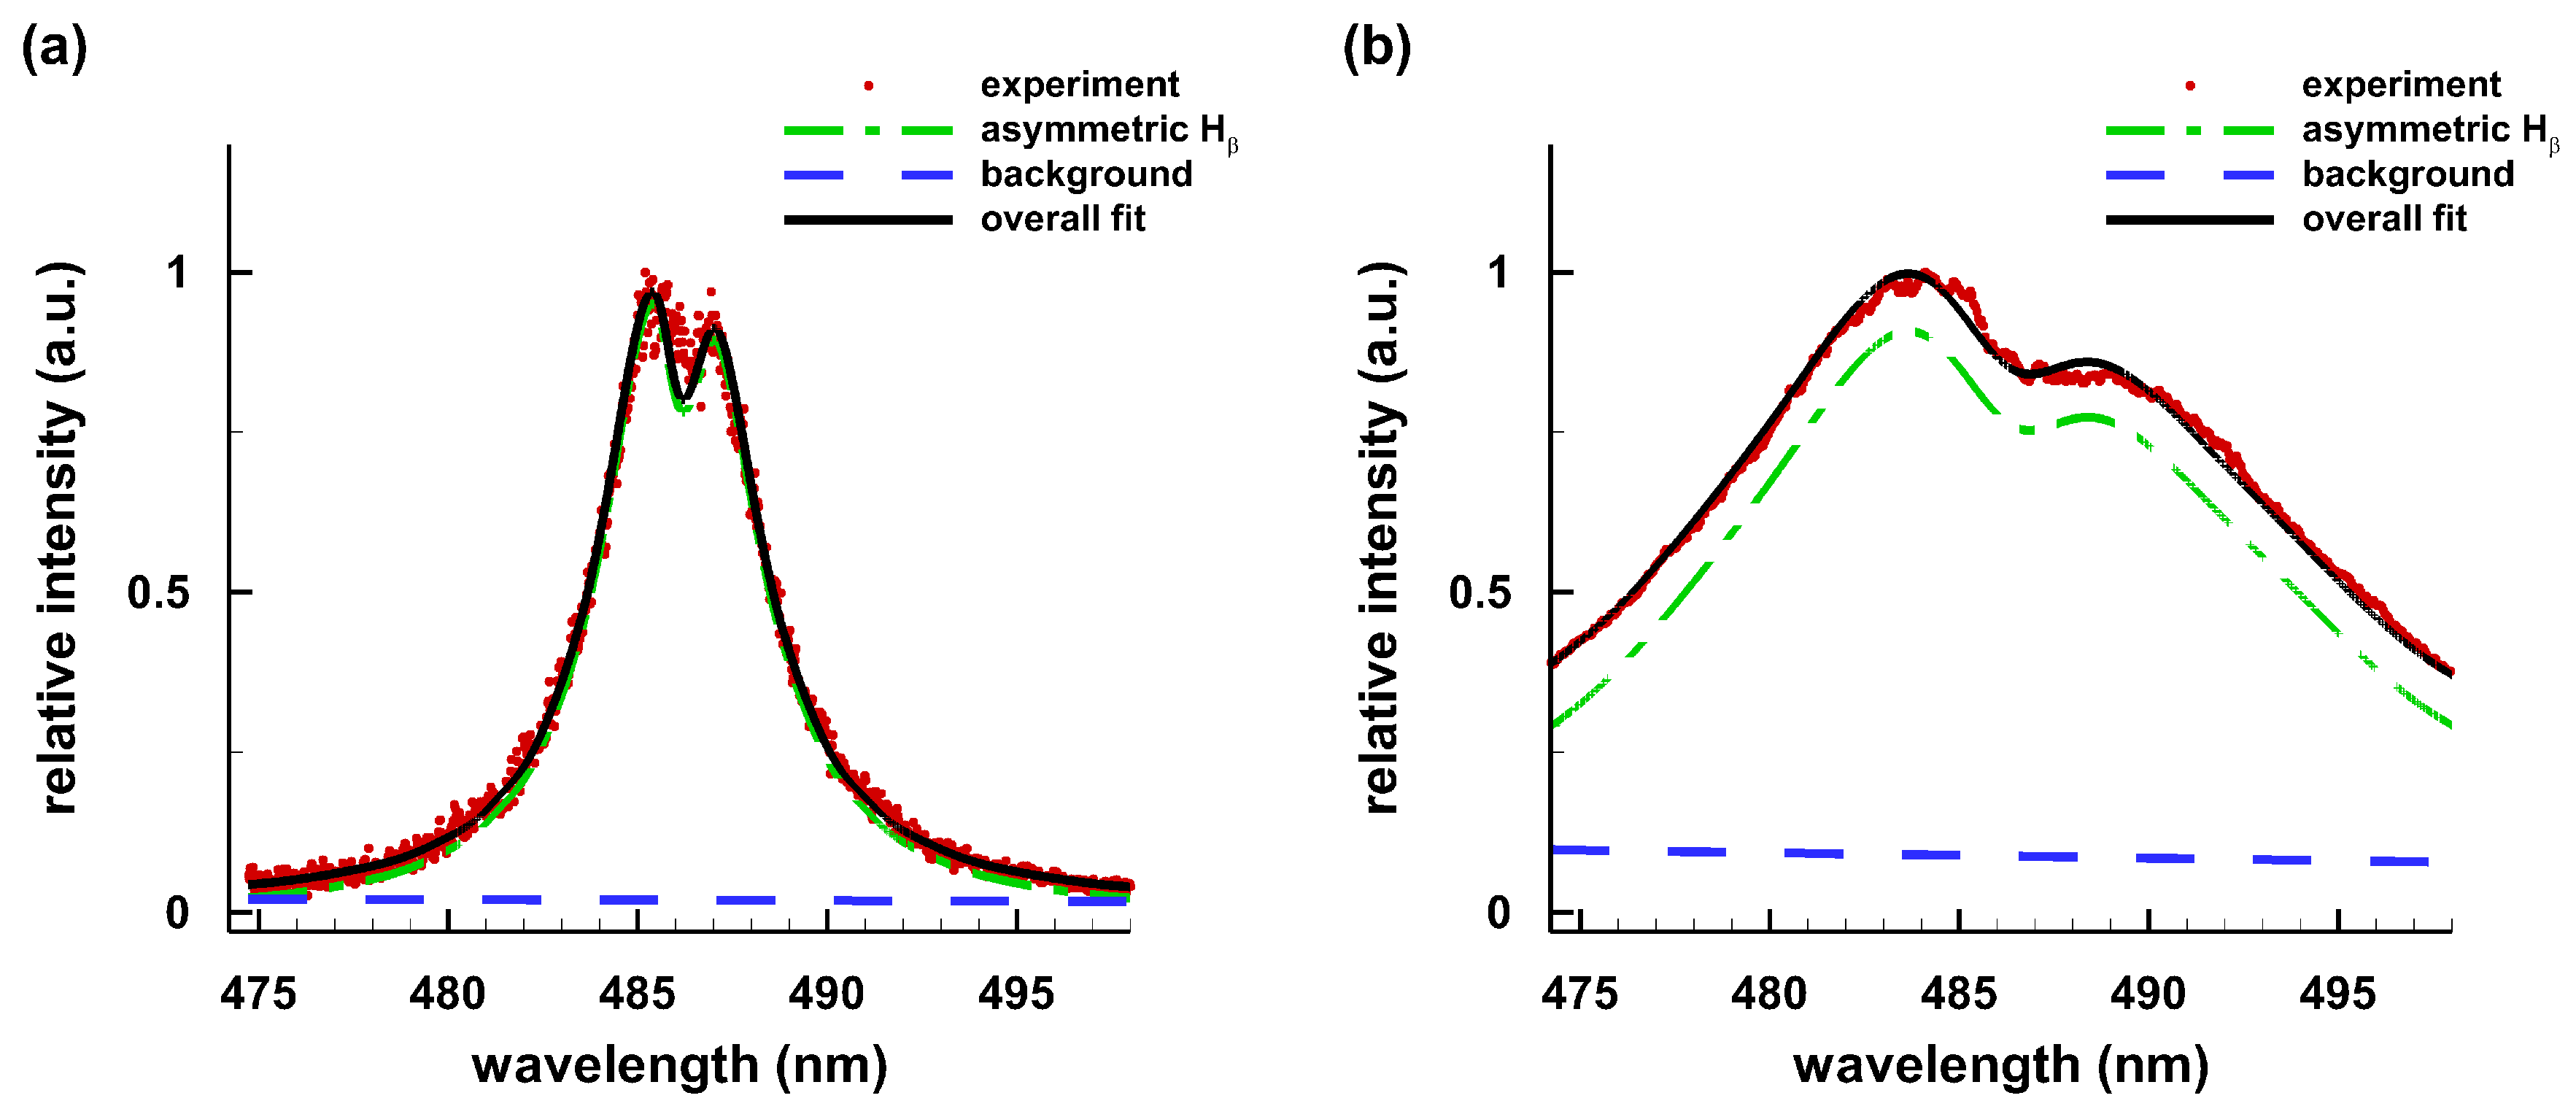
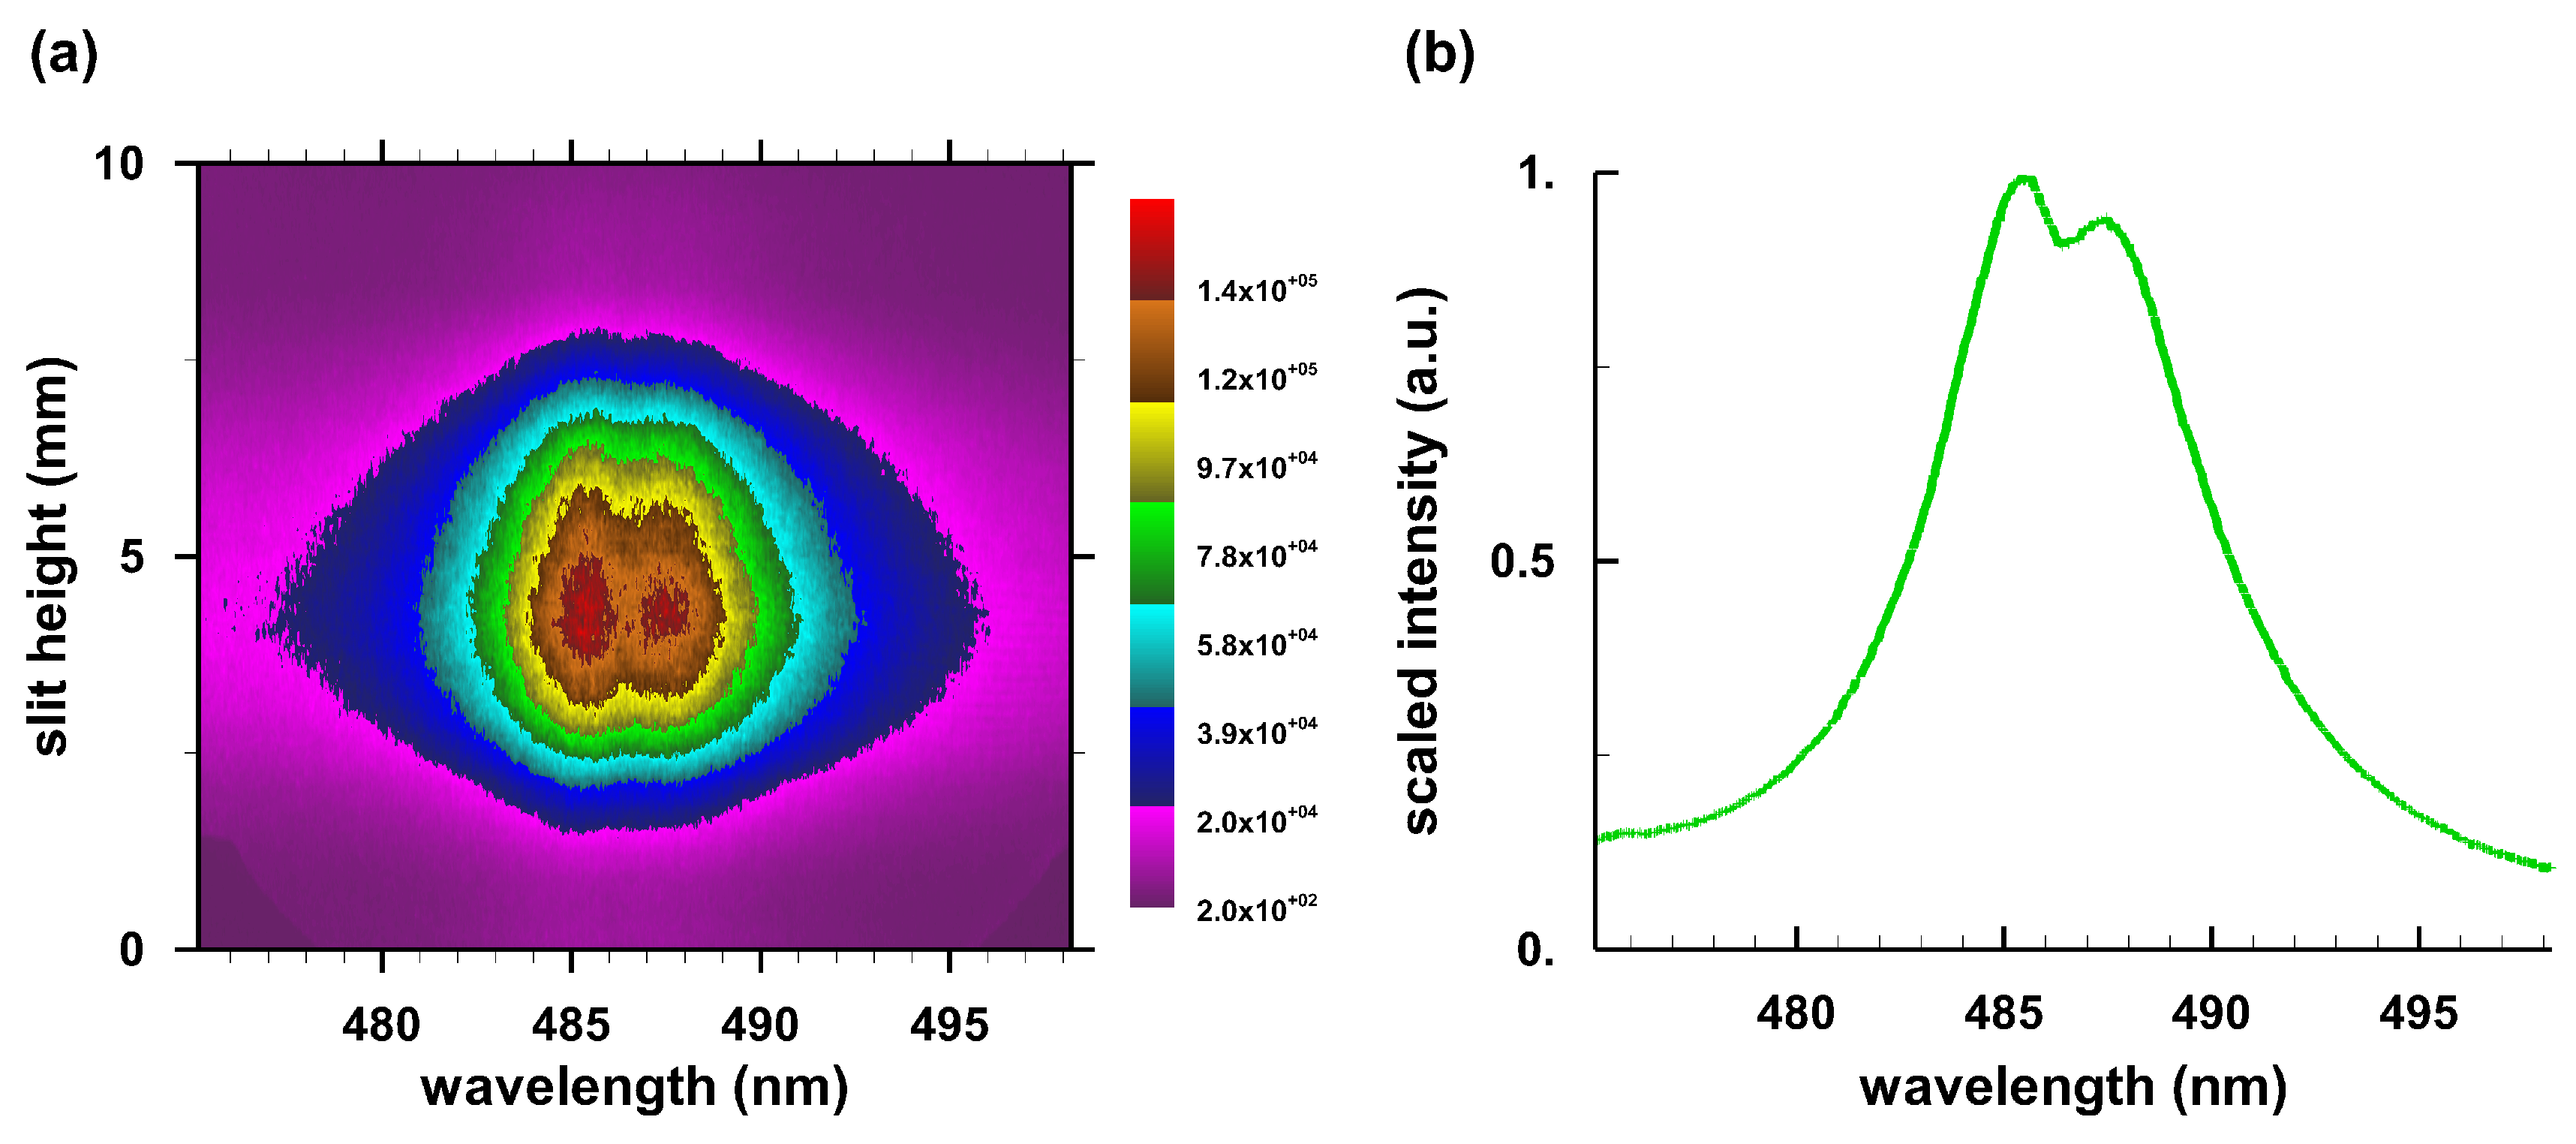
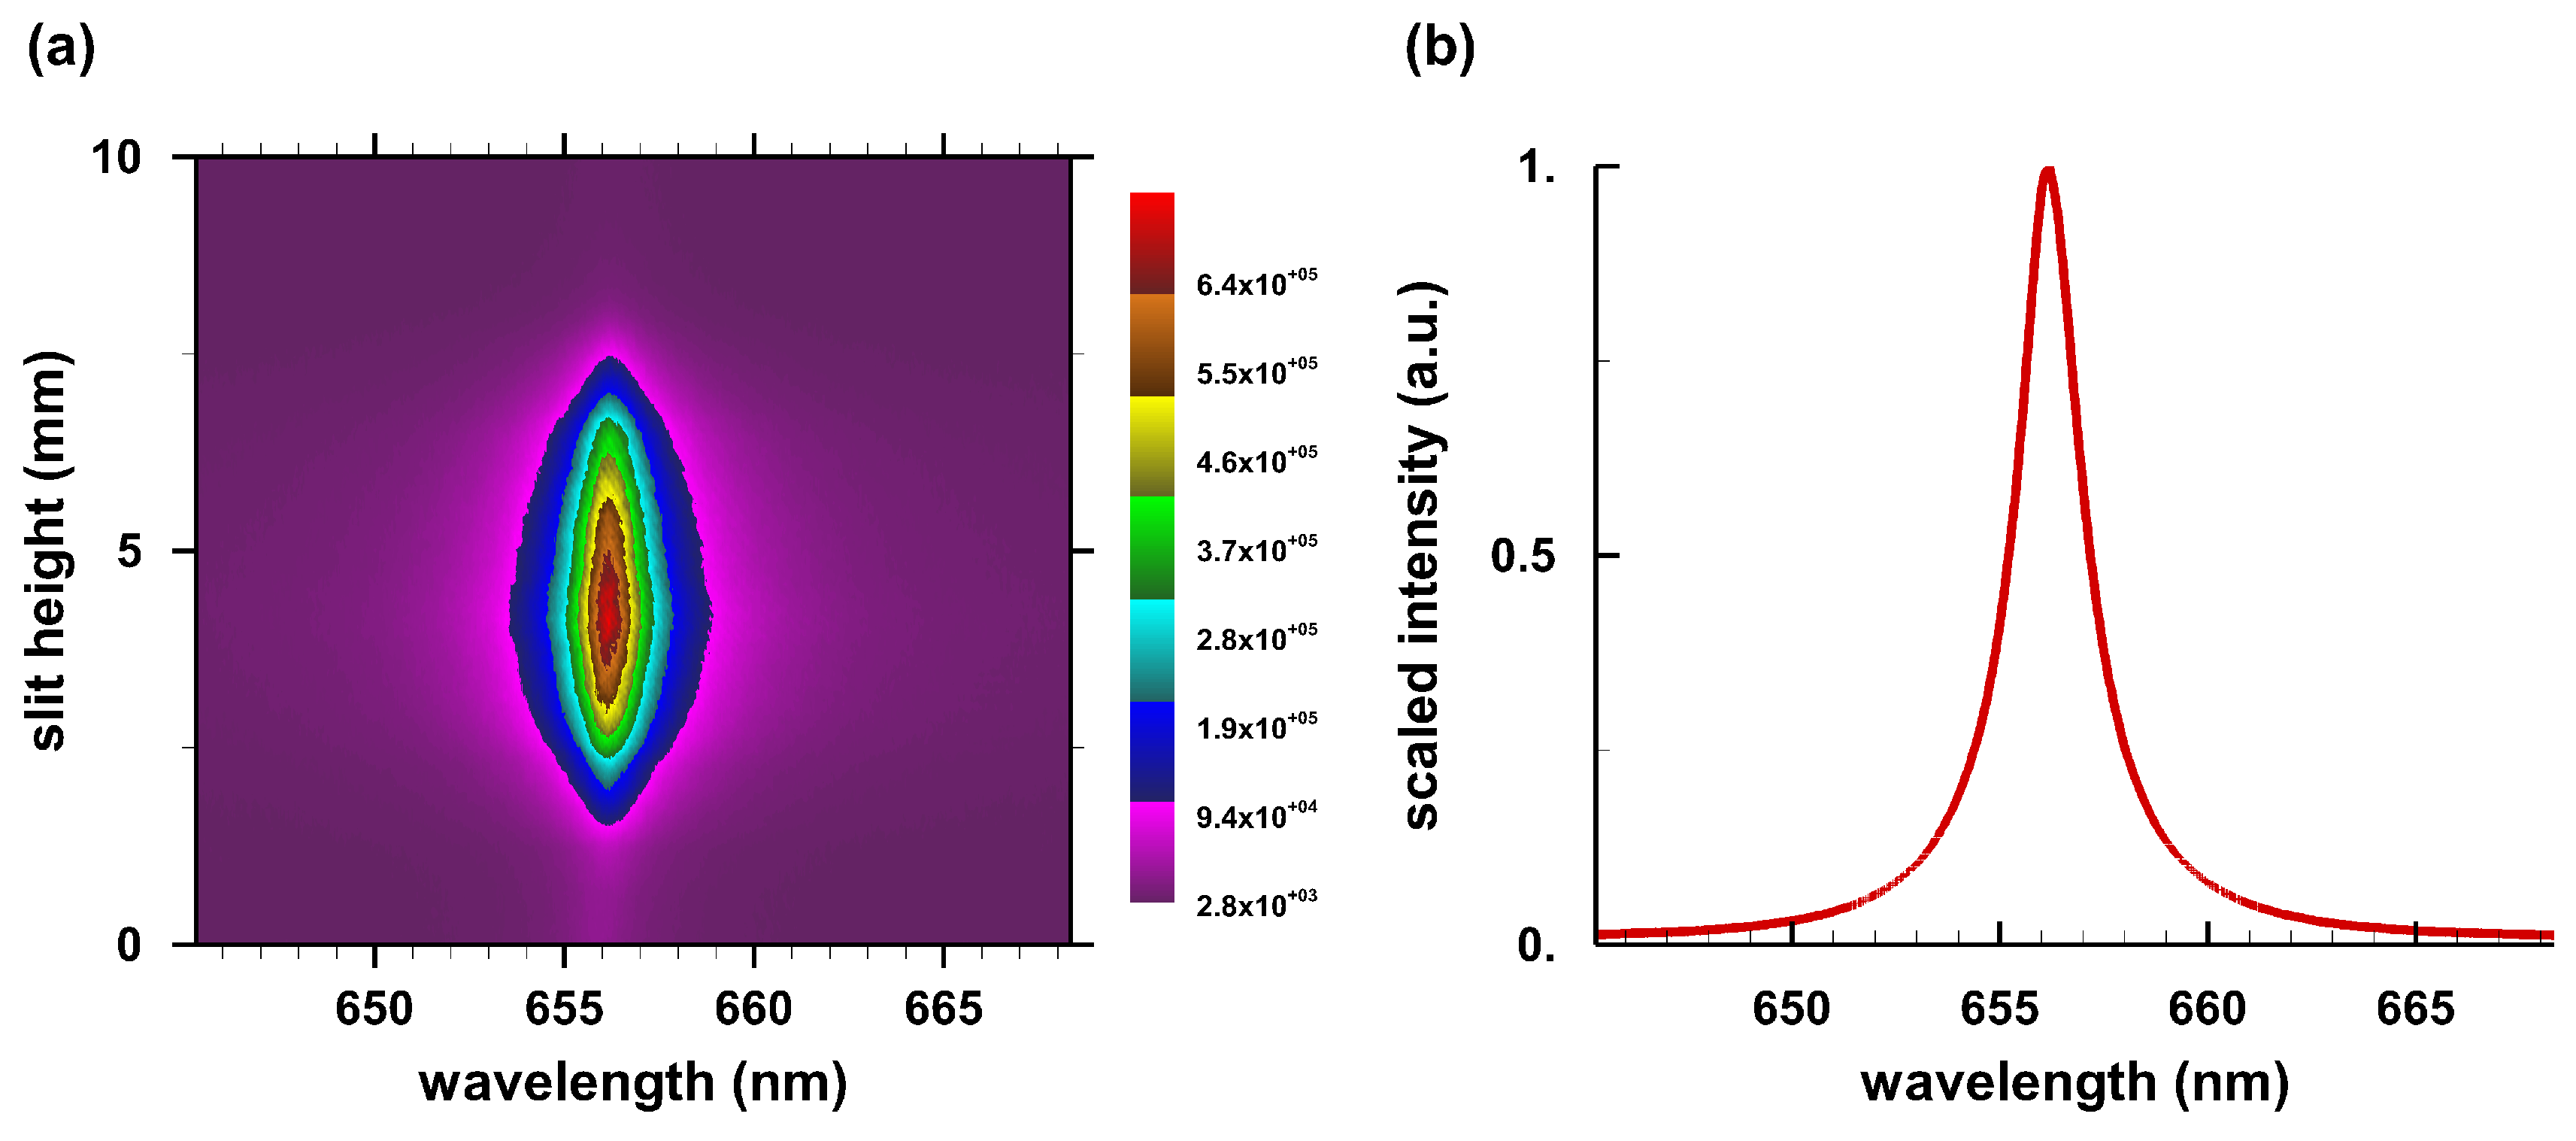
Appendix B. Typical Laboratory Spectra of Hβ and Hα

Recent laboratory experiments [22] reveal central H β dip-shifts from plasma emissions following optical breakdown in 0.76 × 10 5 Pa hydrogen gas. Typical spectra of H β also show the separation of the two red and blue peaks, including the asymmetry. H α shows central Stark components, therefore, the central dip is absent.
Figure A1 and Figure A2 show H β and H α pseudo-colored images for a time delay, τ , of 250 ns from laser-plasma initiation. The figures also show the corresponding averages along the slit. From the FWHM and using formulae in Appendix A, the average electron density is N e = 2.1 × 10 17 cm 3 (see Table A1 in Appendix A). The electron temperature, T e , equals 50 kK ( 4.3 eV ) for τ = 250 ns [22], evaluated from line-to-continuum and Boltzmann plots with an error margin of ±10 kK (0.86 eV).
Figure A1. H β spectra for τ = 250 ns: (a) H β map; and (b) scaled average.
Atoms 06 00036 g0a1
Figure A2. H α spectra for τ = 250 ns: (a) H α map; and (b) scaled average.
Atoms 06 00036 g0a2
In the experiments, the 1064-nm laser beam propagates from the top to the bottom and parallel to the spectrometer slit. The time-resolved records are collected with an ICCD, accumulating 100 consecutive laser-plasma events. The profiles along the slit indicate the average electron density variation along the plasma. The plasma expansion causes higher N e near the shock wave or the expanding plasma kernel boundary than for the other regions, leading to line-of-sight profiles that appear as a superposition of lower and higher density line shapes, analogous to reported laser ablation spectral line shapes [71,72]. The average along the slit dimension yields spectra similar to data acquired with linear diode arrays.

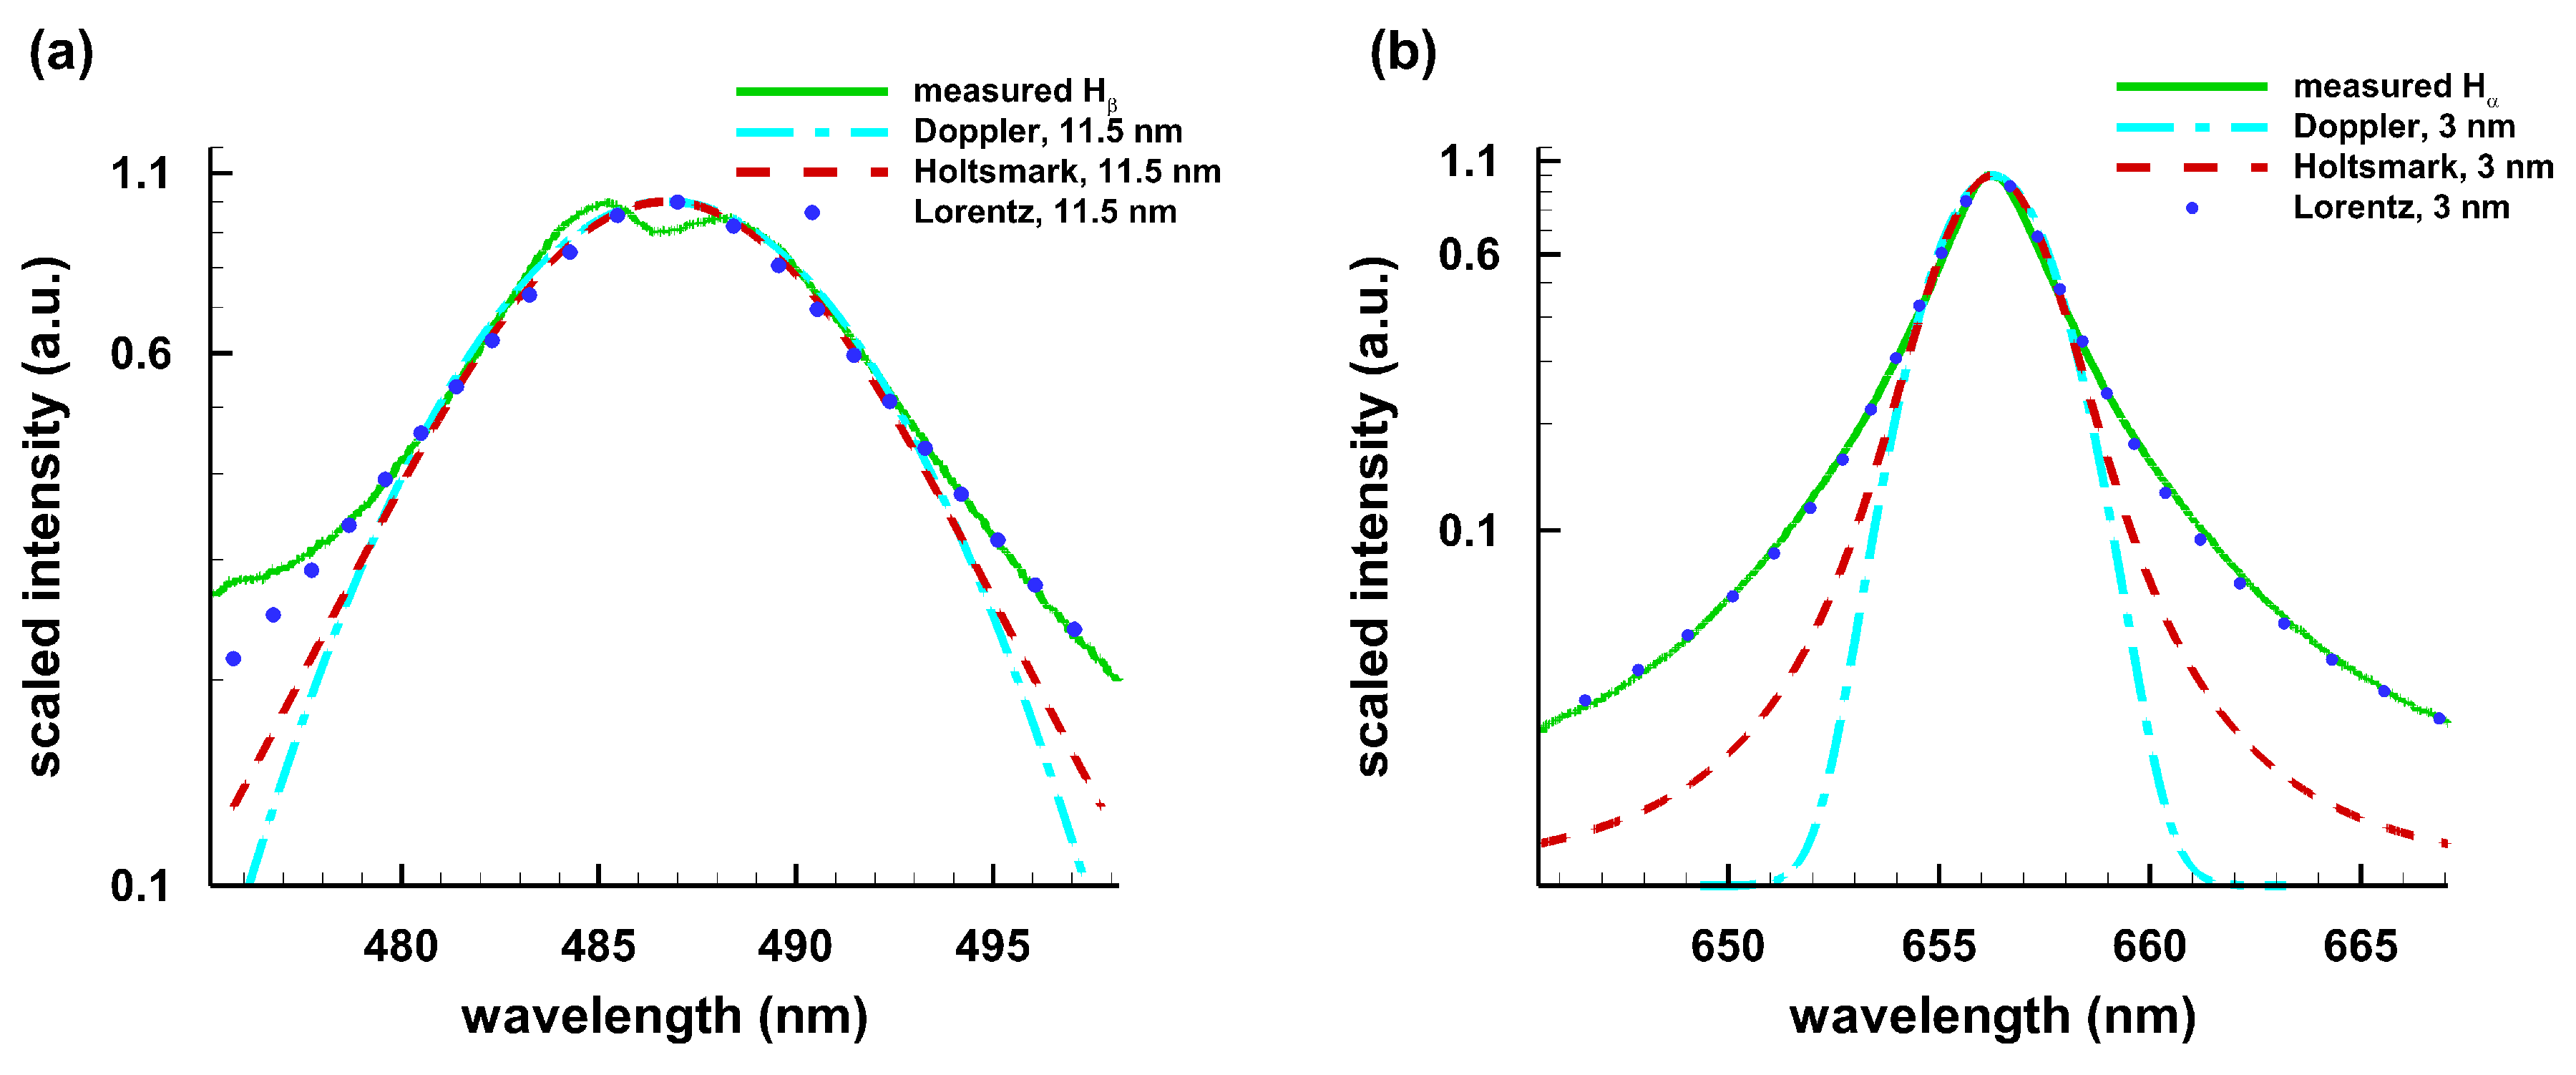
Appendix C. Line Shapes

The literature indicates extensive material on the computation of hydrogen line profiles. Historically speaking, Schrödinger published his “modern” quantum mechanics calculation of Stark shifts for Balmer series lines H α , H β , H γ , and H δ [51]. Figure A3 illustrates measured H β and H α spectra including overlays of Holtsmark, Lorentz and Doppler profiles of the same widths.
Figure A3. Comparison of measured data at a time delay of 175 ns, one-dimensional Holtsmark, Lorentz, and Doppler line shapes with the same full-width-half-maxima: (a) H β ; and (b) H α .
Atoms 06 00036 g0a3
Broadening considerations of these lines include results obtained by J. Holtsmark [52] especially in the quasi-static limit for the ions. Doppler or inhomogeneous and Lorentz or homogeneous broadening describe velocity and electron-collision impact phenomena, respectively.
From a mathematical point of view, these three spectral line shapes represent the probability distribution function of the one-dimensional Holtsmark, Lorentz, and Doppler characteristic functions. Table A2 displays the characteristic functions of the independent variable t including mean, μ n , and scale parameters, c n , with n = h, l, d.
Table A2. Characteristic functions, φ ( x ) for one-dimensional Holtsmark, Lorentz, and Doppler profiles.
HoltsmarkLorentzDoppler
exp { it μ h | c h t | 3 / 2 } exp { it μ l c l t } exp { it μ d ( c d t ) 2 }
A spectral line profile can be viewed as the standard integral representation of the characteristic function of a continuous distribution defined by its probability distribution function. Computation of the line profiles is based on the Matlab® Characteristic Functions Toolbox [73]. In other words, the spectral line is evaluated as the real part of the Fourier transform as function of x,
I ( x ) = 1 2 π + φ ( t ) exp { i x t } d t .
For zero mean, μ h = μ l = μ d = 0 , constant scaling, c h = c l = c d = 5.75 and c h = c l = c d = 1.5 for H β and H α , respectively, and with adjustments for a 1% background offset for Holtsmark, Lorentz, and Doppler profiles with same full-width-half-maxima (FWHM) of 11.5 and 3 nm, Figure A3 shows close to Lorentz profiles in the wings indicating the impact approximation for electrons.
The H β profiles would indicate Holtsmark profiles in the wings if only ion broadening were considered [27,28], but detailed microfield [74] considerations and Stark broadening computations [27,28,75,76] include electron broadening, Debye shielding, and ion-ion correlations that decrease the depth fidelity at line center, and cause Lorentz-like dependencies in the wings. In laboratory measurements of H β , the Doppler width is usually smaller (∼0.08 nm at 50 kK) than the spectral resolution (∼0.1 nm) and much smaller than the FWHM (∼11 nm) for a density 3.6 × 10 17 cm 3 . Computations of line shapes usually involve the convolution of at least the Holtsmark, Lorentz, and Doppler profiles. The convolution of the Holtsmark and Voigt profiles is reduced to a sum of three integrals with predominant Holtsmark, Lorentz, and Doppler contributions [77,78], respectively,
Φ ( β ) = χ ( β ) + Λ ( β ) + Δ ( β ) .
Here, β indicates the ratio of electric field strength, F , and of normal field strength, F 0 , β = F / F 0 . The three integrals χ ( β ) , Λ ( β ) , and Δ ( β ) are explicitly listed in Reference [78].
The Holtsmark distribution is frequently encountered in the description of astrophysical plasma. In laboratory plasma, the Holtsmark distribution describes ion-ion effects in Stark broadened lines. For the encountered densities of the order of 1 to 10 × 10 17 cm 3 in the H β measurements, the wings are primarily collision-broadened, described by a Lorentz profile (see Figure A3a). Equally, H α in Figure A3b reveals Lorentz type wings that indicate electron impact broadening.

References

  1. Rowland, H.A. Preliminary Table of the Solar Spectruim Wave-Lengths VI. Astrophys. J. 1895, 2, 45–54. [Google Scholar] [CrossRef]
  2. Rowland, H.A. Preliminary Table of the Solar Spectruim Wave-Lengths XIII. Astrophys. J. 1895, 3, 356–360. [Google Scholar] [CrossRef]
  3. Moore, C.E.; Minnaert, M.G.J.; Houtgast, J. The Solar Spectrum 2935 Å to 8770 Å; National Burea of Standards Monograph 61; United Styates Department of Commerce: Washington, DC, USA, 1966; pp. 197–283.
  4. Barstow, M.A.; Bond, H.E.; Holberg, J.B.; Burleigh, M.R.; Hubeny, I.; Koester, D. Hubble Space Telescope Spectroscopy of the Balmer lines in Sirius B. Mon. Not. R. Astron. Soc. 2005, 362, 1134–1142. [Google Scholar] [CrossRef]
  5. Dufour, P.; Blouin, S.; Coutu, S.; Fortin-Archambault, M.; Thibeault, C.; Bergeron, P.; Fontaine, G. The Montreal White Dwarf Database: A Tool for the Community. In Astronomical Society of the Pacific (ASP) Conference Series 509, Proceedings of the 20th European White Dwarf workshop, Warwick, UK, 25–29 July 2016; Tremblay, P.-E., Gaensicke, B., Marsh, T., Eds.; Utah Valley University: Orem, UT, USA, 2017; pp. 3–8. ISBN 978-1-58381-903-6. Available online: http://dev.montrealwhitedwarfdatabase.org (accessed on 11 May 2018).
  6. Kodaira, K. A Spectrum of Sirius B. Astron. Soc. J. 1967, 19, 172–179. [Google Scholar]
  7. Wiese, W.L.; Kelleher, D.E. On the Cause of the Redshifts in White-Dwarf Spectra. Astrophys. J. 1971, 166, L59–L63. [Google Scholar] [CrossRef]
  8. Wiese, W.L.; Kelleher, D.E.; Paquette, D.R. Detailed Study of Stark Broadening of Balmer Lines in High-Density Plasma. Phys. Rev. A 1972, 6, 1132–1153. [Google Scholar] [CrossRef]
  9. Greenstein, J.L.; Oke, J.B.; Shipman, H.L. Effective temperature, radius, and gravitational redshift of Sirius B. Astrophys. J. 1971, 169, 563–566. [Google Scholar] [CrossRef]
  10. Holberg, J.B. Sirius B and the Measurement of the Gravitational Redshift. J. His. Astron. 2010, 41, 41–64. [Google Scholar] [CrossRef]
  11. Grabowski, B.; Halenka, J. On red shifts and asymmetries of hydrogen spectral lines. Astron. Astrophys. 1975, 45, 159–166. [Google Scholar]
  12. Shipman, H.L.; Mehan, R.G. The unimportance of pressure shifts in the measurement of gravitational redshifts in white dwarfs. Astrophys. J. 1976, 209, 205–207. [Google Scholar] [CrossRef]
  13. Halenka, J.; Olchawa, W.; Madej, J.; Grabowski, B. Pressure shift and gravitational redshift of Balmer lines in white dwarfs: Rediscussion. Astrophys. J. 2015, 808, 131–140. [Google Scholar] [CrossRef]
  14. Cremers, D.A.; Radziemski, L.J. Handbook of Laser-Induced Breakdown Spectroscopy; John Wiley & Sons: Hoboken, NJ, USA, 2006; pp. 1–97. ISBN 978-0-470-09299-6. [Google Scholar]
  15. Hahn, D.W.; Omenetto, N. Laser-Induced Breakdown Spectroscopy (LIBS), Part II: Review of Instrumental and Methodological Approaches to Material Analysis and Applications to Different Fields. Appl. Spectrosc. 2012, 66, 47–419. [Google Scholar] [CrossRef] [PubMed]
  16. Ispolatov, Y.; Oks, E. A convergent theory of Stark broadening of hydrogen lines in dense plasmas. J. Quant. Spectrosc. Rad. Trans. 1994, 51, 129–138. [Google Scholar] [CrossRef]
  17. Parigger, C.G.; Plemmons, D.H.; Oks, E. Balmer series Hβ measurements in a laser-induced hydrogen plasma. Appl. Opt. 2003, 42, 5992–6000. [Google Scholar] [CrossRef] [PubMed]
  18. Stambulchik, E.; Fisher, D.V.; Maron, Y.; Griem, H.R.; Alexiou, S. Correlation effects and their influence on line broadening in plasmas. High Energy Density Phys. 2007, 3, 272–277. [Google Scholar] [CrossRef]
  19. Gomes, T.A.; Nagayama, T.; Kilcrease, D.P.; Montgomery, M.H.; Winget, D.E. Effect of higher-order multipole moments on the Stark line shape. Phys. Rev. A 2016, 94, 022501. [Google Scholar] [CrossRef]
  20. Demura, A.V. Beyond the Linear Stark Effect: A Retrorespective. Atoms 2018, 6, 33. [Google Scholar] [CrossRef]
  21. Gigosos, M.A.; González, M.Á.; Cardeñoso, V. Computer simulated Balmer-alpha, -beta and -gamma Stark line profiles for non-equilibrium plasmas diagnostics. Spectrochim. Acta B At. Spectrosc. 2003, 58, 1489–1504. [Google Scholar] [CrossRef]
  22. Parigger, C.G.; Helstern, C.M.; Drake, K.A.; Gautam, G. Balmer-series hydrogen-beta line dip-shifts for electron density measurements. Int. Rev. At. Mol. Phys. 2017, 8, 53–61. [Google Scholar]
  23. Parigger, C.G.; Gautam, G.; Surmick, D.M. Radial electron density measurements in laser-induced plasma from Abel inverted hydrogen Balmer beta line profiles. Int. Rev. At. Mol. Phys. 2015, 6, 43–55. [Google Scholar]
  24. Konjević, N.; Ivković, M.; Sakan, N. Hydrogen Balmer lines for low electron number density plasma diagnostics. Spectrochim. Acta B At. Spectrosc. 2012, 76, 16–26. [Google Scholar] [CrossRef]
  25. Ivković, M.; Konjević, N.; Pavlović, Z. Hydrogen Balmer beta: The separation between line peaks for plasma electron density diagnostics and self-absorption test. J. Quant. Spectrosc. Radiat. Trans. 2015, 154, 1–8. [Google Scholar] [CrossRef]
  26. Leonard, S.L. Basic Macroscopic Measurements. In Plasma Diagnostic Techniques; Huddlestone, R.H., Leonard, S.L., Eds.; Academic Press: New York, NY, USA, 1965; pp. 7–67. [Google Scholar]
  27. Griem, H.R. Plasma Spectroscopy; McGraw-Hill Book Company: New York, NY, USA, 1964. [Google Scholar]
  28. Griem, H.R. Spectral Line Boradening by Plasmas; Academic Press: Cambridge, MA, USA, 1974. [Google Scholar]
  29. Kunze, H.-J. Introduction to Plasma Spectroscopy; Springer: New York, NY, USA, 2009; ISBN 978-3-642-02232-6. [Google Scholar]
  30. Wiese, W.L. Line Broadening. In Plasma Diagnostic Techniques; Huddlestone, R.H., Leonard, S.L., Eds.; Academic Press: New York, NY, USA, 1965; pp. 265–317. [Google Scholar]
  31. McWhirter, R.W.P. Spectral Intensities. In Plasma Diagnostic Techniques; Huddlestone, R.H., Leonard, S.L., Eds.; Academic Press: New York, NY, USA, 1965; pp. 201–264. [Google Scholar]
  32. Sobel’man, I.I.; Vainshtein, L.A.; Yukov, E.A. Ecitation of Atoms and Broadening of Spectral Lines, 2nd ed.; Springer: New York, NY, USA, 1995; ISBN 978-3-540-58686-9. [Google Scholar]
  33. Fujimoto, T. Plasma Spectroscopy; Clarendon Press: Oxford, UK, 2004; pp. 213–235. ISBN 9780198530282. [Google Scholar]
  34. Djurović, S.; Ćirišan, M.; Demura, A.V.; Demchenko, G.V.; Nikolić, D.; Gigosos, M.A.; Gonzáles, M.Á. Measurements of Hβ central asymmetry and its analysis through standard theory and computer simulations. Phys. Rev. E 2009, 79, 046402. [Google Scholar] [CrossRef] [PubMed]
  35. Stambulchick, E.; Maron, Y. Plasma line broadening and computer simulations: A mini-review. High Energy Density Phys. 2010, 6, 9–14. [Google Scholar] [CrossRef]
  36. Oks, E. Stark Broadening of Hydrogen and Hydrogenlike Spectral Lines in Plasmas: The Physical Insight; Alpha Science International: Oxford, UK, 2006; pp. 1–118. ISBN 1-84265-252-4. [Google Scholar]
  37. Oks, E. Diagnostics of Laboratory and Astrophysical Plasmas Using Spectral Lineshapes of One-, Two-, and Three-Electron Systems; World Scientific: Singapore, 2017; pp. 1–47. ISBN 9789814699075. [Google Scholar]
  38. Tremblay, P.-E.; Bergeron, P. Spectroscopic Analysis of DA White dwarfs: Stark broadening of hydrogen lines including nonideal effects. Astrophys. J. 2009, 696, 1755–1770. [Google Scholar] [CrossRef]
  39. Gianninas, A.; Bergeron, P.; Dupuis, J.; Ruiz, M.T. Spectroscopic analysis of hot, hydrogen-rich white dwarf: The presence of metals and the Balmer-line problem. Astrophys. J. 2010, 720, 581–602. [Google Scholar] [CrossRef]
  40. Tremblay, P.-E. Analyse Spectroscopique D’étoiles Naines Blanches Riches en Hydrogène (DA): Vers des Modèles D’atmosphère Améliorés Sans Paramètres Libres. Ph.D. Thesis, Université de Montéal, Montréal, QC, Canada, 2011. [Google Scholar]
  41. Falcon, R.E.; Winget, D.E.; Montgomery, M.H.; Williams, K.A. A gravitational redshift determination of the mean mass of white dwarf DA stars. Astrophys. J. 2010, 712, 585–595. [Google Scholar] [CrossRef]
  42. Koester, D. White dwarf spectra and atmosphere models. Mem. Soc. Astronom. Ital. 2010, 81, 921–931. [Google Scholar]
  43. Falcon, R.E. Creating and Measuring White Dwarf Photospheres in a Terrestrial Laboratory. Ph.D. Thesis, University of Texas, Austin, TX, USA, 2014. [Google Scholar]
  44. Falcon, R.E.; Rochau, G.A.; Bailey, J.E.; Gomez, T.A.; Montgomery, M.H.; Winget, D.E.; Nagayama, T. Laboratory measurements of white dwarf photospheric spectral lines: Hβ. Astrophys. J. 2015, 806, 214–224. [Google Scholar] [CrossRef]
  45. Holberg, J.B.; Barstow, M.A.; Bruhweiler, F.C.; Cruise, A.M.; Penny, A.J. Sirius B: A new, more accurate view. Astrophys. J. 1998, 497, 935–942. [Google Scholar] [CrossRef]
  46. Provencal, J.L.; Shipman, H.L.; Høg, E.; Thejll, P. Testing the white dwarf mass-radius relation with Hipparcos. Astrophys. J. 1998, 494, 759–767. [Google Scholar] [CrossRef]
  47. Chandrasekhar, S. The maximum mass of ideal white dwarfs. Astrophys. J. 1931, 74, 81–82. [Google Scholar] [CrossRef]
  48. King, A.R. Accretion and evolution in close binaries. In Astrophysical and Laboratory Plasmas—A Festschrift for Professor Robert Wilson; Willis, A.J., Hartquist, T.W., Eds.; Springer: Dordrecht, NL, USA, 1996; pp. 169–186. ISBN 978-90-481-4729-8. [Google Scholar]
  49. Halenka, J.; Vujićić, B.; Djurović, S. Shift of the peaks of the Hβ spectral line. J. Quant. Spectrosc. Radiat. Trans. 1989, 42, 571–573. [Google Scholar] [CrossRef]
  50. Mijatović, Z.; Pavlov, M.; Djurović, S. Shift of the Hβ line in dense hydrogen plasmas. Phys. Rev. A 1991, 43, 6095–6097. [Google Scholar] [CrossRef] [PubMed]
  51. Schrödinger, E. Quantisierung als Eigenwertproblem. Ann. Phys. 1926, 385, 437–490. [Google Scholar] [CrossRef]
  52. Holtsmark, J. Über die Verbreiterung von Spectrallinien. Ann. Phys. 1919, 58, 577–630. [Google Scholar] [CrossRef]
  53. Van Regenmorter, H. Spectral line broadening. Ann. Rev. Astron. Astrophys. 1965, 3, 71–92. [Google Scholar] [CrossRef]
  54. Limoǵe, M.-M.; Bergeron, P.; Lépine, S. Physical properties of the current census of northern white dwarfs within 40 pc of the sun. Astrophys. J. 2011, 219, 19–53. [Google Scholar] [CrossRef]
  55. Gianninas, A.; Bergeron, P.; Ruiz, M.T. A spectroscopic survey and analysis of bright, hydrogen-rich white dwarfs. Astrophys. J. 2011, 743, 138–164. [Google Scholar] [CrossRef]
  56. Koester, D.; Voss, B.; Napiwotzki, R.; Christlieb, N.; Homeier, D.; Lisker, T.; Reimers, D.; Heber, U. High-resolution UVES/VLT spectra of white dwarfs observed for the ESO SN Ia Progenitor Survey III. DA white dwarfs. Astron. Astrophys. 2009, 505, 441–462. [Google Scholar] [CrossRef]
  57. Narayan, G.; Axelrod, T.; Holberg, J.B.; Matheson, T.; Saha, A.; Olszewski, E.; Claver, J.; Stubbs, C.W.; Bohlin, R.C.; Deustua, S.; Rest, A. Toward a network of faint DA white dwarfs as high-precision spectrophotometric standards. Astrophys. J. 2016, 822, 67–80. [Google Scholar] [CrossRef]
  58. Kleinman, S.J.; Harris, H.C.; Eisenstein, D.J.; James Liebert, J.; Nitta, A.; Jurek Krzesiński, J.; Munn, J.A.; Dahn, C.C.; Hawley, S.L.; Pier, J.R.; et al. A catalog of spectroscopically confirmed white dwarfs oin the first data realease of the Sloan digital sky survey. Astrophys. J. 2004, 607, 426–444. [Google Scholar] [CrossRef]
  59. Eisenstein, D.J.; Liebert, J.; Harris, H.C.; Kleinman, S.J.; Nitta, A.; Nicole Silvestri, N.; Anderson, S.A.; Barentine, J.C.; Brewington, H.J.; Brinkmann, J.; et al. A catalog of spectroscopically confirmed white dwarfs from the Sloan digital sky survey data release 4. Astrophys. J. Suppl. Ser. 2006, 167, 40–58. [Google Scholar] [CrossRef]
  60. Tremblay, P.-E.; Bergeron, P.; Gianninas, A. An improved spectroscopic analysis of DA white dwarfs from the Sloan digital survey data release 4. Astrophys. J. Suppl. Ser. 2011, 730, 128–150. [Google Scholar] [CrossRef]
  61. Rosato, J.; Kieu, N.; Hannachi, I.; Koubiti, M.; Marandet, Y.; Stamm, R.; Dimitrijevicć, M.S.; Simić, Z. Stark-Zeeman Line Shape Modeling for Magnetic White Dwarf and Tokamak Edge Plasmas: Common Challenges. Atoms 2017, 5, 36. [Google Scholar] [CrossRef]
  62. Kieu, N.; Rosato, J.; Stamm, R.; Kovačević-Dojicinović, J.; Dimitrijević, M.S.; Popović, L.Č.; Simić, Z. A New Analysis of Stark and Zeeman Effects on Hydrogen Lnes in Magnetized DA White Dwarfs. Atoms 2017, 5, 44. [Google Scholar] [CrossRef]
  63. Vogt, S.S.; Penrod, D.G. HIRES: A High Resolution Echelle Spectrometer for the Keck 10-Meter Telescope. In Instrumentation for Ground-Based Optical Astronomy—Santa Cruz Summer Workshops in Astronomy and Astrophysics; Robinson, L.B., Ed.; Springer: New York, NY, USA, 1988. [Google Scholar] [CrossRef]
  64. W.M. Keck Observatory Archive (KOA). Extracted HIRES Spectra for the White Dwarf HG7-85, KOA-ID: HI.20121028.35667. Available online: https://koa.ipac.caltech.edu (accessed on 5 May 2018).
  65. Zuckerman, B.; Xu, S.; Klein, B.; Jura, A. Thy Hyades cluster: Identification of a planetary system and ascaping white dwarfs. Astrophys. J. 2013, 770, 140–141. [Google Scholar] [CrossRef]
  66. Keller, J. Nonlinear Fitting n-Dimensional Data with Arbitrary Functions; Mathworks File Exchange: Natick, MA, USA, 2008; Available online: https://www.mathworks.com/matlabcentral/fileexchange/20540-nonlinear-fitting-n-dimensional-data-with-arbitrary-functions (accessed on 14 February 2018).
  67. Parigger, C.G.; Woods, A.C.; Witte, M.J.; Swafford, L.D.; Surmick, D.M. Measurement and Analysis of Atomic Hydrogen and Diatomic Molecular AlO, C2, CN, and TiO Spectra Following Laser-induced Optical Breakdown. J. Vis. Exp. 2014, 84, e51250. [Google Scholar] [CrossRef]
  68. Parigger, C.G.; Woods, A.C.; Surmick, D.M.; Gautam, G.; Witte, M.J.; Hornkohl, J.O. Computation of diatomic molecular spectra for selected transitions of aluminum monoxide, cyanide, diatomic carbon, and titanium monoxide. Spectrochim. Acta B At. Spectrosc. 2015, 107, 132–138. [Google Scholar] [CrossRef]
  69. Surmick, D.M.; Parigger, C.G. Empirical Formulae for Electron Density Diagnostics from Hα and Hβ Line Profiles. Int. Rev. At. Mol. Phys. 2014, 5, 73–81. [Google Scholar]
  70. Büscher, S.; Wrubel, T.; Ferri, S.; Kunze, H.-J. The Stark width and shift of the hydrogen Hα line. J. Phys. B At. Mol. Opt. Phys. 2002, 35, 2889–2897. [Google Scholar] [CrossRef]
  71. Kask, N.E.; Michurin, S.V. Broadening of the spectral lines of a buffer gas and target substance. Quant. Electron. 2012, 42, 1002–1007. [Google Scholar] [CrossRef]
  72. Kask, N.E.; Lexsina, E.G.; Michurin, S.V.; Fedorov, G.M.; Chopornyak, D.B. Broadening and shift of the spectral lines of hydrogen atoms and silicon ions in laser plasma. Quant. Electron. 2015, 45, 527–532. [Google Scholar] [CrossRef]
  73. Witkovsky, V. CharFunTool: The Characteristic Functions Toolbox. Matlab® File Exchange: Script cfX_PDF.m for Exponential Distributions in the CF_Repository. Available online: https://www.mathworks.com/matlabcentral/fileexchange/64400-charfuntool–the-characteristic-functions-toolbox (accessed on 19 March 2018).
  74. Demura, A.V. Physical Models of Plasma Microfield. Int. J. Spectrosc. 2010, 2010, 671073. [Google Scholar] [CrossRef]
  75. Griem, H.R. Stark Broadening of Higher Hydrogen and Hydrogen-like lines by electrons and ions. Astrophys. J. 1960, 132, 883–893. [Google Scholar] [CrossRef]
  76. Griem, H.R.; Kolb, A.C.; Shen, K.Y. Stark Profile Calculations for the Hβ Line of Hydrogen. Astrophys. J. 1962, 135, 272–276. [Google Scholar] [CrossRef]
  77. Sapar, A.; Poolamäe, R.; Sapar, L. High-precision approximation expressions for line profiules of hydrogenic particles. Baltic Astron. 2006, 15, 435–447. [Google Scholar]
  78. Sapar, A.; Poolamäe, R. Revised line profile function for hydrogenic species. Open Astron. 2012, 21, 243–254. [Google Scholar] [CrossRef]
Figure 1. H β spectra for τ = 400 ns and inferred electron densities of 2.3 × 10 17 cm 3 : (a) line-of-sight at the vertical center of the 4-mm plasma; and (b) Abel-inverted spectrum 0.5 mm from the horizontal center [23].
Atoms 06 00036 g001
Figure 2. H β line-of-sight spectra: (a) τ = 650 ns, N e = 1.4 × 10 17 cm 3 , H 2 gas pressure of 1.06 × 10 5 Pa [23]; and (b) τ = 100 ns, spectral resolving power 24,000 or resolution of 0.02 nm, N e = 8.6 × 10 17 cm 3 , H 2 gas pressure of 1.32 × 10 5 Pa [17].
Atoms 06 00036 g002
Figure 3. Sirius B and Procyon white dwarf spectra [5]: (a) Sirius B at 26 kK; and (b) Procyon B at 8 kK.
Atoms 06 00036 g003
Figure 4. Astrophysical white dwarf spectra: (a) WD 1643+143 [55]; and (b) WD 1204+023 [5] or SDSS J120650 [57].
Atoms 06 00036 g004
Figure 5. Magnetic white dwarf HS 1031 + 0343 spectra [56]: (a) H β ; and (b) H α .
Atoms 06 00036 g005
Figure 6. Hyades cluster white dwarf HG 7-85, recorded with a resolving-power 40,000 Echelle-spectrometer: (a) H β expanded region; and (b) H β center portion.
Atoms 06 00036 g006
Figure 7. Typical experimental arrangement for generation and measurement of laser-induced plasma.
Atoms 06 00036 g007
Table 1. Sirius B parameters [45].
Temperature [K]Gravity [cm/s 2 ]Mass Sirius B /Mass sun Radius Sirius B /Radius sun
24,790 ± 100 log g = 8.57 ± 0.06 0.984 ± 0.0740.0084 ± 0.00025
Table 2. Sirius B and Procyon B masses and radii [46], M/R ratio, and computed gravitational redshifts using Equation (2).
White Dwarf StarMass/Mass sun Radius/Radius sun M/R v g [km/s]
Sirius B1.03 ± 0.0150.0111 ± 0.000792.7959.02
Procyon B0.594 ± 0.0120.0096 ± 0.000561.8839.35

