Laser-Induced Plasma Measurements Using Nd:YAG Laser and Streak Camera: Timing Considerations


Institute of Physics, University of Belgrade, 11090 Belgrade, Serbia
*
Author to whom correspondence should be addressed.
Atoms 2019, 7(1), 6; https://doi.org/10.3390/atoms7010006
Submission received: 6 November 2018
/
Revised: 20 December 2018
/
Accepted: 24 December 2018
/
Published: 2 January 2019
(This article belongs to the Special Issue SPIG2018)
Abstract
:We describe a streak camera system that is capable of both spatial and spectral measurements of laser-induced plasma. The system is based on a Hamamatsu C4334 streak camera and SpectraPro 2300i spectrograph. To improve the analysis of laser-induced plasma development, it is necessary to determine the timing of laser excitation in regard to the time scale on streak images. We present several methods to determine the laser signal timing on streak images—one uses the fast photodiode, and other techniques are based on the inclusion of the laser pulse directly on the streak image. A Nd:YAG laser (λ = 1064 nm, Quantel, Brilliant B) was employed as the excitation source. The problem of synchronization of the streak camera with the Q-switched Nd:YAG laser is also analyzed. A simple modification of the spectrograph enables easy switching between the spectral and spatial measurement modes.
1. Introduction
Laser-induced breakdown (LIB) is induced by focusing an intense laser beam on a gas, liquid, or solid target. Studying the plasma formation with a high temporal, spectral, and spatial resolution is of a great interest, and the formation of laser-induced breakdown of plasma in air has been studied by many researchers [1,2,3,4,5,6], including the references presented herein.
After the initial breakdown, plasma plume propagates towards the laser beam focusing lens [1,3]. The bright plasma core of the LIB in the open air is surrounded by a layer of cold, moderately ionized gas called the sheath [1]. The glow of the plasma sheath, although fainter than that of the core, is also visible to the naked eye. An explosive plasma-expansion induces optodynamic phenomena, i.e., the propagation of shock, acoustical, and ultrasonic waves.
Our research of the optical emission of the plasma has been limited thus far to the analysis of time-resolved optical emission spectra acquired by the streak camera [7,8,9]. To make our study more comprehensive, we saw the need to measure the spatial distribution of plasma optical emissions. The requirement for easy switching between the spectral and spatial measurement modes of our streak camera system soon became apparent to us.
In this paper, we describe an experimental system that is capable of both spatial and spectral measurements of laser-induced plasma with picosecond temporal resolution. Our experimental system is based on the Hamamatsu C4334 streak camera and SpectraPro 2300i spectrograph. A similar streak camera system was used by Hori and Akamatsu [6] in a time-resolved spatial analysis of the optical emissions from laser-induced plasma in air. We performed a simple modification of the spectrograph to enable easy switching between the spectral and spatial measurement modes. Later, we became aware that this modification had already been proposed and successfully used in the study of Siegel et al. [10], where the imaging device used was an intensified charge-coupled device (ICCD) camera.
To improve the analysis of laser-induced plasma development, it is necessary to determine the timing of laser excitation in regard to the time scale on streak images. We present several methods to determine the laser excitation timing on streak images—one uses the fast photodiode, and the other techniques are based on including the laser pulse directly on the streak image. The problem of synchronization of the streak camera with the Q-switched Nd:YAG laser is thoroughly analyzed in this paper.
2. Experimental Setup
2.1. Excitation System
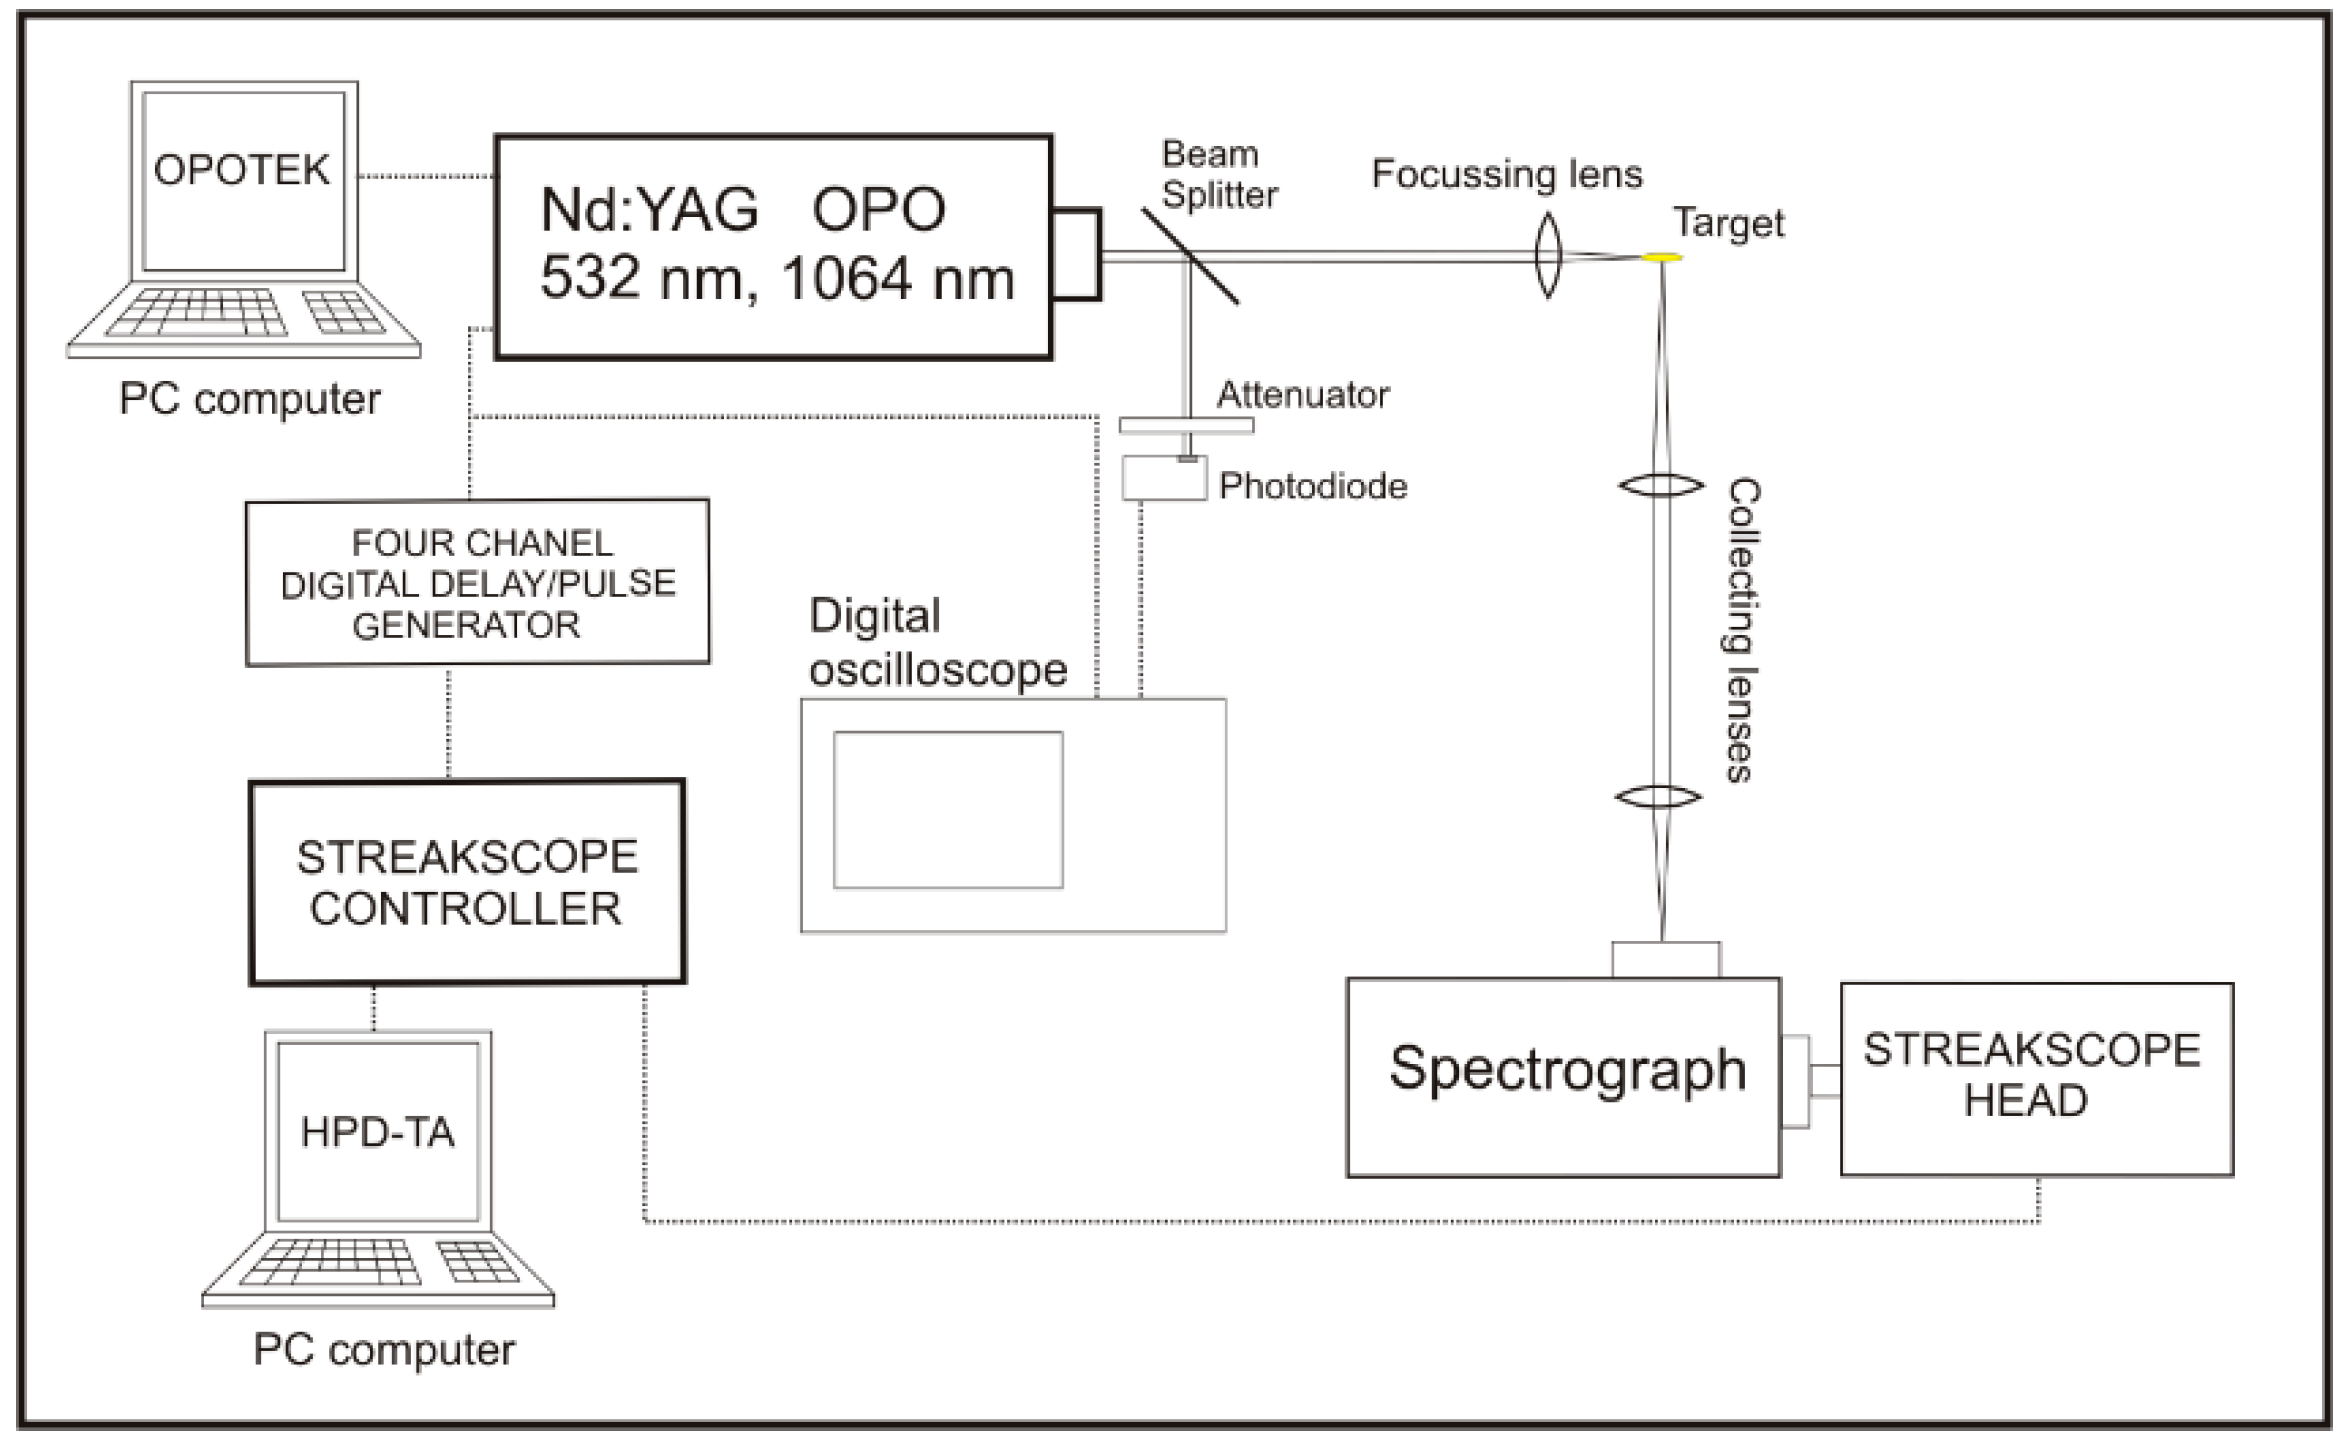
The time-resolved laser-induced breakdown spectroscopy (LIBS) system implemented in our laboratory was based on the Nd:YAG laser, and the Optical Parametric Oscillator (OPO; Vibrant 266). The OPO system, which was pumped by a pulsed Q-switched Nd:YAG laser (Brilliant B) included the second and fourth harmonic generators (SHG and FHG). In this paper, the fundamental output at 1064 nm (pulse energy up to 270 mJ) and the second harmonic output at 532 nm (pulse energy up to 68 mJ) were used to create an optical breakdown in ambient air. The laser pulse width (full width at half maximum, FWHM) was about 5 ns on both wavelengths, as presented in Section 2.2. The plasma plume in air was obtained by focusing the laser beam using a lens with a focal length of 40 mm. A schematic diagram of the experimental apparatus is shown in Figure 1. The OPO system was controlled by OPOTEK software installed on a PC. In our setup, the output energy of the laser was determined by the timing of Q-switch firing, set by OPOTEK software. This characteristic introduced some complications in streak camera triggering, because the detection system was triggered by the Q-switch signal.
2.2. Detection System
The optical emissions from the plasma plume were collected by a spectrograph (SpectraPro 2300i) and recorded with a Hamamatsu streak camera (model C4334) with an integrated video streak camera (Figure 1). The streak images were time-resolved, thus enabling the monitoring of temporal evolution of the ionic and atomic emission lines [7,8,9], or spatial development of the plasma. The fundamental advantage of the streak scope was its two-dimensional nature, which was especially important for measuring time-resolved LIBS spectra. The camera had a spectral range from 200 to 850 nm. The CCD chip had a resolution of 640 × 480 pixels. The data were acquired and analyzed using High Performance Digital Temporal Analyzer (HPD-TA) software provided by Hamamatsu.
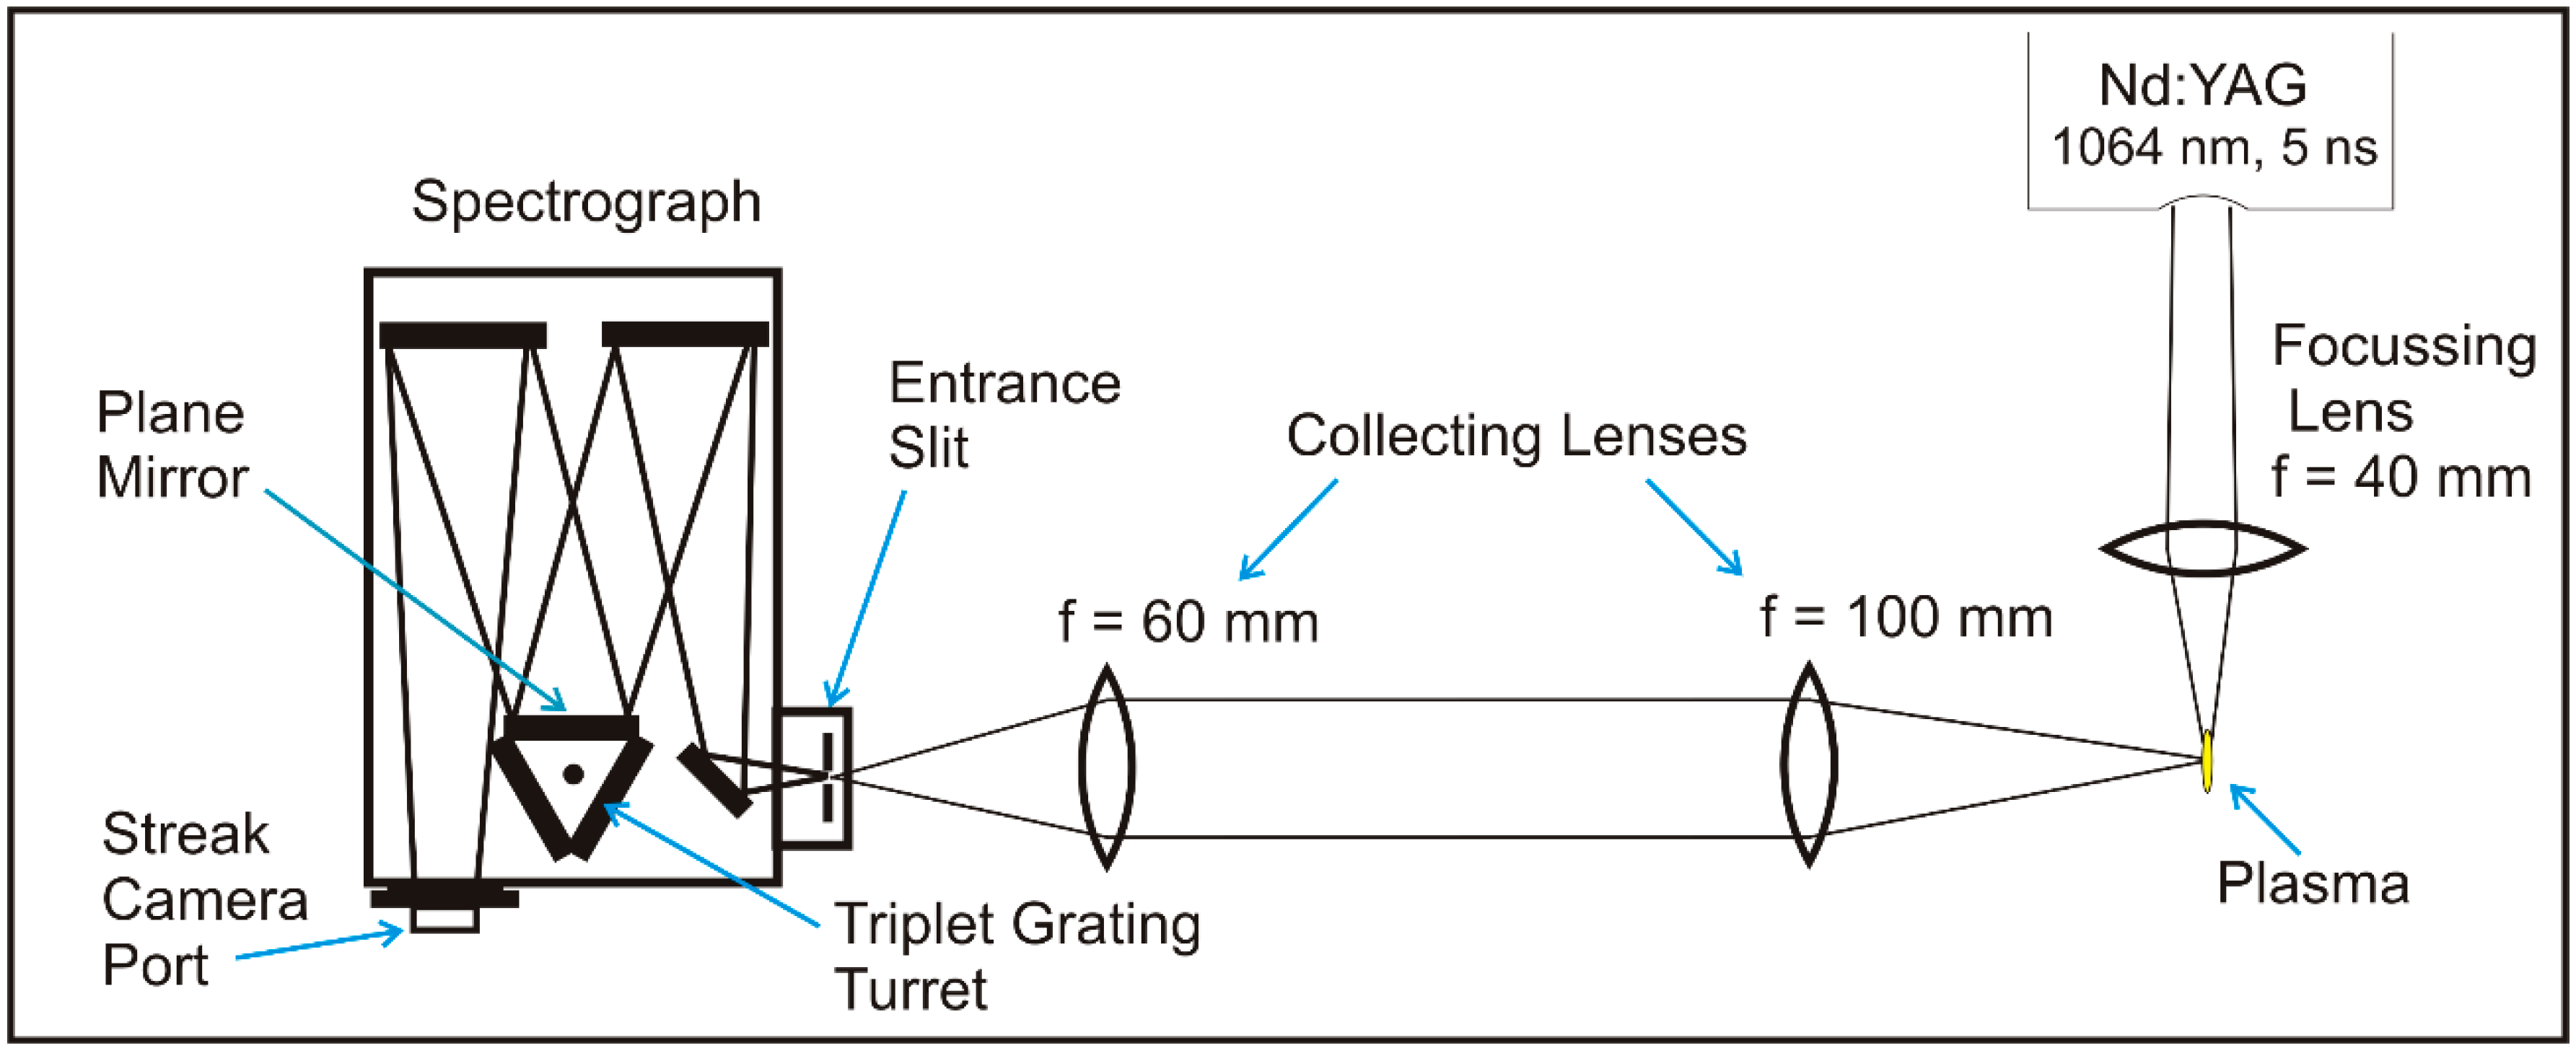
The spectrograph contained a triple grating turret. Diffraction gratings of 50, 150, and 300 grooves/mm were installed. In the place of the 150 g/mm grating, we mounted the plain mirror (see Figure 2). Thus, when grating of 150 grooves/mm was selected by HPD-TA software, the streak camera, instead of the image of the optical spectrum, took the image of the spatial distribution of the optical emissions of the laser-induced breakdown. To utilize as much of the CCD camera active area as possible, the maximal size of the spectrograph entrance slit was used. The diffraction grating of 50 grooves/mm was used when we required a wide observing wavelength window, and the grating of 300 grooves/mm was used when a better optical resolution was needed. Other optical parts of the acquisition system were chosen to obtain an overall optical magnification of 0.6. In this case, the calibration procedure showed that 1 mm on the target position corresponded to 72 pixels of the CCD camera.
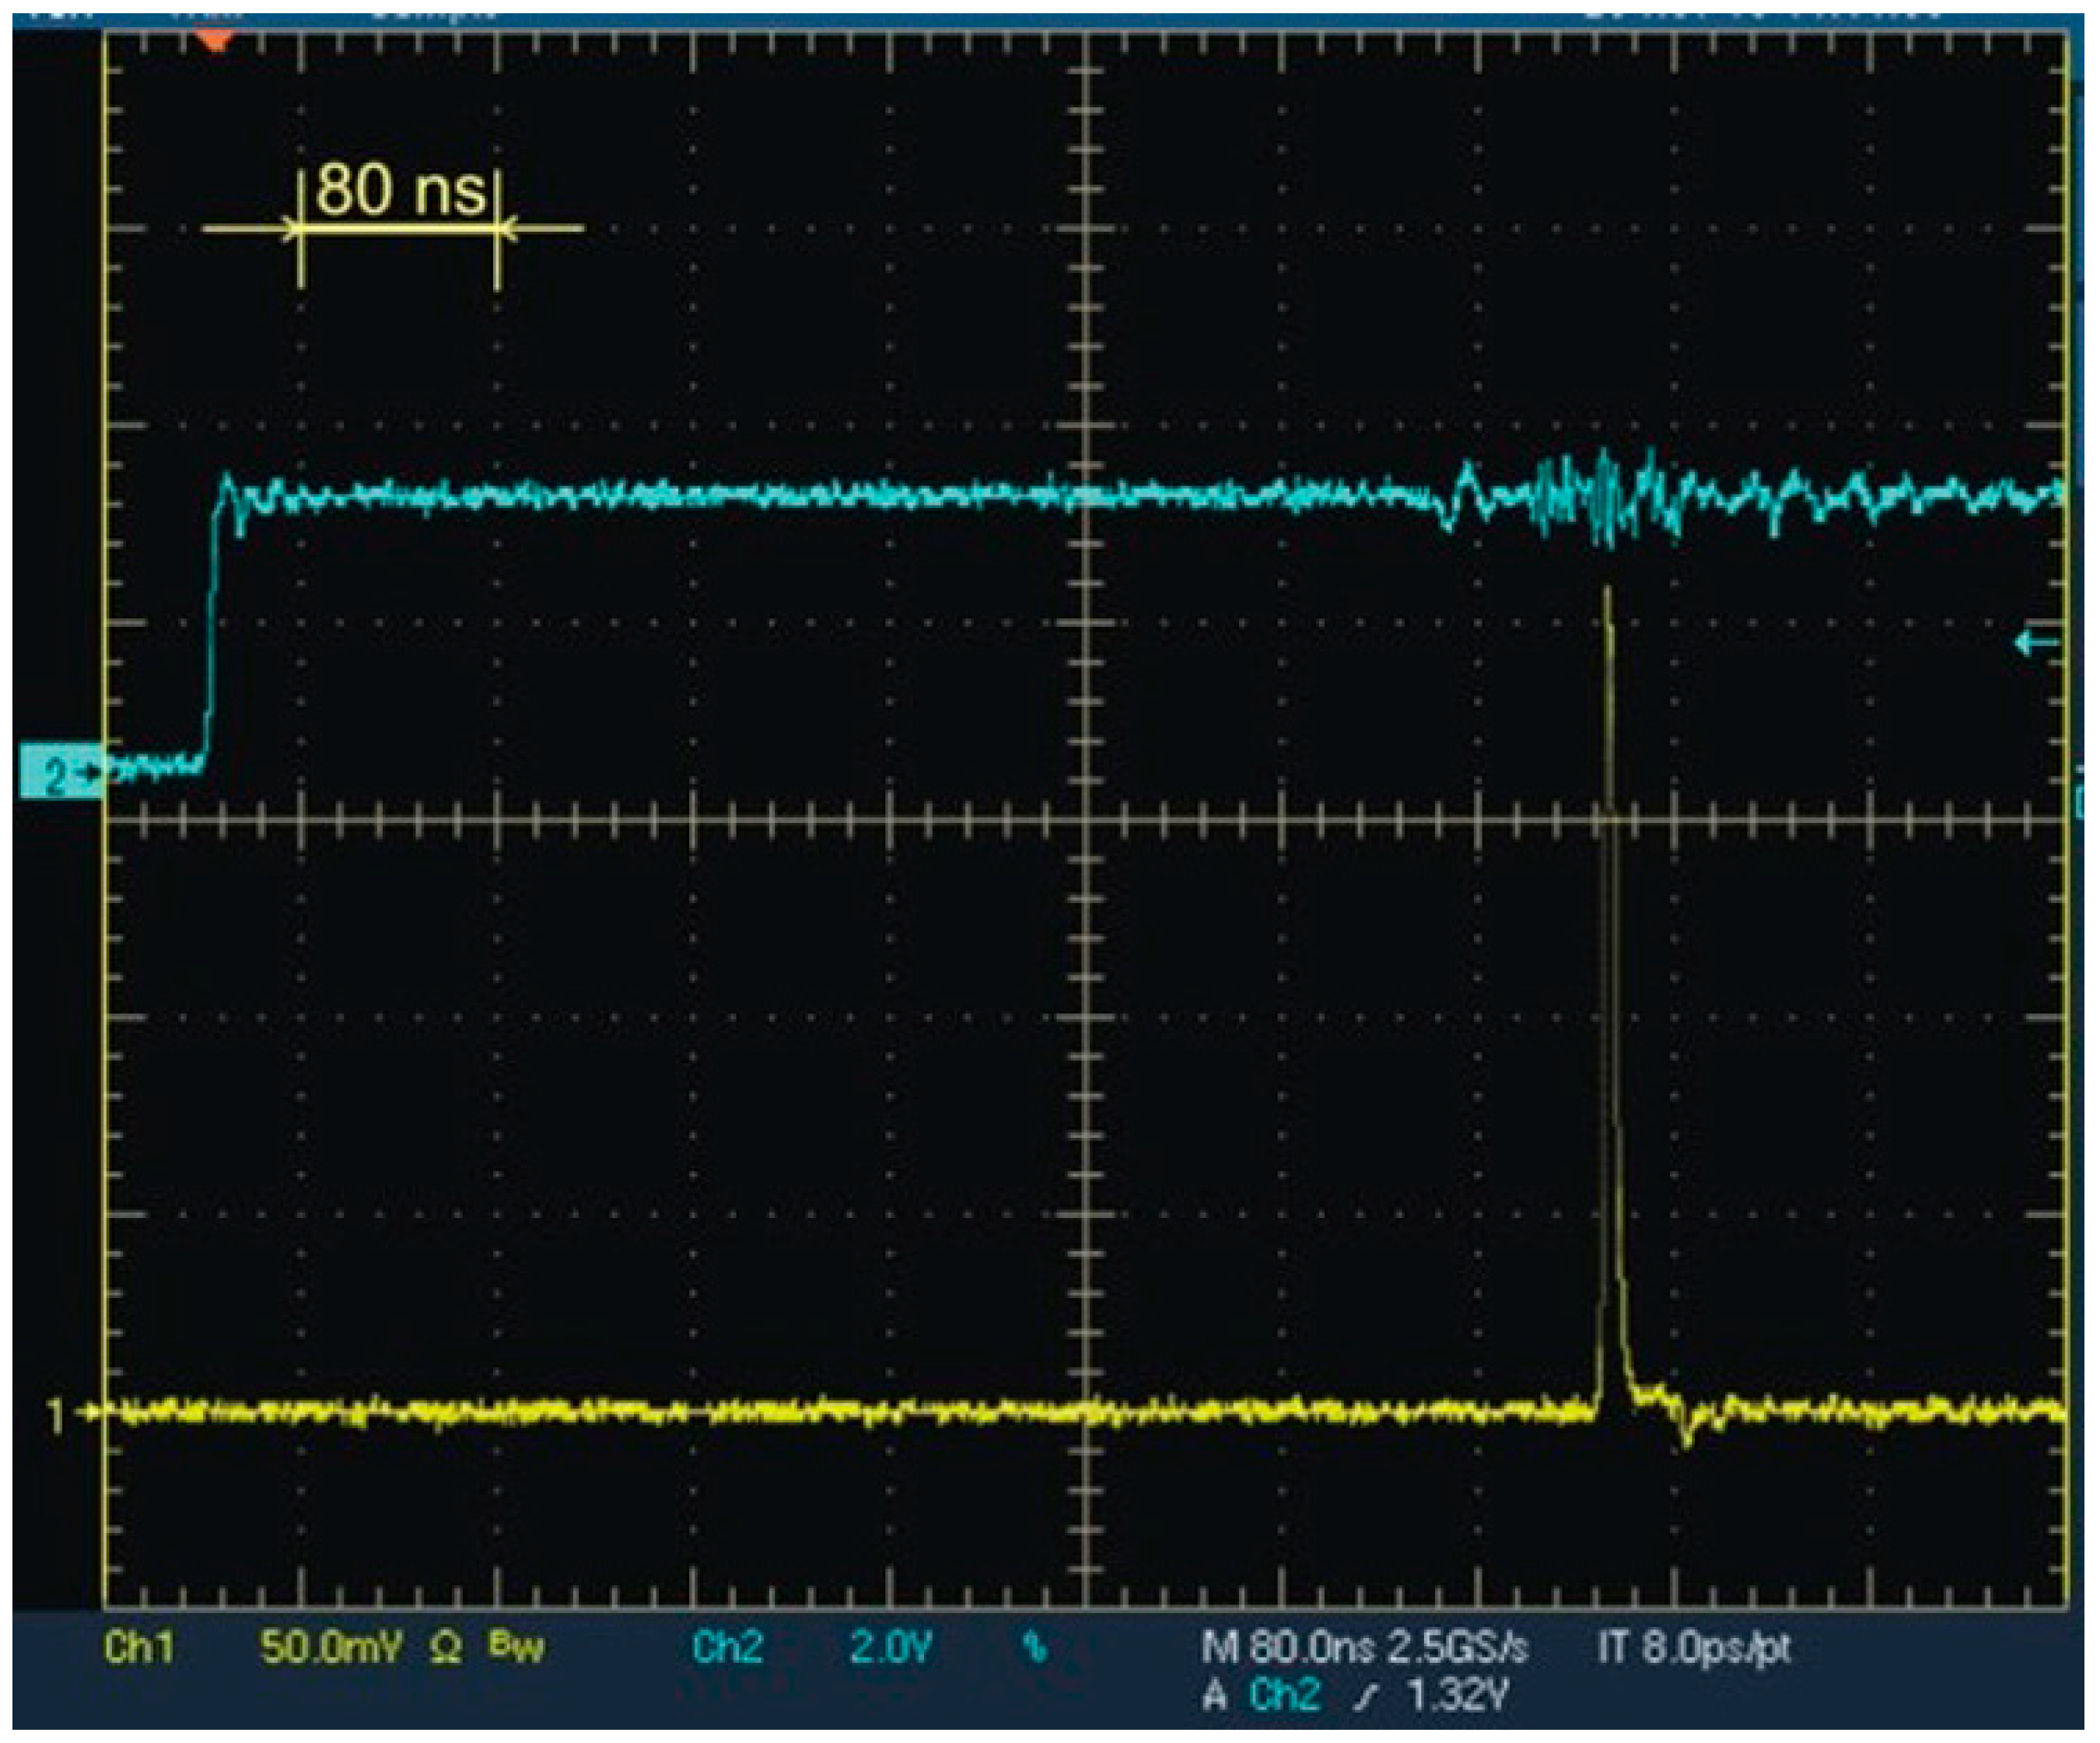
To take the streak image in the time frame of interest, the proper delay time must be set on the digital delay generator (Stanford DG 535), which triggers the streak camera (see Figure 1). In our setup, for camera time scales up to 200 ns, the laser Q-switch trigger out-signal was used to trigger the streak camera. We used a fast 1-GHz photodiode and digital oscilloscope (Tektronix TDS 5032) to determine the time interval between the Q-switch trigger and the laser pulse (see Figure 3). The laser excitation pulse was partially reflected by the beam splitter, and acquired in an attenuated form by the fast photodiode. The photodiode was chosen to be sensitive both to the fundamental (1064 nm) and second harmonic output (532 nm) of the laser. There was a significant delay between the Q-switch, the top trace (shown in Figure 3), and the laser firing recorded with fast photodiode, as shown in the bottom trace in Figure 3. A similar problem concerning the acquiring of the streak image in the time frame of interest was solved by Mohamed and Kadowaki [11] by using an image light scope.
To determine the time that a streak image begins relative to the Q-switch trigger signal and the laser pulse, we had to tabulate the important time parameters of the detection system, provided in Table 1. The output energy of our laser was varied by a laser controller, by setting the different timings of the Q-switch. Thus, the time interval between the Q-switch signal and the laser pulse was a consequence of the “percent of laser energy” parameter set by the operator on the laser control unit. Moreover, the same “percent of laser energy” corresponded to the same timings and different energy levels of the laser’s fundamental output and the laser’s second harmonic output. In the measurements presented in this paper, for example, 100% of the laser energy meant 270 mJ on the fundamental harmonic or 68 mJ on the second harmonic. To measure the values presented in Table 1, the second harmonic of the laser was used as an excitation source.
Looking at Figure 3 and Table 1, it is easy to see that the time interval between the Q-switch trigger and the laser pulse was more or less longer than the delay set on the delay generator. So, when we say the “camera dead time”, we mean the time difference between the camera trigger signal and the moment when the camera is capable of acquiring the streak image. Because of this dead time, the streak camera needed to be triggered in advance of the laser pulse using the delay generator triggered by the Q-switch.
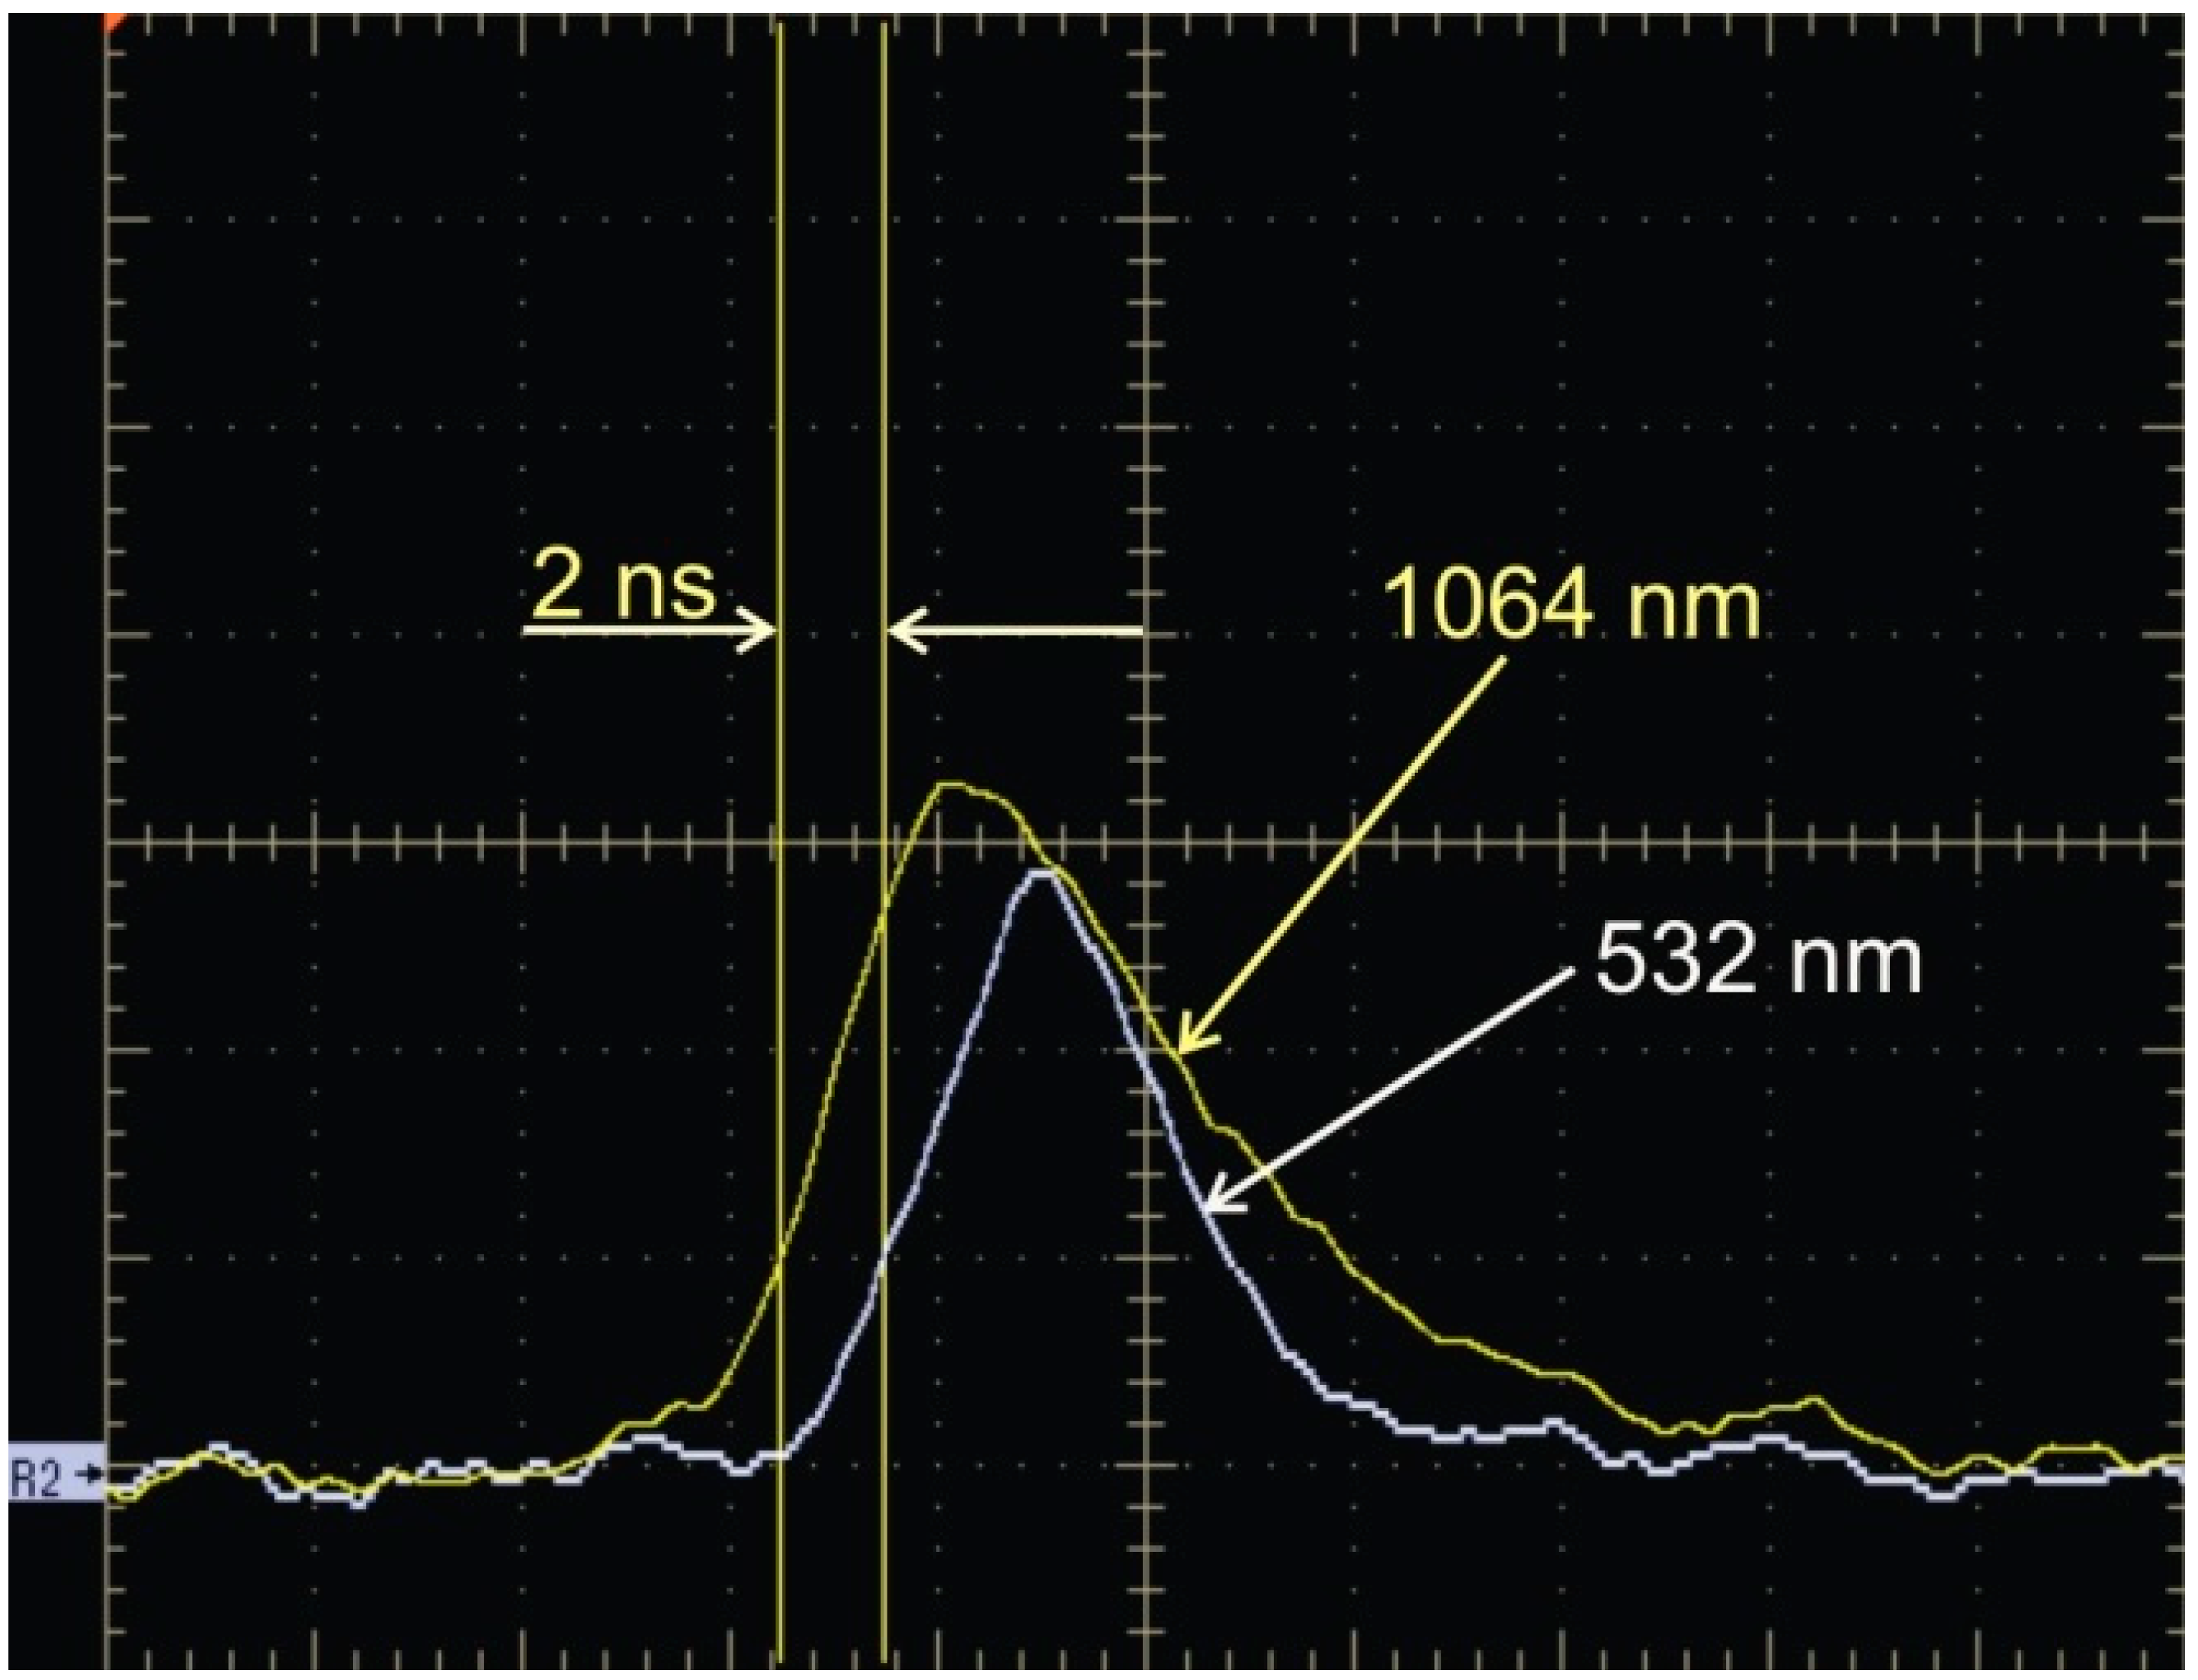
Since the spectral range of our streak camera was in the interval from 200 to 850 nm, the fundamental harmonic of our excitation pulse (at 1064 nm) could not be acquired by the streak camera. We recorded waveforms of the laser’s fundamental harmonic (1064 nm) and second harmonic (532 nm) using a fast photodiode and digital oscilloscope. The oscilloscope was triggered by the Q-switch, using an internal trigger delay. The delay between the fundamental and the second harmonic generator (SHG) was determined to be 2 ns, as shown in Figure 4. The delay came from a longer optical path passing through the SHG. Measuring the length of the optical path and calculating the time by using the known value of velocity of light gave the same result as that obtained from Figure 4.
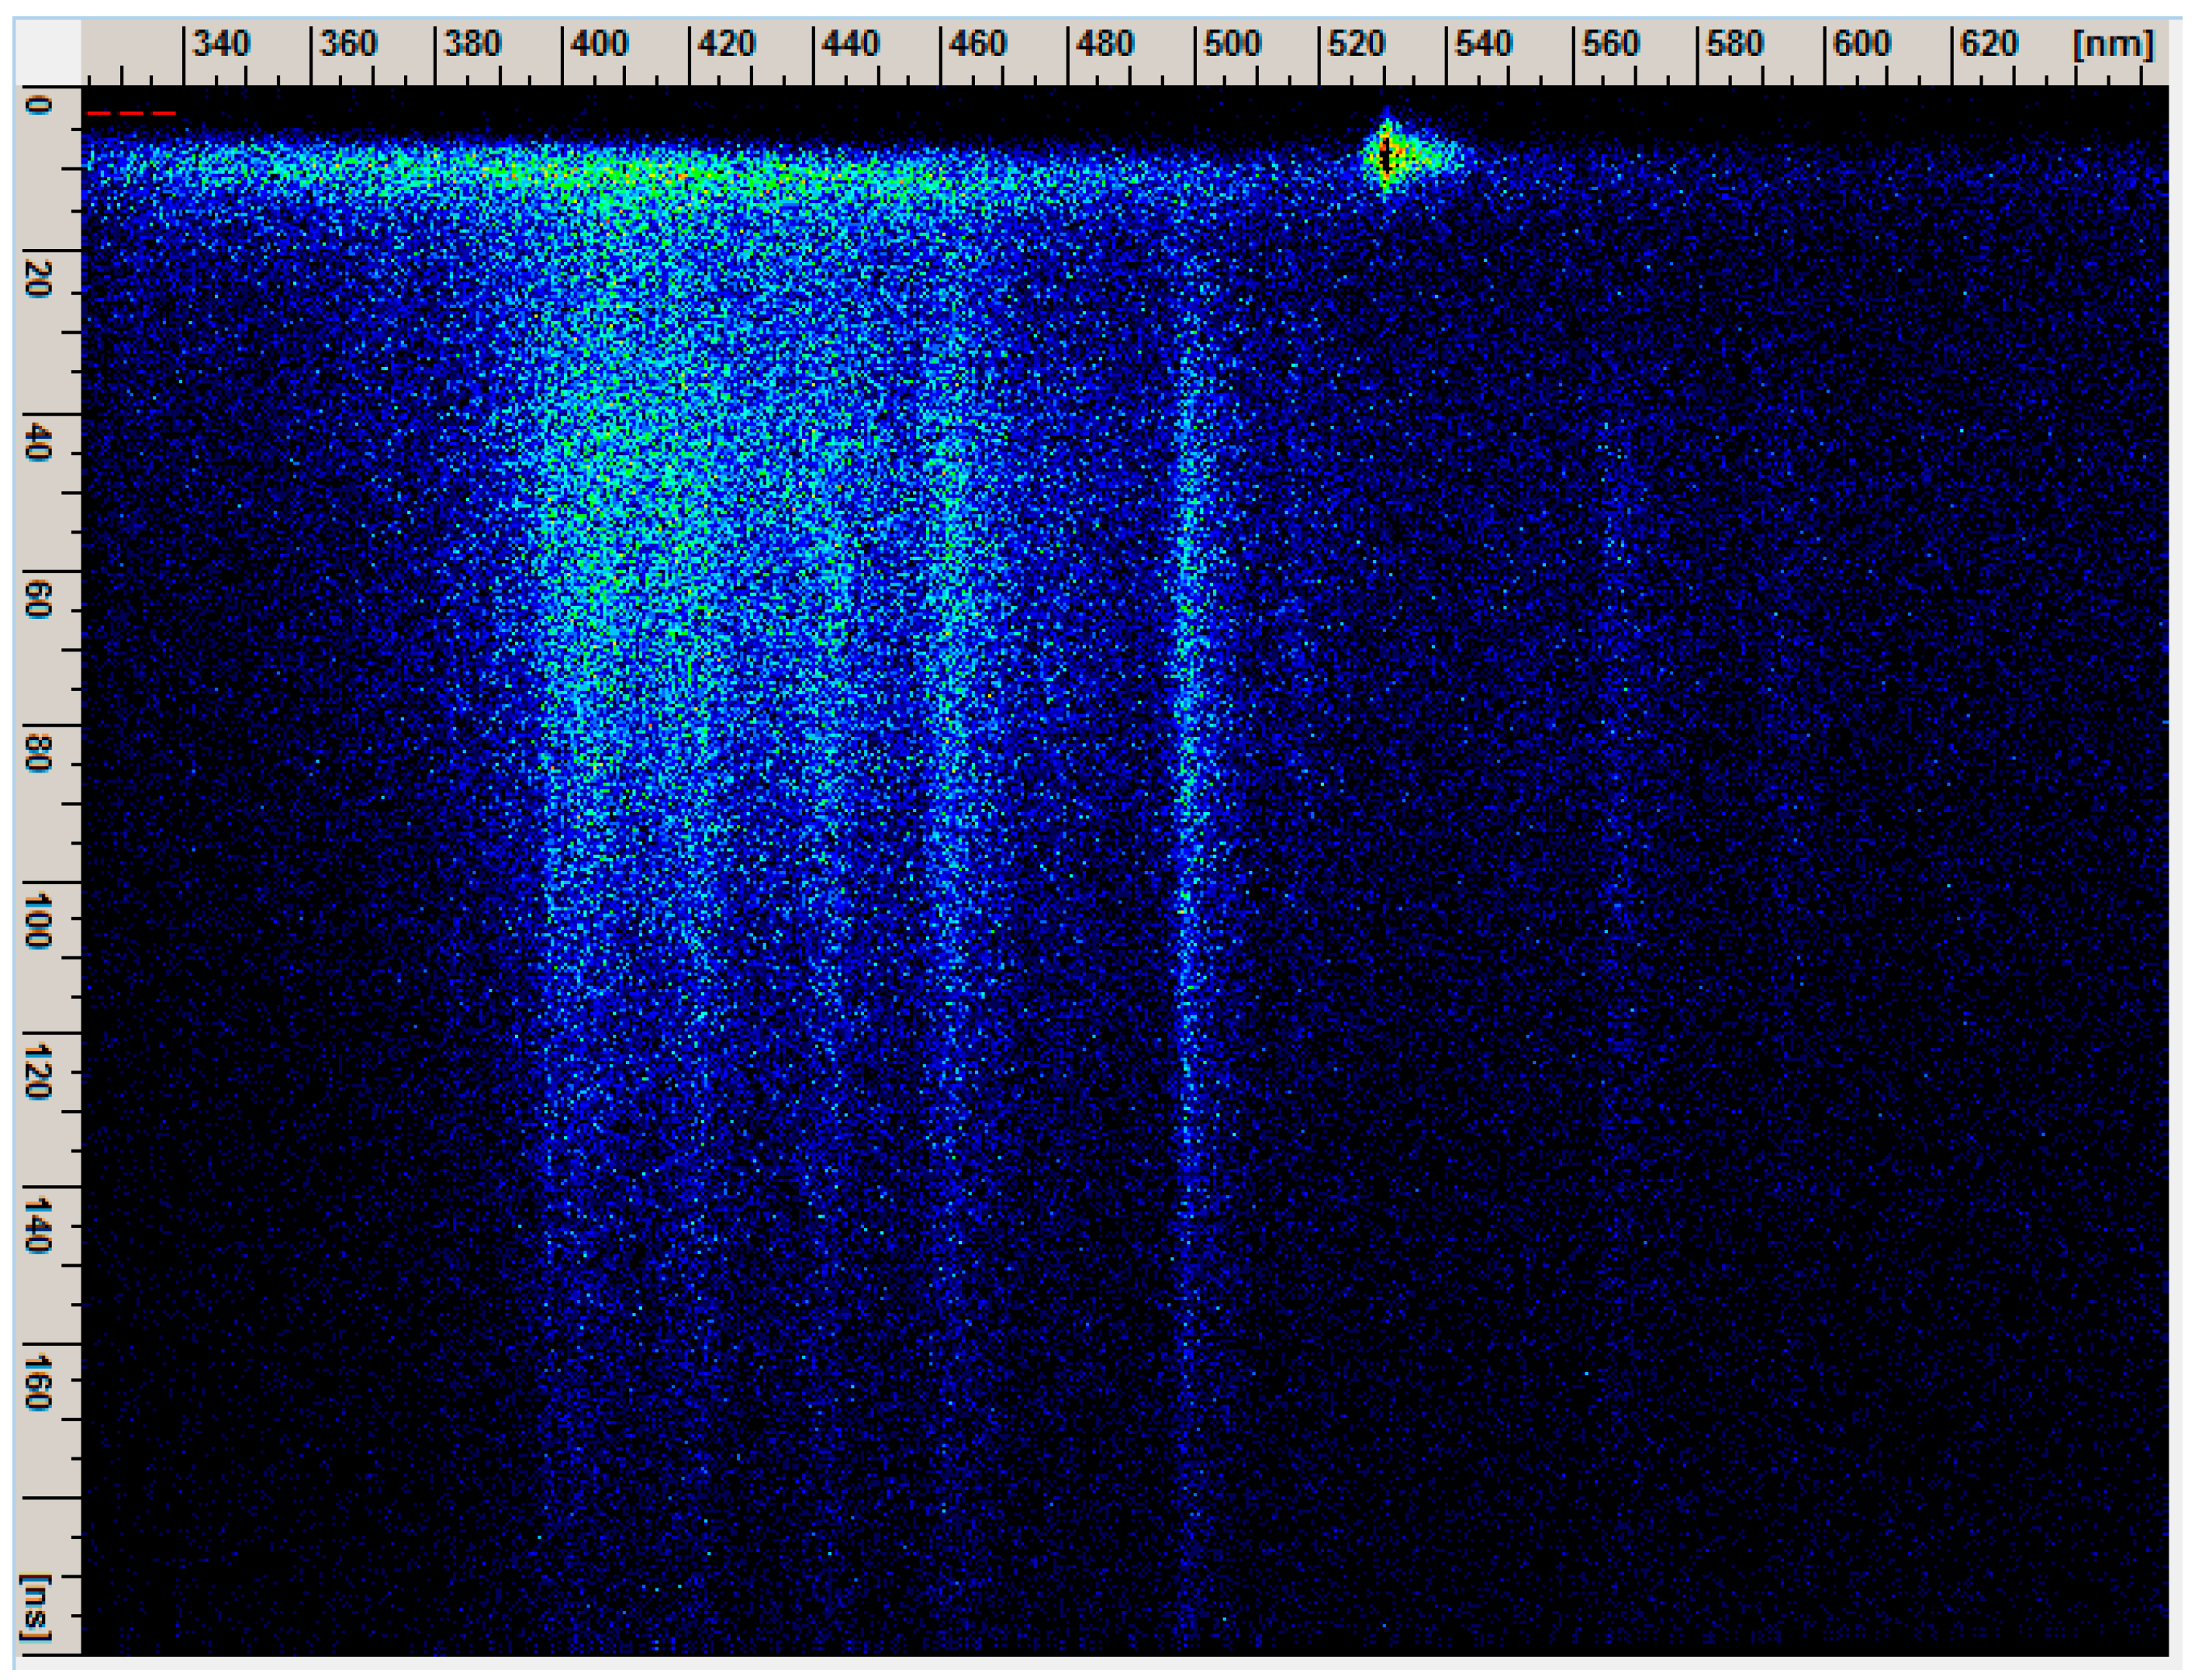
To analyze plasma development, it is necessary to determine the initiation and duration of the excitation-laser pulse on streak images. Excitation-laser pulse is visible in Figure 5 (at 532 nm), where the streak image of the optical spectrum of laser-induced air plasma is presented. The streak images are usually presented in pseudo-color, where different intensities are coded as different colors. However, for laser excitation at 1064 nm, or for spatial streak images, laser excitation is not necessarily visible.
2.3. Determination of Synchronization Timing Using the Fast Photodiode
Two problems can be solved by acquiring the laser excitation signal using the fast photodiode. First, the proper setting of the delay time generator used for triggering the streak camera can be calculated. If this time is not properly set, the time window of interest will not be acquired by the streak camera; usually, just a blank screen with some noise will be recorded. The proper setting of the delay time generator can be read from Table 1, based on selected experimental parameters, and acquiring the time interval between the Q-switch and laser firing by using the fast photodiode and digital oscilloscope, as depicted in Figure 3.
Moreover, if the start of the laser pulse is not visible on the streak image, the timing of the plasma development (recorded on the streak image) regarding the laser excitation could be calculated using the fast photodiode signal. The calculation was performed with the data provided in Table 1. The laser pulse position from the top of the streak image equaled the difference in the delay between the Q-switch trigger signal (recorded by oscilloscope) and the laser pulse, the sum of the time set on delay generator, and the camera’s dead time. If the calculated time is negative, the laser pulse has begun before the time frame visible on the streak camera screen.
2.4. Determination of Synchronization Timing by Recording the Laser Pulse on the Streak Image
There is no doubt that the determination of synchronization timing can be best achieved by recording the laser pulse on the same streak image as the plasma optical emission.
When the second harmonic of the laser at 532 nm was used as an excitation source, the laser signal was made visible and recorded on spatial streak image, as follows. By the appropriate placement of the neutral optical attenuator on the optical axis of the camera detection system, the plasma optical emissions and the elastic scattering of the laser beam from air molecules were recorded simultaneously on the same streak image (see Figure 6). The light attenuator enabled the camera to “see” the plasma breakdown (attenuated by attenuator) on the left-hand side and the laser excitation scattering (not attenuated) on the right-hand side of the focal point. The use of the attenuator was necessary to allow the optical signals of the plasma and scattered laser to have similar values; otherwise, after adjusting the gain of the detection system to match the intensity of the plasma optical emission, the laser scattering signal would not have sufficient intensity to be recorded. We discarded the original idea of transmitting the part of laser beam to the streak camera by a beam splitter as it was too risky.
Before performing any timing calculations, the streak image was corrected for possible geometric distortion. Looking at Figure 5, the horizontal tilting of the streak image can be easily seen. The tilting of the streak images stems from the fact that the deflection of streak sweep is not completely straight, but rather, elliptic. This results in a geometric distortion of the streak image in the sweep direction. The distortion, which is always present on original streak images, is not obvious when looking at Figure 6. To make time calculations based on streak images, this distortion should be corrected using the curvature correction tool provided by the camera software.
When the more powerful first harmonic of our laser was used as the excitation source, the situation was more complicated. To make laser signal at 1064 nm visible, we used a very low concentration of Rhodamine B dye embedded in PMMA thin film. On the time scales of interest in the present study, the time delay of the Rhodamine B up-conversion fluorescence response was negligible, as proven by our fluorescence measurements. Almost all of the laser beam energy was transmitted through the thin PMMA film, placed about one centimeter from the focal point at an acute (sharp) angle, but not equal to 45 degrees relative to the beam, to avoid even the partial reflection of the laser beam to the camera. The Rhodamine B fluorescence, now visible by the camera, was recorded similarly to the laser scattering shown in Figure 6. It should be noted that, in this case, only the position of the raised edge of the laser excitation was correctly acquired. Again, the use of an optical attenuator for plasma emissions was mandatory.
3. Results and Discussion
3.1. Spectroscopic Streak Images
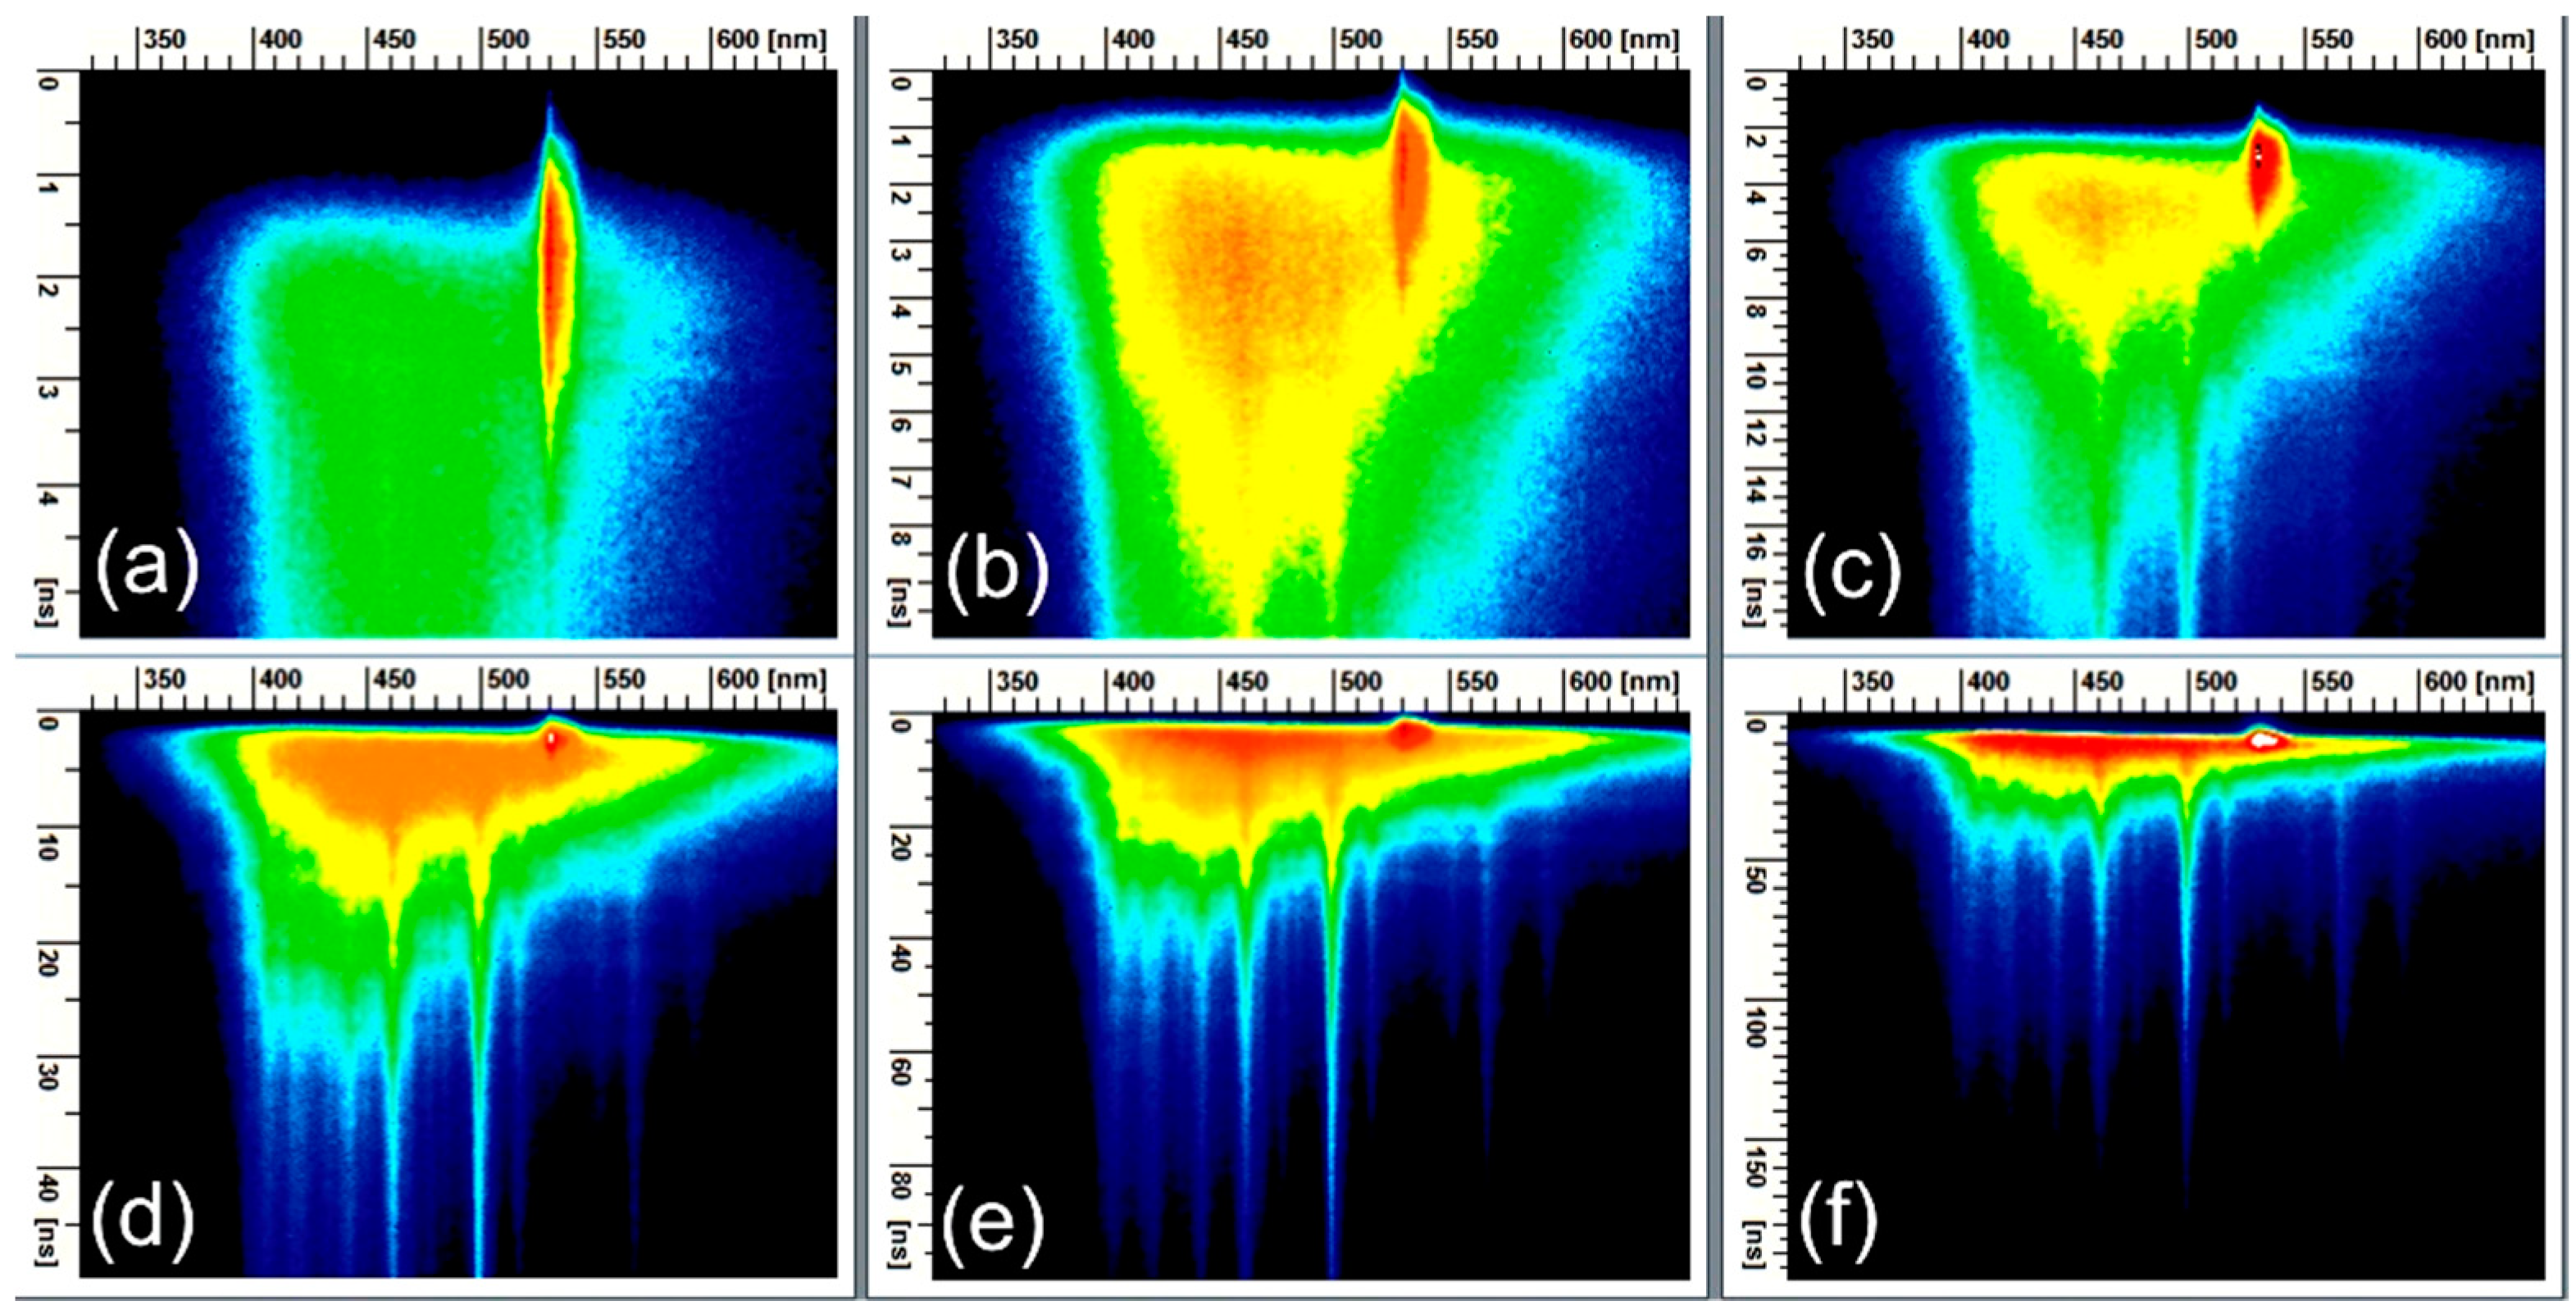
A set of time-resolved optical emission spectra of the laser-induced breakdown in air is presented in Figure 7. The second harmonic (532 nm) of the Q-switched Nd:YAG laser (nominal energy level of 70% was set on OPOTEK laser controller, measured as ~45 mJ per pulse) was used as an excitation source. The temporal distributions of the laser pulses were also visible.
The images were recorded with the acquire mode operation of the streak camera. The spectrograph grating of 50 grooves/mm was used, which enabled the plasma emission lines to be recorded in the wavelength range of 325 nm (horizontal axis). The vertical axis corresponds to the plasma development over time. The time range of the spectra in Figure 7 was from 5 to 200 ns. These results provide good insight into all stages of the plasma plume development. It is easy to see that the laser pulse was present before the creation of the plasma. The laser pulse at 5 ns and the plasma continuum can be seen in Figure 7a. In Figure 7b, the spectral lines begin to emerge and are quite discernible in Figure 7c. In Figure 7d–f, the spectral lines of the air constituents (N, O, C, etc.) are instantly recognizable.
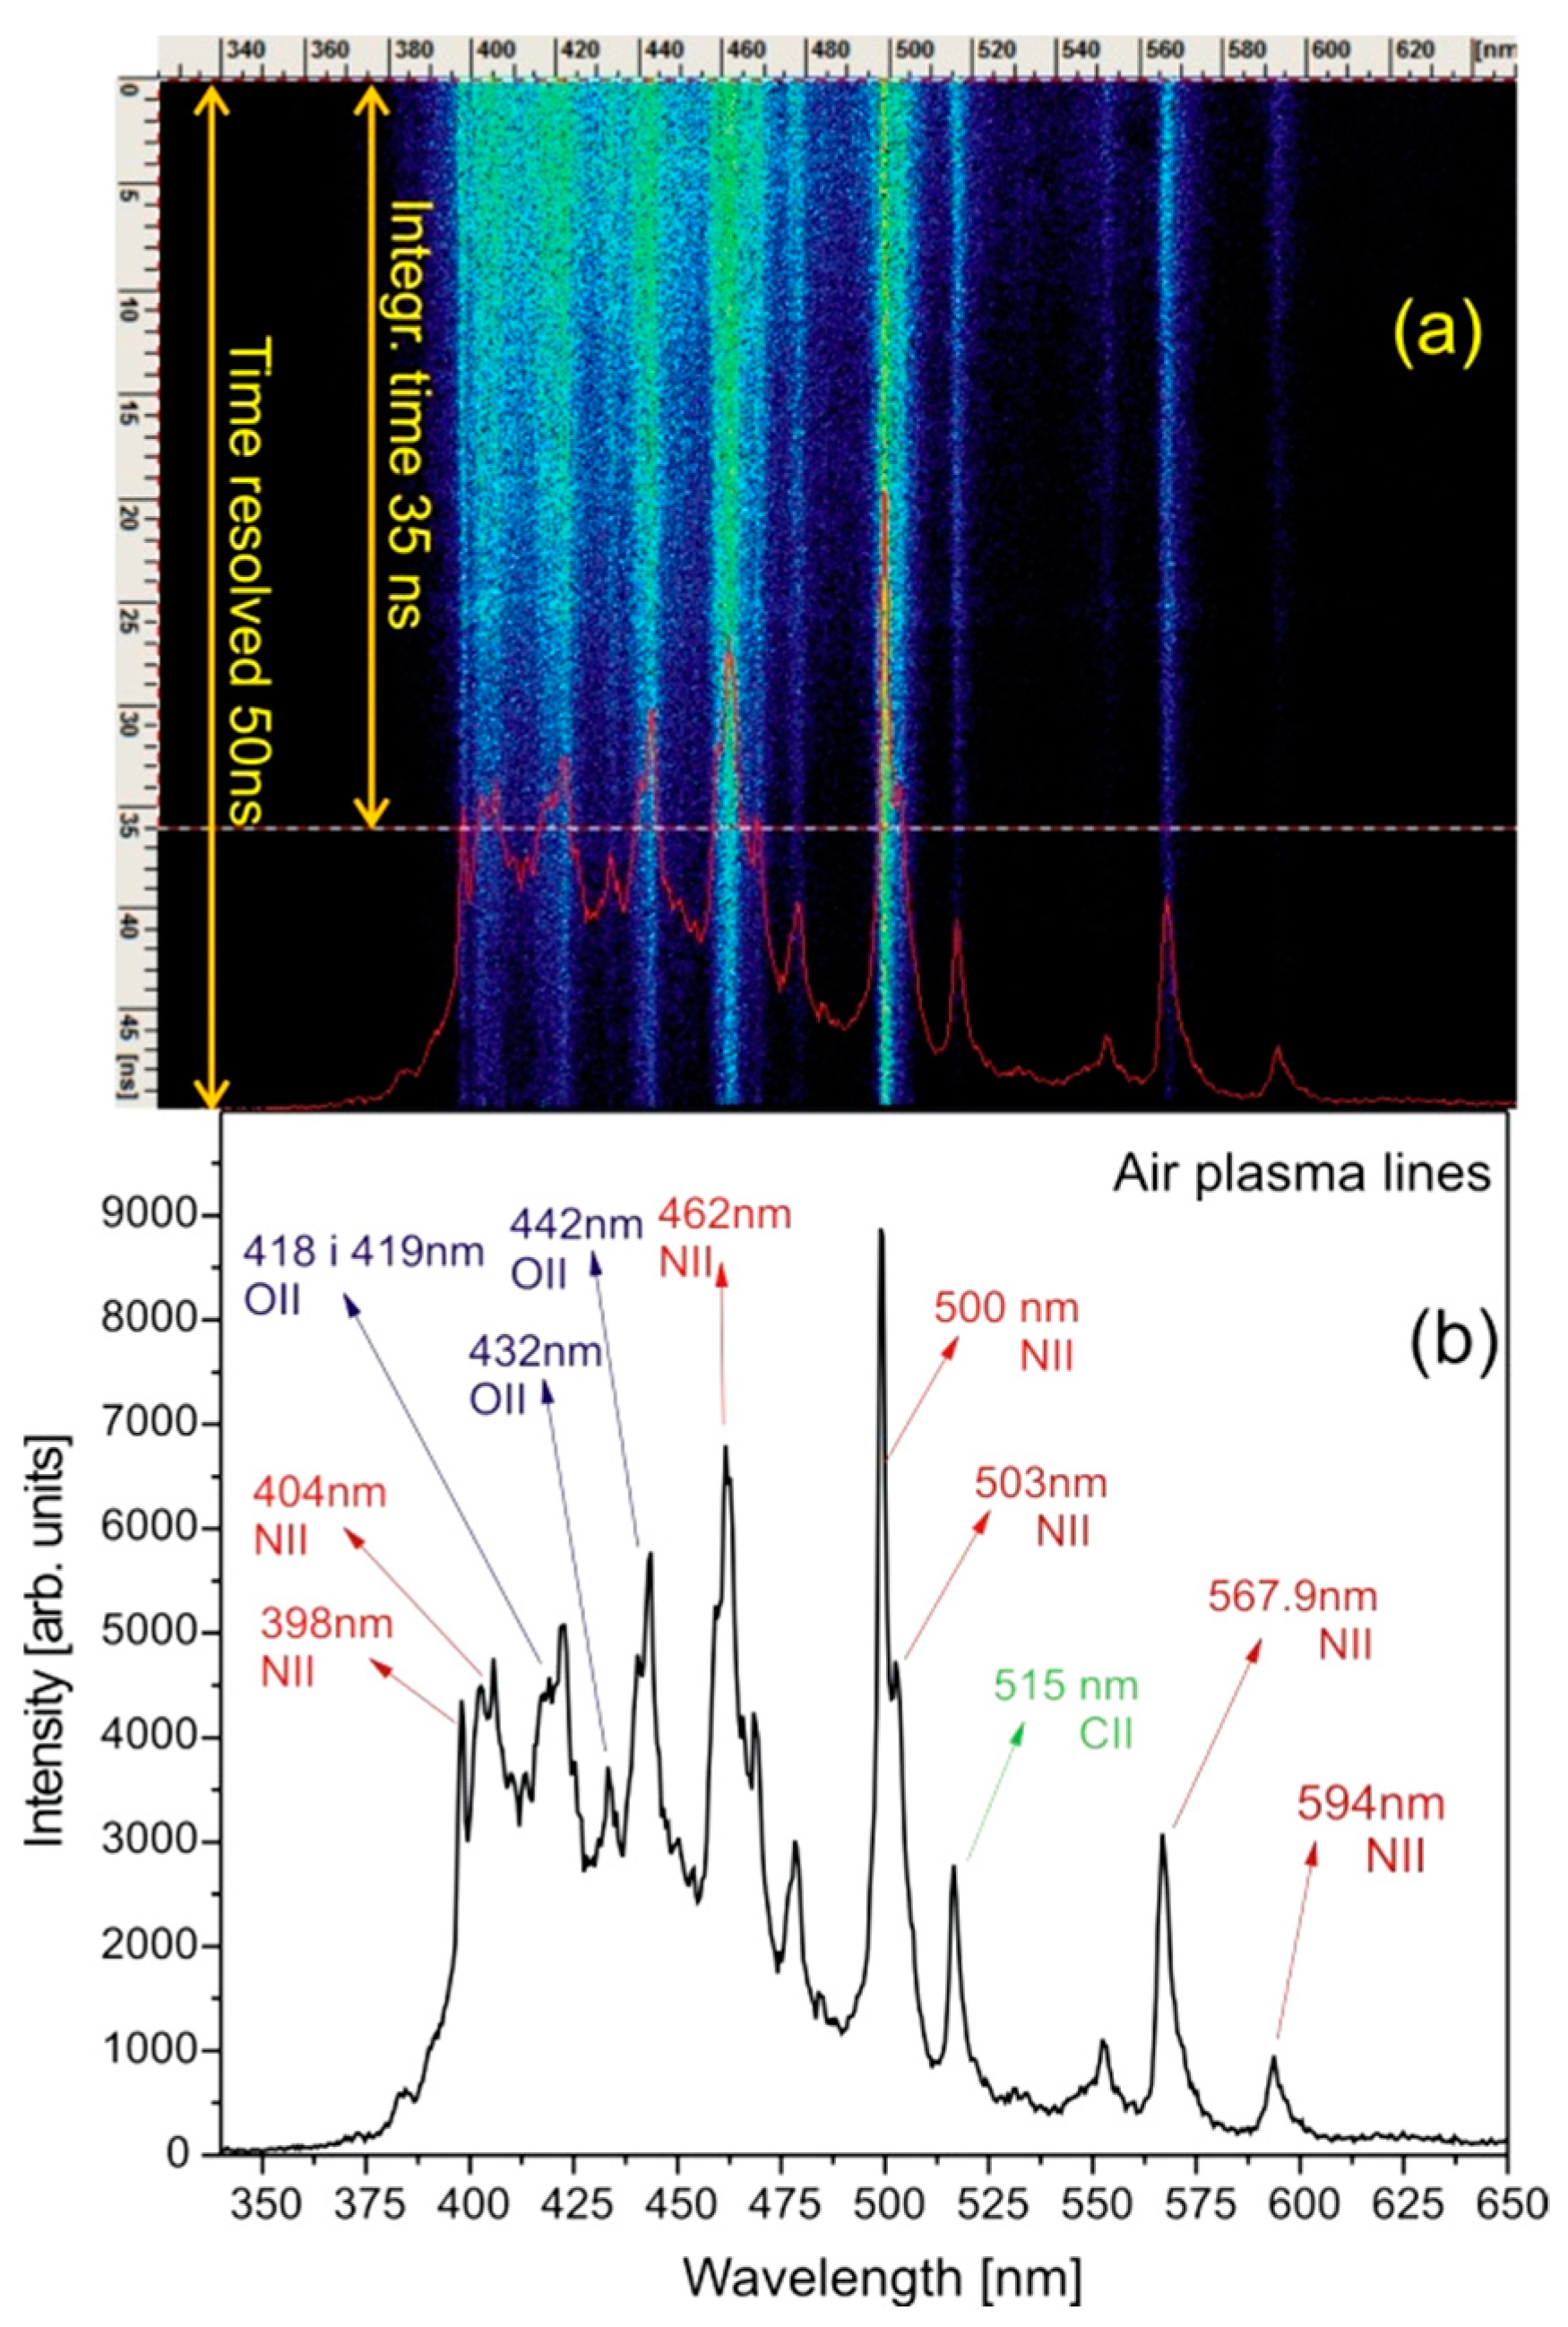
To make the optical emission spectrum more precise, we used the streak camera photon counting mode of operation with 1000 exposures. The results are presented in Figure 8a. The camera trigger time was delayed, so the streak image did not include the beginning of the plasma to avoid the domination of continuum in the early stage. The profile lines of this image are presented in Figure 8b. The emission lines from the neutral and singly charged nitrogen, oxygen, and carbon atoms are identified in Figure 8b.
3.2. Spatial Streak Images
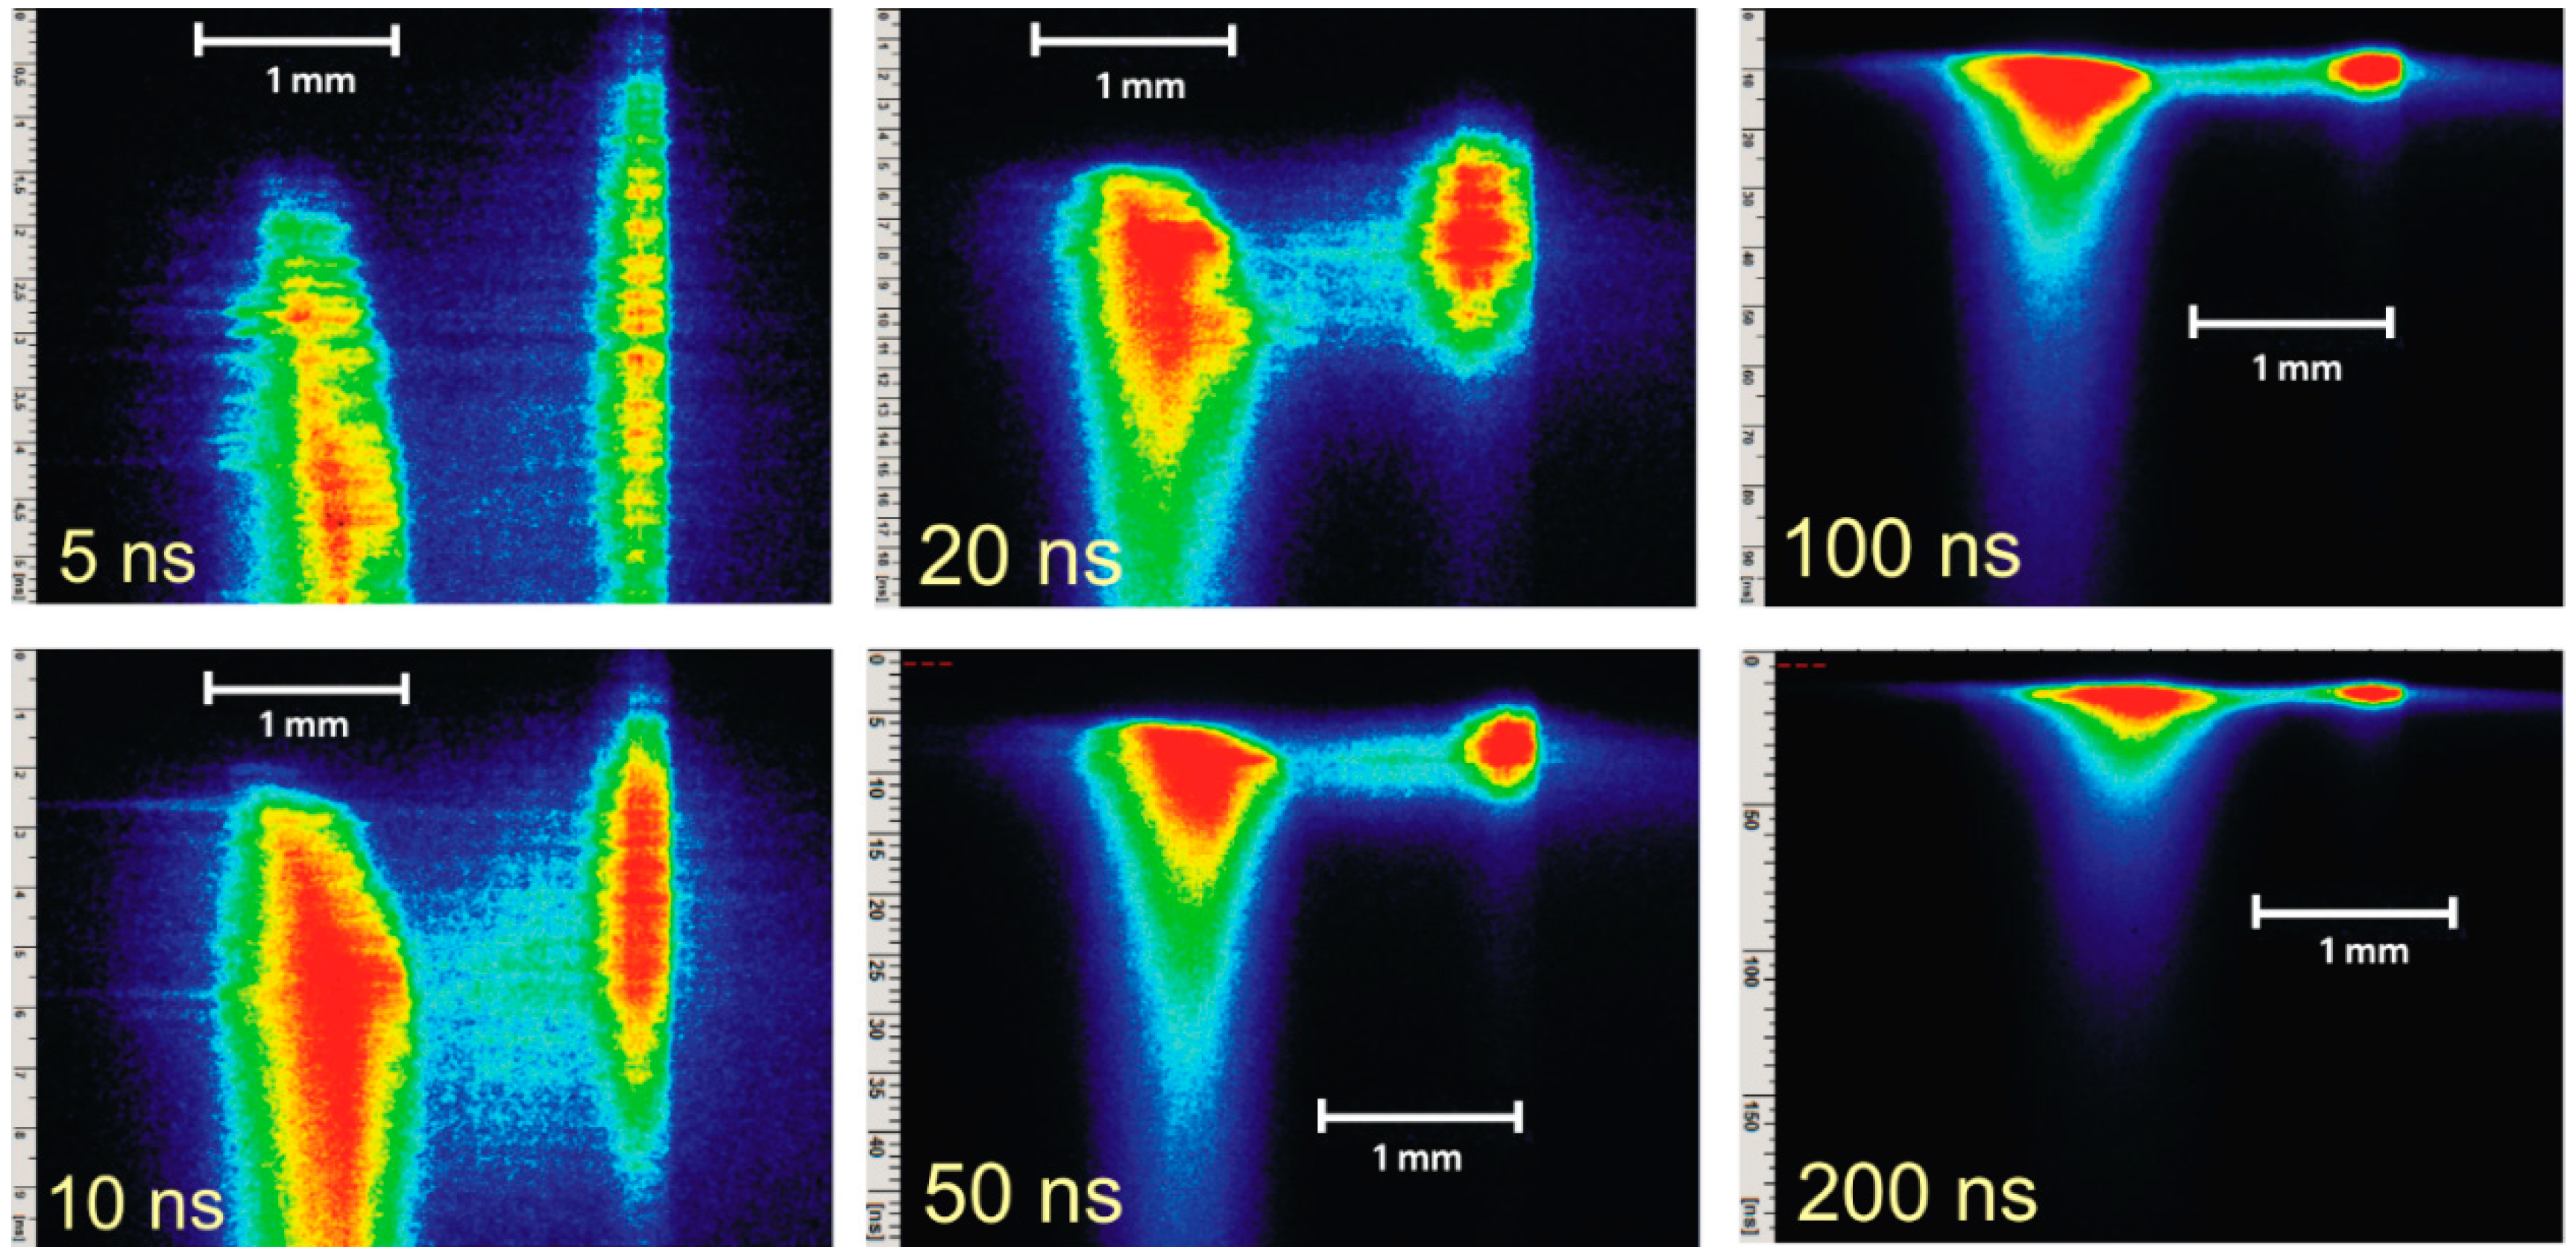
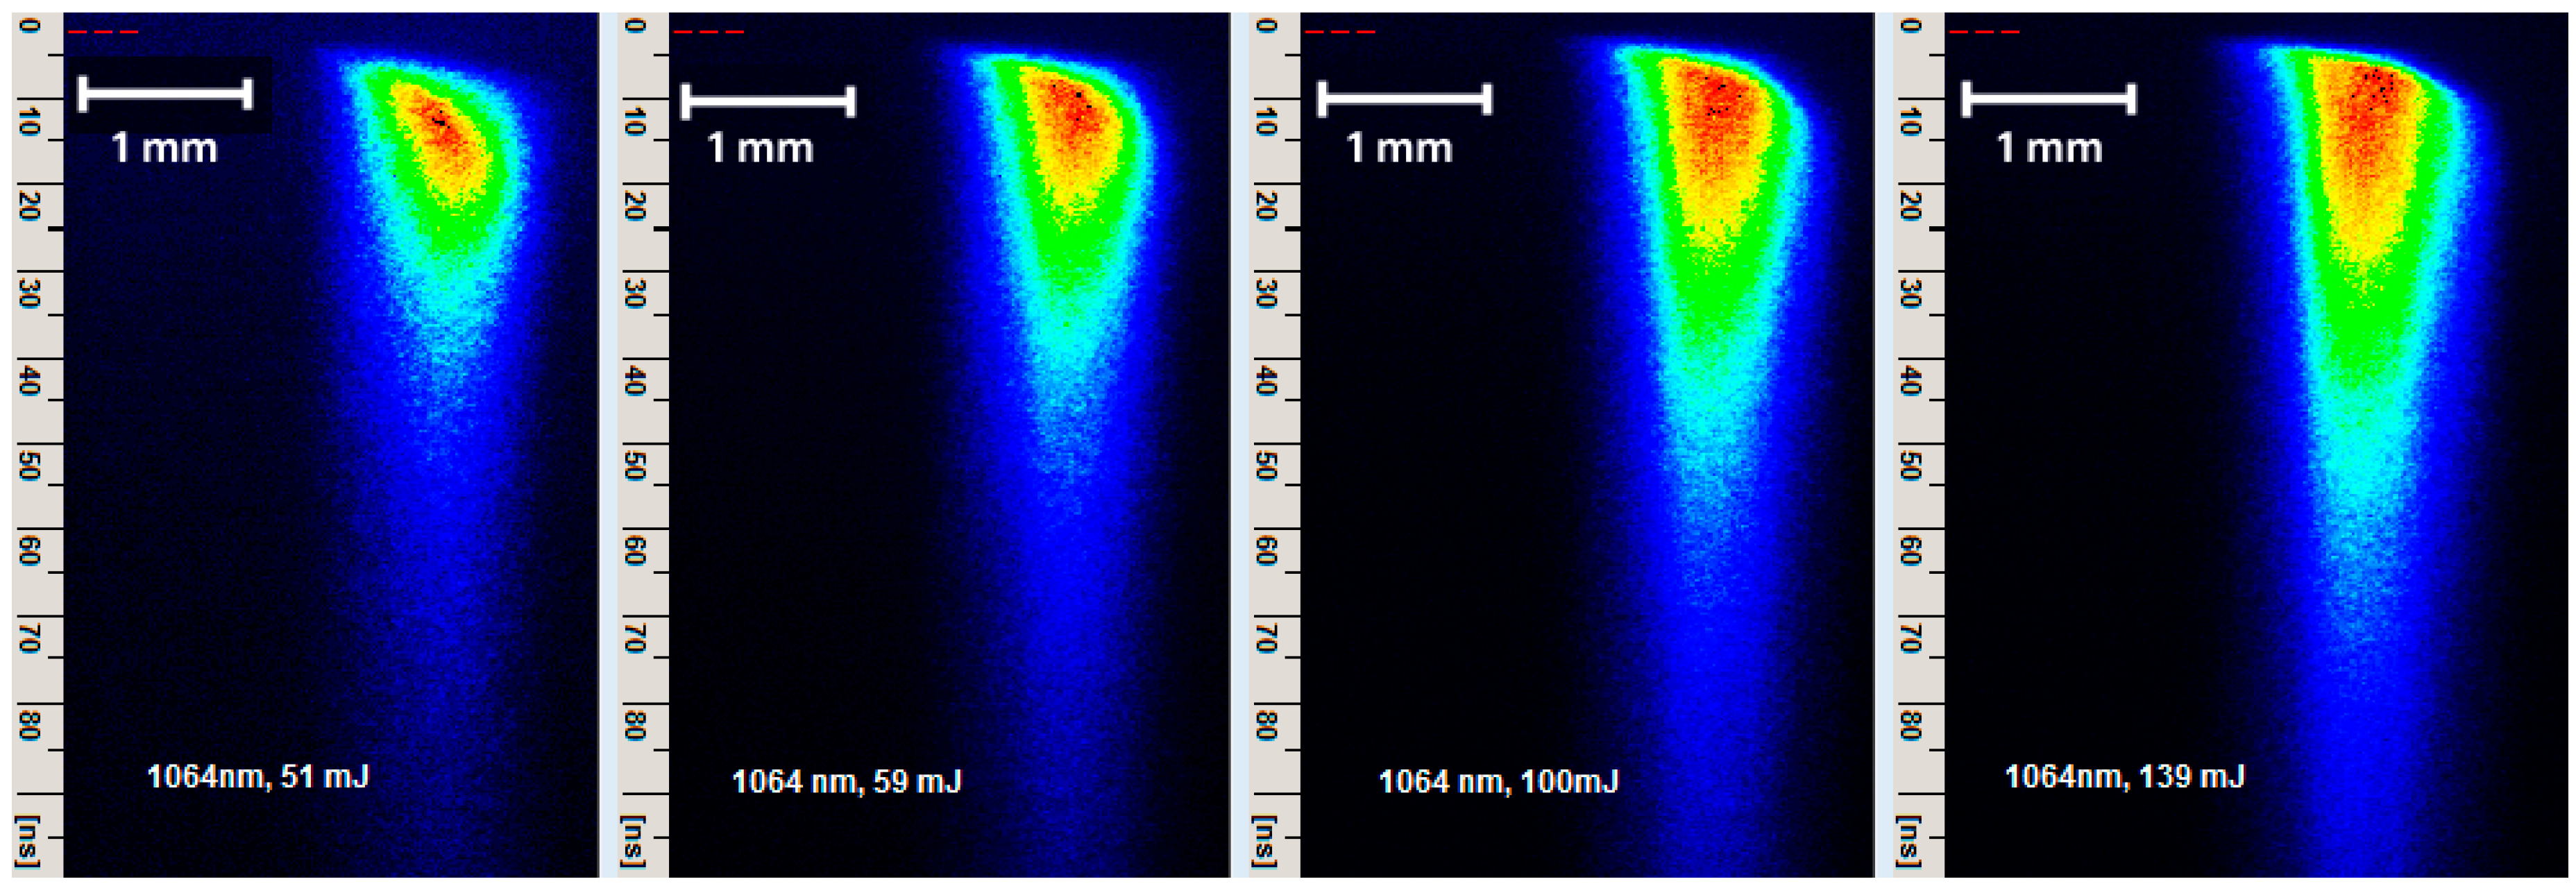
The spatial streak images of the plasma plume in air for different excitation energies are presented in Figure 9. The laser beam was incident from the right-hand side of all spatial streak images of plasma plume. As expected, the plasma plume expanded towards the laser beam, which entered from the right-hand side of the images.
As the input energy gradually increased from 51 to 139 mJ for the streak images shown in Figure 9, more plasma with a longer expansion stage was observed as well as a corresponding increase in the plasma duration.
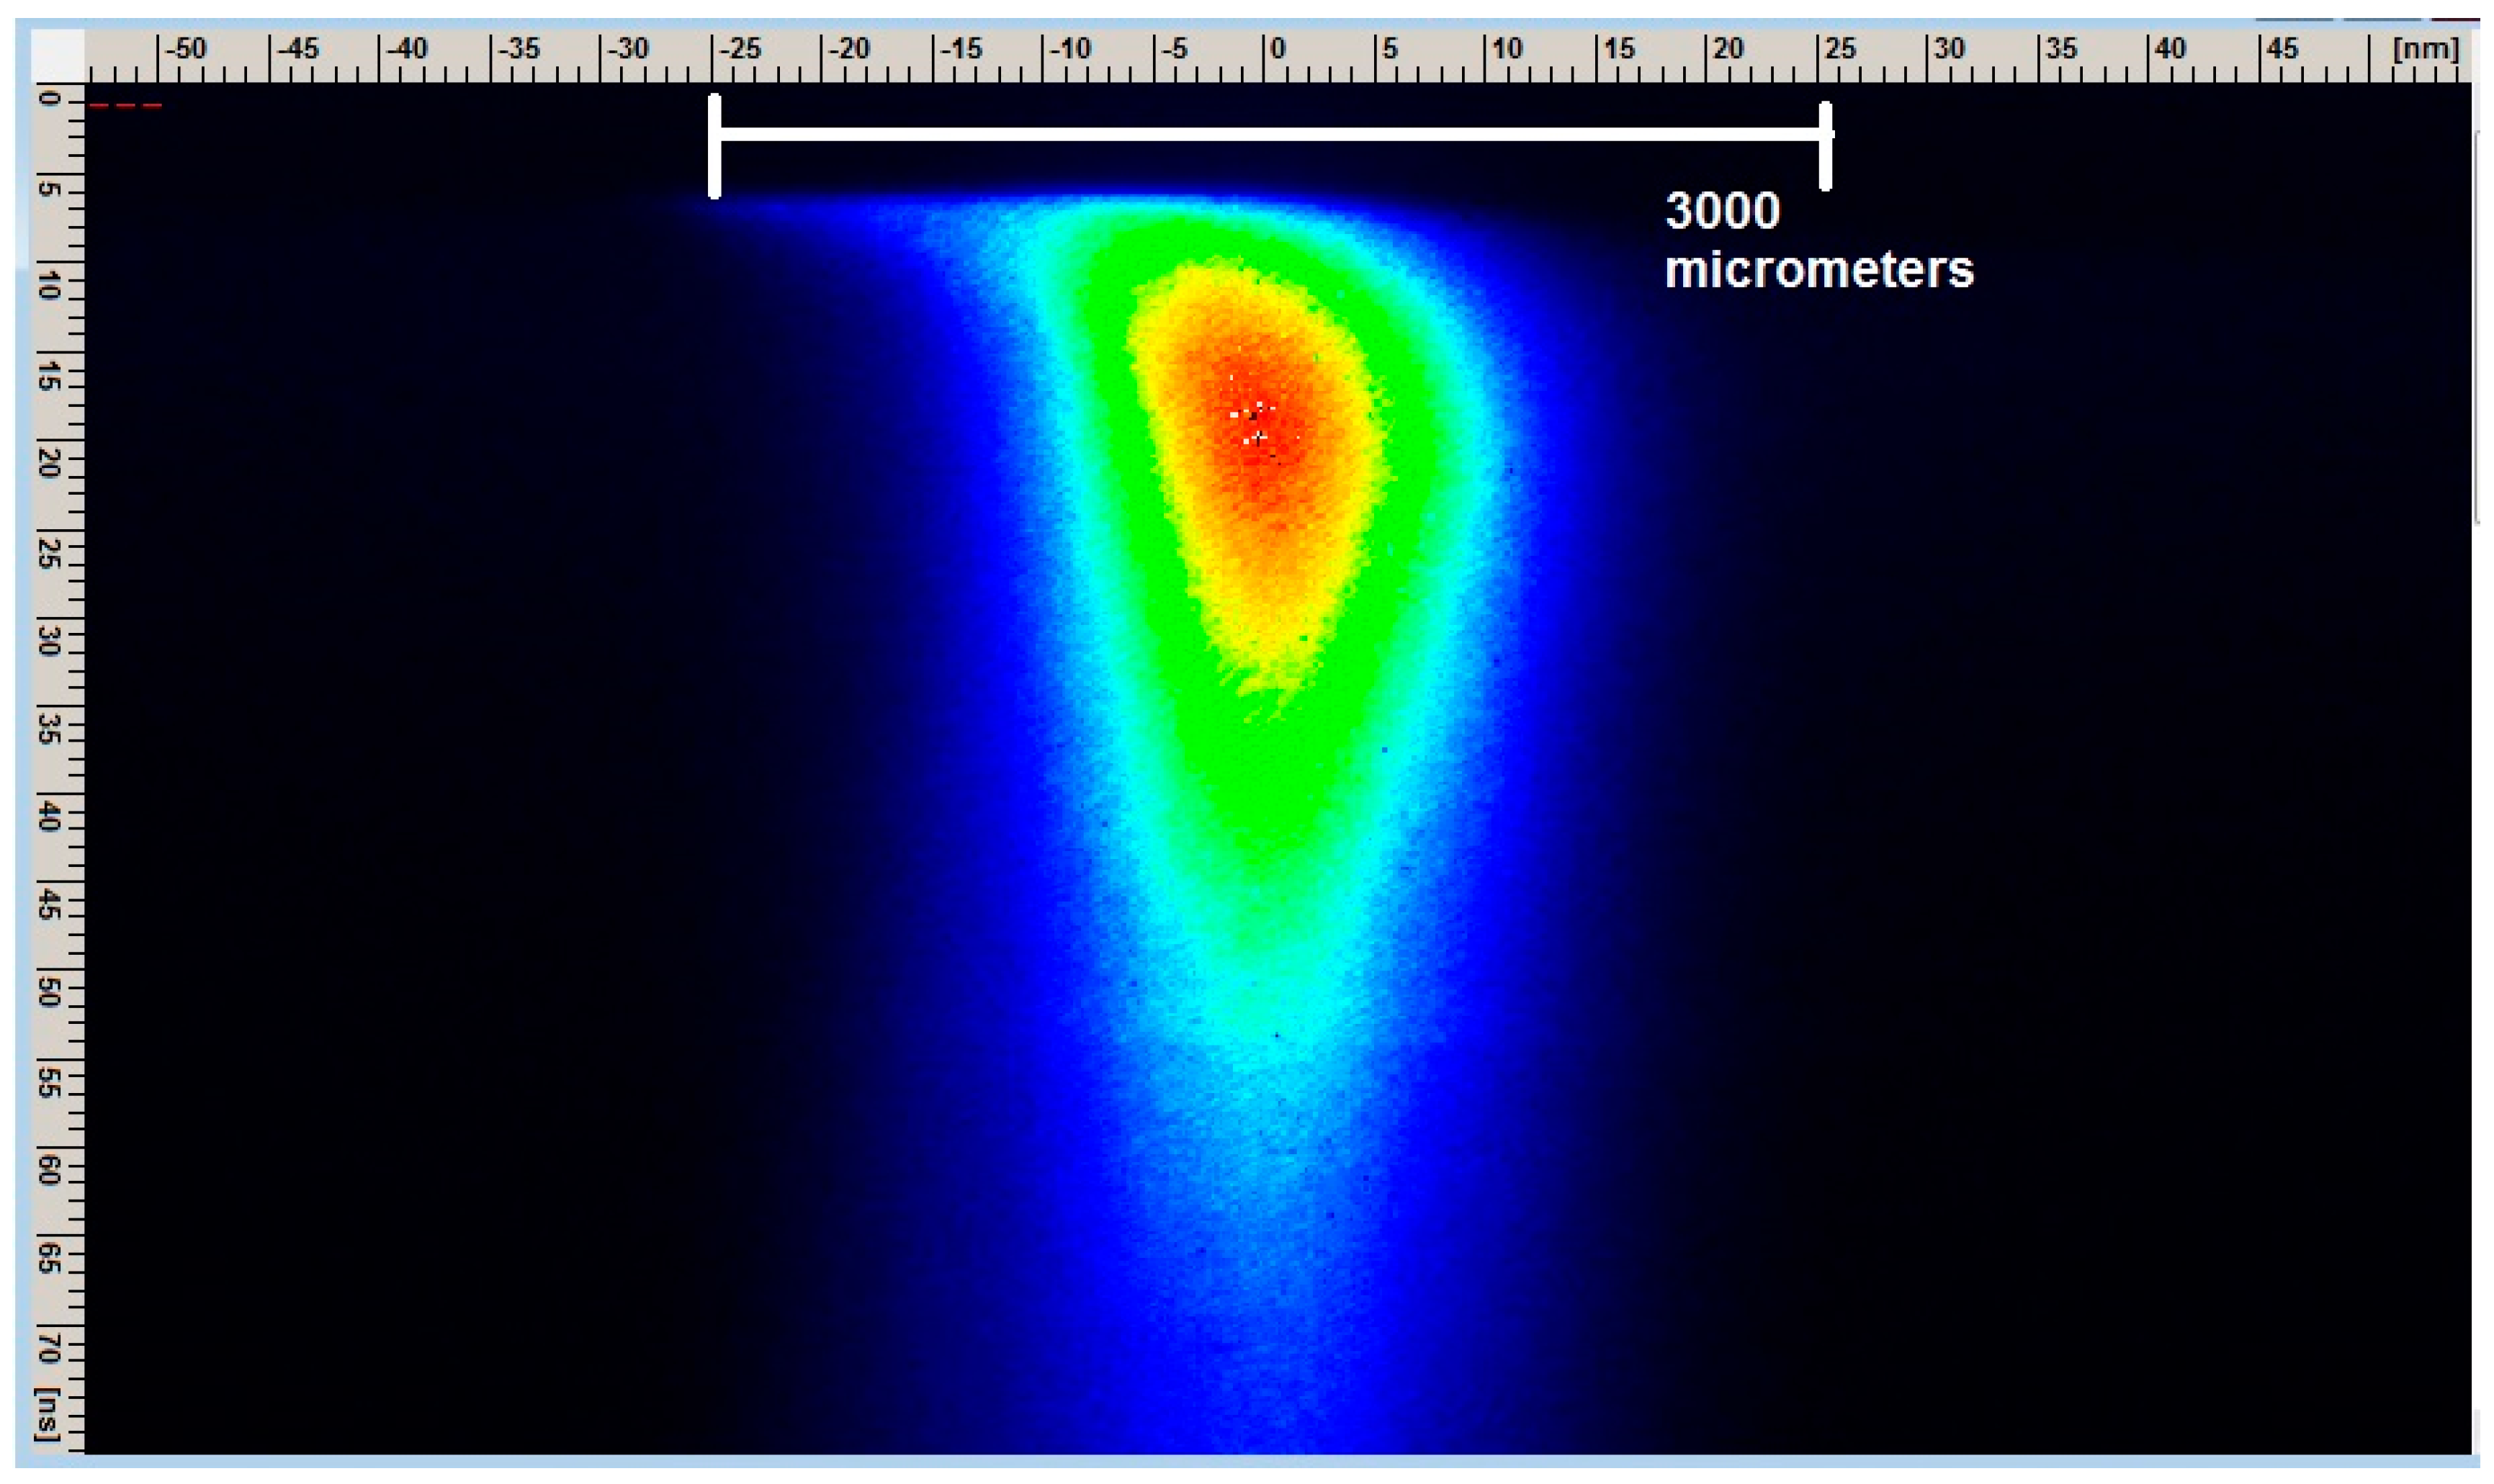
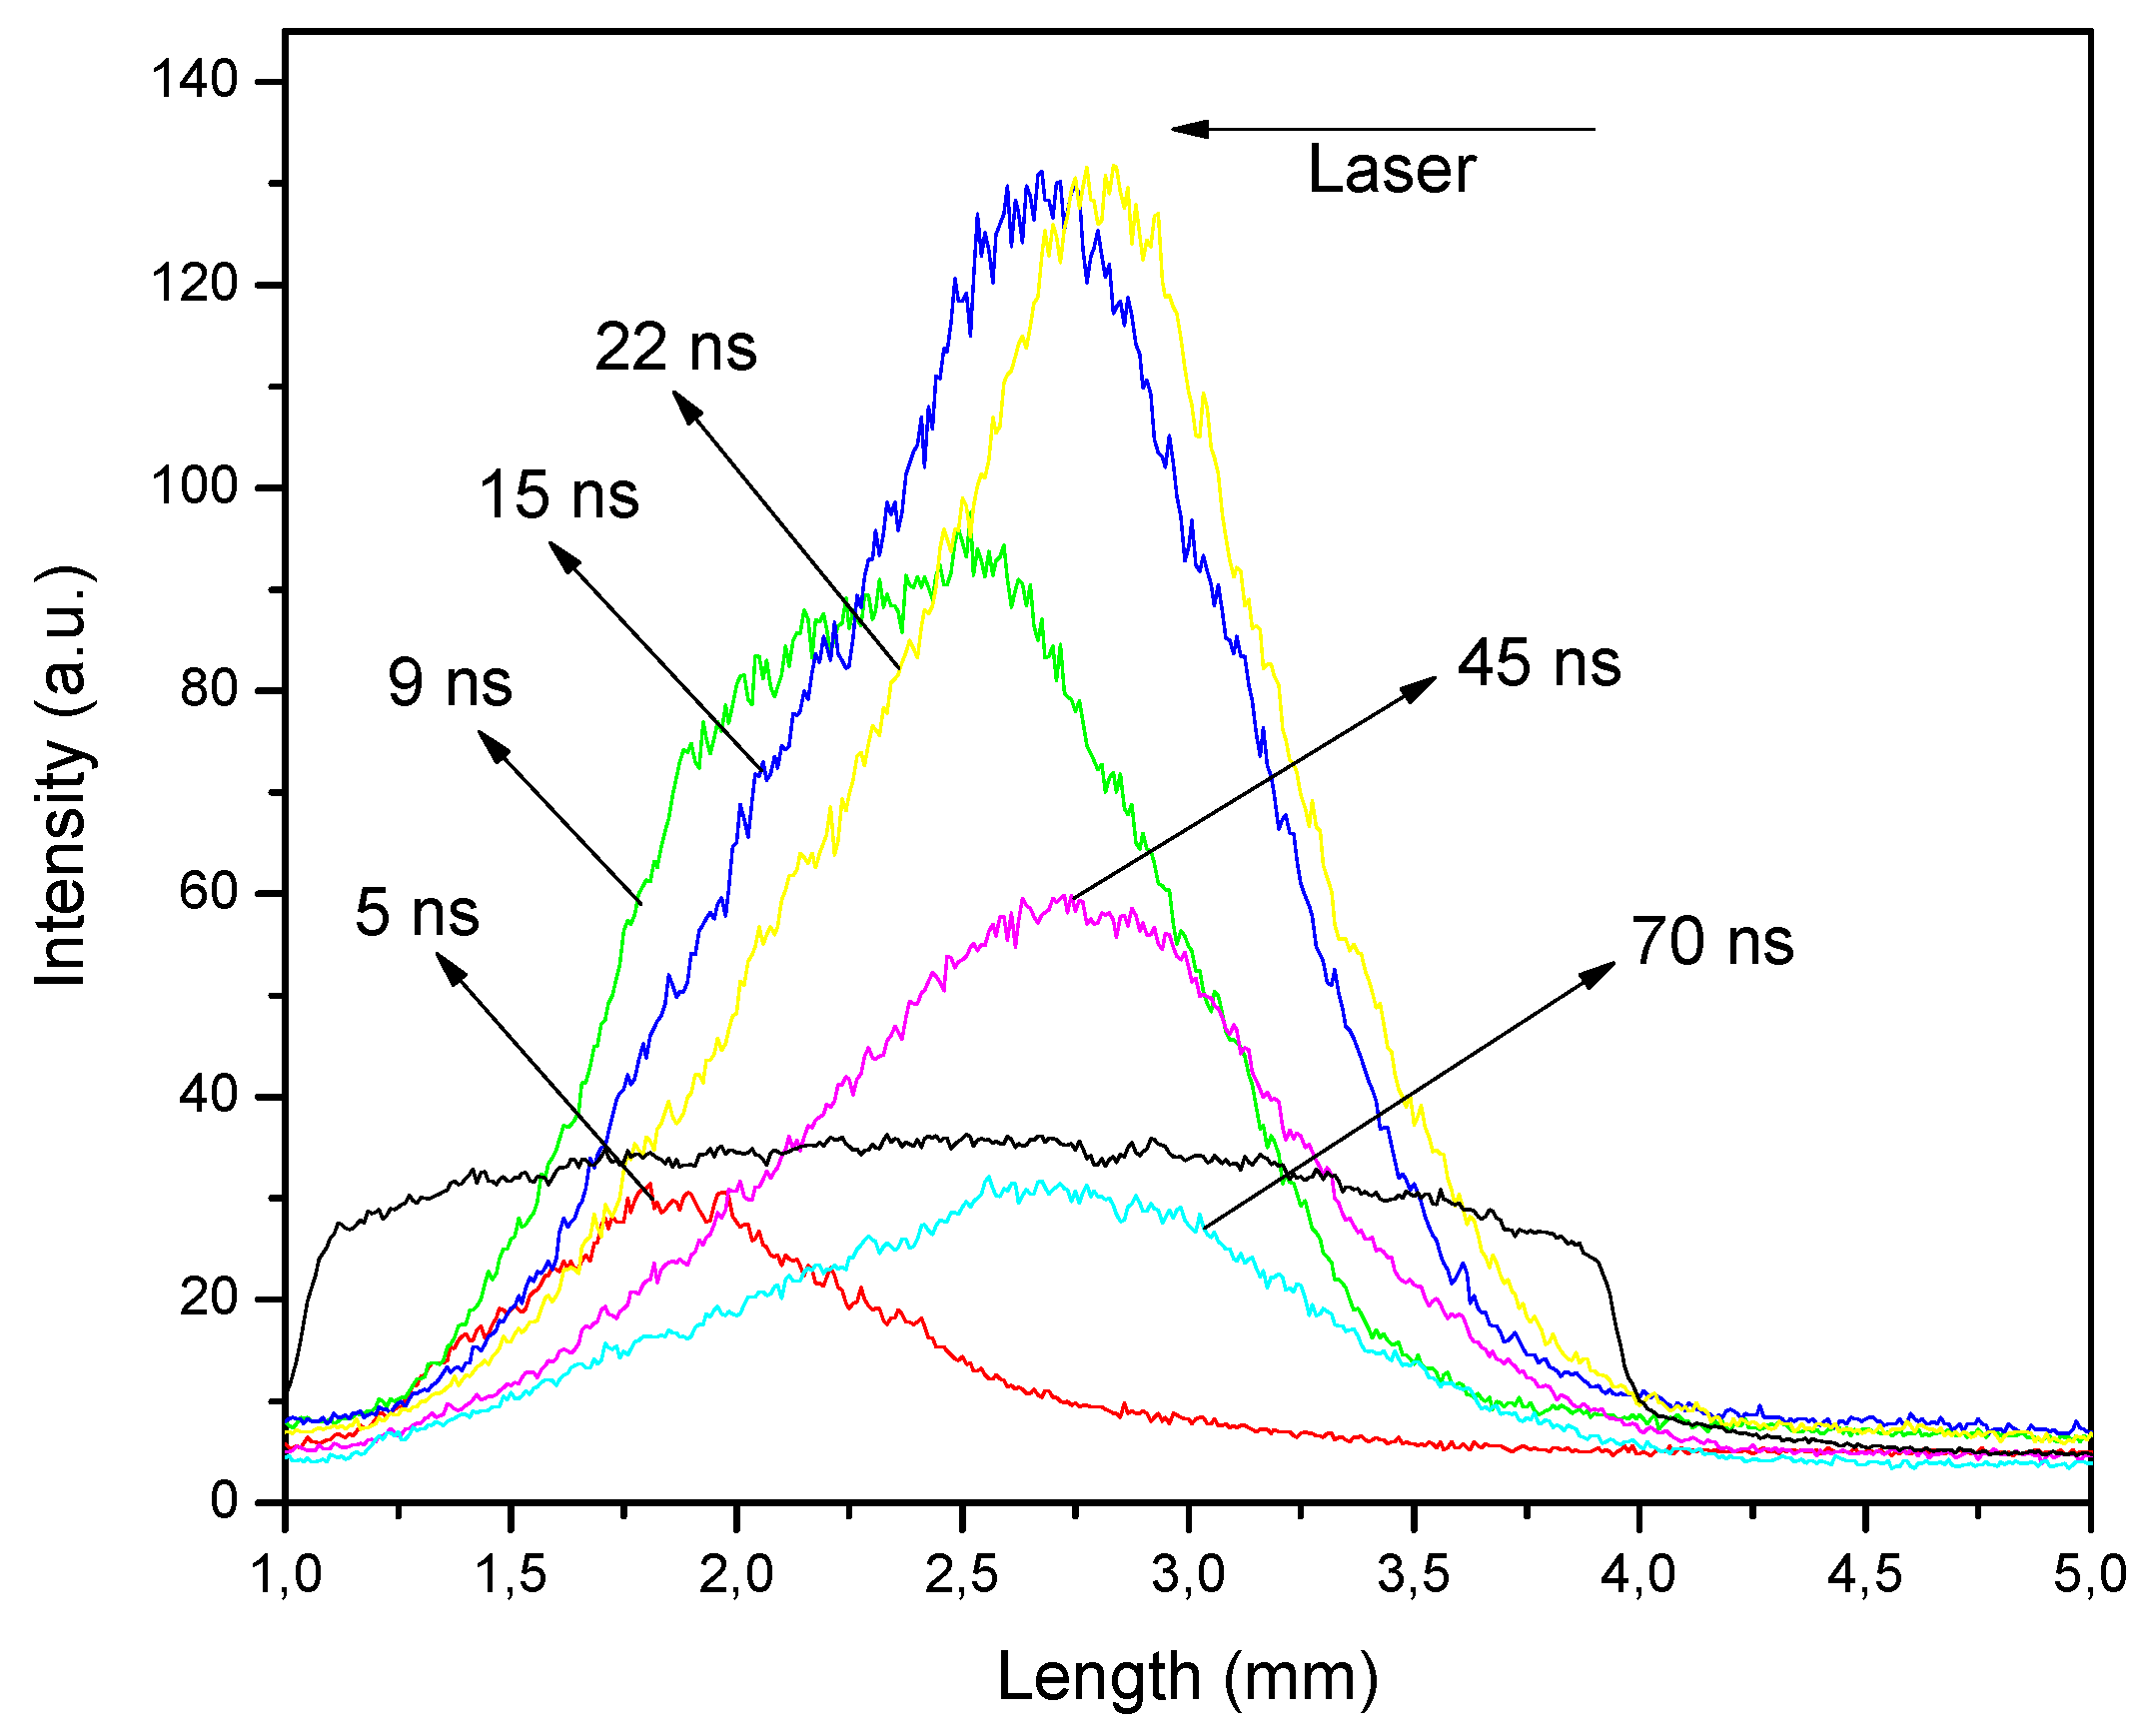
The plasma-expansion process from the laser-induced breakdown can be easily followed over time on the streak image presented in Figure 10. The Nd:YAG laser pulse energy was 140 mJ (λ = 1064 nm). The overall optical magnification of the detection system for this image was chosen to be equal to unity, so the calibration procedure showed that 1 mm on the target area corresponded to 120 pixels of CCD camera. The spatial resolution was enhanced with a smaller streak camera viewing angle as a price to pay. The image was obtained using the maximum entrance slit of 3000 μm. It can be seen from the motion of an emission peak that the laser plasma expanded towards the laser output, shifting gradually in time from the left to the right direction (Figure 11). By tracking the maximum brightness displacement shown in Figure 10, a velocity of plasma expansion of 35 km/s was obtained.
4. Conclusions
In this paper, we presented a simple modification of the Hamamatsu 4334 Streak camera and SpectraPro 2300i spectrograph system that enabled easy switching between the spectral and spatial measurement modes, so that spectral and spatial streak images could be taken under equal conditions and with the same acquisition parameters. The problem of synchronization of the streak camera with the Q-switched Nd:YAG laser was also analyzed here.
To improve the analysis of laser-induced plasma development, it is necessary to determine the exact timing of laser excitation relative to the time scale on streak images. We described several methods to determine the laser signal timing on streak images—one using the fast photodiode, and other techniques based on recording the laser pulse directly on streak image, including the excitation at 1064 nm, which is not visible by the streak camera system.
An analysis of streak images acquired using the techniques explained here could be very useful for obtaining important laser plasma parameters such as temperature and electron density, as well as the plasma-expansion velocity and plasma starting times, including their variation over time. As an illustration, the emission lines of elements constituting the air were identified on the spectral streak image. As another example, we estimated the initial air plasma-expansion velocity using the enhanced spatial resolution of the detection system.
Author Contributions
Conceptualization, M.S.R. and D.S.; investigation, M.S.R., M.D.R. and D.S.; writing—original draft, M.S.R. and D.S.; writing—review and editing, M.D.R., B.P.M. and D.S.
Funding
This research was funded by the Ministry of Education, Science and Technology Development of the Republic of Serbia, Project No. OI 171020.
Conflicts of Interest
The authors declare no conflicts of interest.
References
- Robledo-Martinez, A.; Sobral, H.; Villagrán-Muniz, M.; Bredice, F. Light focusing from large refractive indices in ionized air. Phys. Plasmas 2008, 15, 093510. [Google Scholar] [CrossRef]
- Villagran-Muniz, M.; Sobral, H.; Camps, E. Shadowgraphy and interferometry using a CW laser and a CCD of a laser-induced plasma in atmospheric air. IEEE Trans. Plasma Sci. 2001, 29, 613–616. [Google Scholar] [CrossRef]
- Gregorčič, P.; Možina, J. High-speed two-frame shadowgraphy for velocity measurements of laser-induced plasma and shock-wave evolution. Opt. Lett. 2011, 36, 2782–2784. [Google Scholar] [CrossRef] [PubMed]
- Camacho, J.J.; Díaz, L.; Santos, M.; Juan, L.J.; Poyato, J.M.L. Time-resolved optical emission spectroscopy of laser-produced air plasma. J. Appl. Phys. 2010, 107, 083306. [Google Scholar] [CrossRef] [Green Version]
- Kawahara, N.; Beduneau, J.L.; Nakayama, T.; Tomita, E.; Ikeda, Y. Spatially, temporally, and spectrally resolved measurement of laser-induced plasma in air. Appl. Phys. B 2007, 86, 605–614. [Google Scholar] [CrossRef]
- Hori, T.; Akamatsu, F. Laser-Induced Breakdown Plasma Observed using a Streak Camera. Jpn. J. Appl. Phys. 2008, 47, 4759–4761. [Google Scholar] [CrossRef]
- Sevic, D.; Rabasovic, M.S.; Marinkovic, B.P. Time-Resolved LIBS Streak Spectrum Processing. IEEE Trans. Plasma Sci. 2011, 39, 2782–2783. [Google Scholar] [CrossRef]
- Rabasovic, M.S.; Sevic, D.; Pejčev, V.; Marinkovic, B.P. Detecting indium spectral lines using electron and laser induced breakdown spectroscopy. Nucl. Instrum. Meth. B 2012, 279, 58–61. [Google Scholar] [CrossRef]
- Rabasovic, M.S.; Marinkovic, B.P.; Sevic, D. Time-Resolved Optical Spectra of the Laser-Induced Indium Plasma Detected Using a Streak Camera. IEEE Trans. Plasma Sci. 2014, 42, 2388–2389. [Google Scholar] [CrossRef]
- Siegel, J.; Epurescu, G.; Perea, A.; Gordillo-Vazquez, F.J.; Gonzalo, J.; Afonso, C.N. High spatial resolution in laser-induced breakdown spectroscopy of expanding plasmas. Spectrochim. Acta Part B 2005, 60, 915–919. [Google Scholar] [CrossRef] [Green Version]
- Mohamed, A.I.; Kadowaki, K. Streak Observation System for DC Pre-breakdown Using an Image Guide Scope. Jpn. J. Appl. Phys. 2012, 51, 028003. [Google Scholar] [CrossRef]
Figure 1.
Time-resolved laser-induced breakdown: Experimental setup.

Figure 2.
A simple modification of our spectrograph that enables easy switching between the spectral and spatial measurement modes.
Figure 2.
A simple modification of our spectrograph that enables easy switching between the spectral and spatial measurement modes.

Figure 3.
Delay time between the Q-switch trigger and the laser pulse.

Figure 4.
Delay time between laser pulses at 1064 nm and 532 nm obtained by a digital oscilloscope and fast photodiode.
Figure 4.
Delay time between laser pulses at 1064 nm and 532 nm obtained by a digital oscilloscope and fast photodiode.

Figure 5.
Streak image of the optical spectrum of laser-induced air plasma. Laser excitation at 532 nm is visible.
Figure 5.
Streak image of the optical spectrum of laser-induced air plasma. Laser excitation at 532 nm is visible.

Figure 6.
Spatial streak images of a simultaneous recording of the plasma plume and laser pulse. Plasma optical emission is visible on the left-hand side; there is laser excitation at 532 nm on the right-hand side of the image.
Figure 6.
Spatial streak images of a simultaneous recording of the plasma plume and laser pulse. Plasma optical emission is visible on the left-hand side; there is laser excitation at 532 nm on the right-hand side of the image.

Figure 7.
Temporal evolution of air plasma plume with a time range from 5 to 200 ns. (a) Time range is 5 ns, (b) time range is 10 ns, (c) time range is 20 ns, (d) time range is 50 ns, (e) time range is 100 ns, (f) time range is 200 ns.
Figure 7.
Temporal evolution of air plasma plume with a time range from 5 to 200 ns. (a) Time range is 5 ns, (b) time range is 10 ns, (c) time range is 20 ns, (d) time range is 50 ns, (e) time range is 100 ns, (f) time range is 200 ns.

Figure 8.
(a) The streak image of the emission lines obtained during laser-induced plasma in air. (b) One-dimensional profile of streak image (a) integrated into the time range of 35 ns.
Figure 8.
(a) The streak image of the emission lines obtained during laser-induced plasma in air. (b) One-dimensional profile of streak image (a) integrated into the time range of 35 ns.

Figure 9.
Time evolution of the air plasma obtained at different energy levels of the laser pulse at 1064 nm.
Figure 9.
Time evolution of the air plasma obtained at different energy levels of the laser pulse at 1064 nm.

Figure 10.
A streak image optimized for plasma-expansion velocity measurements.

Figure 11.
Spatial distributions of the laser-induced plasma for several time points.


Table 1.
Timing parameters of the detection system for different time scales (5, 10, 20, 50, 100, and 200 ns) of the streak camera. “Q-sw” denotes the Q-switch trigger out-signal. “Pulse from top” means the “pulse position from top of the streak camera screen”. SH denotes the second harmonic of the laser (532 nm).
| Time Scale 5 ns Dead Time 189.7 ns | Time Scale 10 ns Dead Time 175.2 ns | Time Scale 20 ns Dead Time 197.0 ns | |||||||
|---|---|---|---|---|---|---|---|---|---|
| Laser Energy SH [mJ] | Delay Q-sw Laser [ns] | Delay DG535 Set [ns] | Pulse from Top [ns] | Delay Q-sw Laser [ns] | Delay DG535 Set [ns] | Pulse from Top [ns] | Delay Q-sw Laser [ns] | Delay DG535 Set [ns] | Pulse from Top [ns] |
| 18 | 581.6 | 390 | 1.80 | 582.4 | 405 | 1.89 | 583.0 | 383 | 3.5 |
| 33 | 576.4 | 384 | 2.12 | 576.4 | 399 | 2.50 | 576.5 | 376 | 3.8 |
| 45 | 571.2 | 380 | 1.73 | 571.5 | 394 | 2.23 | 571.4 | 371 | 3.0 |
| 54 | 567.8 | 377 | 1.68 | 568.1 | 391 | 2.00 | 568.1 | 368 | 3.0 |
| 62 | 565.6 | 374 | 1.60 | 565.5 | 388 | 2.52 | 565.4 | 366 | 2.7 |
| 68 | 564.5 | 373 | 1.80 | 564.6 | 386 | 3.30 | 564.5 | 365 | 2.0 |
| Time Scale 50 ns Dead Time 255.1 ns | Time Scale 100 ns Dead Time 337.4 ns | Time Scale 200 ns Dead Time 537.6 ns | |||||||
| Laser Energy SH [mJ] | Delay Q-sw Laser [ns] | Delay DG535 Set [ns] | Pulse from Top [ns] | Delay Q-sw Laser [ns] | Delay DG535 Set [ns] | Pulse from Top [ns] | Delay Q-sw Laser [ns] | Delay DG535 Set [ns] | Pulse from Top [ns] |
| 18 | 582.4 | 319 | 7.96 | 582.4 | 238 | 6.00 | 582.6 | 37 | 7.47 |
| 33 | 576.5 | 318 | 3.24 | 576.4 | 232 | 7.06 | 576.4 | 33 | 6.29 |
| 45 | 571.5 | 313 | 3.45 | 571.4 | 229 | 5.40 | 571.7 | 28 | 5.89 |
| 54 | 568.0 | 307 | 5.68 | 568.1 | 223 | 7.68 | 568.0 | 22 | 7.87 |
| 62 | 565.6 | 307 | 3.85 | 565.5 | 226 | 2.28 | 566.0 | 19 | 9.45 |
| 68 | 564.4 | 305 | 4.66 | 564.7 | 219 | 8.5 | 564.3 | 20 | 7.47 |
© 2019 by the authors. Licensee MDPI, Basel, Switzerland. This article is an open access article distributed under the terms and conditions of the Creative Commons Attribution (CC BY) license (http://creativecommons.org/licenses/by/4.0/).
Share and Cite
MDPI and ACS Style
Rabasovic, M.S.; Rabasovic, M.D.; Marinkovic, B.P.; Sevic, D. Laser-Induced Plasma Measurements Using Nd:YAG Laser and Streak Camera: Timing Considerations. Atoms 2019, 7, 6. https://doi.org/10.3390/atoms7010006
AMA Style
Rabasovic MS, Rabasovic MD, Marinkovic BP, Sevic D. Laser-Induced Plasma Measurements Using Nd:YAG Laser and Streak Camera: Timing Considerations. Atoms. 2019; 7(1):6. https://doi.org/10.3390/atoms7010006
Chicago/Turabian StyleRabasovic, Maja S., Mihailo D. Rabasovic, Bratislav P. Marinkovic, and Dragutin Sevic. 2019. "Laser-Induced Plasma Measurements Using Nd:YAG Laser and Streak Camera: Timing Considerations" Atoms 7, no. 1: 6. https://doi.org/10.3390/atoms7010006
Note that from the first issue of 2016, this journal uses article numbers instead of page numbers. See further details here.