Measurement of Stark Halfwidths of Spectral Lines of Ionized Oxygen and Silicon Emitted from T-tube Plasma

Department of Physics, Faculty of Sciences, University of Novi Sad, Trg Dositeja Obradovića 4, 21000 Novi Sad, Serbia
Atoms 2019, 7(1), 8; https://doi.org/10.3390/atoms7010008
Submission received: 30 November 2018
/
Revised: 21 December 2018
/
Accepted: 7 January 2019
/
Published: 9 January 2019
(This article belongs to the Special Issue SPIG2018)
Abstract
:The analysis of experimental Stark halfwidths of spectral lines of singly ionized oxygen and silicon and double ionized silicon is presented in this work. The considered spectral lines were emitted from plasma generated in an electromagnetically driven T-tube, with an electron temperature of 15,000 K and electron density of 1.45 × 10²³ m−3. The obtained Stark halfwidths were compared to experimental values given by other authors. In addition, all experimental values were compared to theoretical values. These data are useful for diagnostics of laboratory and astrophysical plasmas as well as verifying theoretical models.
1. Introduction
Spectral lines of ionized oxygen and silicon are often present in spectra emitted from laboratory [1,2,3,4,5,6,7,8,9,10,11,12,13,14,15,16,17,18,19,20,21,22,23,24,25,26] and astrophysical plasmas [27,28,29,30,31,32,33]. Stark parameters of these spectral lines can be used for plasma diagnostics, as it can be seen in the references given above. New and reliable experimental data can also be used for testing existing and new theoretical calculations.
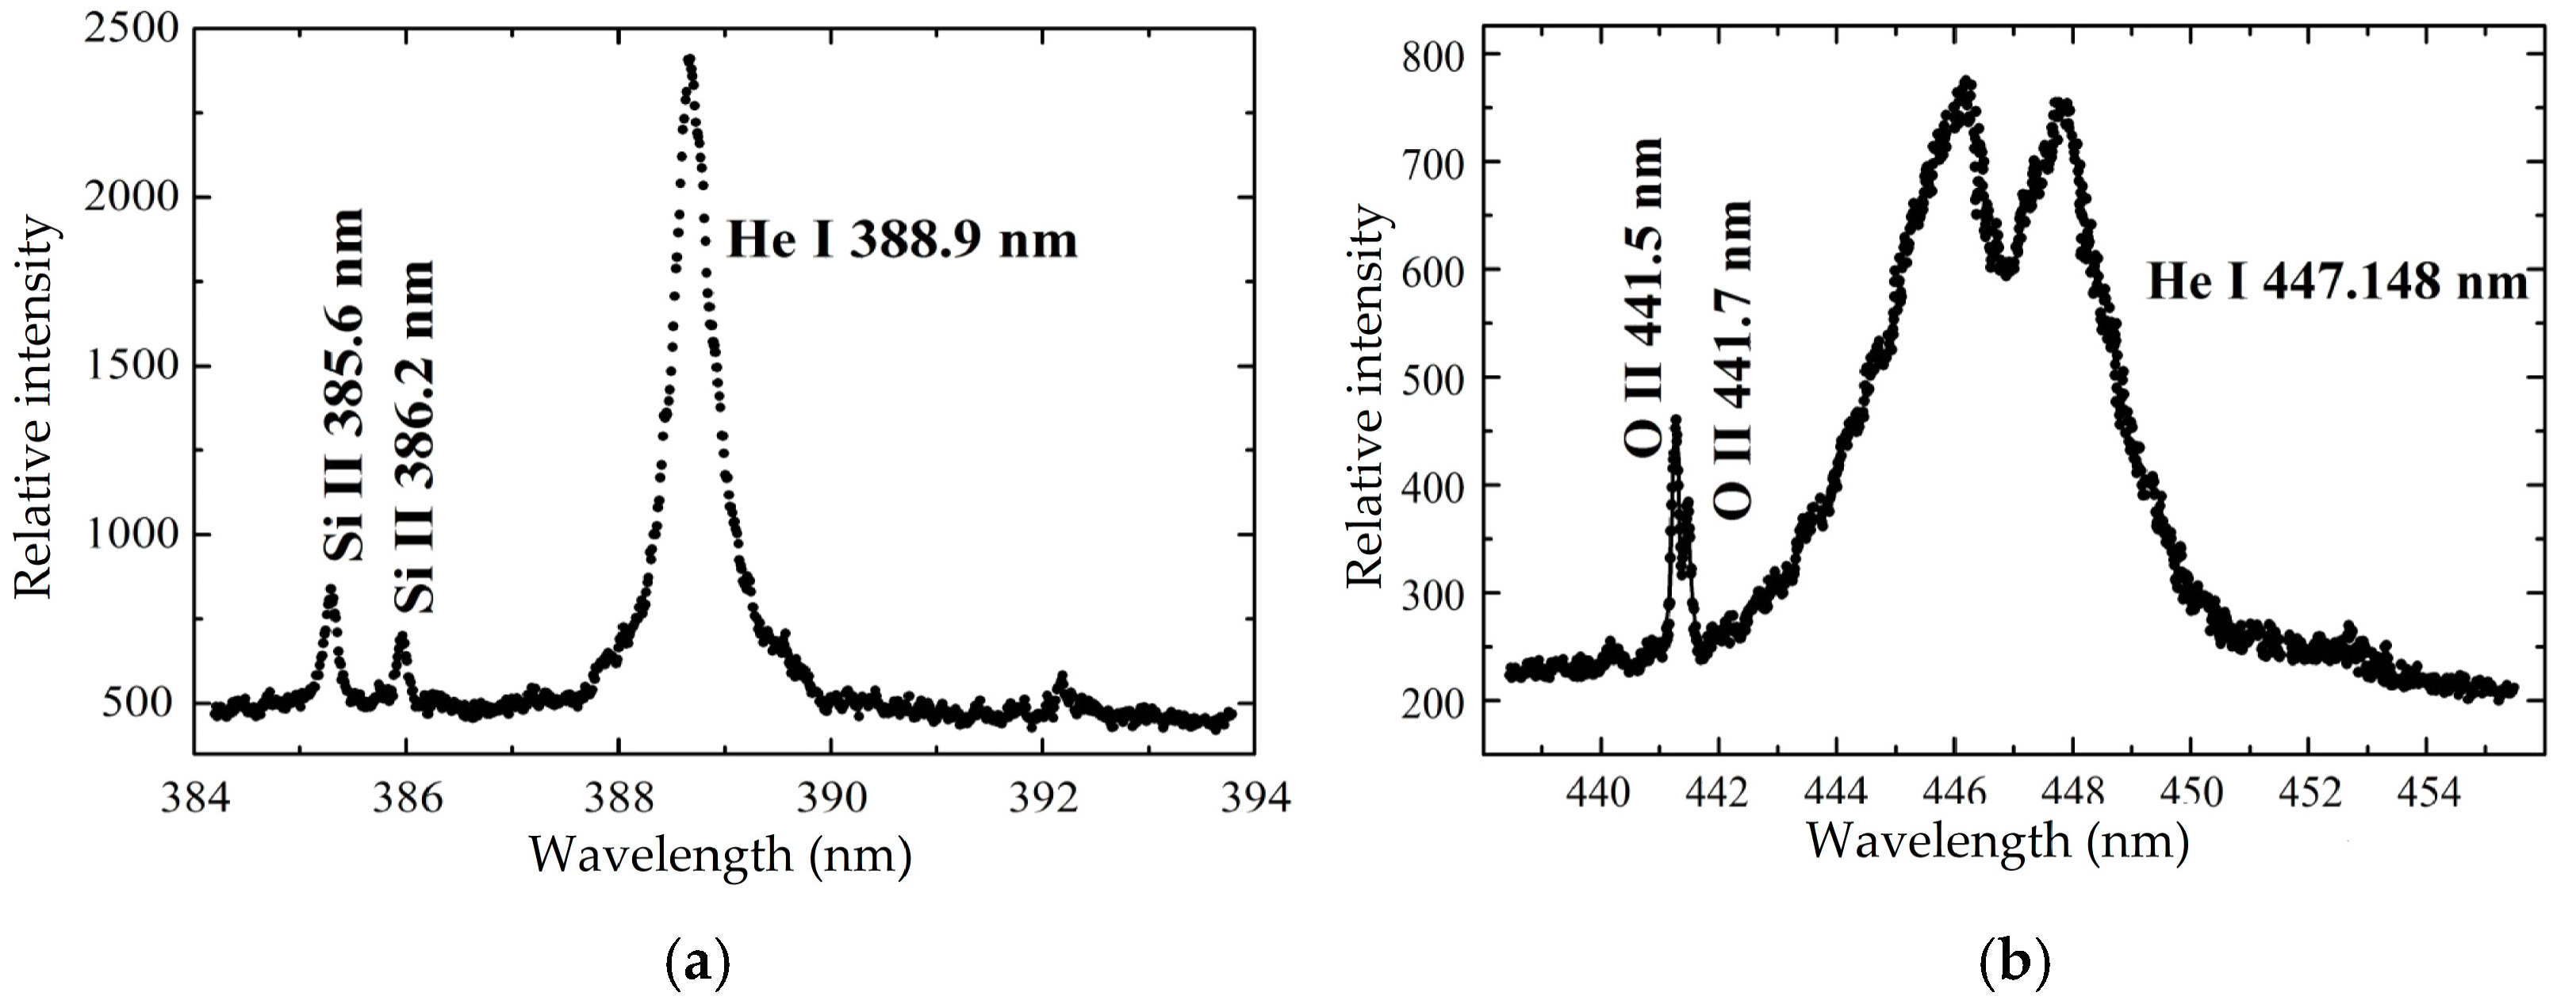
The presence of O II, Si II and Si III spectral lines in our experiments was first observed in the spectra emitted from the T-tube while using pure helium as the working gas [34,35]. Oxygen and silicon occur in our plasma as impurities originating from the glass walls of the discharge vessel. Two examples of these spectra are given in Figure 1.
Since the plasma is produced in a T-tube, which operates on the principle of shockwave propagation in a glass tube, oxygen and silicon appear in the plasma due to an ablation of the glass walls of the tube [35].
2. Details of the Experiment
2.1. Plasma Source
The plasma was produced in an electromagnetically driven T-tube [35,36]. The T-tube consists of a glass vessel with an internal radius of 27 mm with electrodes placed in the vertical part of the tube. A reflector made of quartz glass is positioned in the horizontal part of the tube, 14 mm from the electrode axis. The cross section of the T-tube is given in Figure 2.
The plasma is produced by electrical discharge between the electrodes. The discharge current runs between the electrodes and through the return wire. Due to the opposing current flow directions, a repelling force exists between those two current flows.
Since a large amount of energy is released in a short amount of time, a shockwave is formed when the discharge occurs. This shockwave is then driven towards the reflector and produces plasma in the horizontal part of the T-tube. The front of the shockwave is flat, which results in a radially homogenous plasma [37]. Once the shockwave reaches the reflector it reflects and propagates in the opposite direction, further heating, exciting and ionizing the gas. More details on shockwave propagation in the used T-tube can be found in [36].
Most of the glass wall ablation occurs in the corners where the horizontal and vertical parts of the tube are joined [35], due to the impact of the incident shock wave front. The ablated silicon and oxygen atoms and ions are carried by the moving plasma toward the reflector.
The accompanying gas system is schematically presented in Figure 3. The T-tube has openings on the electrodes and behind the reflector for gas input, output and pressure measurement. The tube is first evacuated to a base pressure of 0.5 Pa. The working gas, in this case pure helium, is then released into the system and it flows through the T-tube at an operating pressure of 300 Pa. The pressure in the tube is monitored by a U-tube manometer.
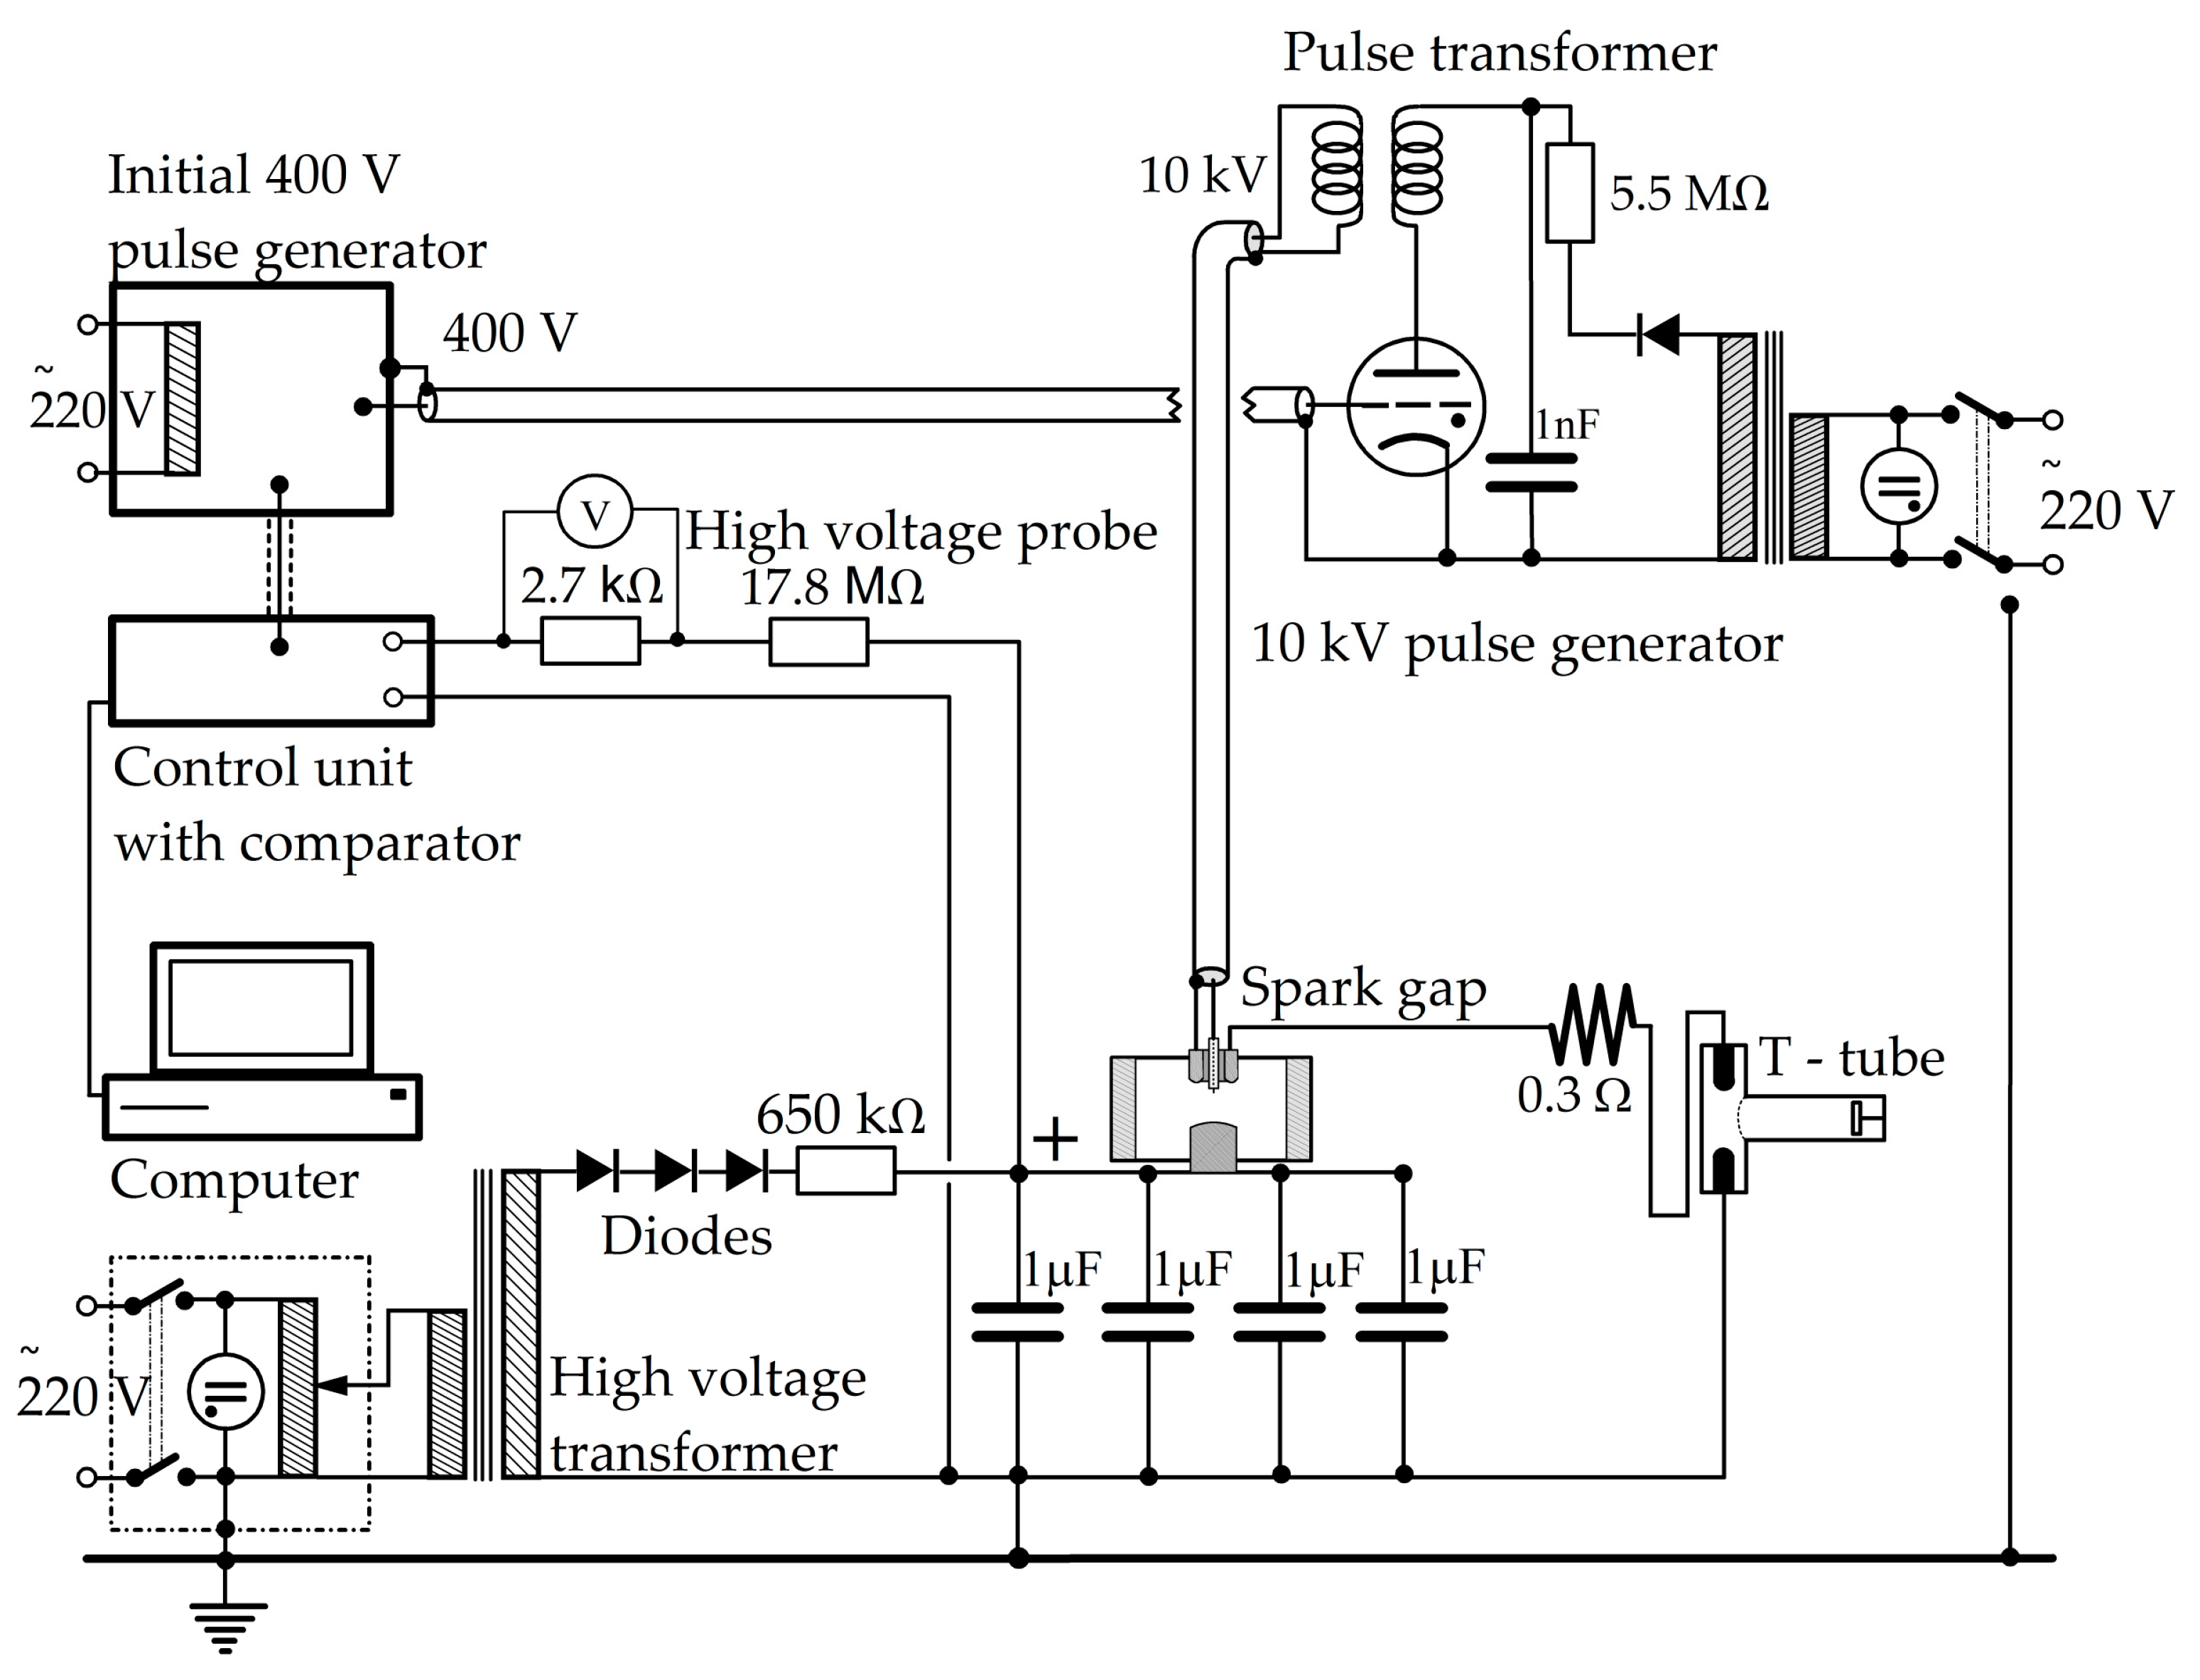
A schematic representation of the electrical system is given in Figure 4. Four capacitors, 1 µF each, are charged up to a voltage of 20 kV. The voltage on the capacitors is measured by a high voltage probe, and led to a voltage comparator. Once the voltage reaches 20 kV, a 400 V pulse is generated and sent to the pulse transformer. There, a 10 kV pulse is formed and sent to the spark plug of the spark gap. This pulse is sufficient to initiate a discharge of the capacitors through the spark gap and the T-tube.
The discharge current has to be critically dampened, which was achieved by serially connecting a 0.3 Ω resistor in the discharge circuit. In this way, a single, short lasting, discharge current pulse is provided at the desired moment, resulting in the formation of a single, well defined, shock wave.
2.2. The Experimental Setup with the Spectral Recording System
A block scheme of the experimental system is given in Figure 5. The radiation emitted from the T-tube was collected radially, by means of an optical fiber which was placed at 2 cm from the reflector. At that position, optimum intensities of ionized oxygen and silicon spectral lines were observed. All measurements were carried out for the incident shock wave. The collected radiation was led to the entrance slit of the spectrometer. The used spectrometer was a Czerny-Turner type device, with 1 m focal length and a dispersion grating of 1200 g mm−1. The inverse linear dispersion was 0.83 nm/mm.
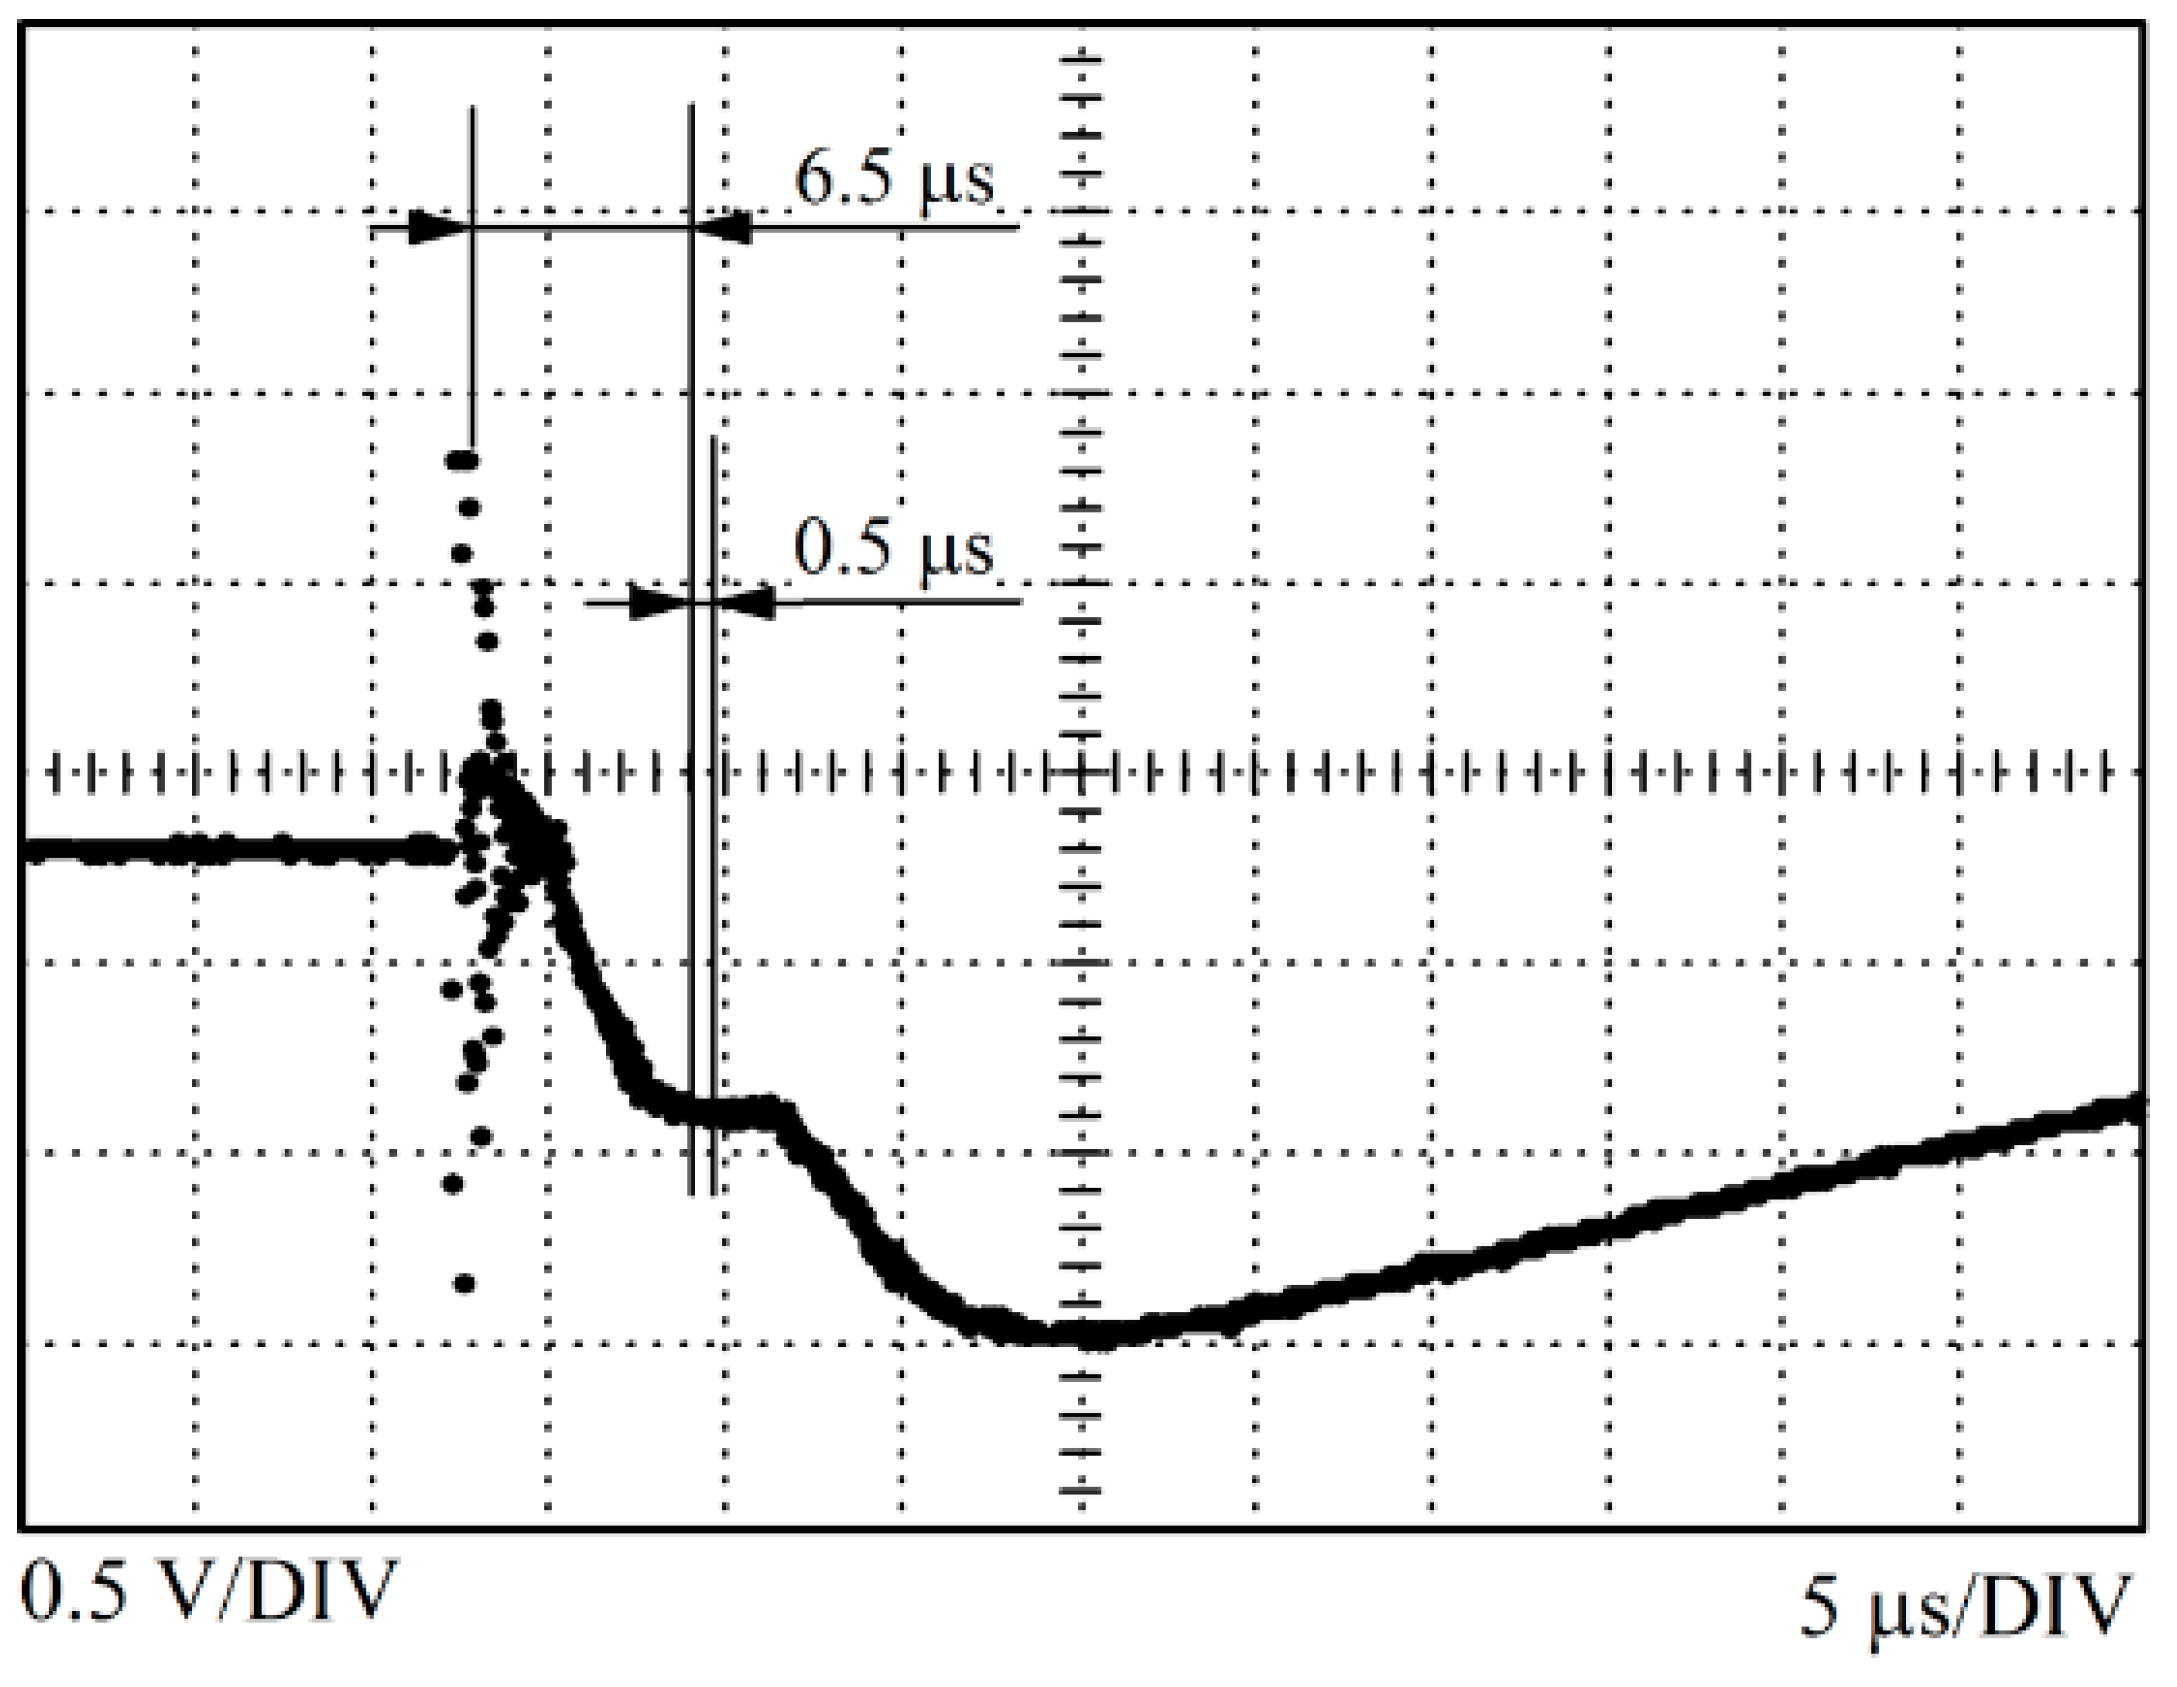
A photomultiplier tube and an ICCD camera were placed at the exit of the spectrometer, and a selection mirror allowed for alternating between those two detectors. The photomultiplier tube was used to observe the time evolution of the optical signal emitted from the plasma, as shown in Figure 6.
2.3. Plasma Diagnostics
The electron density was determined by measuring the peak separation of the He 447.1 nm line and calculated by using the formula given in [38]. The obtained value was 1.45 × 10²³ m−3. The experimental uncertainty was estimated as 15% and was caused by the error in peak separation measurement [35].
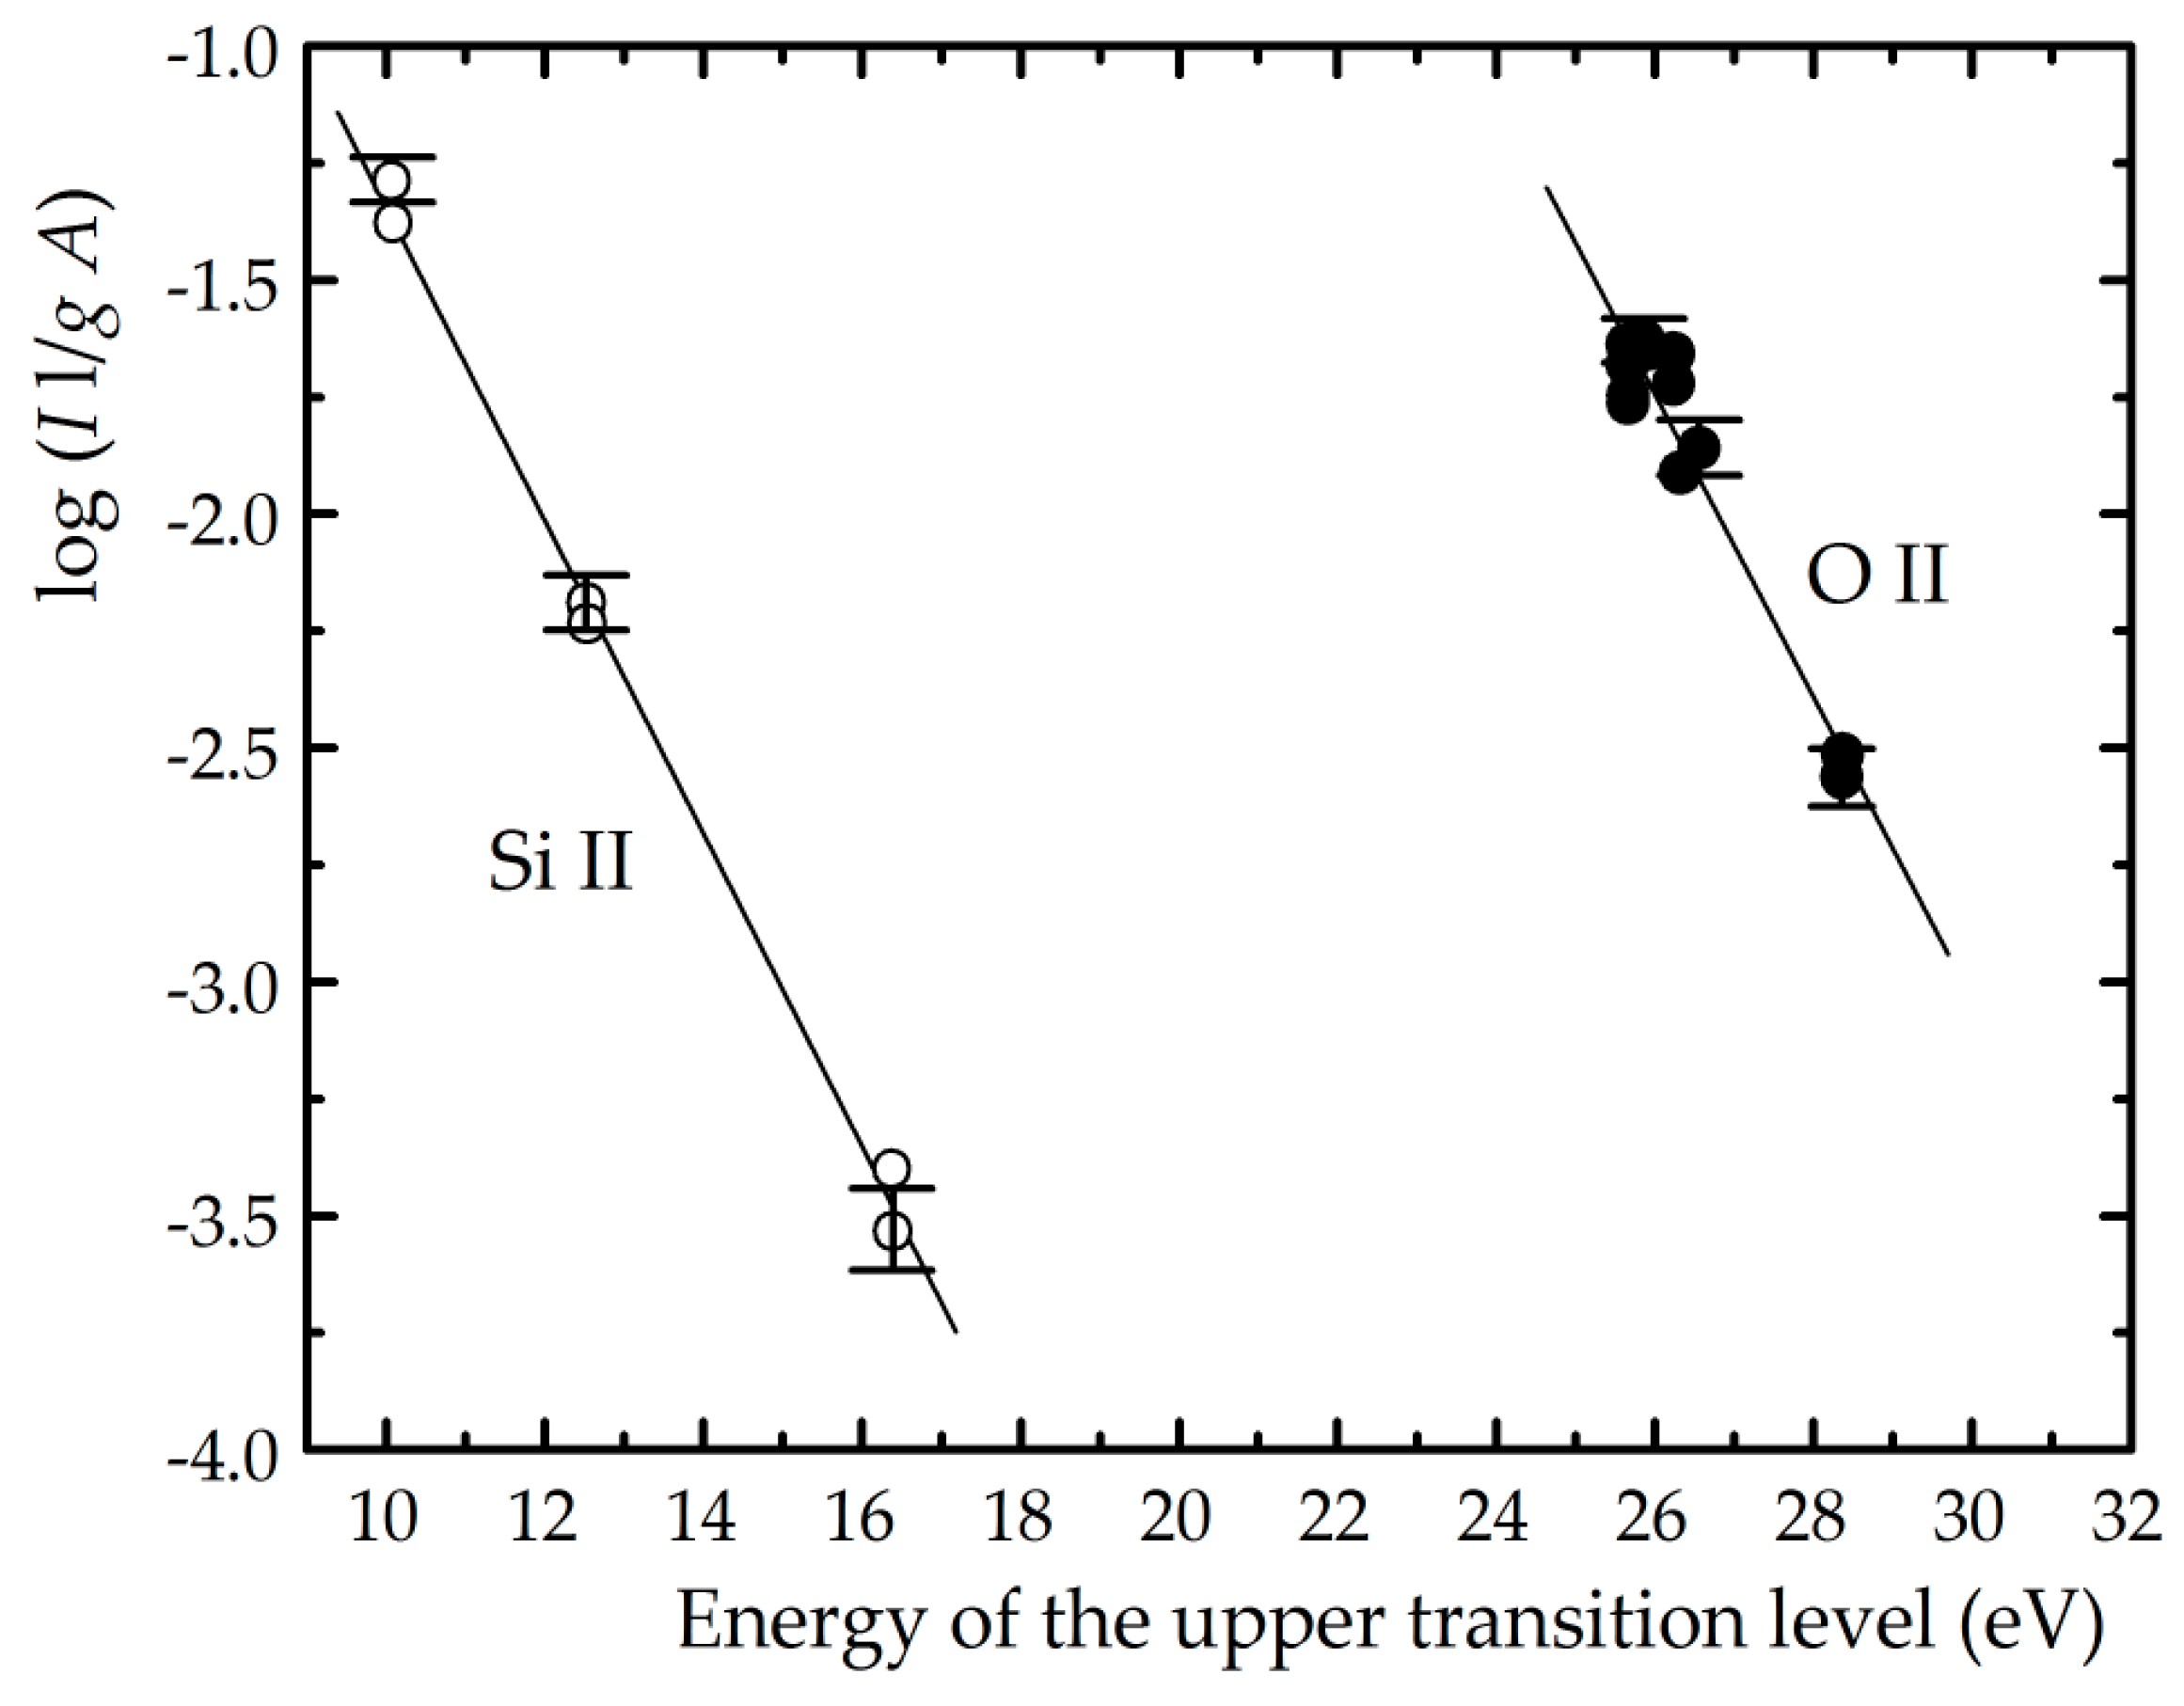
The electron temperature was determined by using the Boltzmann plot method. This required the plasma to be in thermodynamic equilibrium. This was checked according to the criteria given in [39]. It was found that the plasma observed in this work did not meet the conditions for local thermodynamic equilibrium, but did meet the conditions for partial local thermodynamic equilibrium. In order to determine the electron temperature, 6 Si II and 12 O II spectral lines were used. The necessary atomic data were taken from the NIST atomic spectra database [40]. The obtained Boltzmann plots are presented in Figure 8.
The electron temperature was determined from the slope of these plots by using the formula given in [41,42]. The obtained values were 14,900 K for Si II lines, and 15,300 K for O II lines. The estimated errors were within 10.8 and 17.2 percent [35]. The necessary recorded spectral line intensities are an average of ten shots. The variation of line intensities in successive shots is less than 5%. The spectral sensitivity uncertainty is below 1%. These uncertainties are included in the estimated temperature errors.
3. Spectral Line Broadening
The shape of O II, Si II and Si III spectral lines emitted from the plasma is best described by a theoretical Voigt profile. This profile is a convolution of the Gaussian and Lorentzian profiles. The Gaussian profile is due to Doppler and instrumental broadening, while the Lorentzian profile originates from Stark, Van der Waals and resonant broadening mechanisms. The broadening contributions of these individual mechanisms werecalculated for the observed lines in [35]. The Doppler broadening was between 0.005 nm and 0.01 nm for all lines. This was calculated by using the formula given in [43]. Van der Waals halfwidths were obtained by using the formula in [41] and [44], and ranged from 2 × 10⁻⁵ nm to 12 × 10−5 nm. Resonance halfwidths, where this effect was possible, were in the range between 6 × 10⁻⁶ nm and 2.3 × 10⁻³ nm and were calculated by using the formula given in [45] and [46]. Since the instrumental halfwidth for our experimental setup was around 0.45 nm, it can be claimed that the Gaussian part of the line profile is due to instrumental broadening. Similarly, the Lorentzian part of the line profile is a consequence of Stark broadening. Thus, by carrying out the deconvolution procedure [47], Stark halfwidths are obtained.
4. Results of Stark Halfwidth Measurements for O II, Si II and Si III Spectral Lines
Experimental Stark halfwidth data for 37 O II, 10 Si II and 12 Si III spectral lines were determined and are published in [35]. Available Stark halfwidth data, which have been published by other authors, can be found in the Critical Review papers [49,50,51,52,53,54,55]. According to these Critical Review papers, data on Stark halfwidths of O II spectral lines were found in 7 papers [1,2,3,4,5,6,7]. Data on Stark halfwidths of Si II and Si III spectral lines were found in 15 papers [8,9,10,11,12,13,14,15,16,17,18,19,20,21,22] and 6 papers [18,20,23,24,25,26], respectively. Each of those papers contains only a small number of spectral lines. Different experiments were performed under different conditions and by using different plasma sources. In contrast, Stark halfwidths of a large number of spectral lines from a wide spectral region and from one plasma source were obtained in [35].
The results were analyzed in several different ways. First, according to the regularities and similarities in plasma broadened spectral line widths [56]. Second, Stark halfwidths obtained in [35] were compared to values published by other authors [1,4,5,6,7,8,9,10,12,13,14,15,17,18,20,23,25,26]. Third, all experimental halfwidth values, both from [2] and from [1,4,5,6,7,8,9,10,12,13,14,15,17,18,20,23,25,26], were compared to theoretical values [57,58] by calculating the ratio of experimental to theoretical halfwidths. The analysis in this paper is performed only for those experimental results of other authors which contain data for more than one line in the observed multiplets.
4.1. Analysis of Stark Halfwidths of O II Spectral Lines
The analysis of O II Stark halfwidths inside a multiplet, according to [56], is given in Table 1. The line halfwidths in a multiplet usually agree within a few percent [56]. Taking into account experimental errors, we propose that if the variation of line halfwidths inside a multiplet is within 10%, the multiplet criterion is satisfied.
All results regarding OII lines, obtained in [35], meet the proposed multiplet criterion. Lines within the same multiplet deviate within a maximum of 5% from the average value. Most of the results published by other authors also meet this criterion. The results in [7], however, do not meet the proposed criterion for multiplets.
When comparing Stark halfwidths obtained in [35] to those published by other authors, the general halfwidth ratio range was found to be between 0.6 and 1.2 [35]. The results of [35] agree best with the results in [5], for which the halfwidth ratio is between 0.92 and 1.04. However, halfwidths published in [3,6] are significantly larger than those obtained in [35]. A strong disagreement was found with the results of [7] as well. For this analysis, the results of other authors were recalculated for the same electron temperature and density.
In order to compare experimental halfwidth results [35] with theoretical ones, halfwidth values were calculated according to the modified semi empirical formula (MSE) [57], the simplified modified semi empirical formula (SMSE) [58] and, where it was possible, were taken from the semi classical calculations [59].
The ratio of all experimental halfwidths and theoretical halfwidths [56] is generally between 0.7 and 1.18 [35]. Only the results given in [7] deviate from this range, with halfwidth ratios up to 1.6. Apart from that, it can be concluded that the experimental results, in general, agree best with theoretical values in [59].
In comparison to experimental Stark halfwidth values, the MSE theory provides systematically larger halfwidth values. The general halfwidth ratio is from 0.6 to 1.0 [35]. In contrast, the SMSE theory predicts values which are smaller than the experimental ones, with a general halfwidth ratio from 1.3 to 2.5 [35]. The results of [3,6] differ from SMSE results even more, resulting in halfwidth ratios from 4.0 to 5.0.
An example of the experimental and theoretical data distribution for one spectral line is given in Figure 9.
4.2. Analysis of Stark Halfwidths of Si II Spectral Lines
Stark halfwidths of SI II spectral lines, which were measured in [35], satisfy the proposed multiplet criterion very well, with deviations from the average halfwidth value being less than 3.5%. The results published in [9,10,13,17] also meet this criterion, while some results in [8,12,14,15,18] do not. An overview is given in Table 2.
By comparing the experimental results of [35] to those of other authors, a common halfwidth ratio from 0.4 to 1.5 was found. Results given in [20] deviate significantly from this, with a ratio of 5.0.
When compared to the theoretical results of [59], most experimental values provide a halfwidth ratio from 0.5 to 1.2. Some results in [12] are outside of this range (1.95). Comparing experimental results to values obtained from the MSE theory, a common halfwidth ratio from 0.5 to 1.7 is obtained. Again, the results given in [12] deviate with a ratio up to 2.58. The SMSE theory gives systematically smaller values than experimental ones, which is especially noticeable for transitions with a higher orbital quantum number. The experimental and theoretical Stark halfwidth data for one Si II spectral line are presented in Figure 10.
4.3. Analysis of Stark Halfwidths of Si III Spectral Lines
The experimental results for Si III from [35] satisfy the proposed multiplet criterion very well, with line Stark halfwidths differing 4% or less from the multiplet average value. Some of the other authors satisfy this criterion as well [18,23,25] while some do not [20,26], as it can be seen in Table 3.
The experimental halfwidths obtained in [35], when compared to those of other authors, are mostly in a ratio from 0.6 to 1.55. For the results published in [20], however, this ratio is 0.14.
For the observed Si III spectral lines, no data could be found in [59], so that no comparison could be made. When comparing all experimental values to MSE theory values, a common halfwidth ratio was found to be from 0.6 to 1.6. Again, some results given in [20] deviate significantly from most other results with a ratio of 6.08. The SMSE theory mostly gives smaller values, especially for higher orbital quantum numbers, as in the case of Si II. This is not always the case, as it can be seen in Figure 11. For the spectral line Si III 456.782, the SMSE theoretical values are higher than both the MSE theory and experimental data.
5. Conclusions
In this work, a comprehensive analysis of the experimental Stark halfwidth data of ionized oxygen and silicon is presented. The analysis is performed on experimental results measured in [2] and the available results of other authors [1,4,5,6,7,8,9,10,12,13,14,15,17,18,20,23,25,26]. A comparison with theoretical results [57,58,59] is also given.
In measurements performed in [35], special attention was paid to the experiment, the spectral recording and the data analysis. Stark halfwidths of a large number of spectral lines were obtained, covering a wide spectral region. All of these lines were emitted from the same plasma source, under the same conditions, and recorded with the same equipment. Some additional details about the experiment are given in this paper.
The analysis of the results published by other authors, revealed a few papers that contain results that strongly deviate from the results measured in [35], from available experimental data by other authors, and from theoretical values (see Section 4.1, Section 4.2 and Section 4.3). These halfwidth values should be used with caution for e.g., plasma diagnostics purposes.
The data obtained in [35] could be used for plasma diagnostics of both laboratory and astrophysical plasmas. Existing, as well as new theories could also be tested using these data. More independent experimental work is still needed to further improve the database of experimental Stark halfwidth results.
Funding
This research was funded by the Ministry of Education, Science and Technological development of Republic Serbia, grant number 171014.
Conflicts of Interest
The author declares no conflict of interest.
References
- Platiša, M.; Popović, M.; Konjević, N. Stark broadening of O II and O III Lines. Astron. Astrophys. 1975, 45, 325–327. [Google Scholar]
- Purić, J.; Djeniže, S.; Srećković, A.; Platiša, M.; Labat, J. Stark-broadening regularities of prominent multiply-ionized-oxygen spectral lines in plasma. Phys. Rev. A 1998, 37, 498–503. [Google Scholar] [CrossRef]
- Djeniže, S.; Srećković, A.; Labat, J.; Platiša, M. Stark broadening and shift of OII spectral lines in higher multiplets. Z. Phys. D 1991, 21, 295–297. [Google Scholar] [CrossRef]
- Djeniže, S.; Milosavljević, V.; Srećković, A. Measured Stark widths and shifts of singly ionized oxygen spectral lines in lower multiplets. J. Quant. Spectrosc. Radiat. Transf. 1998, 59, 71–75. [Google Scholar] [CrossRef]
- Blagojević, B.; Popović, M.V.; Konjević, N. Stark Broadening of Spectral Lines of Singly Ionized C, N, O, F and Ne. Phys. Scr. 1999, 59, 374–378. [Google Scholar] [CrossRef]
- Del Val, J.A.; Aparicio, J.A.; González, V.; Mar, S. Measurement of Stark widths in single ionized oxygen. Astron. Astrophys. Suppl. Ser. 1999, 140, 171–176. [Google Scholar] [CrossRef] [Green Version]
- Srećković, A.; Drinčić, V.; Bukvić, S.; Djeniže, S. Stark Broadening Parameters and Transition Probabilities in the O II Spectrum. Phys. Scr. 2001, 63, 306–312. [Google Scholar] [CrossRef]
- Wollschläger, F.; Mitsching, J.; Meiners, D.; Depiesse, M.; Richou, J.; Lesage, A. Measurements of the ionised silicon multiplet (1) Stark parameters by two different methods. J. Quant. Spectrosc. Radiat. Transf. 1997, 58, 135–140. [Google Scholar] [CrossRef]
- Chiang, W.T.; Griem, H.R. Measurements of the Stark broadening of ionized silicon lines from a plasma. Phys. Rev. A 1978, 18, 1169–1175. [Google Scholar] [CrossRef]
- Pérez, C.; de la Rosa, I.; Frutos, A.M.; González, V.R.; Mar, S. Stark broadening of several SiII lines. Ann. Phys. 1990, 15, 115–116. [Google Scholar]
- Lesage, A.; Redon, R. Stark widths of faint Si II lines. Astron. Astrophys. 2004, 418, 765–769. [Google Scholar] [CrossRef] [Green Version]
- Pérez, C.; de la Rosa, I.; Frutos, A.M.; Mar, S. Temperature dependence of Stark broadening for several Si II lines. Phys. Rev. E 1993, 47, 756–759. [Google Scholar] [CrossRef]
- Konjević, N.; Purić, J.; Ćirković, L.; Labat, J. Measurements of the Stark broadening parameters of several Si II lines. J. Phys. B 1970, 3, 999–1003. [Google Scholar] [CrossRef]
- Purić, J.; Djeniže, S.; Labat, J.; Ćirković, L. Stark shift of neutral and ionized silicon spectral lines. Phys. Lett. A 1973, 45, 97–98. [Google Scholar] [CrossRef]
- Lesage, A.; Rathore, B.A.; Lakićević, I.S.; Purić, J. Stark widths and shifts of singly ionized silicon spectral lines. Phys. Rev. A 1983, 28, 2264–2268. [Google Scholar] [CrossRef]
- Lesage, A.; Miller, M.H. Détermination expérimentale de l’élargissment du déplacement Stark de raies d’atomes de silicium ionizes. C. R. Acad. Sci. Paris Ser. B 1975, 280, 645–647. [Google Scholar]
- González, V.R.; Aparicio, J.A.; del Val, J.A.; Mar, S. Stark broadening and shift measurements of visible Si II lines. J. Phys. B 2002, 35, 3557–3573. [Google Scholar]
- Bukvić, S.; Djeniže, S.; Srećković, A. Line broadening in the Si I, Si II, Si III, and Si IV spectra in the helium plasma. Astron. Astrophys. 2009, 508, 491–500. [Google Scholar] [CrossRef] [Green Version]
- Lesage, A.; Sahal-Brechot, S.; Miller, M.H. Stark broadening of singly ionized-silicon. Phys. Rev. A 1977, 16, 1617–1624. [Google Scholar] [CrossRef]
- Kusch, H.J.; Schröder, K. Experimental Stark Broadening Data of Si II and Si III Lines. Astron. Astrophys. 1982, 116, 255–259. [Google Scholar]
- Miller, M.H. Technical Note BN-550; University of Maryland: College Park, MD, USA, 1968. [Google Scholar]
- Chapelle, J.; Czernichowski, A. Stark Broadening of the Spectral Lines 6371.4 and 6347.1 A for Si II. Acta Phys. Pol. A 1972, 41, 753. [Google Scholar]
- González, V.R.; Aparicio, J.A.; del Val, J.A.; Mar, S. Stark width and shift measurements of visible SI III lines. Astron. Astrophys. 2000, 363, 1177–1185. [Google Scholar]
- Djeniže, S.; Srećković, A.; Labat, J.; Purić, J.; Platiša, M. Measured Stark widths of doubly and triply ionized silicon spectral lines. J. Phys. B 1992, 25, 785–790. [Google Scholar] [CrossRef]
- Platiša, M.; Dimitrijević, M.S.; Popović, M.; Konjević, N. Stark broadening of Si III and Si IV lines. J. Phys. B 1977, 10, 2997–3004. [Google Scholar] [CrossRef]
- Purić, J.; Djeniže, S.; Labat, J.; Ćirković, L. Stark broadening parameters of Si I, Si II and Si III lines. Z. Phys. 1974, 267, 71–75. [Google Scholar] [CrossRef]
- Sollerman, J.; Fynbo, J.P.U.; Gorosabel, J.; Halpern, J.P.; Hjorth, J.; Jakobsson, P.; Mirabal, N.; Watson, D.; Xu, D.; Castro-Tirado, A.J.; et al. The nature of the X-ray flash of 24 August 2005—Photometric evidence for an on-axis z = 0.83 burst with continuous energy injection and an associated supernova. Astron. Astrophys. 2007, 466, 839–846. [Google Scholar] [CrossRef]
- Muzzin, A.; Wilson, G.; Yee, H.K.C.; Gilbank, D.; Hoekstra, H.; Demarco, R.; Balogh, M.; van Dokkum, P.; Franx, M.; Ellingson, E.; et al. The Gemini Cluster Astrophysics Spectroscopic Survey (GCLASS): The Role of Environment and Self-regulation in Galaxy Evolution at z ~ 1. Astrophys. J. 2012, 746, 188. [Google Scholar] [CrossRef]
- Lorenzo, J.; Negueruela, I.; Castro, N.; Norton, A.J.; Vilardell, F.; Herrero, A. Astrophysical parameters of the peculiar X-ray transient IGR J11215−5952. Astron. Astrophys. 2014, 562, A18. [Google Scholar] [CrossRef] [Green Version]
- Berdyugina, S.V.; Ilyin, I.; Tuominen, I. The long-period RS CanumVenaticorum binary IM Pegasi I. Orbital and stellar parameters. Astron. Astrophys. 1999, 347, 932–936. [Google Scholar]
- Asplund, M. Line formation in solar granulation III. The photospheric Si and meteoritic Fe abundances. Astron. Astrophys. 2000, 359, 755–758. [Google Scholar]
- Briquet, M.; Aerts, C.; Lüftinger, T.; De Cat, P.; Piskunov, N.E.; Scuflaire, R. He and Si surface inhomogeneities of four Bp variable stars. Astron. Astrophys. 2004, 413, 273–283. [Google Scholar] [CrossRef]
- Khalack, V.; Landstreet, J.D. Partial Paschen–Back splitting of Si II and Si III lines in magnetic chemically peculiar stars. Mon. Not. R. Astron. Soc. 2012, 427, 569–580. [Google Scholar] [CrossRef]
- Gigosos, M.A.; Djurović, S.; Savić, I.; González-Herrero, D.; Mijatović, Z.; Kobilarov, R. Stark broadening of lines from transition between states n = 3 to n = 2 in neutral helium. Astron. Astrophys. 2014, 561, A135–A147. [Google Scholar] [CrossRef]
- Gavanski, L.; Belmonte, M.T.; Savić, I.; Djurović, S. Experimental Stark halfwidths of the ionized oxygen and silicon spectral lines. Mon. Not. R. Astron. Soc. 2016, 457, 4038–4050. [Google Scholar] [CrossRef]
- Djurović, S.; Mijatović, Z.; Vujičić, B.; Kobilarov, R.; Savić, I.; Gavanski, L. Measurement of the shock front velocity produced in a T-tube. Phys. Plasmas 2015, 22, 013505. [Google Scholar] [CrossRef]
- Kolb, A.C. Production of High-Energy Plasmas by Magnetically Driven Shock Waves. Phys. Rev. 1957, 107, 345–350. [Google Scholar] [CrossRef]
- Ivković, M.; González, M.Á.; Jovićević, S.; Gigosos, M.A.; Konjević, N. A simple line shape technique for electron number density diagnostics of helium and helium-seeded plasmas. Spectrochim. Acta B 2010, 65, 234–240. [Google Scholar] [CrossRef]
- Griem, H.R. Validity of Local Thermal Equilibrium in Plasma Spectroscopy. Phys. Rev. 1963, 131, 1170–1176. [Google Scholar] [CrossRef]
- NIST Atomic Spectra Database. Available online: https://www.nist.gov/pml/atomic-spectra-database (accessed on 13 November 2018).
- Griem, H.R. Plasma Spectroscopy; McGraw-Hill Book Company: New York, NY, USA, 1964. [Google Scholar]
- Mitchner, M.; Kruger, C.H. Partially Ionized Gases; John Wiley & Sons: New York, NY, USA, 1973. [Google Scholar]
- Konjević, N.; Roberts, J.R. A critical review of the Stark widths and shifts of spectral lines from non-hydrogenic atoms. J. Phys. Chem. Ref. Data 1976, 5, 209–257. [Google Scholar] [CrossRef]
- Kelleher, D.E. Stark broadening of visible neutral helium lines in a plasma. J. Quant. Spectrosc. Radiat. Transf. 1981, 25, 191–220. [Google Scholar] [CrossRef]
- Ali, A.W.; Griem, H.R. Theory of Resonance Broadening of Spectral Lines by Atom-Atom Impacts. Phys. Rev. 1965, 140, A1044–A1049. [Google Scholar] [CrossRef]
- Ali, A.W.; Griem, H.R. Errata: Theory of Resonance Broadening of Spectral Lines by Atom-Atom Impacts. Phys. Rev. 1966, 144, 366. [Google Scholar] [CrossRef]
- Davies, J.T.; Vaughan, J.M. A New Tabulation of the Voigt Profile. Astrophys. J. 1963, 137, 1302–1305. [Google Scholar] [CrossRef]
- Djurović, S.; Kobilarov, R.; Vujičić, B. Experimental difficulties in determination of the spectral line shapes emitted from plasma. Bull. Astron. Belgrade 1996, 153, 41. [Google Scholar]
- Konjević, N. Plasma broadening and shifting of non-hydrogenic spectral lines: Present status and applications. Phys. Rep. 1999, 316, 339–401. [Google Scholar] [CrossRef]
- Konjević, N.; Wiese, W.L. Experimental Stark widths and shifts for non-hydrogenic spectral lines of ionized atoms. J. Phys. Chem. Ref. Data 1976, 5, 259–308. [Google Scholar] [CrossRef]
- Konjević, N.; Dimitrijević, M.S.; Wiese, W.L. Experimental Stark Widths and Shifts for Spectral Lines of Neutral Atoms (A Critical Review of Selected Data for the Period 1976 to 1982). J. Phys. Chem. Ref. Data 1984, 13, 619–647. [Google Scholar] [CrossRef]
- Konjević, N.; Dimitrijević, M.S.; Wiese, W.L. Experimental Stark Widths and Shifts for Spectral Lines of Positive Ions (A Critical Review and Tabulation of Selected Data for the Period 1976 to 1982). J. Phys. Chem. Ref. Data 1984, 13, 649–686. [Google Scholar] [CrossRef]
- Konjević, N.; Wiese, W.L. Experimental Stark Widths and Shifts for Spectral Lines of Neutral and Ionized Atoms. J. Phys. Chem. Ref. Data 1990, 19, 1307–1385. [Google Scholar] [CrossRef]
- Konjević, N.; Lesage, A.; Fuhr, J.R.; Wiese, W.L. Experimental Stark Widths and Shifts for Spectral Lines of Neutral and Ionized Atoms (A Critical Review of Selected Data for the Period 1989 Through 2000). J. Phys. Chem. Ref. Data 2002, 31, 819–927. [Google Scholar] [CrossRef]
- Lesage, A. Experimental Stark widths and shifts for spectral lines of neutral and ionized atoms A critical review of selected data for the period 2001–2007. New Astron. Rev. 2009, 52, 471–535. [Google Scholar] [CrossRef]
- Wiese, W.L.; Konjević, N. Regularities and similarities in plasma broadened spectral line widths. J. Quant. Spectrosc. Radiat. Transf. 1982, 28, 185–198. [Google Scholar] [CrossRef]
- Dimitrijević, M.S.; Konjević, N. Stark widths of doubly- and triply-ionized atom lines. J. Quant. Spectrosc. Radiat. Transf. 1980, 24, 451–459. [Google Scholar] [CrossRef]
- Dimitrijević, M.S.; Konjević, N. Simple estimates for Stark broadening of ion lines in stellar plasmas. Astron. Astrophys. 1987, 172, 345–349. [Google Scholar]
- Griem, H.R. Spectral Line Broadening by Plasmas; Academic Press: New York, NY, USA, 1974. [Google Scholar]
Figure 1.
Examples of recorded He spectra with (a) Si II and (b) O II lines present as impurities in plasma.
Figure 1.
Examples of recorded He spectra with (a) Si II and (b) O II lines present as impurities in plasma.

Figure 2.
The cross section of the T-tube.

Figure 3.
The T-tube, the system for supplying gas and the vacuum system.

Figure 4.
Schematic representation of the electrical system used for performing the discharge through the T-tube.
Figure 4.
Schematic representation of the electrical system used for performing the discharge through the T-tube.

Figure 5.
Block scheme of the T-tube experimental setup with the spectral recording system.

Figure 6.
Time evolution of the optical signal from the plasma, recorded by the photomultiplier. The exposure time of 0. 5 µs in the incident shock wave is denoted by the arrows.
Figure 6.
Time evolution of the optical signal from the plasma, recorded by the photomultiplier. The exposure time of 0. 5 µs in the incident shock wave is denoted by the arrows.

Figure 7.
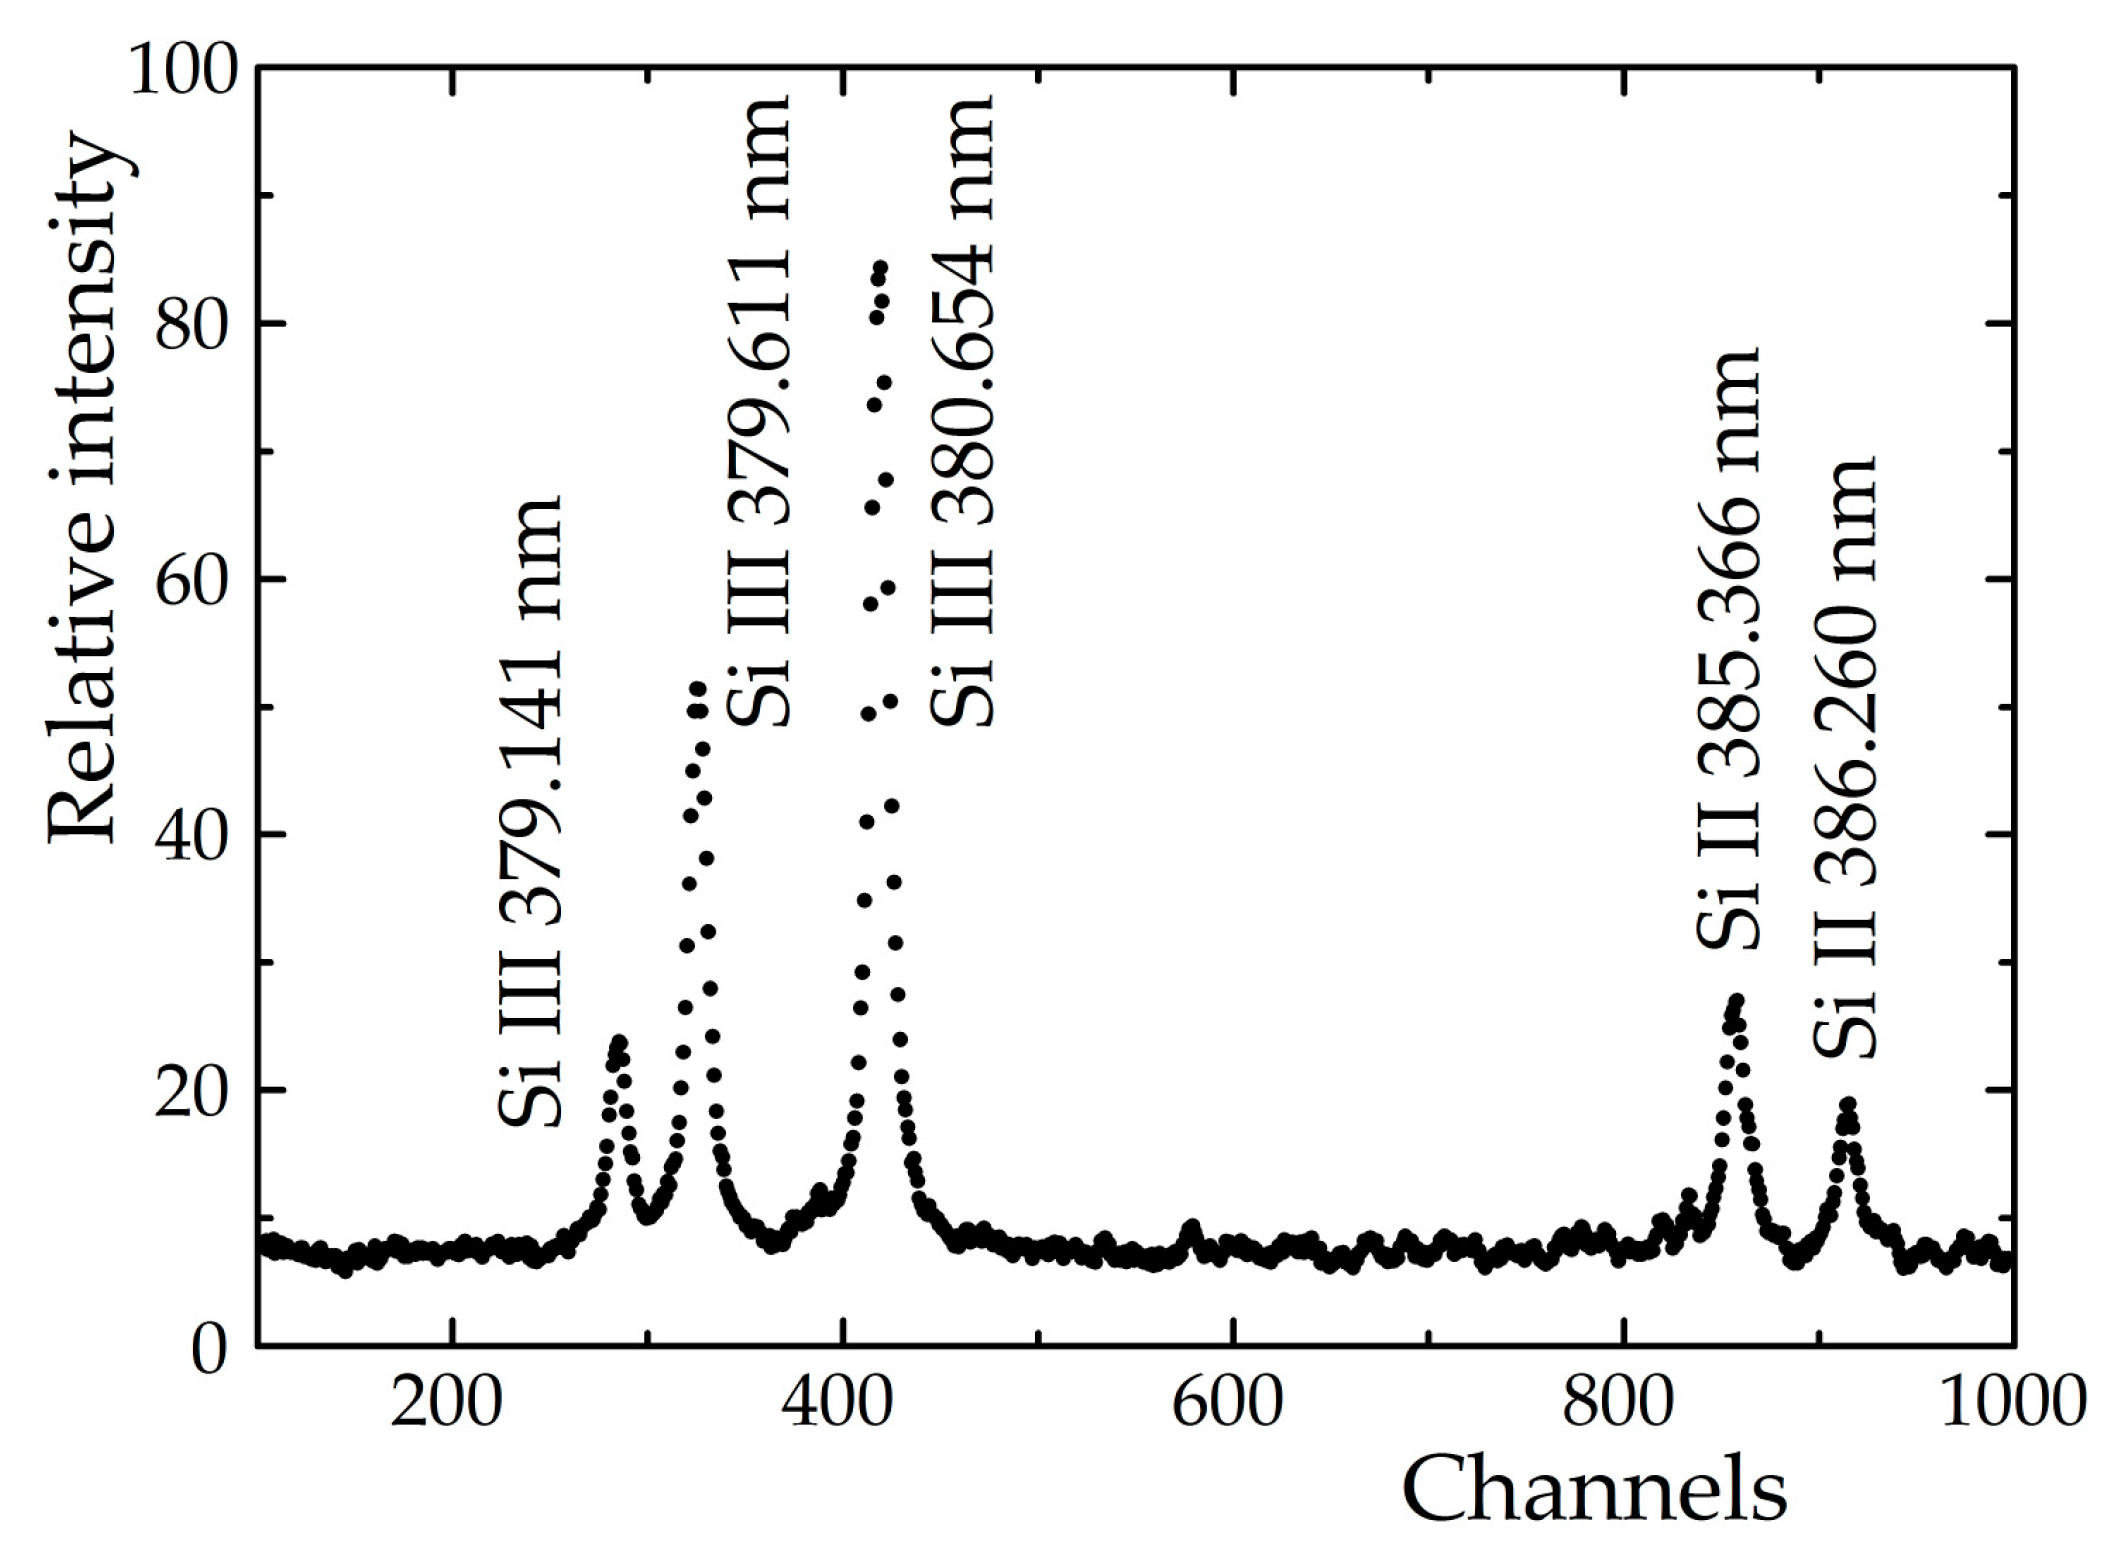
Example of the recorded spectra containing some Si II and Si III spectral lines.

Figure 8.
Boltzmann plots of Si II and O II spectral lines [35].
Figure 8.
Boltzmann plots of Si II and O II spectral lines [35].

Figure 9.
Experimental and theoretical Stark halfwidth dependence on temperature for the O II 407.215 nm spectral line for the electron density of 1023 m−3. The presented data are: ⊕ [1], ⬜ [6], ▲ [7], ⬤ [35], ![Atoms 07 00008 i003]() [57],
[57], ![Atoms 07 00008 i004]() [58] and
[58] and ![Atoms 07 00008 i005]() [59].
[59].
 [57],
[57],  [58] and
  [59].
[59].
Figure 10.
Experimental and theoretical Stark halfwidth dependence on temperature, for the Si II 505.598 nm spectral line for the electron density of 1023 m−3. The presented data are: ![Atoms 07 00008 i001]() [12], ★ [15], ◇ [16], ⬠ [17], ☆ [19], ◓ [20], ⬤ [35],
[12], ★ [15], ◇ [16], ⬠ [17], ☆ [19], ◓ [20], ⬤ [35], ![Atoms 07 00008 i003]() [57],
[57], ![Atoms 07 00008 i004]() [58] and
[58] and ![Atoms 07 00008 i005]() [59].
[59].
 [12], ★ [15], ◇ [16], ⬠ [17], ☆ [19], ◓ [20], ⬤ [35], [57], [58] and [59].
Figure 11.
Experimental and theoretical Stark halfwidth dependence on temperature, for the Si III 456.782 nm spectral line for the electron density of 1023 m−3. The presented data are: ▷ [23], ![Atoms 07 00008 i002]() [25], ⛝ [26], ⬤ [35],
[25], ⛝ [26], ⬤ [35], ![Atoms 07 00008 i003]() [57] and
[57] and ![Atoms 07 00008 i004]() [58].
[58].
 [25], ⛝ [26], ⬤ [35], [57] and [58].

Table 1.
Overview of the analysis of Stark halfwidth results for O II spectral lines.
| Reference | Transition | Multiplet | No. of Measured Lines in Multiplet | Proposed Multiplet Criterion |
|---|---|---|---|---|
| [35] | (3P)3s-(3P)3p | 4P-4Do | 7 | Satisfied |
| (3P)3s-(3P)3p | 4P-4Po | 3 | Satisfied | |
| (3P)3s-(3P)3p | 4P-4So | 3 | Satisfied | |
| (3P)3s-(3P)3p | 2P-2Do | 2 | Satisfied | |
| (3P)3s-(3P)3p | 2P-2Po | 4 | Satisfied | |
| (3P)3p-(3P)3d | 4Do-4F | 2 | Satisfied | |
| (1D)3s-(1D)3p | 2D-2Fo | 2 | Satisfied | |
| (3P)3p-(3P)3d | 4Po-4P | 2 | Satisfied | |
| (3P)3p-(3P)3d | 4So-4P | 2 | Satisfied | |
| (1D)3p-(1D)3d | 2Fo-2G | 2 | Satisfied | |
| [1] | (3P)3s-(3P)3p | 4P-4Do | 2 | Satisfied |
| (3P)3s-(3P)3p | 4P-4So | 3 | Satisfied | |
| (1D)3s-(1D)3p | 2D-2Fo | 2 | Satisfied | |
| [4] | (3P)3s-(3P)3p | 4P-4Do | 2 | Satisfied |
| [5] | (3P)3s-(3P)3p | 2P-2Do | 2 | Satisfied |
| [6] | (3P)3s-(3P)3p | 4P-4Do | 4 | Satisfied |
| (3P)3s-(3P)3p | 4P-4Po | 3 | Satisfied | |
| (3P)3p-(3P)3d | 4Do-4F | 2 | Satisfied | |
| (1D)3s-(1D)3p | 2D-2Fo | 2 | Satisfied | |
| [7] | (3P)3s-(3P)3p | 2P-2Po | 2 | Not satisfied, 32.1% |
| (3P)3p-(3P)3d | 4Do-4F | 2 | Not satisfied, 26.7% | |
| (1D)3p-(1D)3d | 2Fo-2G | 2 | Not satisfied, 19.9% |
Table 2.
Overview of the analysis of Stark halfwidth results for Si II spectral lines.
| Reference | Transition | Multiplet | No. of Measured Lines in Multiplet | Proposed Multiplet Criterion |
|---|---|---|---|---|
| [35] | 3s3p2-3s24p | 2D-2Po | 3 | Satisfied |
| 3s24s-3s24p | 2S-2Po | 2 | Satisfied | |
| 3s23d-3s24f | 2D-2Fo | 2 | Satisfied | |
| [8] | 3s3p2-3s24p | 2D-2Po | 3 | Not satisfied, 14% |
| [9] | 3s3p2-3s24p | 2D-2Po | 2 | Satisfied |
| 3s24s-3s24p | 2S-2Po | 2 | Satisfied | |
| [10] | 3s24s-3s24p | 2S-2Po | 2 | Satisfied |
| [12] | 3s24s-3s24p | 2S-2Po | 2 | Satisfied |
| 3s23d-3s24f | 2D-2Fo | 2 | Not satisfied, 25% | |
| [13] | 3s3p2-3s24p | 2D-2Po | 2 | Satisfied |
| 3s24s-3s24p | 2S-2Po | 2 | Satisfied | |
| [14] | 3s3p2-3s24p | 2D-2Po | 2 | Not satisfied, 28% |
| [15] | 3s3p2-3s24p | 2D-2Po | 2 | Not satisfied, 11.7% |
| 3s24s-3s24p | 2S-2Po | 2 | Not satisfied, 18% | |
| 3s23d-3s24f | 2D-2Fo | 2 | Not satisfied, 11.5% | |
| [17] | 3s3p2-3s24p | 2D-2Po | 3 | Satisfied |
| 3s24s-3s24p | 2S-2Po | 2 | Satisfied | |
| 3s23d-3s24f | 2D-2Fo | 2 | Satisfied | |
| [18] | 3s3p2-3s24p | 2D-2Po | 3 | Not satisfied, 11.3% |
| 3s24s-3s24p | 2S-2Po | 2 | Satisfied | |
| 3s23d-3s24f | 2D-2Fo | 2 | Satisfied | |
| [19] | 3s3p2-3s24p | 2D-2Po | 2 | Satisfied |
| 3s24s-3s24p | 2S-2Po | 2 | Satisfied | |
| 3s23d-3s24f | 2D-2Fo | 2 | Satisfied |
Table 3.
Overview of the analysis of Stark halfwidth results for Si III spectral lines.
| Reference | Transition | Multiplet | No. of Measured Lines in Multiplet | Proposed Multiplet Criterion |
|---|---|---|---|---|
| [35] | 3s3d-3s4p | 3D-3Po | 3 | Satisfied |
| 3s4s-3s4p | 3S-3Po | 3 | Satisfied | |
| 3s4p-3s4d | 3Po-3D | 3 | Satisfied | |
| [20] | 3s4p-3s4d | 3Po-3D | 3 | Not satisfied, 16% |
| [18] | 3s3d-3s4p | 3D-3Po | 3 | Satisfied |
| 3s4s-3s4p | 3S-3Po | 3 | Satisfied | |
| 3s4p-3s4d | 3Po-3D | 3 | Satisfied | |
| [23] | 3s4s-3s4p | 3S-3Po | 3 | Satisfied |
| 3s4p-3s4d | 3Po-3D | 3 | Satisfied | |
| [25] | 3s4s-3s4p | 3S-3Po | 3 | Satisfied |
| [26] | 3s4s-3s4p | 3S-3Po | 2 | Not satisfied, 11.5% |
© 2019 by the author. Licensee MDPI, Basel, Switzerland. This article is an open access article distributed under the terms and conditions of the Creative Commons Attribution (CC BY) license (http://creativecommons.org/licenses/by/4.0/).
Share and Cite
MDPI and ACS Style
Gavanski, L. Measurement of Stark Halfwidths of Spectral Lines of Ionized Oxygen and Silicon Emitted from T-tube Plasma. Atoms 2019, 7, 8. https://doi.org/10.3390/atoms7010008
AMA Style
Gavanski L. Measurement of Stark Halfwidths of Spectral Lines of Ionized Oxygen and Silicon Emitted from T-tube Plasma. Atoms. 2019; 7(1):8. https://doi.org/10.3390/atoms7010008
Chicago/Turabian StyleGavanski, Lazar. 2019. "Measurement of Stark Halfwidths of Spectral Lines of Ionized Oxygen and Silicon Emitted from T-tube Plasma" Atoms 7, no. 1: 8. https://doi.org/10.3390/atoms7010008
Note that from the first issue of 2016, this journal uses article numbers instead of page numbers. See further details here.