Article

Evaluation of an Oxygen Transport Coefficient in the Aditya Tokamak Using the Radial Profile of O4+ Emissivity and the Importance of Atomic Data Used Therein

1
Institute for Plasma Research, Bhat 382 428, Gandhinagar, India
2
Birla Institute of Technology-Mesra, Jaipur Campus, Jaipur 302 017, Rajasthan, India
3
The National Institute of Engineering, Mysuru 570 008, Karnataka, India
4
Nuclear Engineering and Technology Programme, Indian Institute of Technology Kanpur, Kanpur 208 016, Uttar Pradesh, India
5
National Institute for Fusion Science, Toki 509-5292, Gifu, Japan
*
Author to whom correspondence should be addressed.
Atoms 2019, 7(3), 90; https://doi.org/10.3390/atoms7030090
Submission received: 30 June 2019 / Revised: 27 August 2019 / Accepted: 30 August 2019 / Published: 9 September 2019
(This article belongs to the Special Issue Plasma Spectroscopy in the Presence of Magnetic Fields)

Abstract

:
Oxygen impurity transport in the typical discharges of the Aditya tokamak was investigated using emissivity radial profile of emissivity of the spectral line (2p3p 3D3–2p3d 3F4) at 650.024 nm from the Be-like oxygen ion. This O4+ spectral line was recorded using a 1.0 m multi-track spectrometer capable of simultaneous measurements from eight lines of sight passing through the plasma. The oxygen transport coefficients were determined by reproducing the experimentally measured emissivity profiles of O4+, using a one-dimensional impurity transport code, STRAHL, and photon emissivity coefficient (PEC) belonging to that transition. The PEC values were obtained from both ADAS and NIFS atomic databases. Using both the databases, much higher values of diffusion coefficients compared to the neo-classical values were observed in both high and low magnetic field edge regions of typical Aditya tokamak Ohmic plasma. Although, almost similar profiles of diffusion coefficients were obtained using PEC values from both databases, the magnitude differs considerably. The maximum values of diffusion coefficients in the plasma edge at low field side of tokamak were ~45 and ~25 m2·s−1 when modeling was done using the ADAS and NIFS databases, respectively. Further analysis on the atomic data used in the calculation indicates that the difference in diffusion coefficients is mainly related to the variation in the values of atomic data of the two databases.

1. Introduction

Impurity transport in the tokamak needs to be understood to minimize and control the impurities inside the tokamak plasma, since it affects plasma performance through radiation loss and dilution of fuel particle [1]. Not only that, higher levels of impurities inside the plasma core enhance the occurrence of density limit disruption [2]. Yet, the controlled amount of impurity seeding inside the edge plasma helps to achieve the mitigation of disruption, reduction the heat load on the diverter, and improved confinement, such as Radiative Improved (RI) mode [3]. In the present day, with tokamaks having high electron temperatures, spectral emissions in the extreme and vacuum ultraviolet (EUV and VUV) wavelength ranges have been utilized to study impurity transport. However, visible emissions are still employed for this purpose in tokamaks with lower central temperature or in the diverter region of large tokamaks [4]. An impurity transport study is generally done using the experimentally observed spatial profile of absolute intensities of spectral emissions, either from intrinsic or injected impurity, in combination with an impurity transport code. It computes the radial profiles of impurity density through the ionization balance on the basis of given plasma parameters and using the coupled set of radial transport equations for every ionization stage [5,6]. Spectral emissivity of a transition of a charge state is then calculated using the photon emissivity coefficient (PEC), which comes from the calculation of population balance in the different excited states of the ion using collisional-radiative (CR) modeling. This model not only includes bound excited populations originating exclusively from the ground state via electron impact excitation, but also the secondary processes like excitation transfer, recombination, and ionization involving all excited states [7]—and all these calculations involve atomic physics data sets. Then, the accuracy in the transport study relies on the application of an appropriate atomic model and the accuracy of the atomic data, such as energy level, Einstein A-coefficient, ionization, and excitation rate coefficient used therein.
The strong spectral line emissions of the Be-like oxygen ion mostly lie in the UV and VUV regions. As a result, in earlier times, the CR model (CRM) code developed to calculate the PEC values of different transitions from this ion were included to only the lowest 10 to 20 energy levels, excluding almost all ∆n = 0 (3 → 3) and (4 → 4) transitions [8]. However, considering the relatively low value of the ionization potential of the Be-like oxygen ion, which is equal to 113.9 eV, visible radiation of this ion due to ∆n = 0 transition within n = 3 and n = 4 levels does exist, and this was first observed in the DIII-D tokamak [9]. Then the spectral line brightness was calculated by developing a CRM using detailed atomic structure to reproduce the observation by retaining the n = 3 and 4 energy levels. This was also subsequently done by other groups [10,11]. Nevertheless, the PEC values obtained from these codes differ due to not only the differences in the fundamental atomic data, but also due to the non-inclusion of many transitions populating the 2p3d upper level of the observed visible spectral lines from tokamak plasma.
In the Aditya tokamak [12], an intense visible line from Be-like oxygen at 650.024 nm (2p3p 3D3–2p3d 3F4) is routinely observed [13]. Therefore, this emission was used to study the impurity transport in the Aditya tokamak by utilizing the advantage of visible spectroscopy, which is the use of optical fiber for the space resolved measurement. In the Aditya tokamak, the experimental spatial profile of brightness of this transition was modeled to obtain the oxygen diffusion coefficient using STRAHL impurity transport code [14] and the required PEC from the ADAS database [10]. The obtained higher value of the diffusion coefficient was explained by fluctuation-induced transport [15]. The radial profile of this emission was also employed to validate the impurity transport code developed using a semi-implicit numerical technique for the study of impurity transport in tokamak plasmas [16]. Later, the O4+ emissivity profile was modeled using this code [17], in which the PEC data were taken from ADAS and from a CRM code [10] developed by the National Institute of Fusion Science (NIFS), Japan. In this paper, the oxygen transport was studied using STRAHL code and the two above-mentioned PEC data to understand the role of atomic data used in impurity transport modeling. It was found that the oxygen diffusion coefficient obtained using NIFS PEC data is lower as compared to the one obtained using the PEC provided by ADAS. The paper is organized as follows: Section 2 deals with the experimental setup used in this study. The detail of the modeling of the oxygen emissivity is described in Section 3. In Section 4, a brief discussion of the role of atomic data used in the transport code is presented, and a conclusion is presented in Section 5.

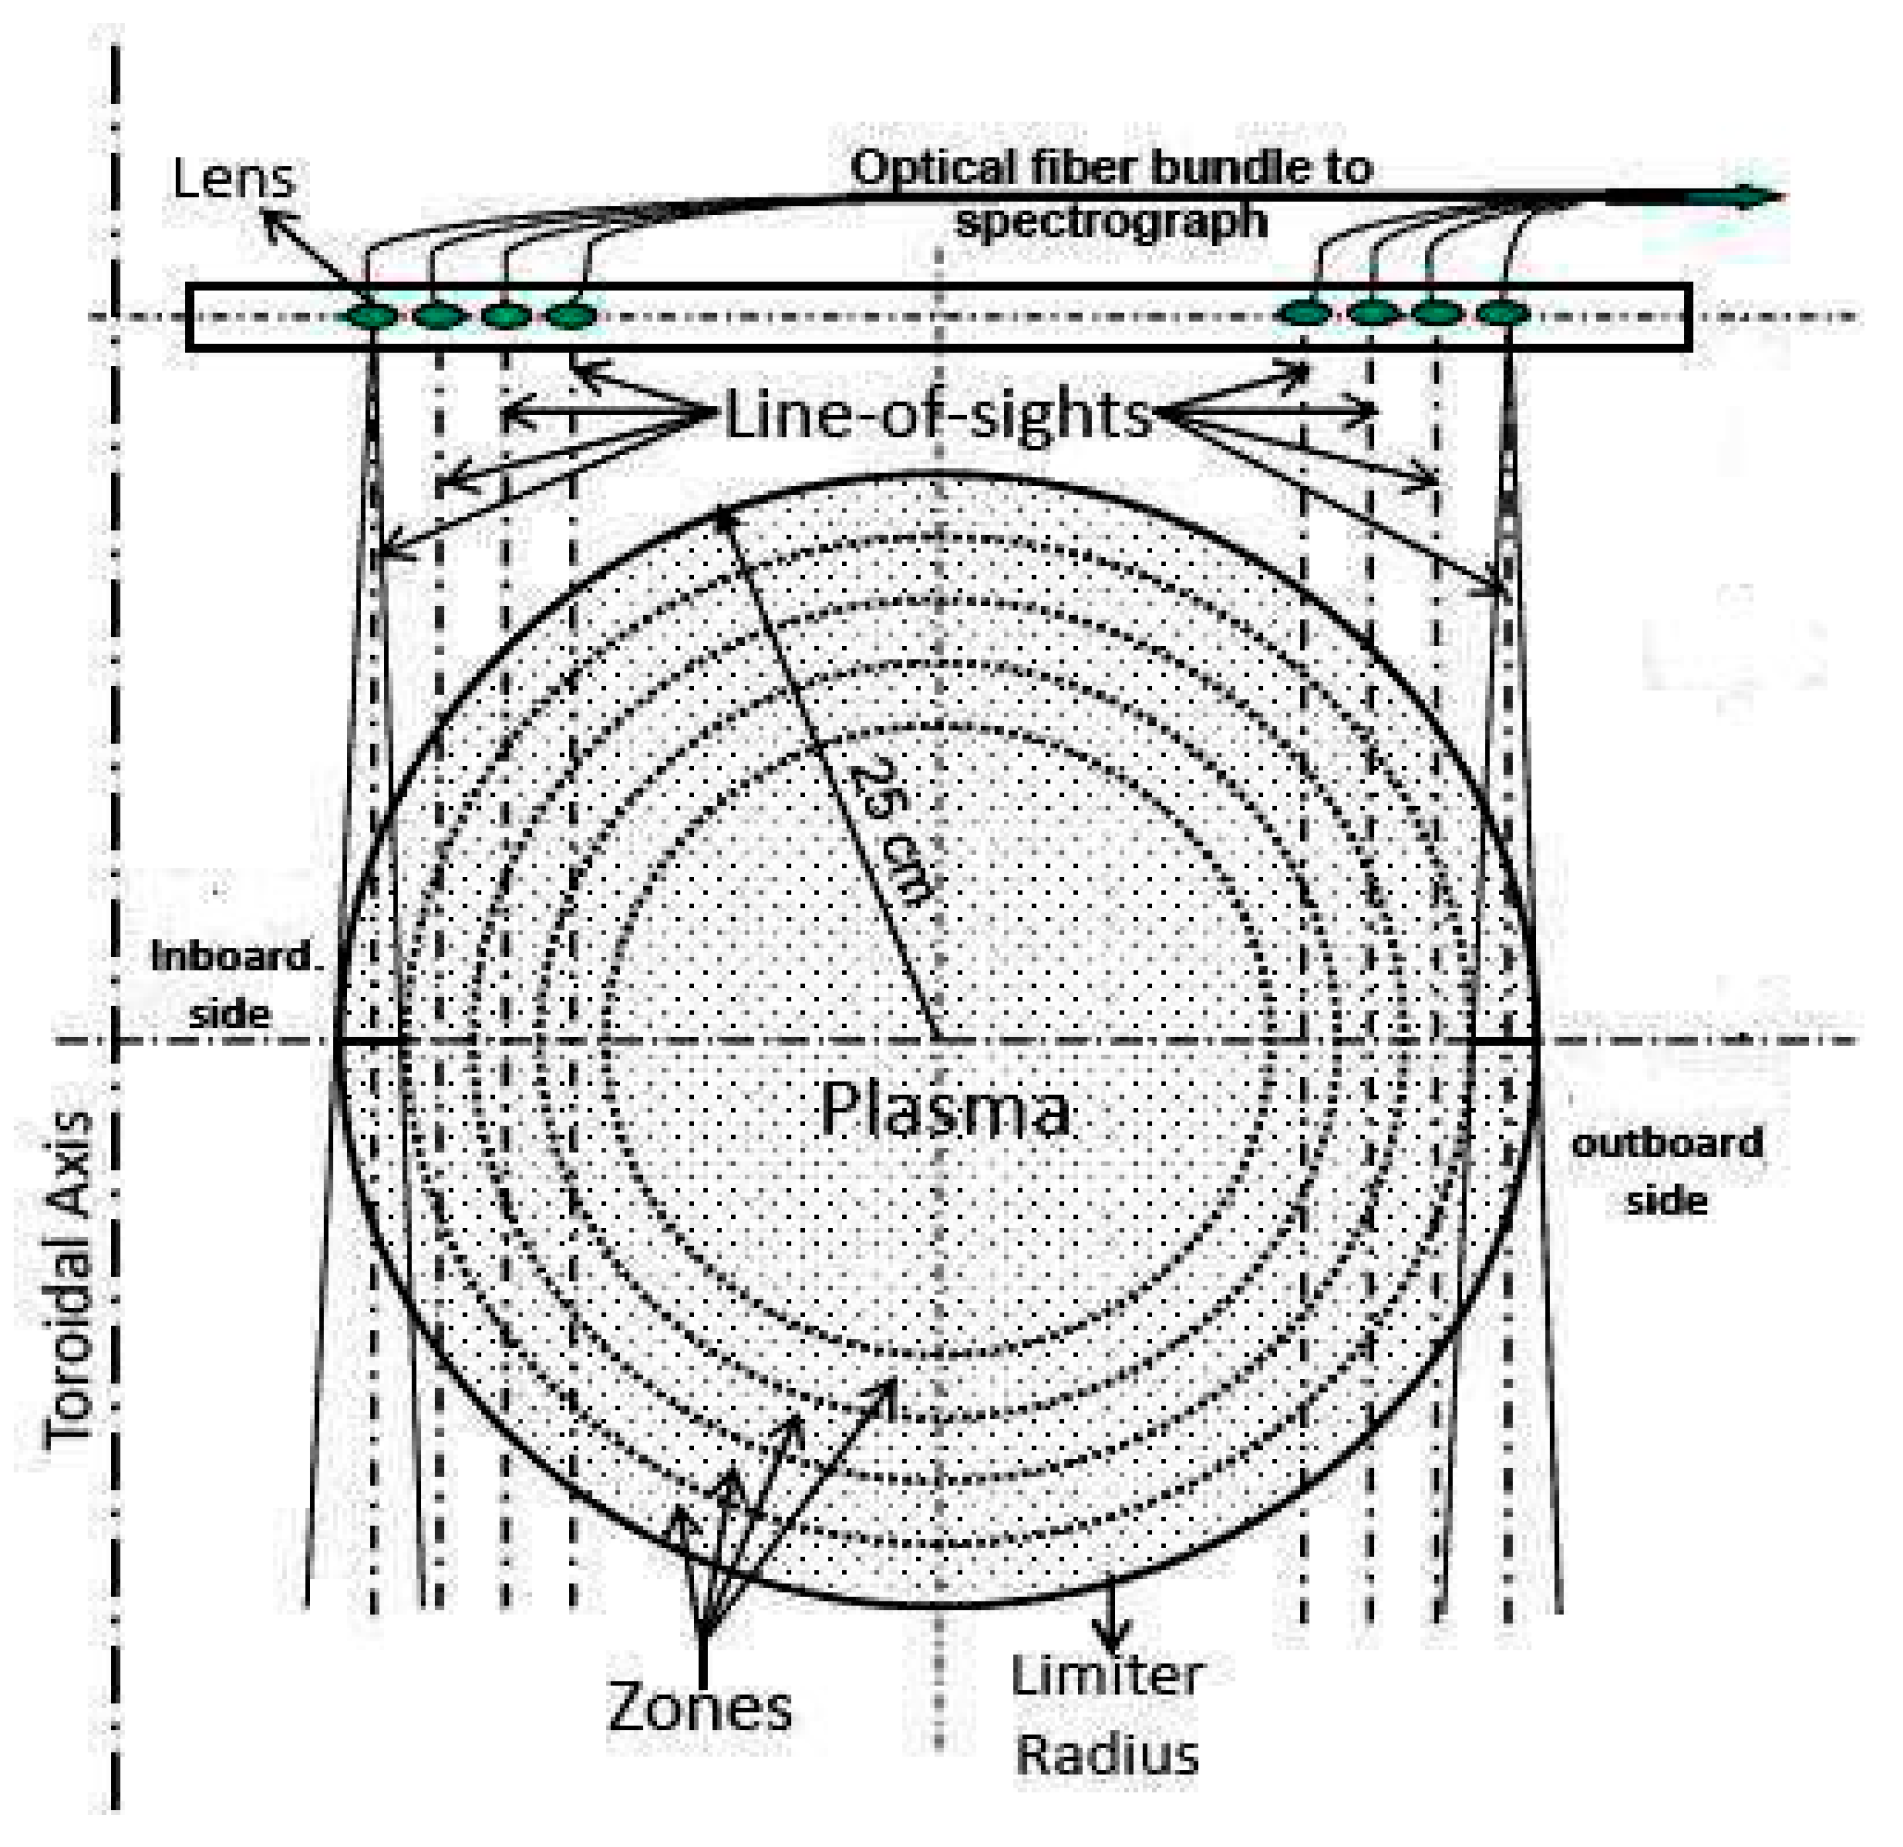
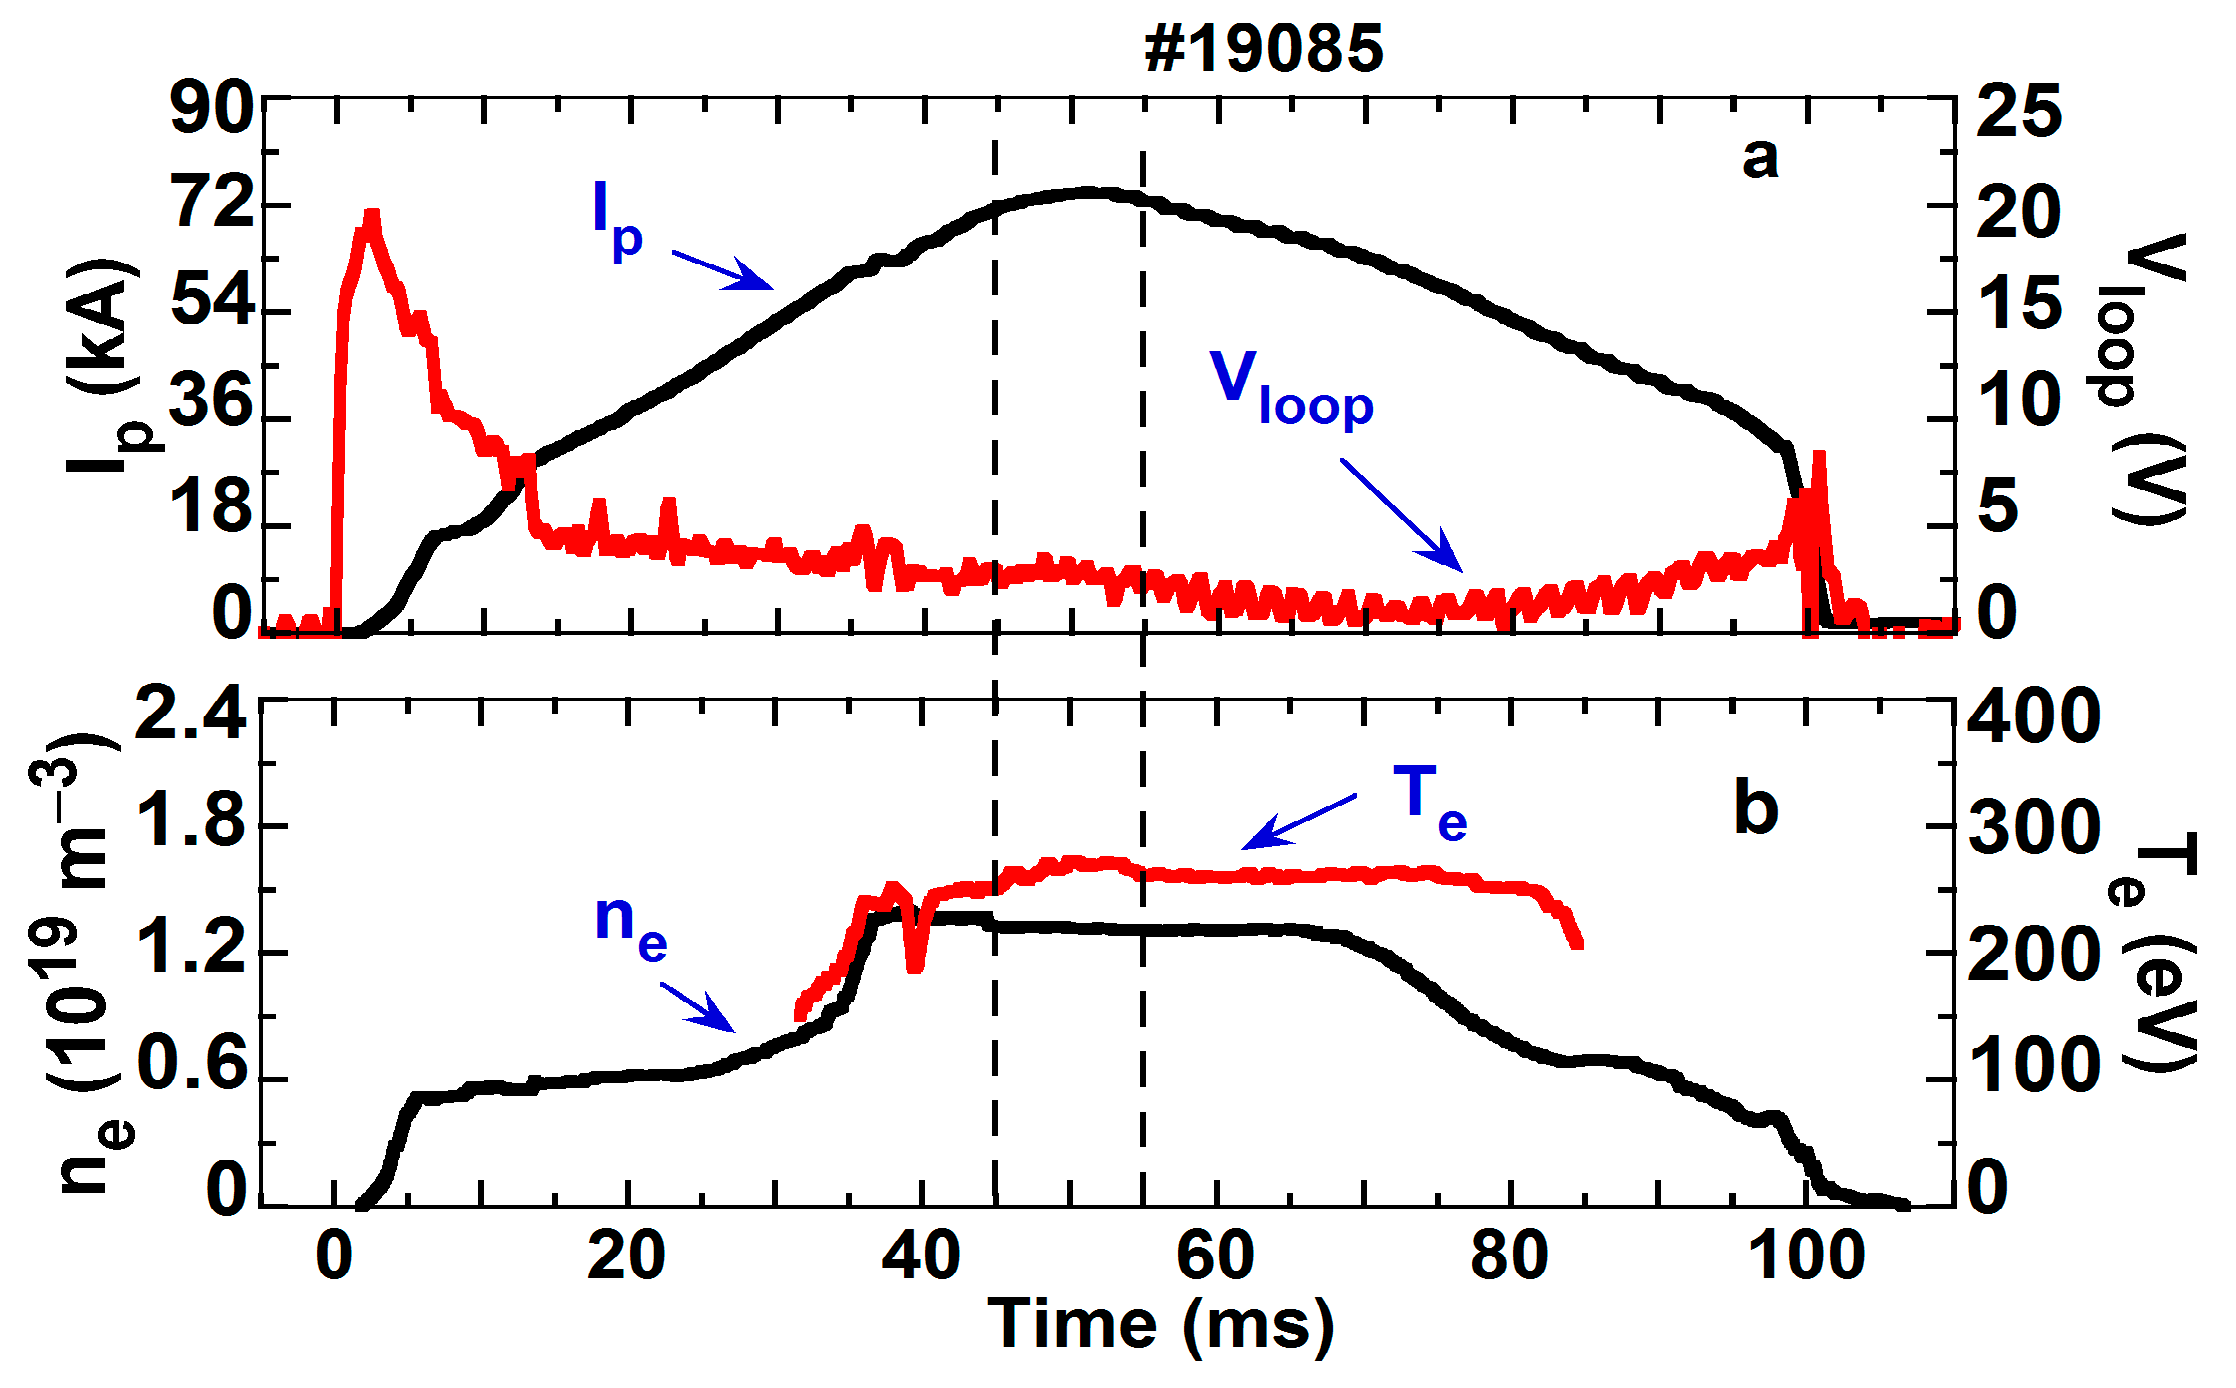
2. Experimental Setup

Aditya is a medium size tokamak, with major (R) and minor (a) radii of 0.75 m and 0.25 m respectively. It has a poloidal ring limiter made of graphite at a toroidal location. It is operated with a toroidal magnetic field, Bt, of 0.75 to 1.2 T and has a plasma current of 80 to 150 kA depending upon the operation scenario. The vacuum vessel is pre-filled with hydrogen gas at a pressure of ~1 × 10⁻⁴ mbar using a gas feed system consisting of mainly a Piezo-electric valve and a pulse generator. The central chord average plasma electron density and temperature of the plasma are in the ranges of 1 to 3.5 × 10¹⁹ m−3 and 300 to 650 eV, respectively. The electron density profile was measured by a seven-channel microwave interferometer spanning over the whole plasma cross-section [18], and the core electron temperature was measured by the absorption foil ratio technique using soft X-ray emissions monitored by a silicon surface barrier detector. The edge electron density and temperature were measured using Langmuir probes. Standard magnetic diagnostics were used to measure the plasma current, loop voltage, plasma position, and magneto-hydrodynamic (MHD) activities [12].
The spatial profile of 650.024 nm spectral line emitted by the O4+ ion was measured using a space resolved visible spectroscopic system [13]. It was equipped with a 1 m visible spectrometer with 1800 grooves/mm grating blazed at 500 nm. A charge coupled device (CCD) with 1024 × 256 pixels was placed at the focal plane on the existing port of the spectrometer to detect the spectrum. The CCD pixel size was 26 × 26 µm2 and the spectral resolution of the system in terms of full width at half maxima (FWHM) was 0.023 nm at 650 nm when operated with 50 µm entrance slit width. The entrance slit width of 250 µm was used during this experiment. A vertical array of nine fibers was attached along the entrance slit height, enabling multi-track measurement. The fiber had a core diameter (d) of 400 µm and numerical aperture (NA) of 0.22, and the gap between the fibers was 700 µm. Light was collected simultaneously from the eight vertical chords, viewed through a 2.0 cm width and 50 cm long rectangular window, which was placed on the top triangular port of the Aditya tokamak and can observe the whole plasma cross-section. The light was collected from four lines of sight, placed in both inboard (high magnetic field) and outboard (low magnetic field) sides of the plasma, as shown by the schematic diagram of viewing geometry in Figure 1. The lines of sight locations for the experimental measurements in terms of ρ were 0.53, 0.66, 0.80, and 0.93 for both high and low field sides of the plasma. The light collection optics consisted of optical fibers with d of 1 mm and NA = 0.22, and collimating lens with a diameter of 11 mm and focal length of 19 mm. As a result, a spatial resolution of 25 mm at the horizontal mid plane of the Aditya tokamak was achieved. The data were collected with an exposure time of 10 ms during the current flat top region of the Aditya plasma, and the data acquisition was triggered by the loop voltage. The spectroscopic system was absolutely calibrated for the intensity to carry out the quantitative data analysis. From the recorded spectra, the chord integrated brightness was obtained by integrating the fitted curve of the spectral line using a Gaussian profile. The radial emissivity profiles were obtained using an Abel-like matrix inversion technique [19] from the chord integrated brightness of O4+ emissions. The details of this conversion have been described in the references [15,20]. The error estimation was done by incorporating the statistical error present in the absolute calibration and the one due to the spectral line fitting using a Gaussian profile to obtain the brightness, which is the area under the curve of the spectral line profile. The uncertainties in the emissivities remain within 15%.

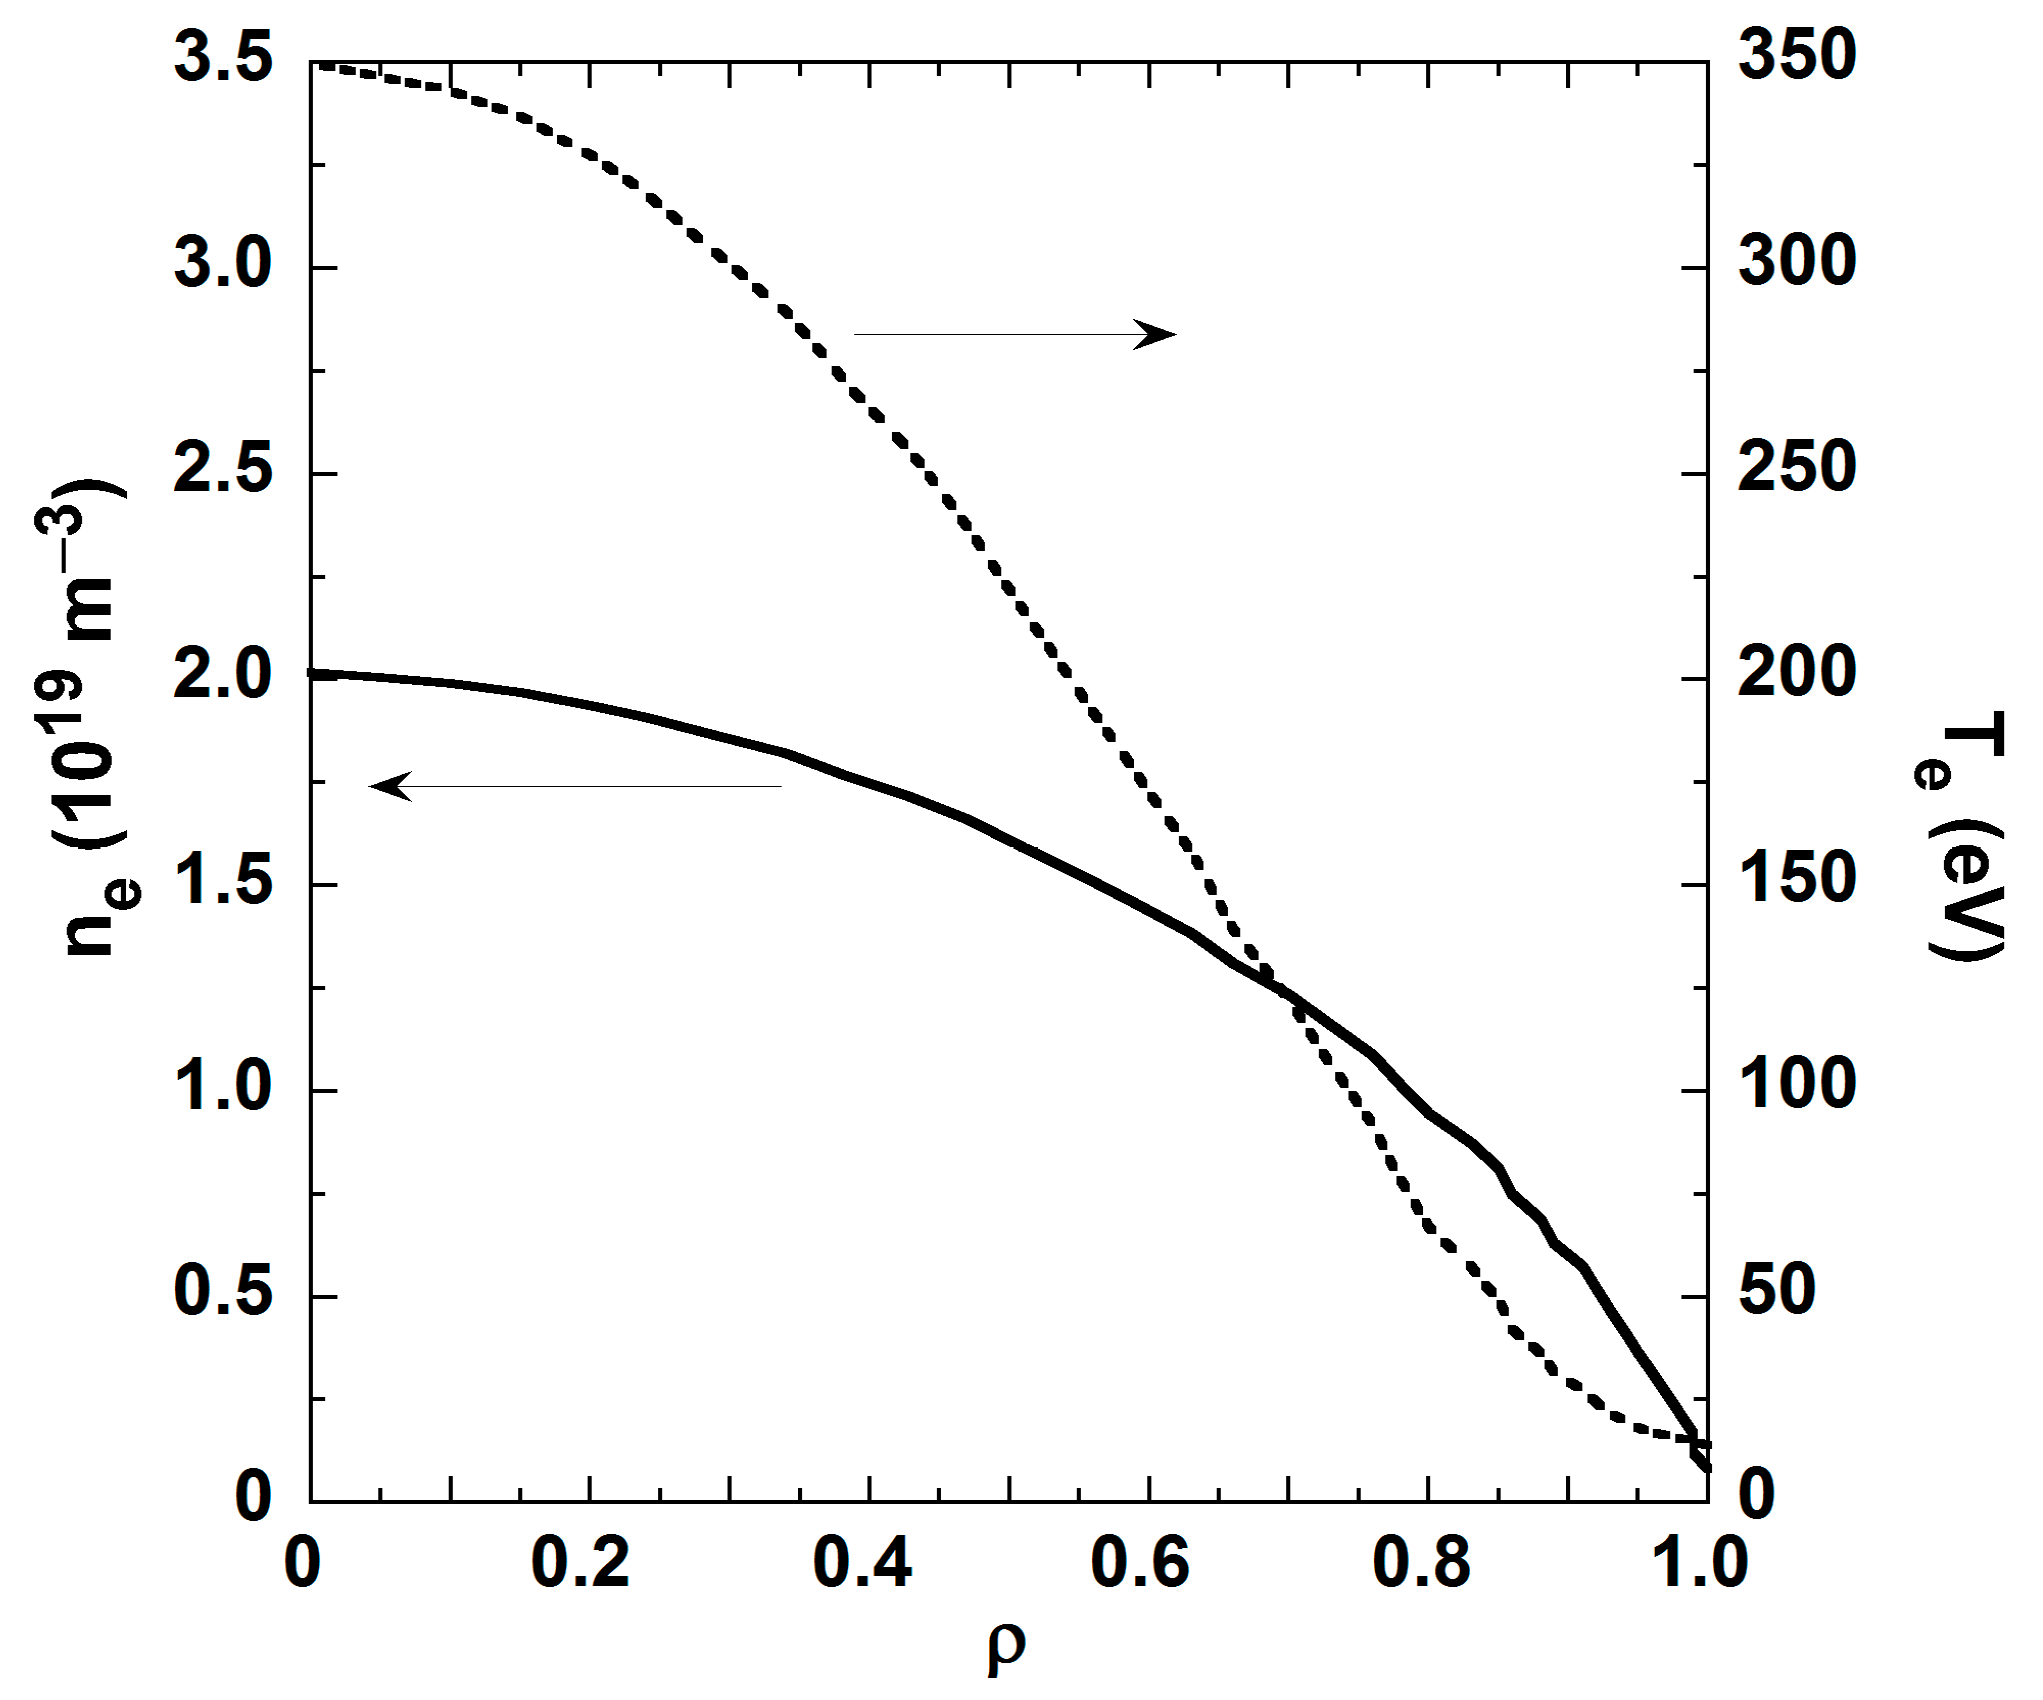
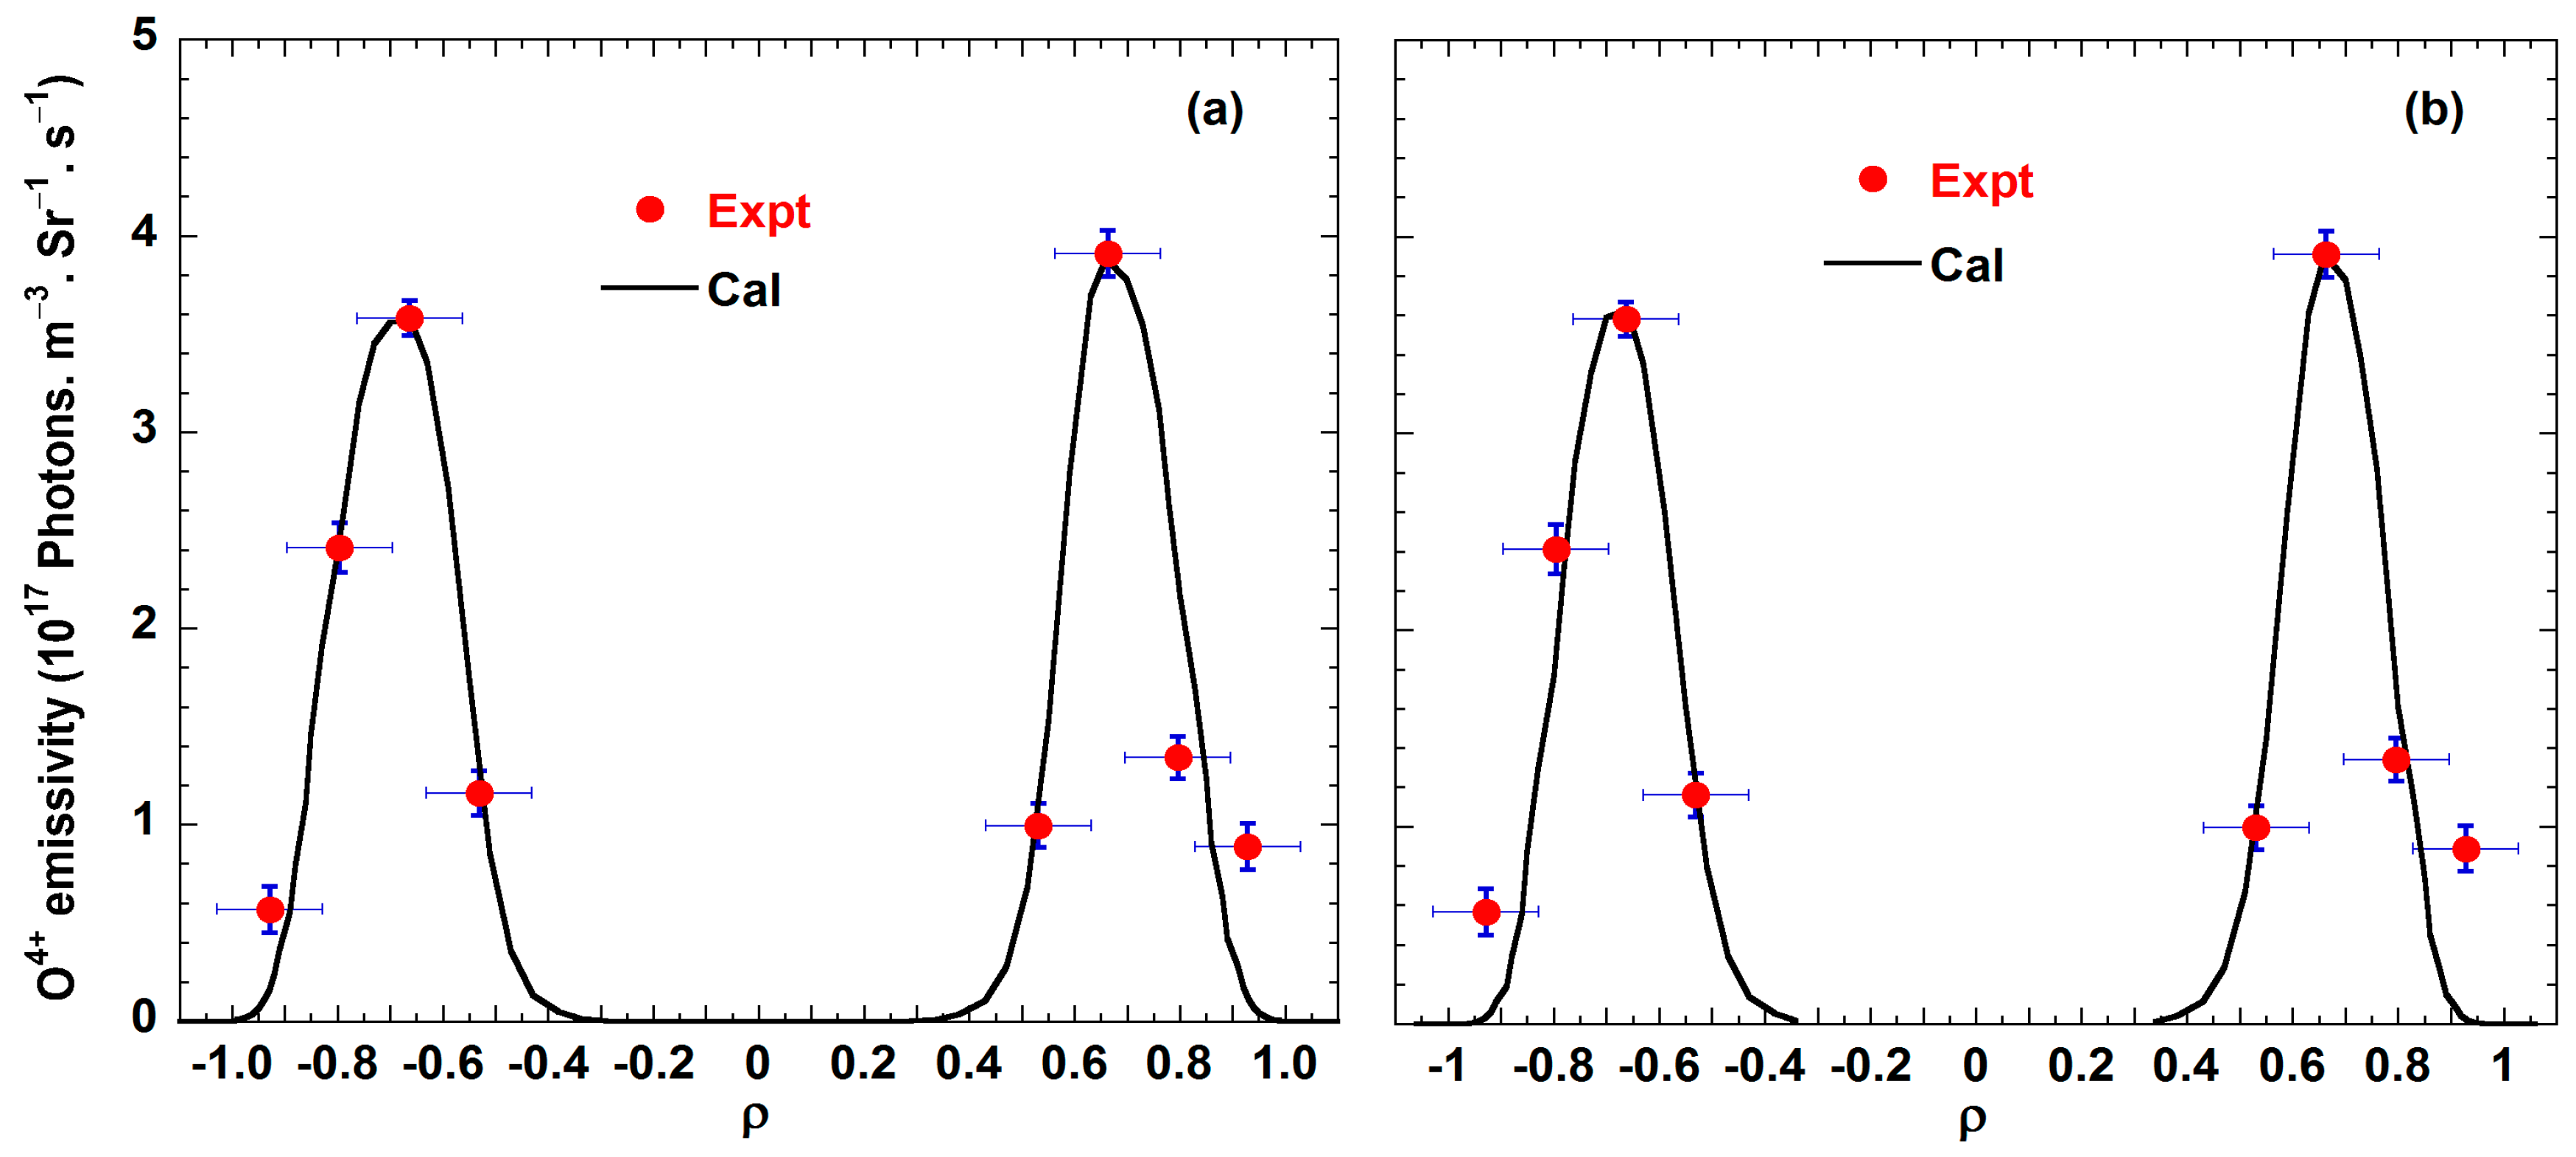
3. Modeling of the O4+ Emissivity Profile

The modeling of the radial profile of the O4+ emission was carried out using an empirical one-dimensional impurity transport code, STRAHL. This code numerically solves the radial continuity equation of each ionization stage of an impurity, and calculates the radial profile of the density of impurity ions by taking into account the tokamak magnetic field geometry, as well as the plasma electron temperature and density profiles. It also takes impurity source rate, transport coefficients (diffusion coefficient, D, and convective velocity, v), and source and sink terms as input parameters. For a charge state Z, the radial transport equation is expressed as:
n Z t = 1 r r r ( D n Z r v n Z ) + Q Z
where nZ is the impurity density, DZ is the diffusion coefficient, and vZ is the convective velocity of ionic charge Z. QZ is the source/sink term relating each ionization stage with the neighboring ionization stages of impurity ions according to:
Q Z = ( n e S Z + n e α Z + n H C Z ) n Z + n e S Z 1 n Z 1 + ( n e α Z + 1 + n H C Z + 1 ) n Z + 1
where S, α, and C are the reaction rate coefficients for ionization, recombination (radiative and di-electronic), and charge exchange, respectively. The required electron density profile is taken from the seven-channel microwave interferometer diagnostics and the radial profile was obtained from the chord integrated profile measurement using Abel inversion [21]. As the electron temperature is available only for the core and the edge regions of the plasma, its radial profile was generated using the following equation:
T e ( r ) = T e , a + ( T e , 0 T e , a ) ( 1 r 2 a 2 ) β
where Te(0) and Te(a) are the central and edge electron temperatures, respectively. The value of β was taken to be 1.75. This value of β was found to be appropriate to get the best matched Te profile for describing the observed positive and negative loop voltage spikes in similar discharges [22].
After calculating the radial profile of the density of each impurity ionization stage, the emissivity radial profile of a radiative transition from an initial state, i, to a final state, j, was calculated using following equation:
ε z , i , j ( r ) = n z , i ( r ) · n e ( r ) · PEC z , i , j ( r )
where nz and ne are, respectively, densities of the impurity ion of a particular charge state and of the electron and the PEC (photon emissivity coefficient), which is a function of both electron temperature and densities, obtained from CR modeling calculation based on the detail population balance of the excited states of an ion, carried out by considering the contributions from excitation, ionization, and recombination processes. Here, PECs from two different atomic databases were used in the modeling: Those labeled PEC1 were taken from the ADAS database [10], while those called PEC2 were provided by the NIFS code [11] (developed at the National Institute of Fusion Science (NIFS), Japan).
The emissivity radial profile of the spectral line at 650.024 nm of O4+ ion was obtained using a space-resolved visible spectroscopy system during current flat top region of the Aditya tokamak plasma. The temporal evolution of the plasma current (Ip), loop voltage (Vloop), central chord average electron density (ne), and core plasma electron temperature (Te) of the analyzed discharge are shown in Figure 2. The data acquired with a CCD exposure time of 10 ms was started at 45 ms of plasma discharge, and this time section is marked by two vertical lines in the figure. One can see from the figure that all major parameters were mostly constant during the time segment of the emissivity profile measurement. Figure 3 shows the ne and Te profiles with respect to normalized plasma radius, ρ = r/a, where a is the plasma minor radius of the analyzed plasma. The values of core electron density and temperature are, respectively, 2.02 × 10¹⁹ m−3 and 350 eV. The Ohmic input power was ~180 kW and no auxiliary heating was used in this discharge. It should be noted that the option of calculating the neo-classical impurity transport was kept switched off in the code calculation.
The experimental and best-fit-matched simulated radial profiles of O4+ emissivity are shown in Figure 4. The experimental emissivity radial profiles in the low (outboard) and high field (inboard) sides are represented by circles, and the horizontal error bar in the experimental data represents the observation chord width at the horizontal mid plane of the tokamak. The peak emissivity is slightly higher in the high field side but the peaks lie around ρ = 0.64 on both sides of the plasma. Experimental profiles from both the high and low field sides were matched with simulated profiles by varying the diffusion coefficient and impurity source rate. For modeling purposes, at first the experimental profile of the low field side was matched with a diffusion coefficient profile, and then STRAHL code was again run to obtain best-fit for the high field side separately, as discussed in details in the paper by Chowdhuri et al. [17]. The simulated best-fit emissivity profiles obtained using code in both the low and high field sides of the Aditya tokamak plasma to the measured profiles are represented by a line in the figure. Here, Figure 4a,b illustrates the modeling of the experimental data using STRAHL, where PEC values are taken from the ADAS database and from the NIFS code, respectively. The convective velocity term was kept zero in the code calculation. However, it was found that the results do not change much by including the convective term. In the previous study on the Alcator-C tokamak, a similar outcome regarding inward convention was mentioned [4]. In both cases, almost similar percentages of oxygen concentration ~2% of ne were needed to match the experimental data.
The obtained diffusion coefficient profiles for both the low (outboard) and high (inboard) field sides are shown in Figure 5. Here, the red dashed line represents the obtained diffusion profile when calculated with STRAHL and PEC data (PEC1) from ADAS, and the blue solid line refers to the calculation using STRAHL and PEC data (PEC2) from NIFS code. One can see that although the diffusion coefficient profiles remain almost similar in nature in both cases, the magnitudes of D differ very much. The modeling with PEC2 requires a lower D to get the best-fit between calculated and experimental emissivity profiles as compared to the modeling results with the equivalent PEC values, PEC1. In the low field side of the plasma edge, the peak value of D becomes ~45 m2·s−1 when modeling is done with PEC1 than that of ~25 m2·s−1 in the case of PEC2. Similarly, lower value of D with reduced magnitude is also found in the high field side with PEC2 as compared to that with PEC1. This higher value of D compared to the calculated one by neo-classical transport theory is explained using the fluctuation induced transport. It was found that the transport driven by the ion temperature gradient (ITG) and dissipative trapped electron (DTE) modes was good enough to explain the diffusivity in the high field side, and the further higher value of diffusivity in the low field side was explained by using the combination of ITG and resistive ballooning modes (RB) [15]. The error bars in D represent the modification of the required diffusion coefficients to get the best-fit between experimental and calculated emissivity profiles due to the charge in the Te profile peaking factor. This sensitivity study of D with different temperature profiles was carried out since there were measurement limitations in obtaining the complete radial profiles of the temperature. For this purpose, modeling was done with different temperature profiles with varying profile peaking factor, β (see Equation (3)), from 1.5 to 2.0 and the change in D is shown in terms of error bar for the best matched condition.

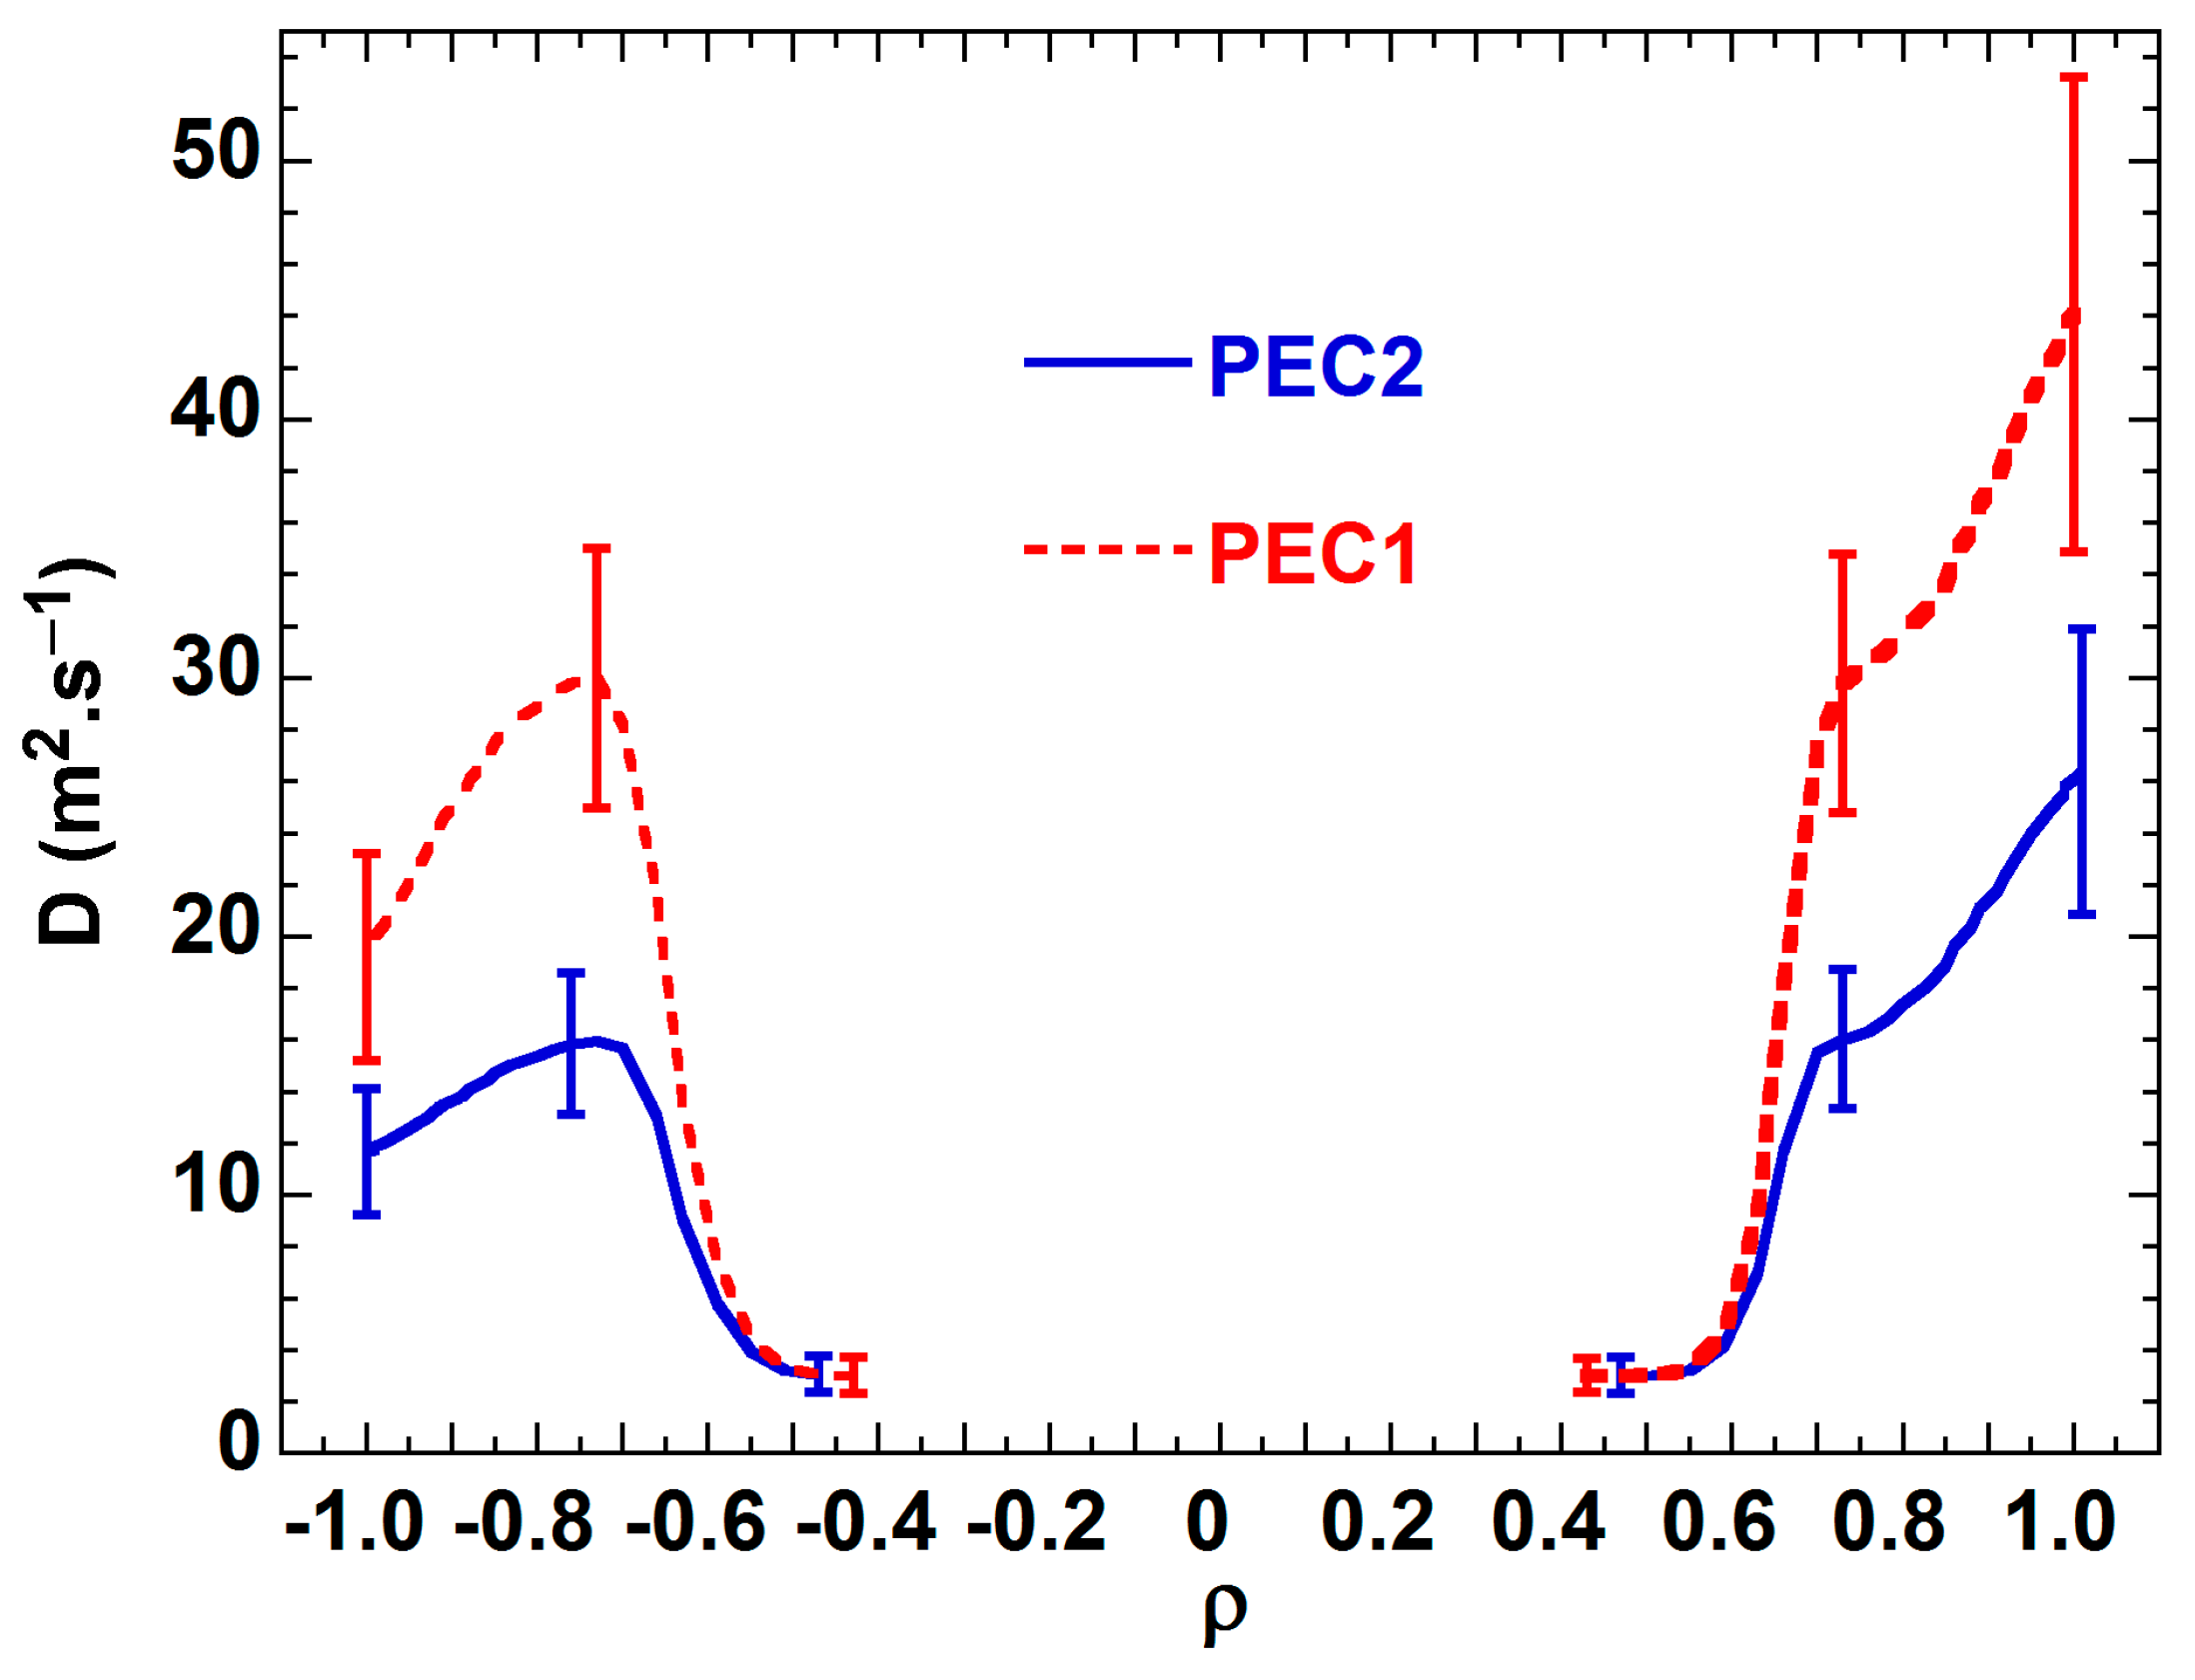
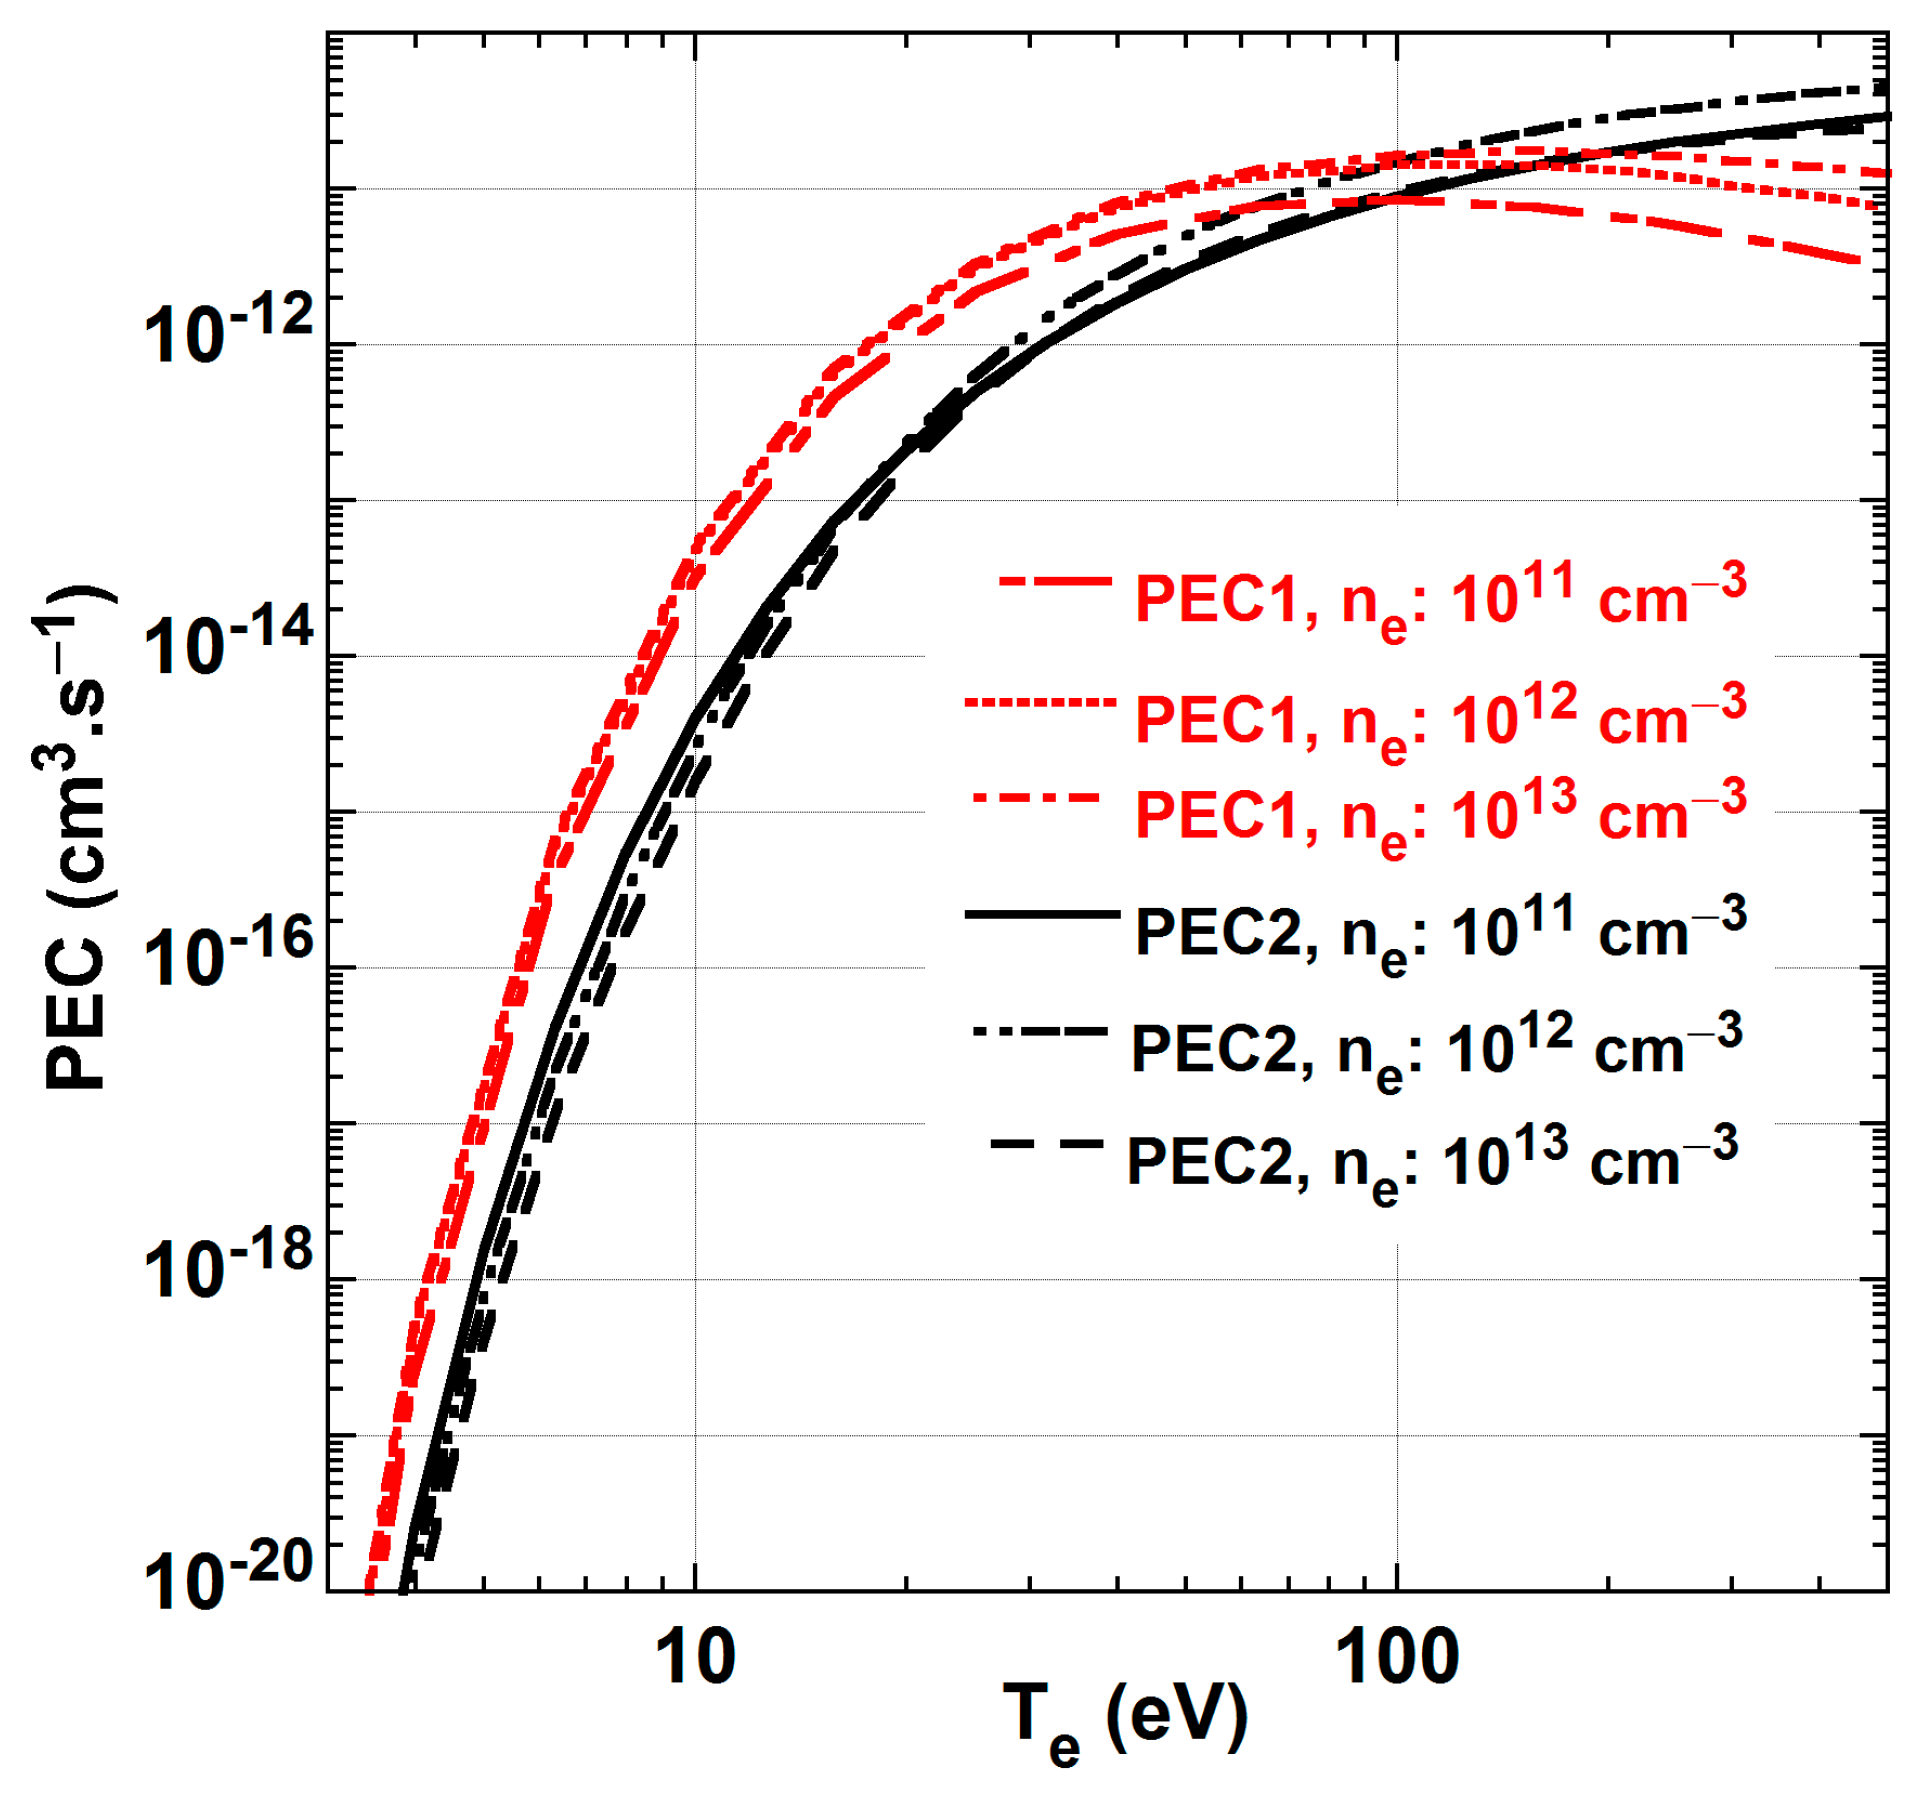
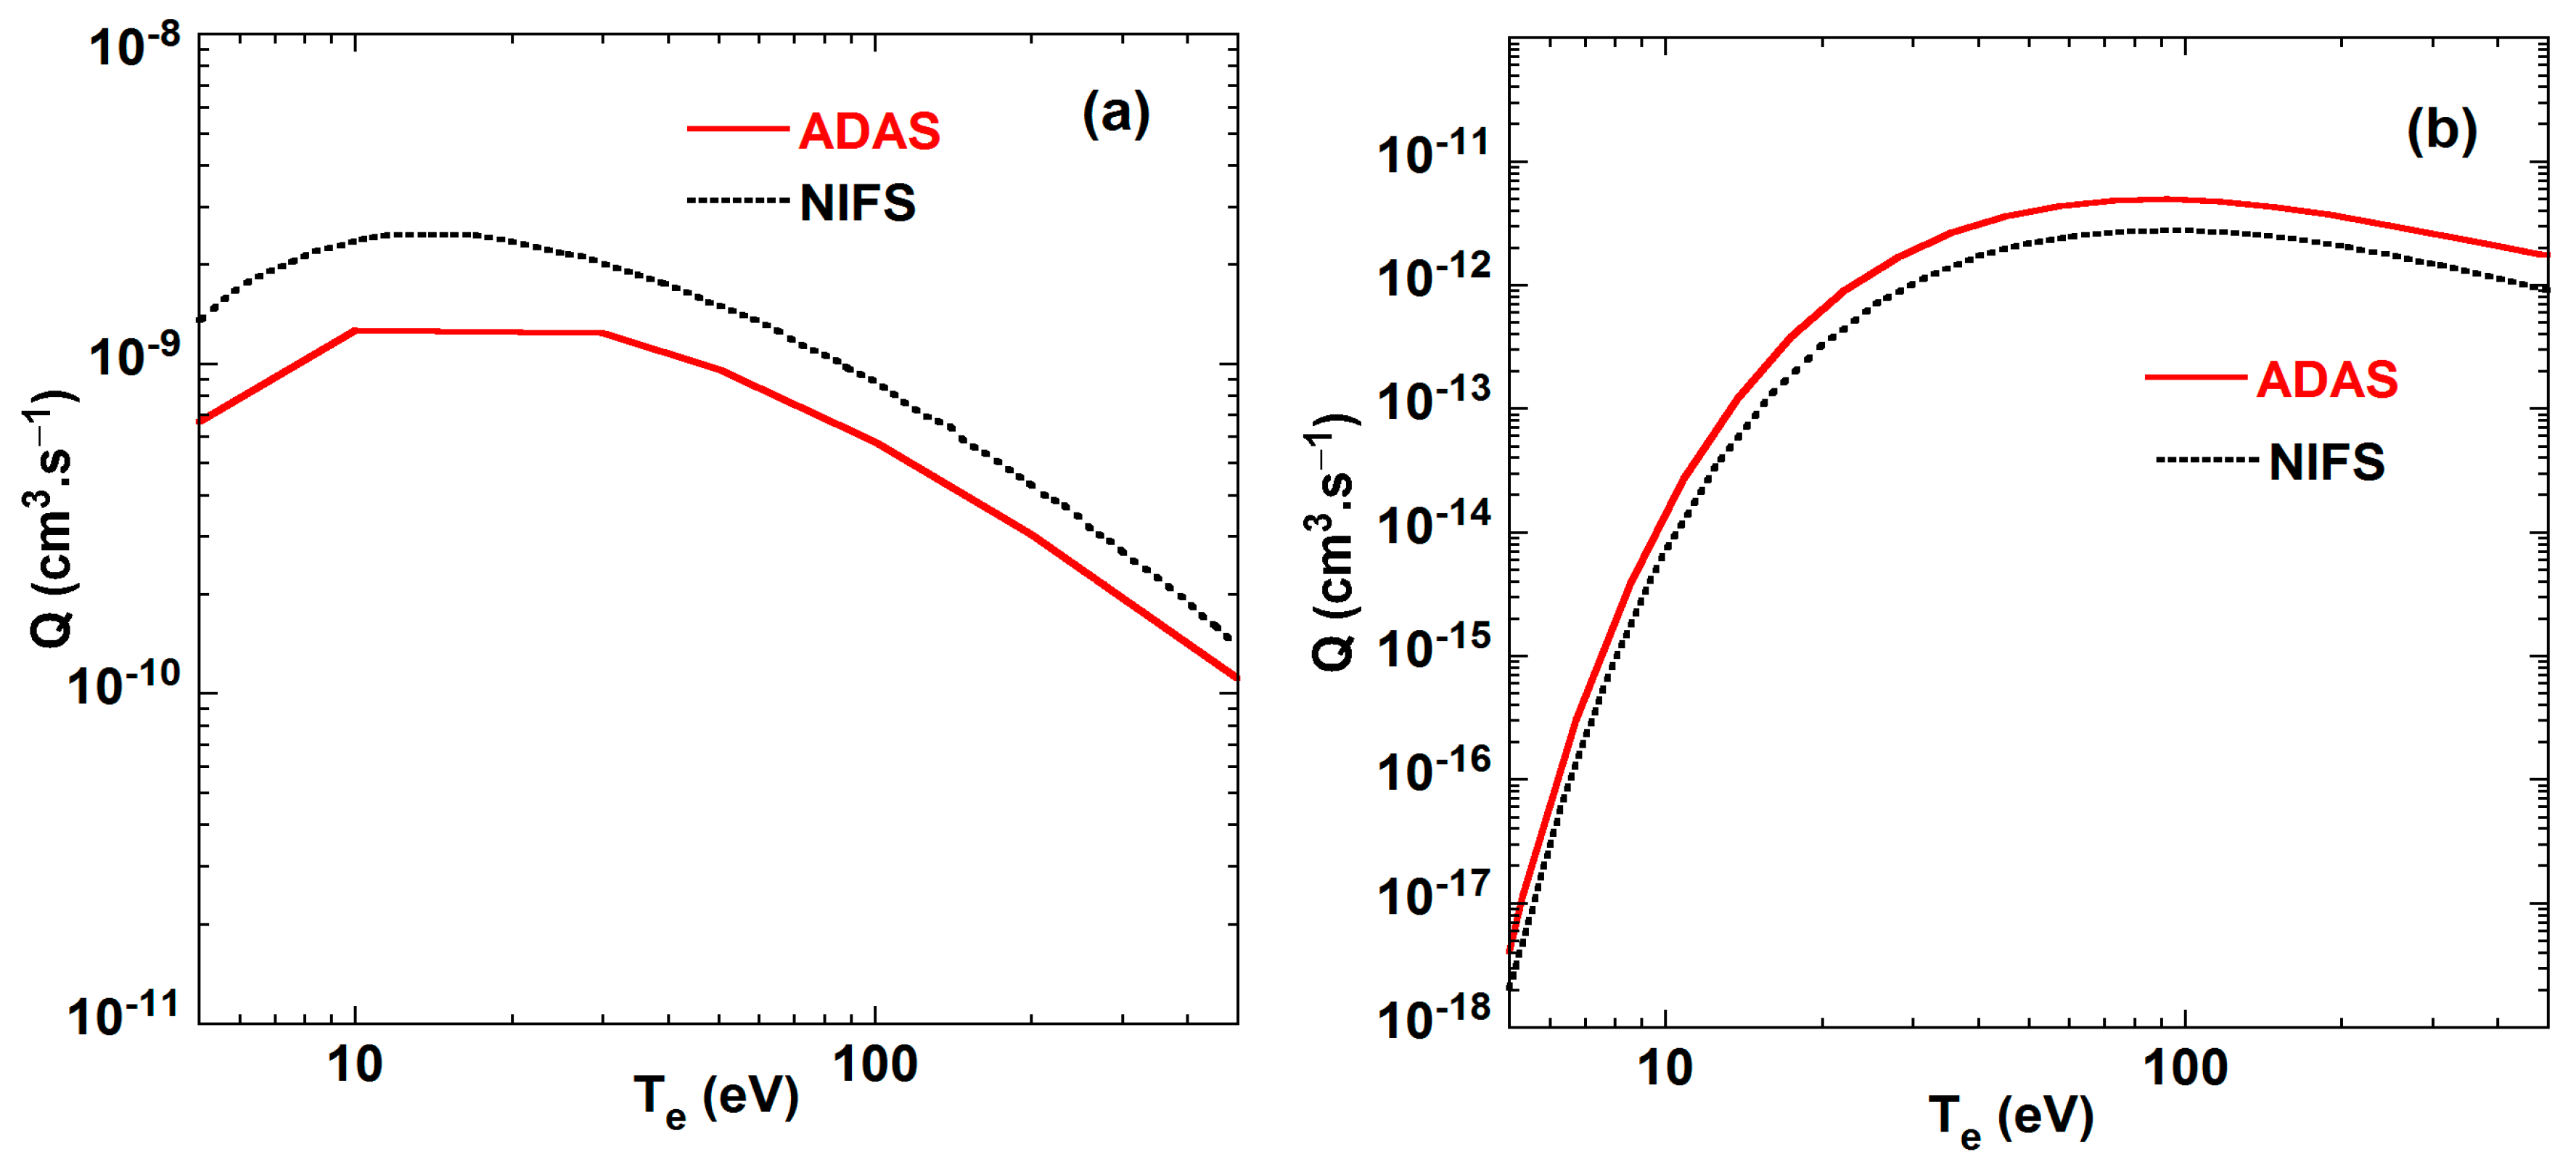
4. Discussions on the Atomic Data towards the Difference in Diffusion Coefficients

The diffusion coefficients obtained using PEC (PEC1) data for the transition of 2p3p 3D3-2p3d 3F4 from the ADAS database are larger as compared to those obtained using PEC data from NIFS (i.e., PEC2). Ideally the transport analysis should be independent of the atomic processes, and the atomic data involved in the source and sink term used in the continuity equation (Equation (2)), and also in the equation of emissivity calculation (Equation (4)). However, due to the complexity involved in the atomic data generation and calculation of CR modeling, the atomic data used in the transport analysis differ very much. This is again mostly true for the processes involved with higher excited states of low Z material and for the complex configuration with higher atomic number. The observed emission of O4+ at 650.024 nm in visible region belongs to a ∆n = 0 transition connecting the ionic emitter lower and upper energy levels, which are 2p3p 3D3 and 2p3d 3F4, respectively. Then, it can be seen that the difference in the diffusion coefficient mainly arises due to the differences of the PEC values from the two databases, as shown in Figure 6. At lower Te values, the NIFS PECs values are lower than those provided by the ADAS database. As for example, the ratio of PEC1 to PEC2 is almost five at the Te of 30 eV. As a consequence, a lower value of the diffusion coefficient was found when using PEC2 to get the best-fit solution. The reason can be attributed to the difference in the basic atomic data, like ionization, recombination, and excitation rates, which are used by the CR model calculation. Note also that there might be differences in the inclusion of various transitions in the codes. For instance, ADAS data do not include the forbidden transition between ground state 2s2 1S0 and the upper state 2p3d 3F4. Note that this transition is forbidden in the frame work of the electrical dipole approximation and is only of importance for radiation—and then does not see any spectral line having transition 2p3d 3F4-2s2 1S0. In the ADAS case, the main excitation pathway to this upper state is likely a two-step process, i.e., the ground state electron jumps to, at first, many other low-lying levels, such as the 2s2p, then finally to the 2p3d level. In case of the NIFS CRM code, both the direct electron impact excitation from the ground state to the 2p3d level and the indirect two steps excitation process from the ground state to the 2p3d level through the 2s2p one can contribute to populating that level. The excitation rate coefficients for 2s2 1S0 → 2s2p 3P2 and 2s2 1S0 → 2p3d 3F4 transitions for both ADAS and NIFS data are plotted in Figure 7a,b, respectively. It can be seen from Figure 7b that there are not too many differences in the excitation rate coefficients corresponding to the forbidden transition of 2s2 1S0 → 2p3d 3F4 between the ADAS [23] and NIFS data [24]. Note that the rate coefficient values are almost three orders of magnitude lower than the excitation rate coefficients of 2s2 1S0 → 2s2p 3P2 transition for both ADAS and NIFS data, as shown in Figure 7a. Then, the direct contribution to the population of the upper level 2p3d 3F4 from 2s2 1S0 → 2p3d 3F4 transition seems to be lower as compared to the contribution from the two-step process. It is usually seen that in the calculation of PEC values through the CR model, the importance of direct excitation, followed by immediate radiative decay to any lower level, is mostly observed at low electron densities [25]. In addition to that, as shown in Figure 7a, the excitation rate coefficient for the ground state to 2s2p 3P2 is fairly different between the cases (the ADAS and NIFS data) at the lower electron temperature. These differences in atomic data and processes make the PEC values different at the low temperature region between ADAS and NIFS codes. This might be the probable reason behind getting a lower diffusion coefficient when the calculation is done using NIFS data as compared to the ADAS data.

5. Conclusions

Oxygen impurity transport in the Aditya tokamak was studied using the emissivity radial profile of the 650.024 nm visible spectral line due to the radiative transition 2p3p 3D3-2p3d 3F4 emitted by Be-like oxygen ions. The brightness spatial profile has been recorded from eight lines of sight passing through the plasma using a spatially-resolved visible spectroscopic system. The emissivity radial profile was obtained using an Abel-like matrix inversion. The radial profiles from both low and high field sides of the plasma were simultaneously measured and also modeled using the STRAHL impurity transport code. For calculation purposes, the required photon emissivity coefficients (PEC) were taken from two separate databases, ADAS and NIFS. It was found that the experimental emissivity profiles of both the low and high field sides could be best-fitted using an almost similar profile of diffusion coefficients by using PECs from both databases. However, the values of diffusion coefficients differ in magnitude. It was observed that when the calculation is done using ADAS data, the diffusion coefficient profile of the high field region has a peak around the normalized plasma radius ρ = 0.73 with a maximum value of 30.0 m2·s−1, then it gradually decays further outsides of the plasma, but at low field region, its value gradually rises to the plasma edge, reaching a maximum value 50 m2·s−1. The obtained diffusion coefficients have lower values when the calculation is done using NIFS data. The maximum values of the diffusion coefficients in the plasma edges at the low field side of the tokamak are ~45 and ~25 m2·s−1 when modeling is done using the ADAS and NIFS databases, respectively. Further analysis of the atomic data used in CR modeling to obtain PEC values reveals that the difference in the diffusion coefficient is mainly due to the variation in PECs at low temperature regions. The differences in the PEC values are attributed to the dissimilarity in the excitation rate coefficient used in the two codes.

Author Contributions

Conceptualization, M.B.C. and J.G.; methodology, M.B.C.; atomic data, I.M., R.D., S.P. and A.B.; formal analysis, M.B.C.; writing, M.B.C. and J.G.; experiment, M.B.C., J.G., R.M., N.Y., S.P., and the Aditya Team.

Funding

This research received no external funding.

Conflicts of Interest

The authors declare no conflicts of interest.

References

  1. Isler, R.C. Impurities in tokamaks. Nucl. Fusion 1984, 4, 1599–1678. [Google Scholar] [CrossRef]
  2. Greenwald, M. Density limits in toroidal plasmas. Plasma Phys. Control. Fusion 2002, 44, R27–R80. [Google Scholar] [CrossRef]
  3. Morozova, D.K.; Mavrina, A.A. Operation of a tokamak reactor in the radiative improved mode. JETP Lett. 2016, 103, 298–301. [Google Scholar] [CrossRef]
  4. Moreno, J.C.; Marmar, E.S. Impurity-density calculations from spectroscopic measurements of visible and uv line emission on Alcator-C tokamak. Phys. Rev. A 1985, 31, 3291–3298. [Google Scholar] [CrossRef] [PubMed]
  5. Dux, R. Chapter 11: Impurity transport in Asdex Upgrade. Fusion Sci. Technol. 2003, 44, 708–715. [Google Scholar] [CrossRef]
  6. Chowdhuri, M.B.; Morita, S.; Goto, M. Behaviour of CIII to CVI emissions during the recombining phase of LHD Plasmas. Plasma Fusion Res. 2008, 3, S1043. [Google Scholar] [CrossRef]
  7. Goto, M. Collisional-radiative model for neutral helium in plasma revisited. J. Quant. Spectrosc. Radiat. Transf. 2003, 76, 331–344. [Google Scholar] [CrossRef]
  8. Huang, L.K.; Lippmann, S.; Stratton, B.C.; Moos, H. Experimental determination of line-intensity ratios for the n = 3 to n = 2 transitions of O v, F vi, and Ne vii at electron densities in a range of (4–9) × 1012 cm−3. Phys. Rev. A 1988, 37, 3927–3934. [Google Scholar] [CrossRef]
  9. Lippmann, S.I.; Fournier, K.B.; Osterheld, A.L.; Goldstein, W.H. Observation of O V visible transitions in a tokamak diverter plasma. Phys. Rev. E 1988, 37, 5139–5142. [Google Scholar]
  10. Summers, H.P. The ADAS User Manual Version 2.6. 2004. Available online: http://adas.phys.strath.ac.uk (accessed on 4 December 2014).
  11. Murakami, I.; Kato, T.; Safronova, U.I.; Kobuchi, T.; Goto, M.; Morita, S. Properties of O V spectral lines in ionizing and recombining plasmas. J. Plasma Fusion Res. Ser. 2002, 5, 171–174. [Google Scholar]
  12. Tanna, R.L.; Ghosh, J.; Chattopadhyay, P.K.; Harshita, R.; Patel, S.; Dhyani, P.; Gupta, C.N.; Jadeja, K.A.; Patel, K.M.; Bhatt, S.B.; et al. Overview of recent experimental results from the ADITYA tokamak. Nucl. Fusion 2017, 57, 102008. [Google Scholar] [CrossRef]
  13. Banerjee, S.; Kumar, V.; Chowdhuri, M.B.; Ghosh, J.; Manchanda, R.; Patel, K.M.; Vasu, P. Space- and time-resolved visible-emission spectroscopy of Aditya-tokamak discharges using multi-track spectrometer. Meas. Sci. Technol. 2008, 19, 045603. [Google Scholar] [CrossRef]
  14. Dux, R. Impurity Transport in Tokamak Plasmas; IPP Report, IPP10/27; Max-Planck-Institut fur Plasmaphysik: Garching, Germany, 2005. [Google Scholar]
  15. Chowdhuri, M.B.; Ghosh, J.; Banerjee, S.; Dey, R.; Manchanda, R.; Kumar, V.; Vasu, P.; Patel, K.M.; Atrey, P.K.; Joisa, Y.S.; et al. Investigation of oxygen impurity transport using the O4+ visible spectral line in the ADITYA tokamak. Nucl. Fusion 2013, 53, 023006. [Google Scholar] [CrossRef]
  16. Bhattacharya, A.; Munshi, P.; Ghosh, J.; Chowdhuri, M.B. A Study of the von Neumann stability analysis of semi-implicit numerical method applied over the radial impurity transport equation in tokamak plasma. J. Fusion Energy 2018, 3, 211–237. [Google Scholar] [CrossRef]
  17. Bhattacharya, A.; Ghosh, J.; Chowdhuri, M.B.; Munshi, P.; Murakami, I.; the ADITYA Team. A study of the O4+ emissivity profiles with two separate photon emissivity coefficient databases and a comparison of the impurity diffusion coefficients in the Aditya tokamak. Plasma Fusion Res. 2019. submitted for publication. [Google Scholar]
  18. Atrey, P.K.; Pujara, D.; Mukherjee, S.; Tanna, R.L. Design, development, and operation of seven Channels’ 100-GHz interferometer for plasma density measurement. IEEE Trans. Plasma Sci. 2019, 47, 1316–1321. [Google Scholar] [CrossRef]
  19. Ghosh, J.; Elton, R.C.; Griem, H.R.; Case, A.; DeSilva, A.W.; Ellis, R.F.; Hassam, A.; Lunsford, R.; Teodorescu, C. Radially resolved measurements of plasma rotation and flow-velocity shear in the Maryland Centrifugal Experiment. Phys. Plasmas 2006, 13, 022503. [Google Scholar] [CrossRef]
  20. Banerjee, S.; Ghosh, J.; Manchanda, R.; Dey, R.; Ramasubramanian, N.; Chowdhuri, M.B.; Patel, K.M.; Kumar, V.; Vasu, P.; Chattopadhyay, P.K.; et al. Observations of Hα emission profiles in ADITYA tokamak. J. Plasma Fusion Res. Ser. 2010, 9, 29–32. [Google Scholar]
  21. Paradkar, B.; Ghosh, J.; Chattopadhyay, P.K.; Tanna, R.L.; Raju, D.; Bhatt, S.B.; Rao, C.V.S.; Joisa, Y.S.; Banerjee, S.; Manchanda, R.; et al. Runaway-loss induced negative and positive loop voltage spikes in the ADITYA tokamak. Phys. Plasma 2010, 17, 092504. [Google Scholar] [CrossRef]
  22. Joshi, N.Y.; Atrey, P.K.; Pathak, S.K. Abel inversion of asymmetric plasma density profile at ADITYA tokamak. J. Phys. Conf. Ser. 2010, 208, 012129. [Google Scholar] [CrossRef]
  23. Berrington, K.E. A review of electron impact excitation data for the beryllium isoelectronic sequence (Z = 4 to 28). At. Data Nucl. Data Tables 1994, 57, 71–95. [Google Scholar] [CrossRef]
  24. Kato, T.; Lang, J.; Berrington, K.E. Intensity ratios of emission lines from O V ions for temperature and density diagnostics, and recommended excitation rate coefficients. At. Data Nucl. Data Tables 1990, 44, 133–187. [Google Scholar] [CrossRef]
  25. Summers, H.P.; Badnell, N.R.; Whiteford, A.D.; O’Mullane, M.; Bingham, R.; Kellett, B.J.; Lang, J.; Behringer, K.H.; Fantz, U.; Kastrow, S.D.; et al. Atomic data for modelling fusion and astrophysical plasmas. Plasma Phys. Control. Fusion 2002, 44, B323–B338. [Google Scholar] [CrossRef]
Figure 1. Schematic for viewing geometry used for a space-resolved visible spectroscopic system.
Atoms 07 00090 g001
Figure 2. Temporal evolution of (a) plasma current (Ip) and loop voltage (Vloop), and (b) electron density (ne) and core electron temperature (Te) of an Aditya tokamak plasma. Spectroscopy data acquired during time segment are within the two vertical bars.
Atoms 07 00090 g002
Figure 3. Radial profile of ne and Te used for the calculation using transport code.
Atoms 07 00090 g003
Figure 4. Calculated (line) and experimental emissivity (circle) plotted with normalized radius (ρ) for both high (-ve ρ) and low (+ve ρ) field sides; when calculation done with (a) PEC1 and (b) PEC2.
Atoms 07 00090 g004
Figure 5. Radial profiles of diffusion coefficient using PEC1 and PEC2 for both the high (inboard) and low (outboard) field sides of plasma. Error bars represent dependence of the magnitude of diffusion coefficient on different Te profiles.
Atoms 07 00090 g005
Figure 6. Photon emission coefficient (PEC) from ADAS (PEC1) and NIFS (PEC2) databases plotted with Te for different ne values.
Atoms 07 00090 g006
Figure 7. Excitation rate coefficient, Q, for (a) 2s2 1S0 → 2s2p 3P2 and (b) 2s2 1S0 → 2p3d 3F4 transition plotted with electron temperature, Te.
Atoms 07 00090 g007

