Article

Poloidal Rotation and Edge Ion Temperature Measurements Using Spectroscopy Diagnostic on Aditya-U Tokamak

1
Pandit Deendayal Petroleum University, Raisan, Gandhinagar 382 421, India
2
Institute for Plasma Research, Bhat, Gandhinagar 382 428, India
3
The National Institute of Engineering, Mysuru 570 008, India
*
Author to whom correspondence should be addressed.
Atoms 2019, 7(3), 93; https://doi.org/10.3390/atoms7030093
Submission received: 30 June 2019 / Revised: 7 September 2019 / Accepted: 16 September 2019 / Published: 19 September 2019
(This article belongs to the Special Issue Plasma Spectroscopy in the Presence of Magnetic Fields)

Abstract

:
The impurity ion poloidal rotation and ion temperature from the Aditya-U tokamak plasma have been measured using a high-resolution spectroscopic diagnostic. It comprises of a high resolution, 1 m, f/8.7, Czerny-Turner configuration spectrometer along with charge coupled device (CCD) detector. The system monitors the spectral line emission of C2+ impurity ions at 464.74 nm from the top port of the Aditya-U vacuum vessel with the lines of sight covering the plasma minor radius from r = 11.55 cm to 21.55 cm. The impurity ion poloidal rotation velocity and temperature have been estimated using the Doppler shift and Doppler broadening of the spectral lines respectively. The maximum poloidal rotation at a radial location of 21.55 cm in the edge of the plasma during the plasma current flat top was observed to be ~4 km/s for the analyzed discharges and the ion temperatures measured in the edge were in the range of 32–40 eV.

1. Introduction

Plasma rotation plays an important role in understanding the momentum transport and its effect on improved confinement and stabilizing resistive wall modes, suppressing magneto-hydrodynamic (MHD) instabilities and turbulence through E × B shear [1,2]. The study of plasma rotation is crucial to understand various physical phenomena in tokamak since the rotation velocity is known to be related with the radial electric field (Er). Further, the sheared radial electric field is known for the creation of a transport barrier [3]. The radial electric field is usually obtained using the force balance equation containing both toroidal and poloidal rotation terms together with toroidal and poloidal magnetic fields, pressure gradient etc. From the radial electric field profile, E × B shearing rate is determined. Thus, toroidal and poloidal plasma rotation study is of utmost importance for any tokamak to address various confinement related issues.
The study of plasma rotation, both extrinsic generated through supplying momentum by auxiliary heating, and intrinsic, has been performed on various tokamaks [4,5,6,7,8,9,10,11,12]. However, the physical mechanisms leading to the generation of intrinsic rotation are still not fully understood [13,14]. Most of the experiments are performed in the presence of external momentum source, like a neutral beam injector [11,15] and auxiliary heating scenarios [16,17]. In case of current fusion devices, a neutral beam injection is able to drive the plasma to sufficiently high rotation velocity. However, the same may not be the case for upcoming fusion devices, like ITER, owing to large plasma volume [18]. Hence, considerable efforts are being made to successfully predict the intrinsic rotation for future devices [19]. Several theories are now available to explain both the toroidal and poloidal rotation [20,21,22,23]. In tokamaks, the direction of intrinsic toroidal rotation is found to be either in the direction of plasma current (CO) or opposite to the plasma current (CTR) depending upon the operational scenario. As first reported in [24] and subsequently observed in several devices, an article compiling experimental results and an attempt to model the intrinsic toroidal rotation reversal phenomena can be found in [25].
The poloidal rotation in tokamak is typically observed to be of much lower magnitude than the toroidal rotation. However, the measurement of the poloidal rotation still remains important since poloidal rotation together with the toroidal magnetic field (~>1 T) constitute one of the important terms in the force balance equation to determine Er. Moreover, the measurements of the poloidal rotation have been compared with neoclassical theory in many tokamaks. These measurements are also important to develop a theory to predict the rotation in tokamak plasma. The poloidal rotation measurements when compared with neoclassical theory, have shown agreement in TCV [26], National Spherical Torus Experiment (NSTX) [27] whereas the disagreement of a few orders of magnitudes with the neoclassical theory, have been reported in TFTR [28], JET [4] and DIII-D [10,29]. The poloidal rotation is also known to contribute more towards tokamak edge physics, especially towards the edge transport barrier in H-mode plasmas. In the case of Aditya and Aditya-U tokamak, it was observed that plasmas with higher electron density have better energy confinement than that predicted by Neo-Alcator scaling for Ohmically heated tokamak plasma with limiter configuration. While, the reason behind this higher confinement is still not fully understood, E × B shear can be an important candidate here. Thus, the measurements of both the toroidal and poloidal rotation in Aditya-U tokamak are crucial to obtain the radial electric field profile which in turn can provide insight into the E × B shearing rate.
This paper presents the first measurement of the impurity poloidal rotation in the Aditya-U tokamak using C2+ visible spectral line at 464.74 nm. This spectral line is analysed in many devices to measure the edge poloidal rotation [30,31]. A high-resolution spectroscopic diagnostic [32] was used for the measurements of impurity ion poloidal rotation velocity and the edge ion temperature using the Doppler shift and Doppler broadening of the spectral line emission respectively. This diagnostic has been developed to study both the toroidal and poloidal plasma rotation using UV and visible spectral lines from various ionization stages of carbon impurity [33]. The radial profile of the toroidal rotation velocity has been measured viewing the plasma from a tangential port and the reversal of the plasma toroidal rotation was observed for high electron density discharges of the Aditya-U tokamak [34].
The paper is arranged as follows: Section 2 describes the experimental set up; in Section 3 experimental observations of impurity poloidal rotation velocity and edge ion temperature are reported followed by conclusions in Section 4.

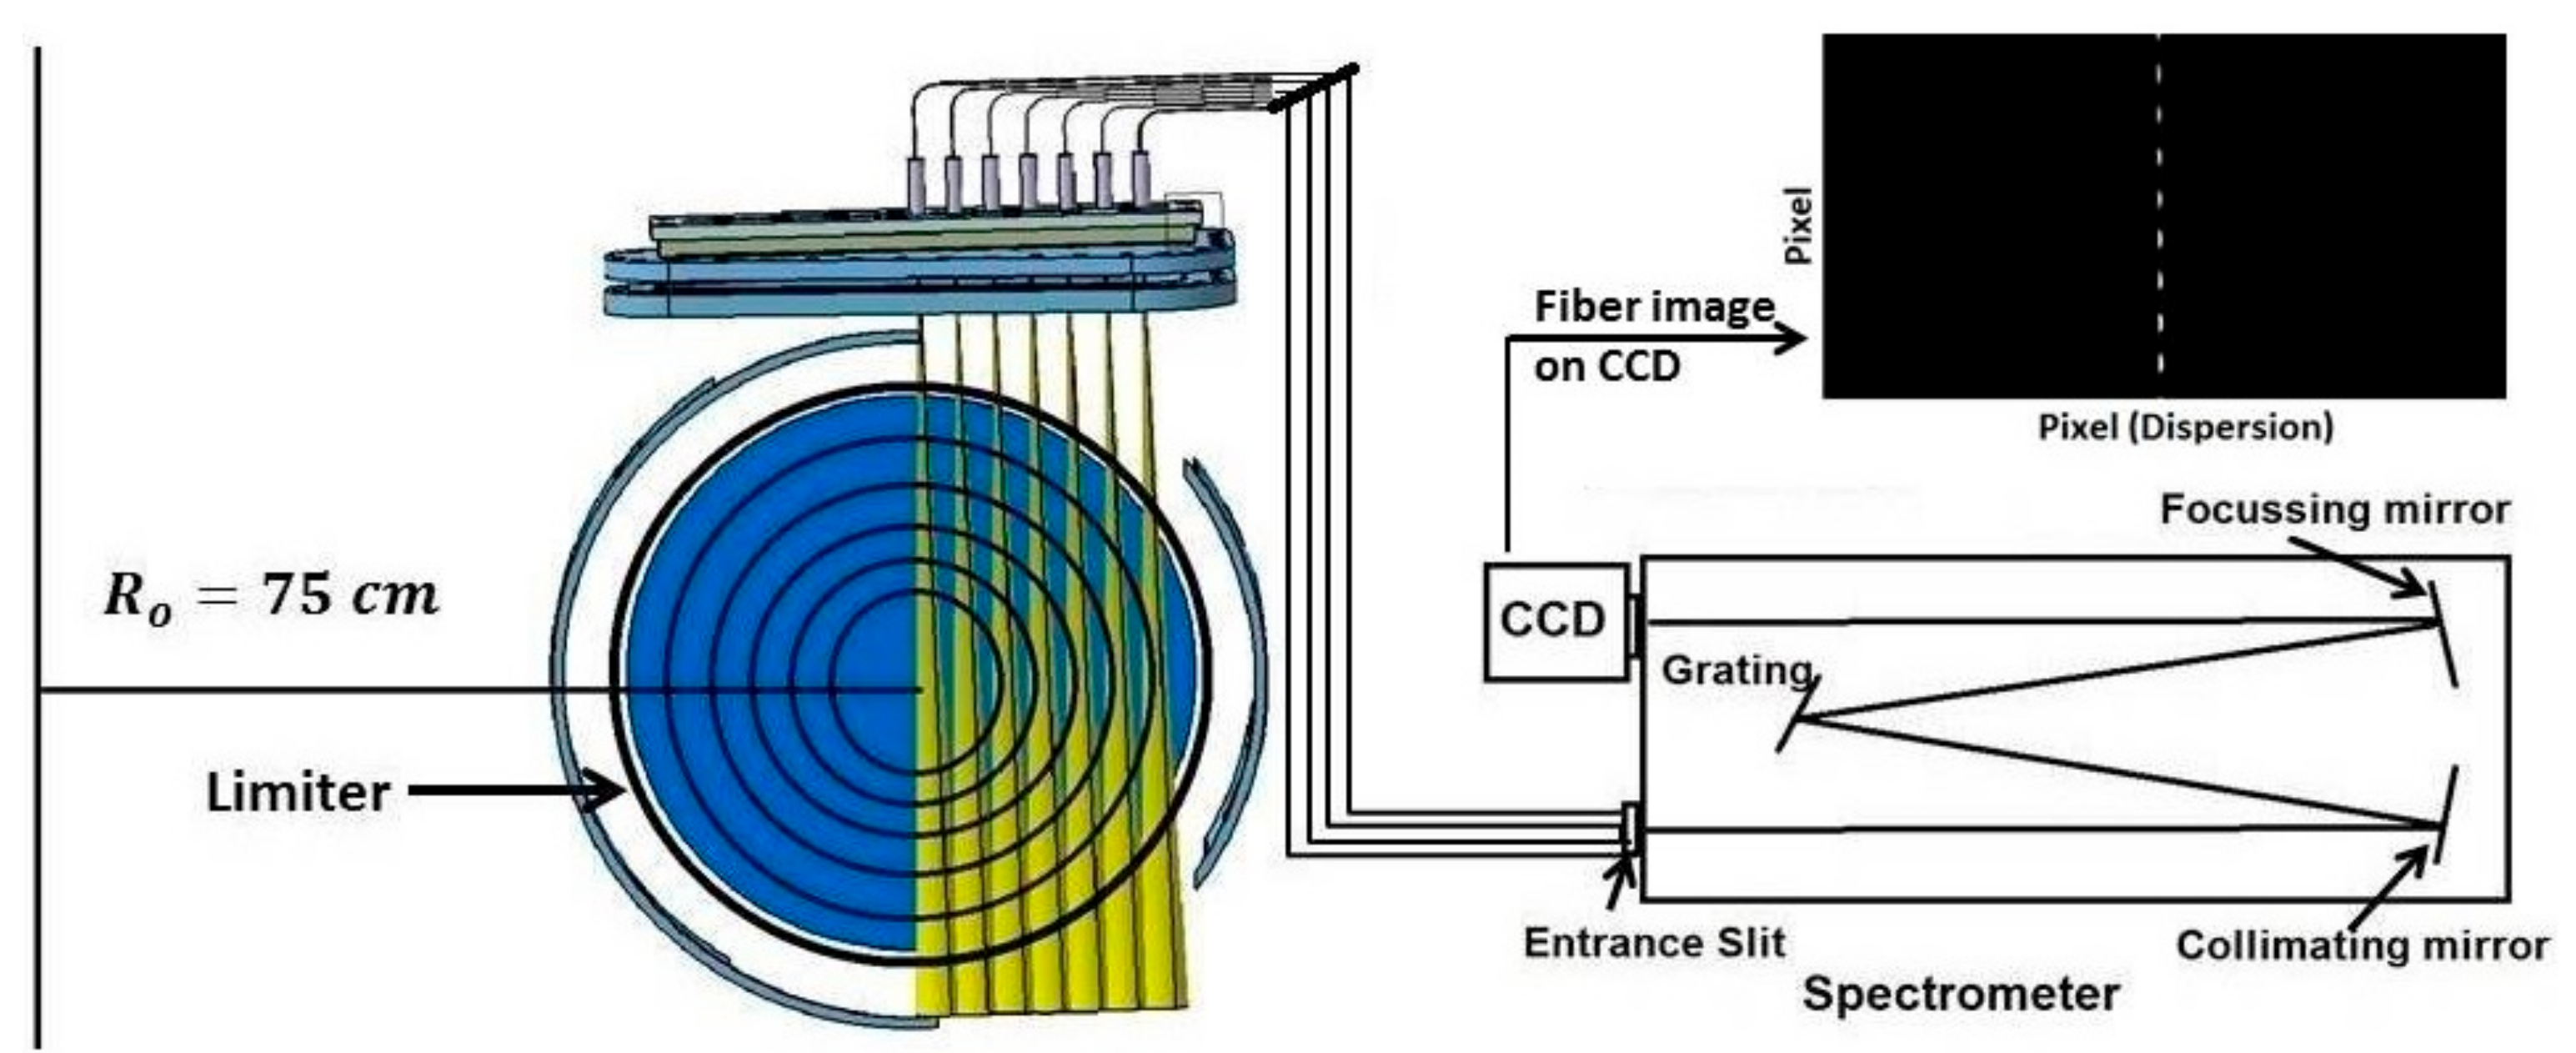
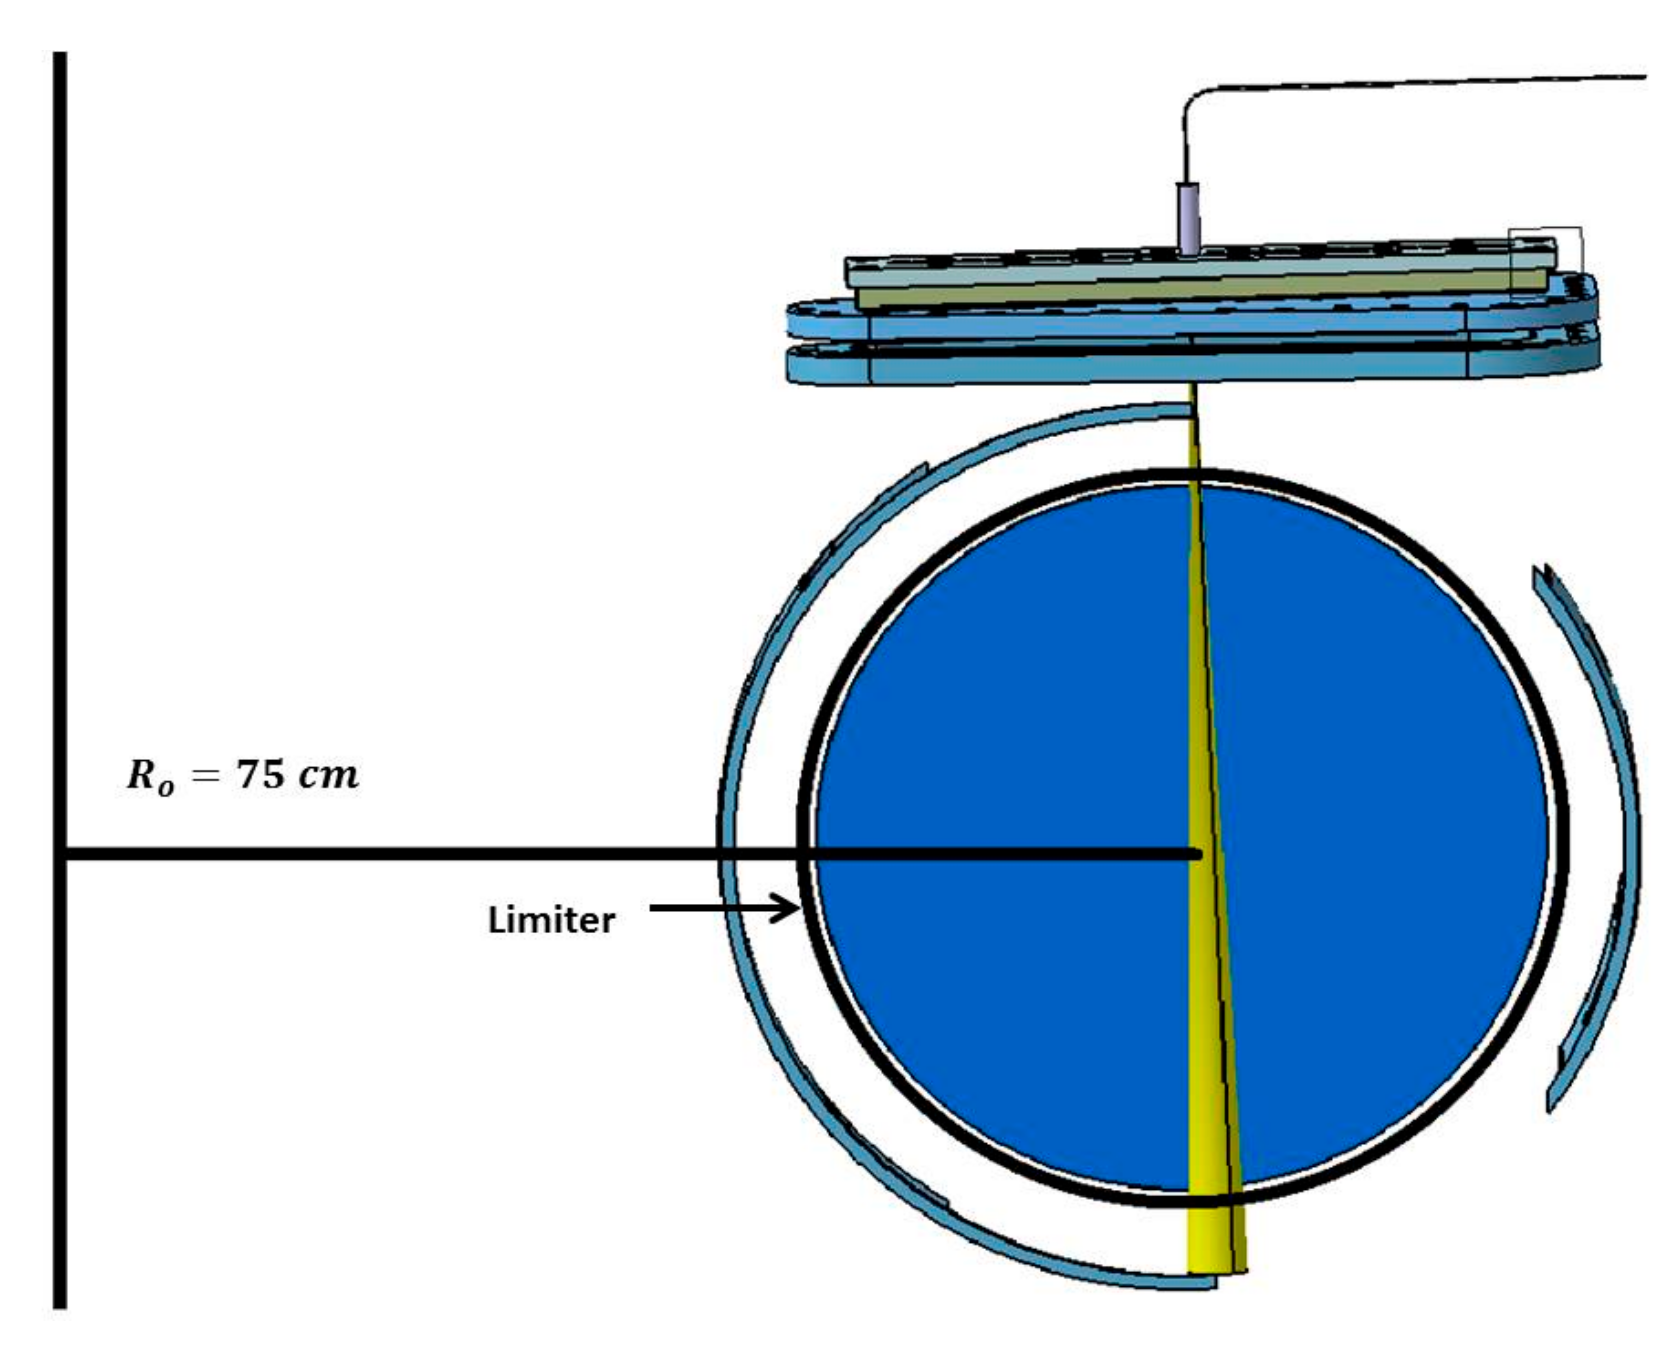
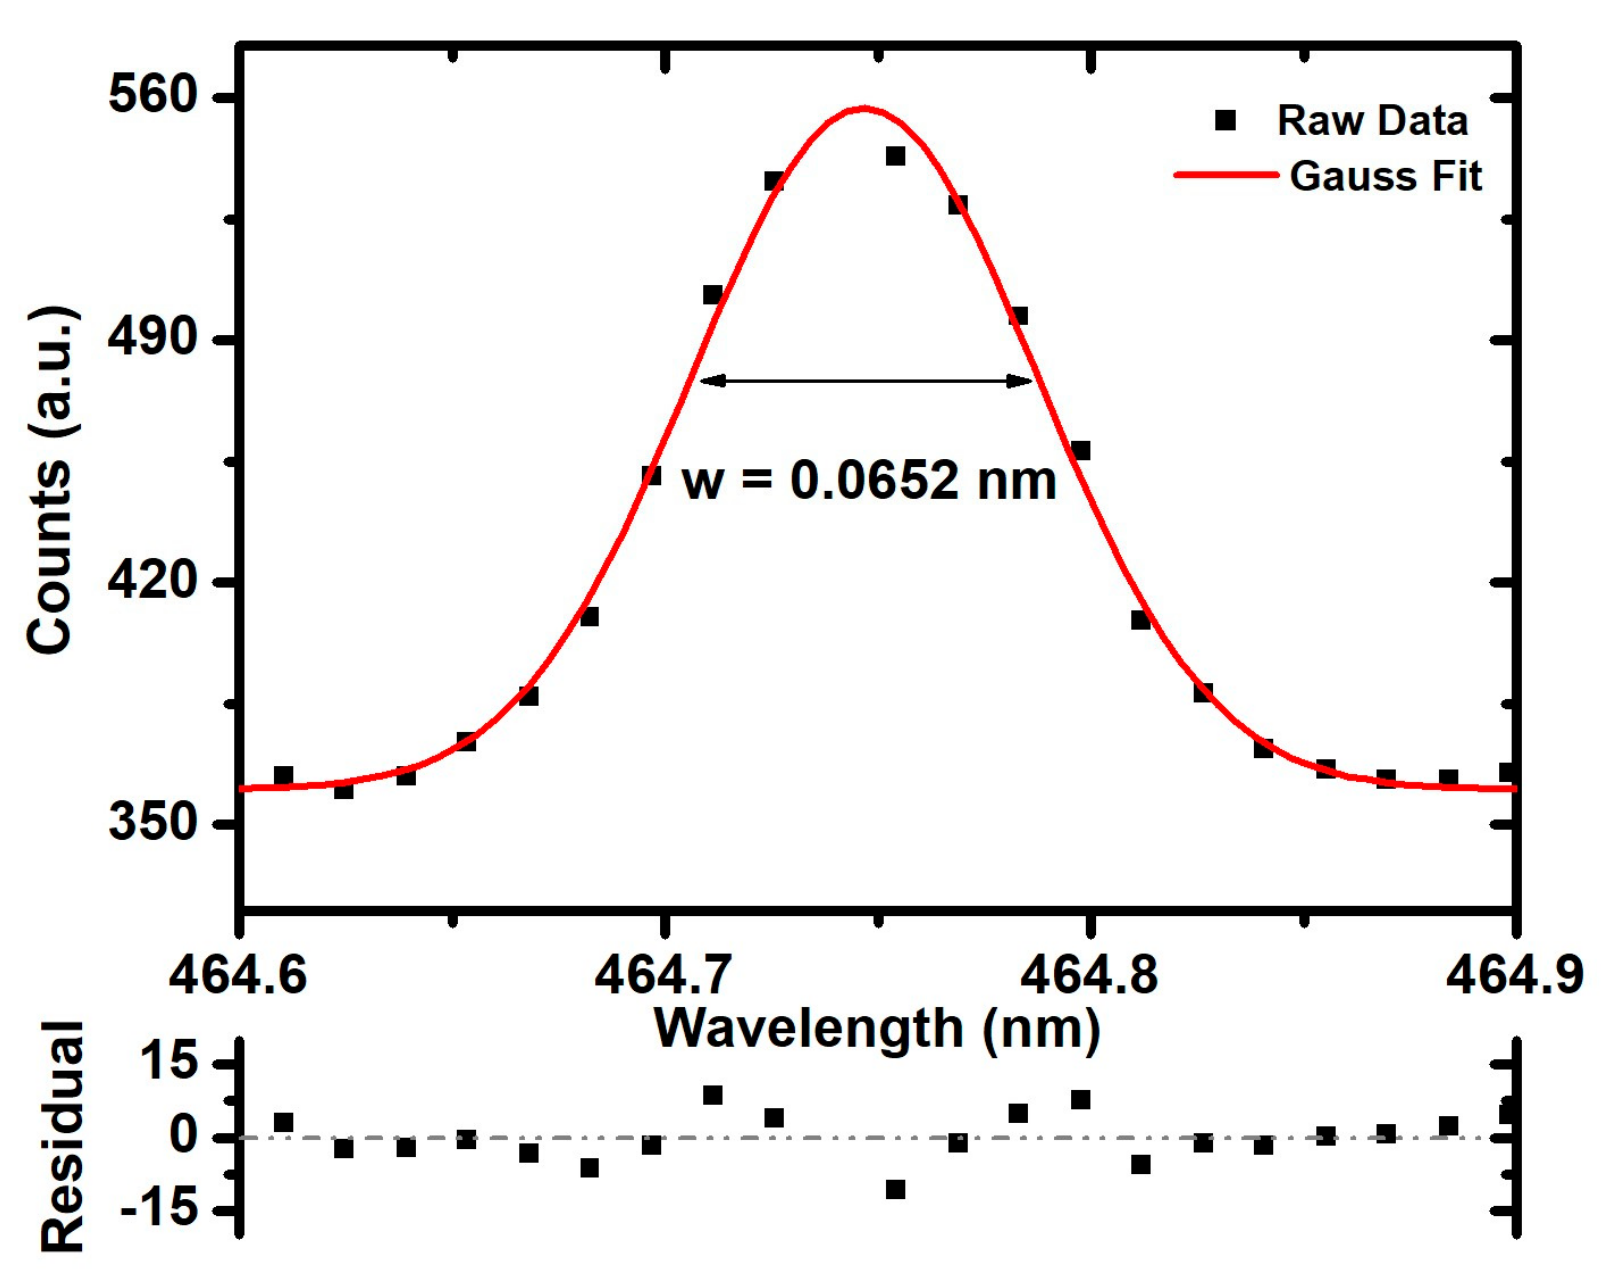
2. Experimental Set up and Analysis Technique

Aditya-U [35] is a medium sized air core tokamak. Aditya-U is an upgraded version of Aditya tokamak to be operated in both limiter and divertor configurations. The typical plasma and machine parameters for the analyzed discharges, operated in the limiter configuration, in the paper are listed in Table 1.
The schematic of the seven lines of sight (LoS) covering the plasma minor radius from the core to the edge in the low field side used for poloidal rotation measurements using the spectroscopic technique is shown in Figure 1. The plasma was viewed through a rectangular view port made of ultra violet (UV) grade fused silica having optical transmission down to 200 nm. In the present paper, data points from only four LoS were used covering the plasma minor radius from r = 11.55 to r = 21.55 cm on the low field side. This is due to the fact that the signal to noise ratio of the line emission of C2+ ions at 464.74 nm in the plasma core was very poor. Hence, the emission was recorded using four LoS from the mid-radius to the plasma edge at the low field side of the plasma.
The spectral line emissions from various ionization states of carbon impurity ion were captured using a high resolution 1.0 m f/8.7, Czerny-Turner configuration spectrometer (PI Acton, AM 510) equipped with 1800 grooves/mm grating. The light from the plasma to the spectrometer is coupled using a set of optical fibers. A vertical array of nine optical fibers is coupled to the entrance slit of the spectrometer. These nine fibers are of 400 μm core diameter and the fibers have a separation of 700 μm. The image of all the fibers is formed on the CCD detector placed at the exit port of the spectrometer as shown in Figure 1. These images are defined as multi-track on the CCD detector (ANDOR iDUS DV-420 OE) having 1024 × 256 pixels with 26 μm pixel size. The experiments were conducted with 70 μm slit width and CCD exposure time was set to 20 ms to sufficient signal intensity. The CCD readout time was 24 ms and hence, the data was acquired at every 44 ms. For the present measurements, five fibers out of the nine fibers available were used: The four fibers for the LoS mentioned above and one fiber for the in situ wavelength calibration.
The measurement of the rotation velocity and ion temperature from the Doppler shift and Doppler broadening demands the determination of the accurate rest wavelength and instrumental width, respectively. The reciprocal linear dispersion of the optical system has been obtained using standard Hg lamp and found to be ~0.01446 ± 0.0008 nm/pixel at the desired wavelength region. The velocity corresponding to one-pixel shift on the detector is ~9 km/s. Moreover, the in situ wavelength calibration was performed to determine the un-shifted wavelength for the measurement of the Doppler shift of the spectral line needed for the poloidal rotation measurement. Here, tokamak plasma itself was used as the light source and one of the five LoS passing through the plasma centre at 90° with respect to the magnetic axis was used as shown in Figure 2. The C2+ line emission at 464.74 nm observed through this LoS does not have any spectral line shift and gives the un-shifted wavelength. This chord integrated measurement gives enough signal to obtain the un-shifted wavelength for every discharge. Figure 3a shows the Gaussian profiles of the rest wavelength as well as the Doppler shifted wavelength fitted using the least square fitting technique developed in PYTHON. Here, the un-shifted and the Doppler shifted wavelengths are marked by vertical solid and dot-dashed lines, respectively. Figure 3a shows that the fitted spectral line has a blue shift. The residuals in the fitting procedure are also shown to indicate the confidence in the spectral fitting. As the estimation of the shift has been done using a fitting technique, the shift lower than one pixel can be accurately estimated [26,30]. The rotation velocity has been estimated using the following equation [30],
V =   d λ · c λ · cos θ
where, d λ is the Doppler shift in nm, c is the speed of light in m/s, λ is the wavelength in nm, and θ is the angle between the line of sight and the flux surface. In case of poloidal rotation, the measurements are performed from the top of the machine and hence, the angle θ is considered zero.
Figure 3b shows the instrumental width in terms of the full width at half maxima (FWHM) of the spectral line at 435.8 nm obtained using standard Hg lamp. This is crucial to obtain accurate Doppler broadening of the measured line emission. The instrument width is found to be 0.039 nm at 70 μm slit width corresponding to the ion temperature of 14 eV. The error associated with dispersion, the un-shifted wavelength and the instrumental width measurement is negligible. The edge ion temperature estimated using the Doppler broadening of spectral line emissions using the following equation [30]:
d λ λ =   2.43   ×   10 3   T m
where T is in keV and m is in amu.
The actual/corrected broadening has been obtained using following equation:
Δλact2 = Δλmeas2 − Δλinst2
where Δλact is the actual broadening, Δλmeas is the measured width of the spectral line and Δλinst is the instrumental width of the spectroscopic system. Moreover, it is also observed that effect of Stark broadening is negligible [36,37], except in the divertor region of the tokamak. Furthermore, the tokamak plasma is optically thin for the visible wavelength region of the radiation coming out from the plasma.

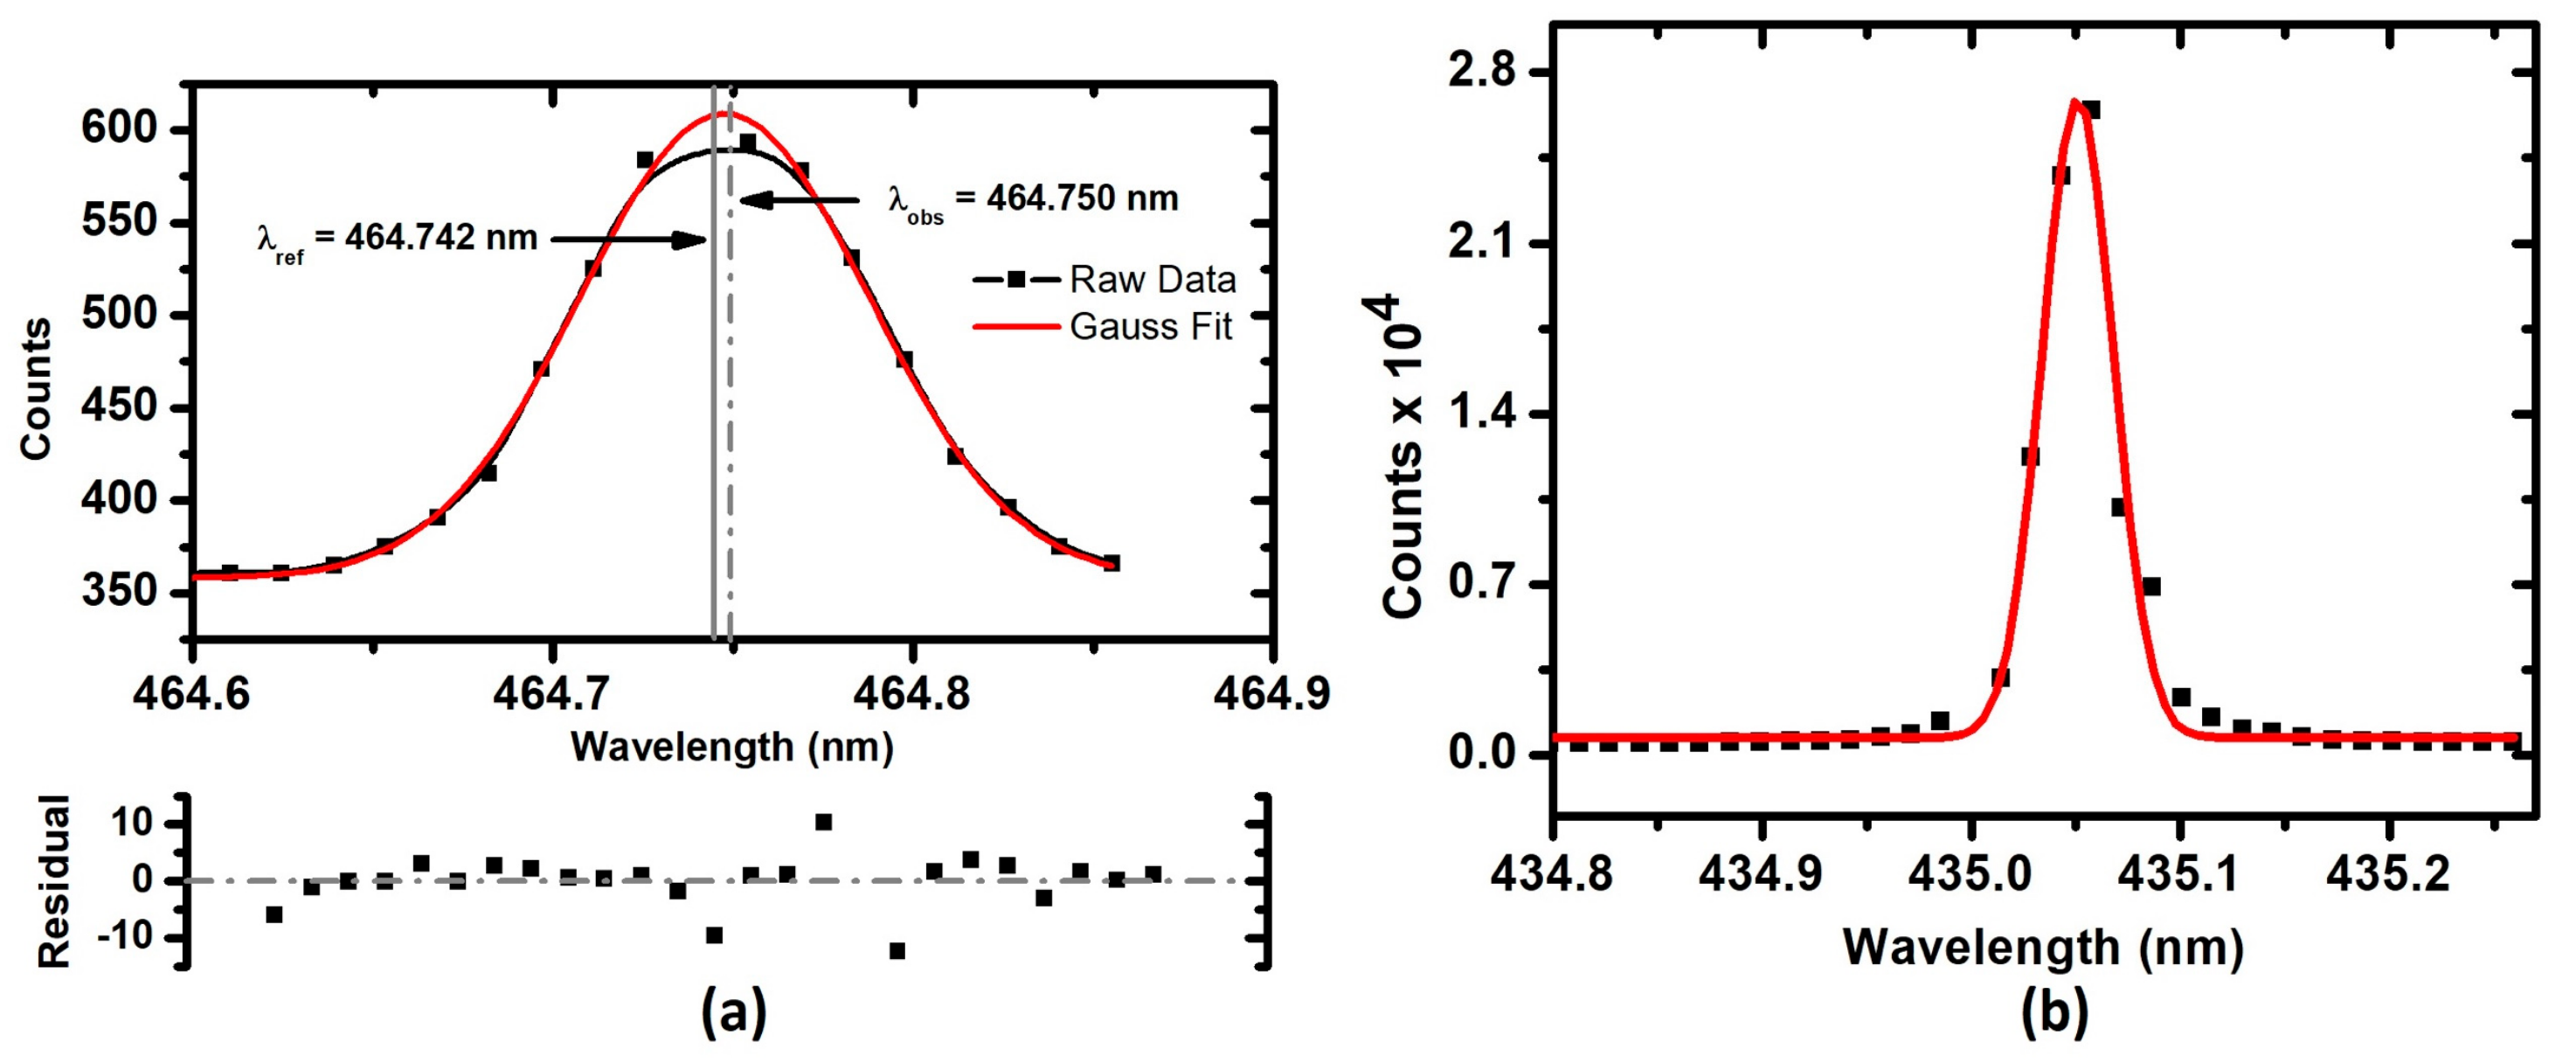
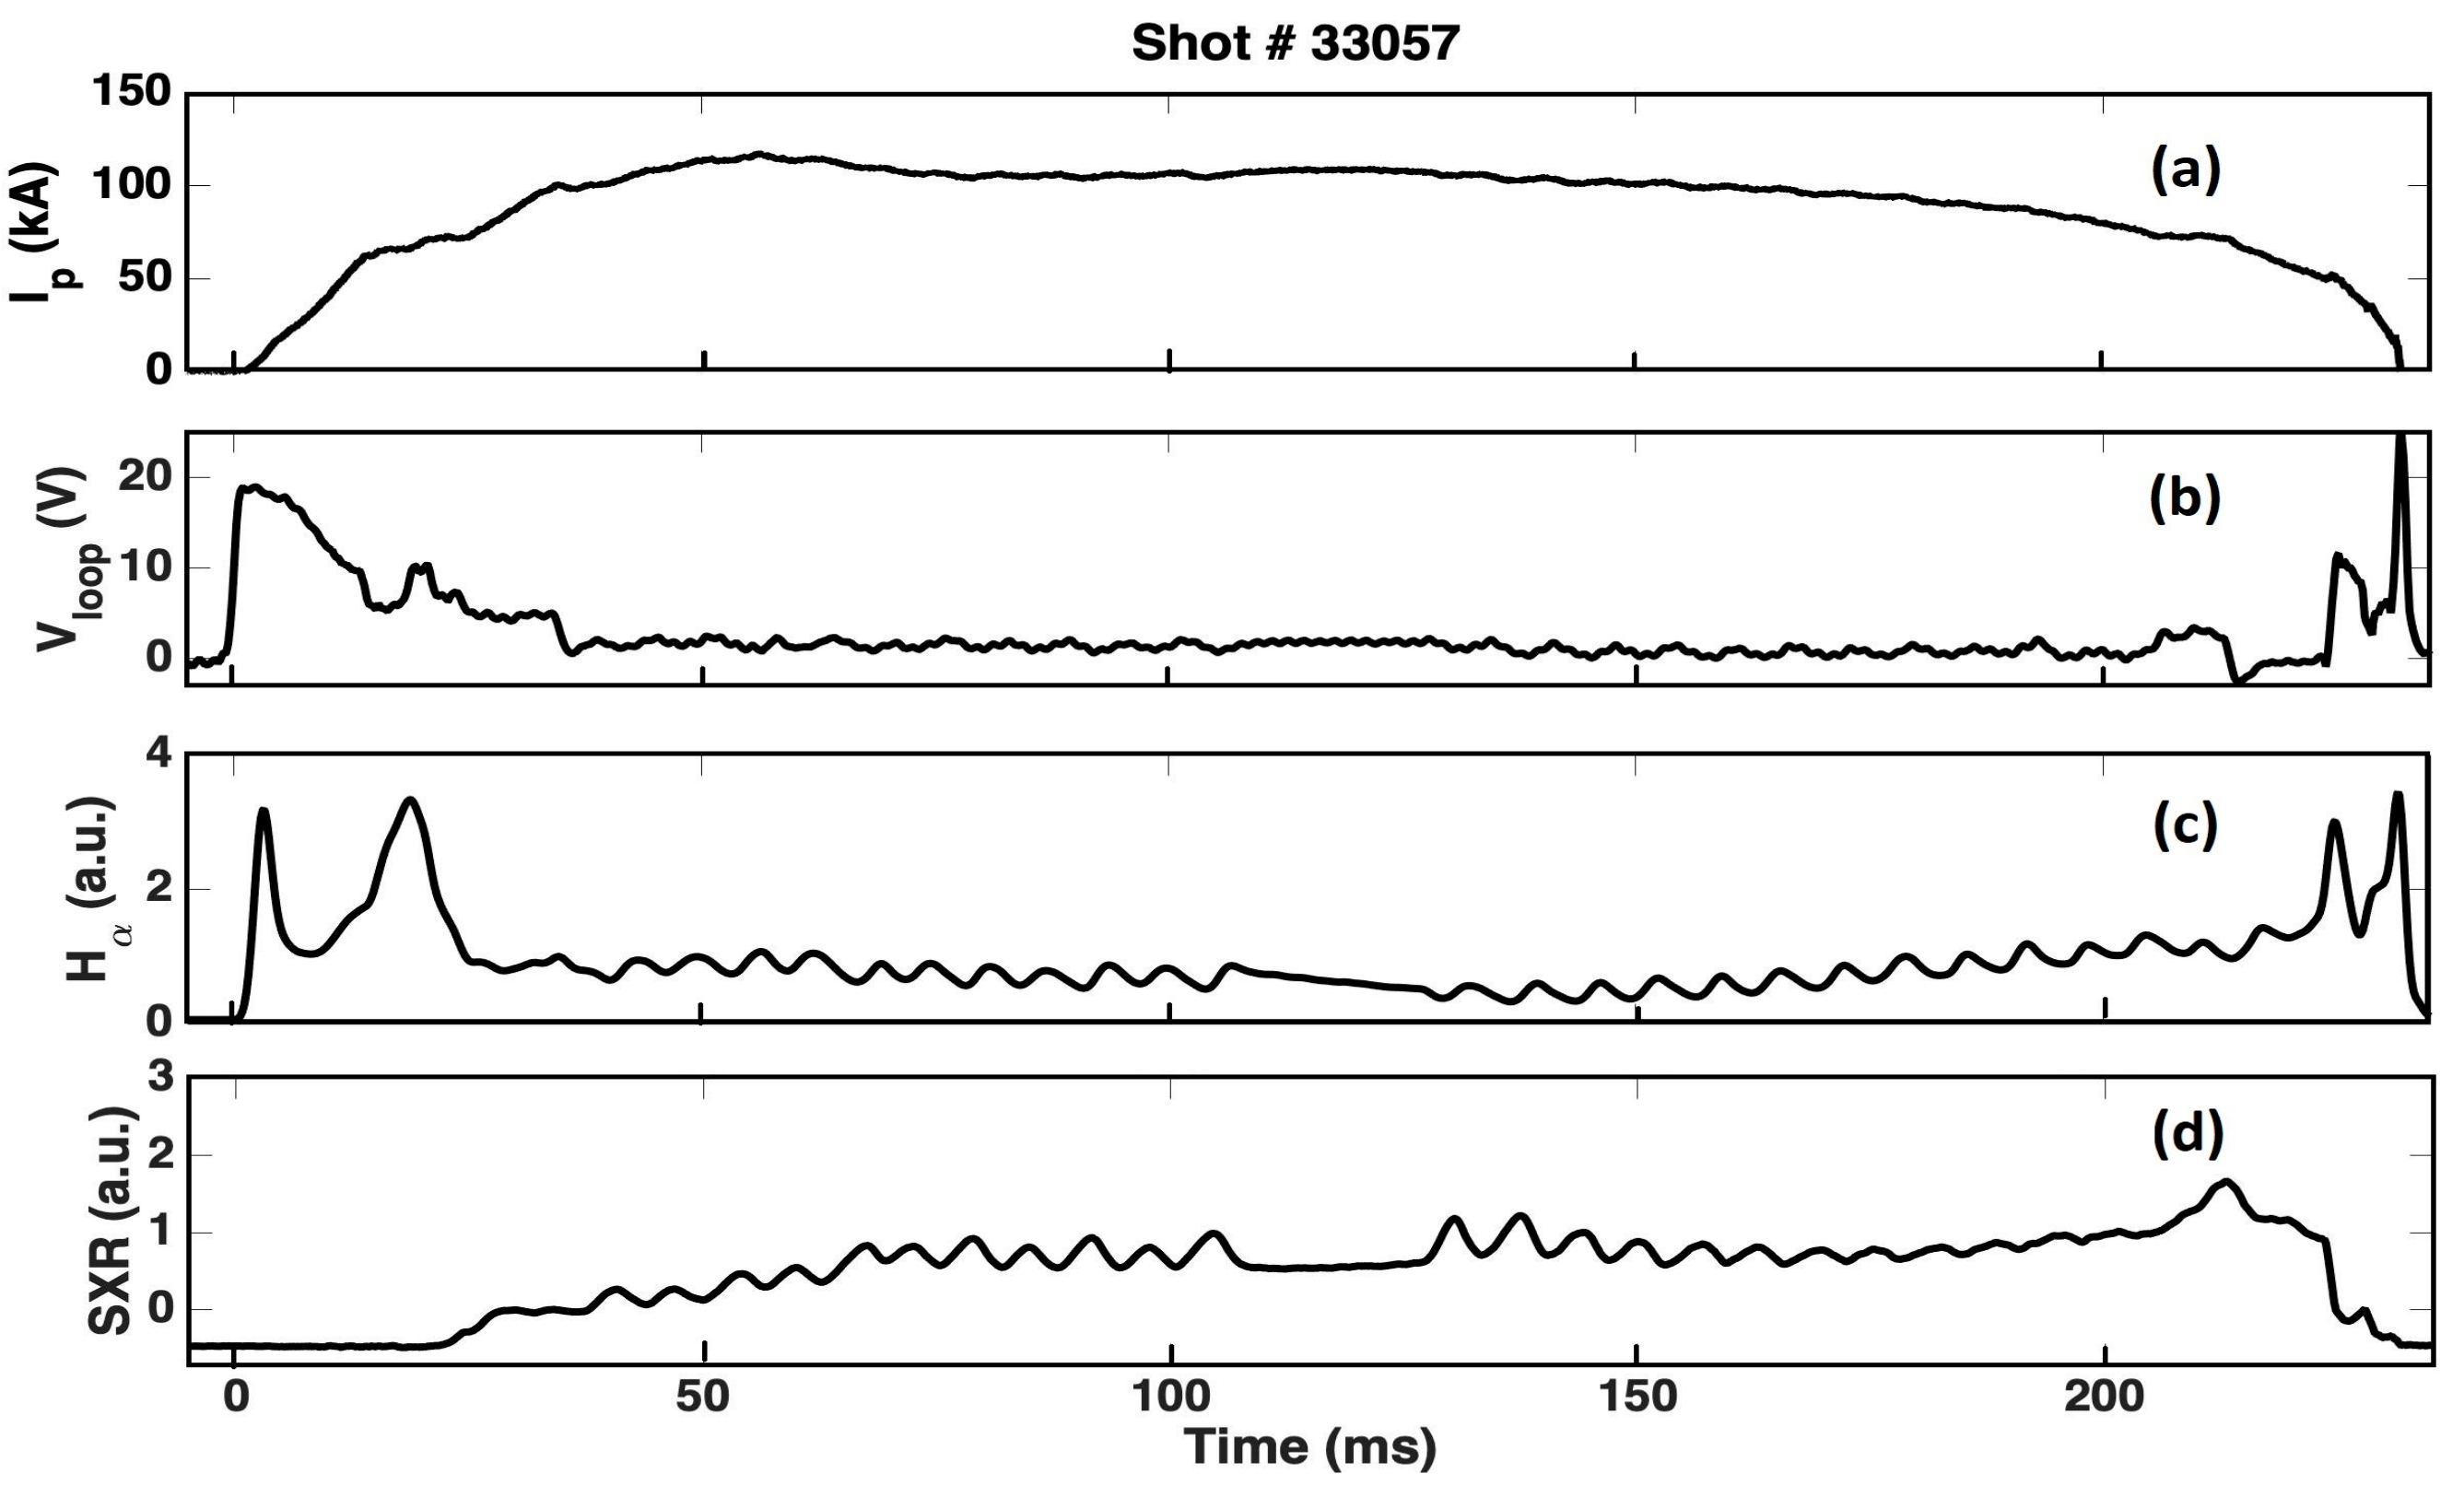
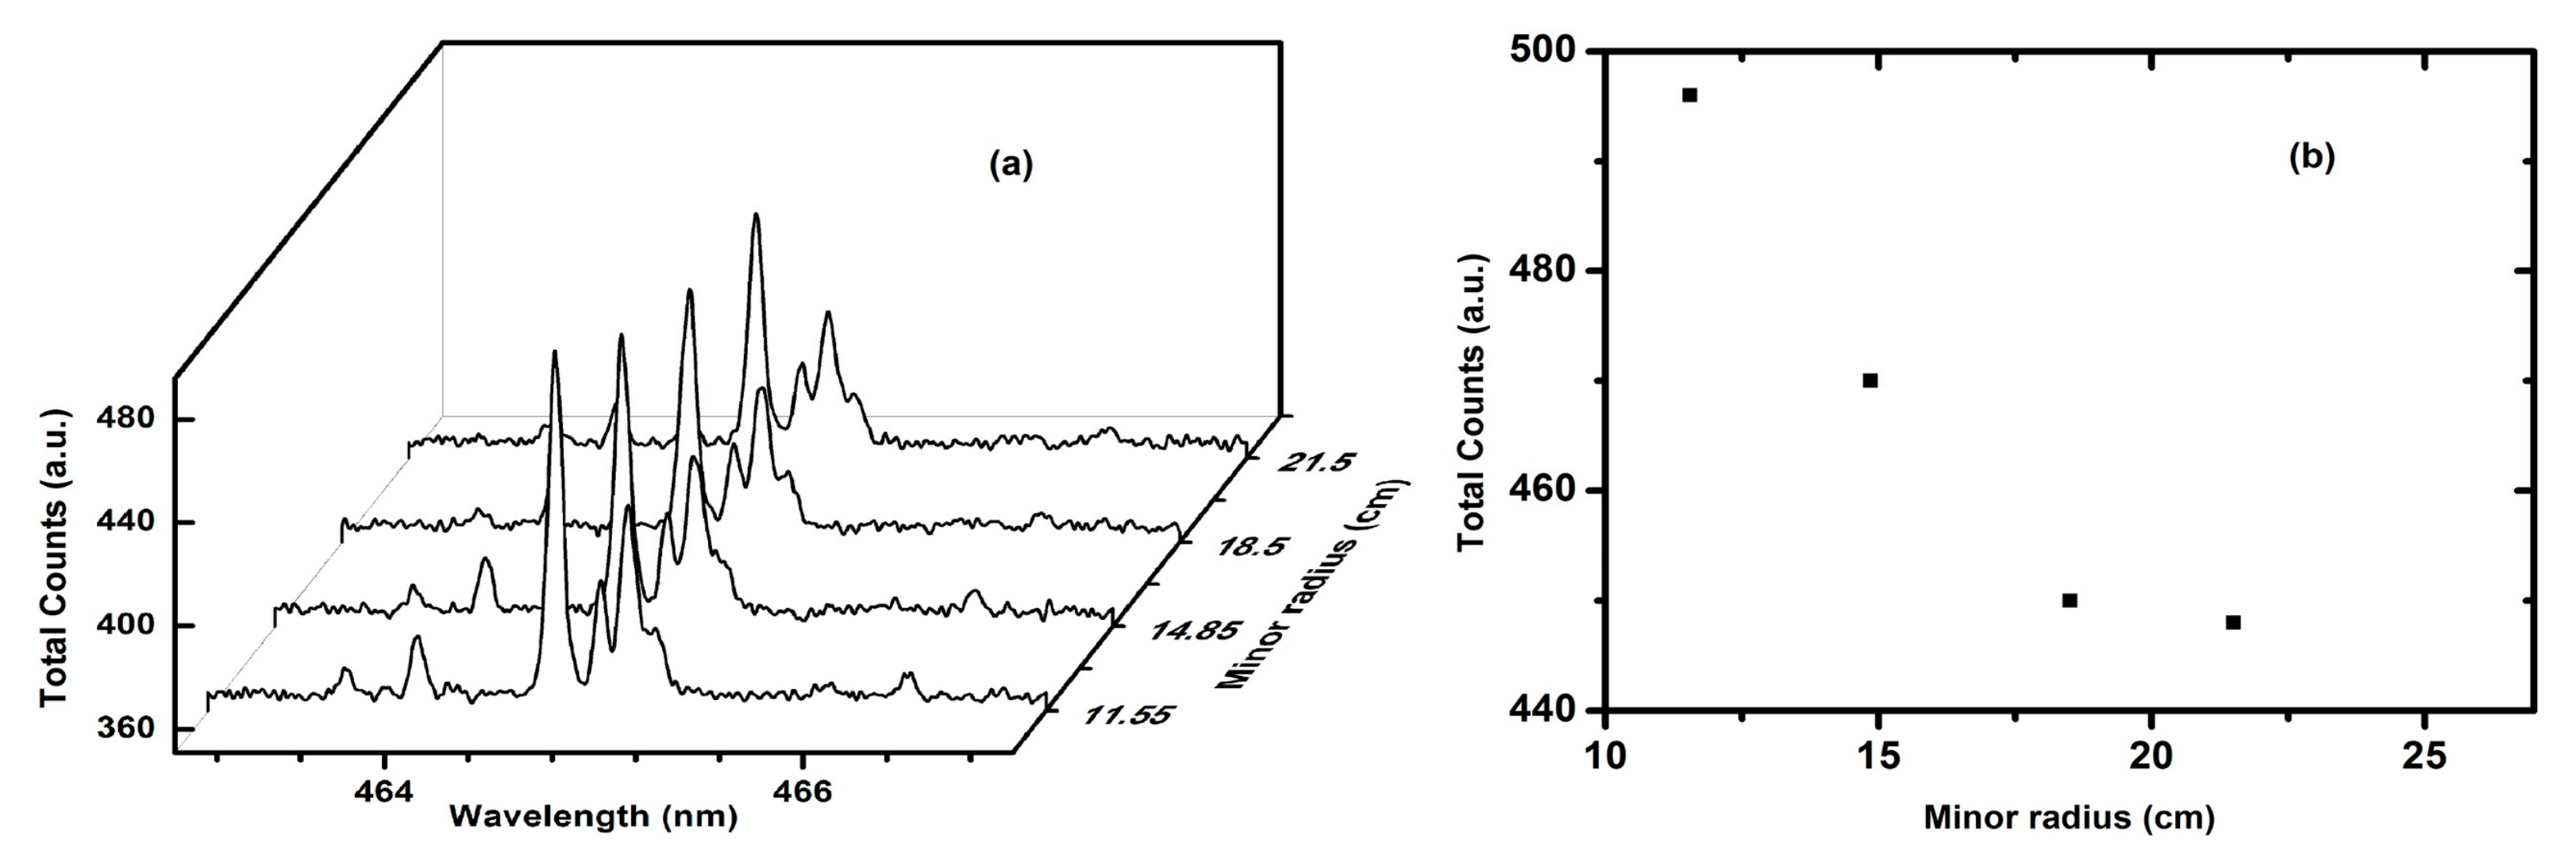
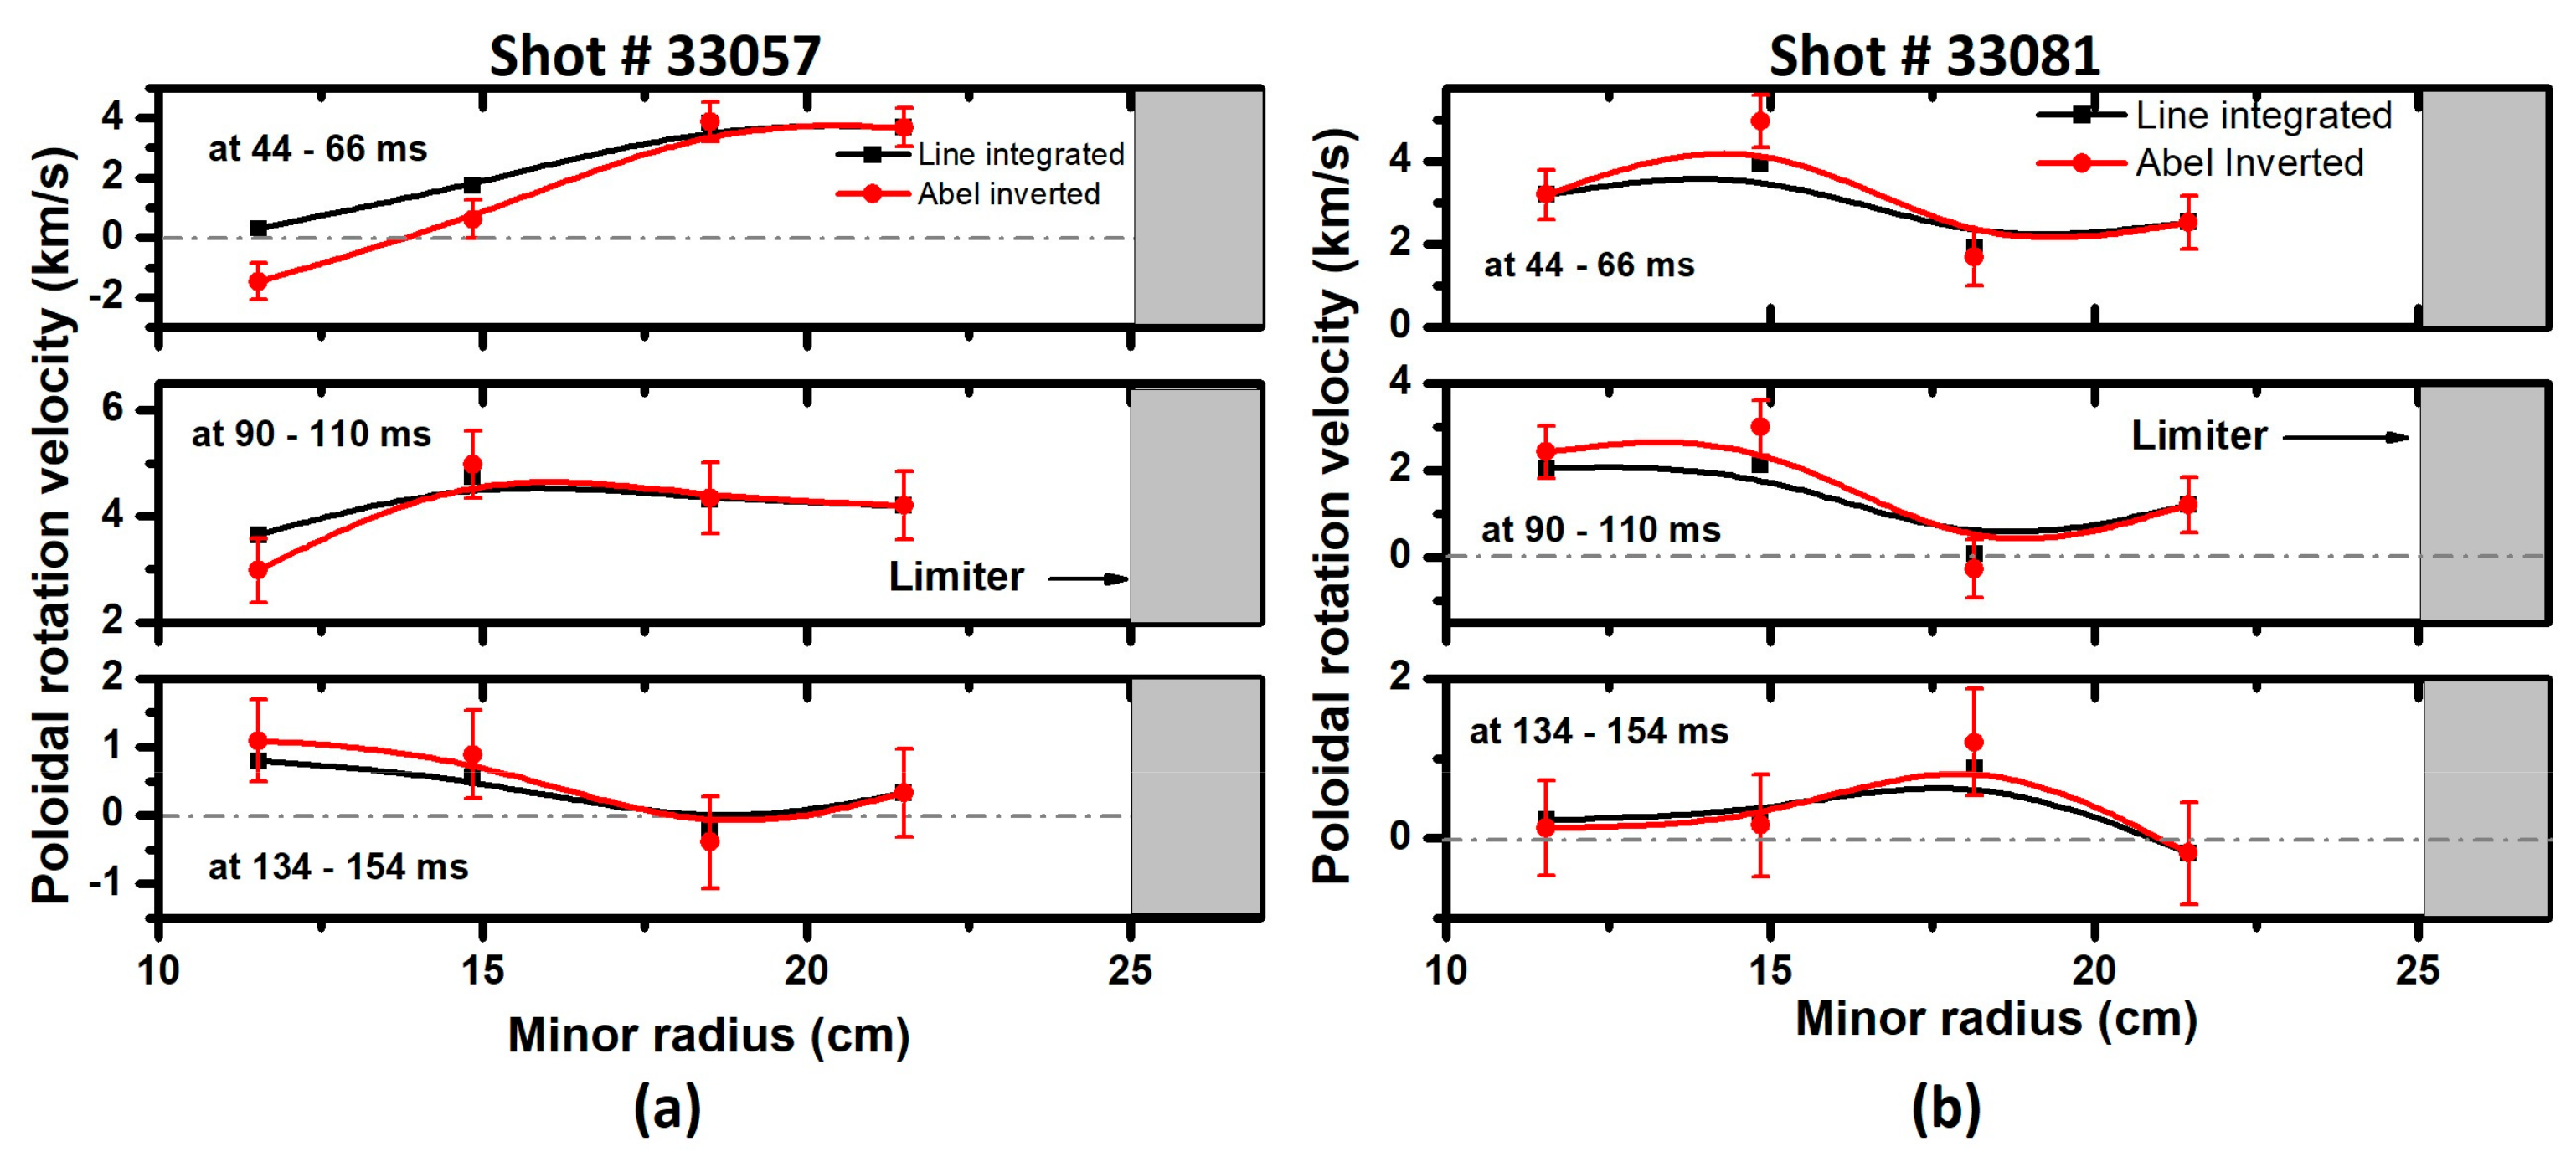
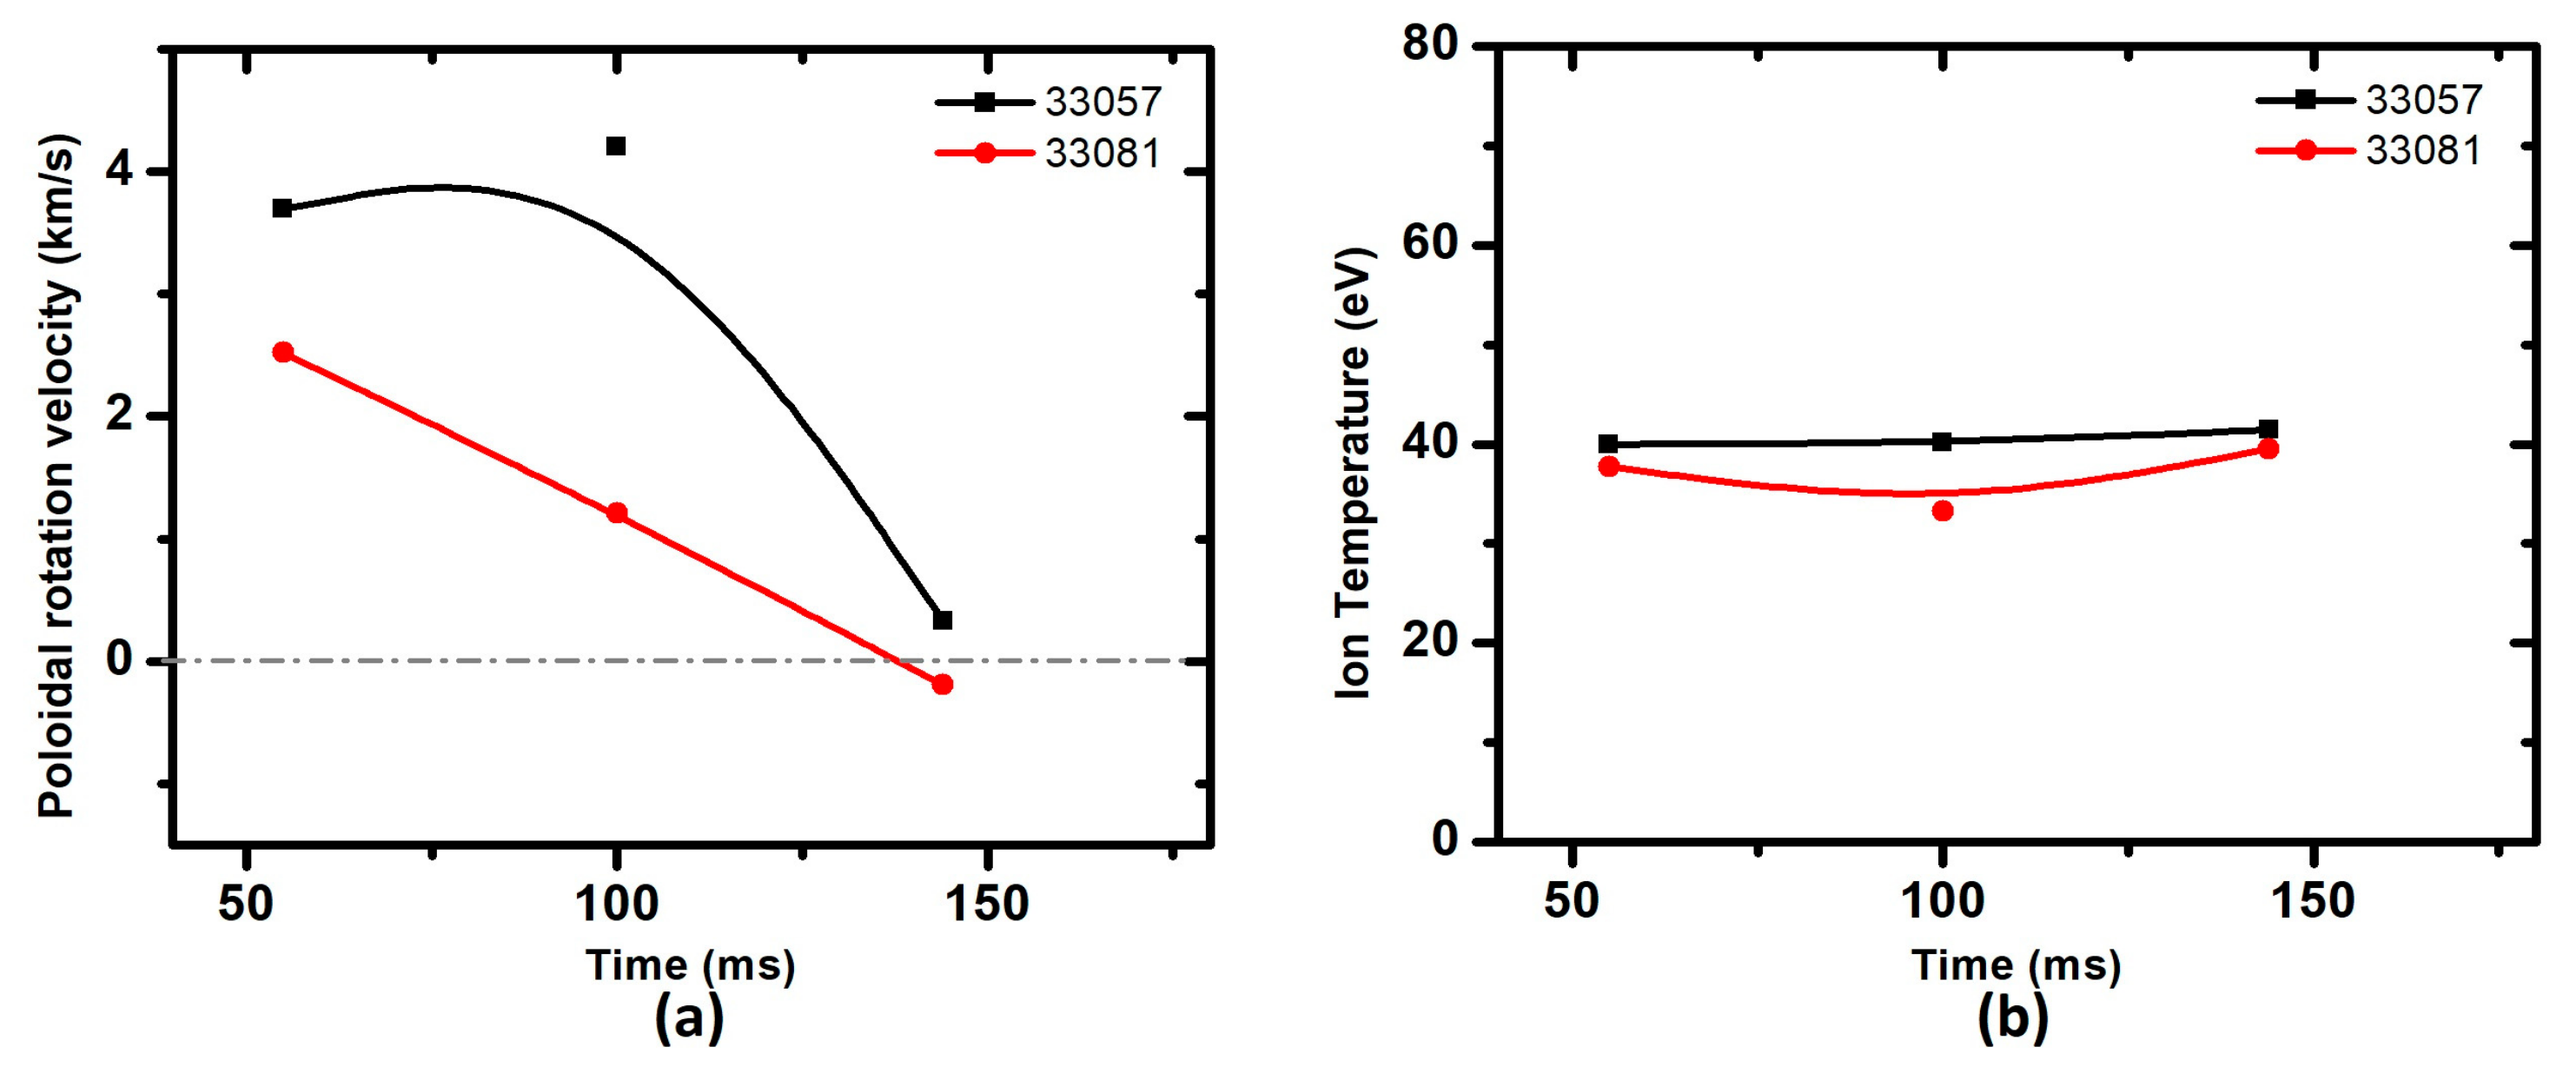
3. Experimental Results

The experimental results of the impurity ion poloidal rotation and temperature were obtained for ohmically heated limiter discharges of Aditya-U tokamak. The measurement has been carried out for many discharges and the results from two representative discharges have been presented here. Figure 4 shows the time evolution of various plasma parameters for Aditya-U tokamak discharge having shot number 33057. It has the maximum plasma current, Ip, of ~120 kA and the discharge duration of 230 ms. The loop voltage during the flat top region is approximately ~2 V. Figure 5 shows the space resolved spectra taken during the current flat-top duration at time of 90–110 ms with a CCD exposure time of 20 ms. It was observed that the maximum chord integrated line emission of C2+ was captured from the plasma mid radius and gradually decreases towards plasma edge. This is mainly due to line of sight having a large distance and integrating emission from all the plasma zones from observing radial location to the plasma edge. The spectral emissions measurement was performed for multiple time frames with CCD exposure of 20 ms to get both the spatial and temporal evolution of the plasma rotation velocity. From the line integrated spatial measurements, the radial profile of the poloidal rotation velocities was obtained by applying the Abel-like matrix inversion technique and the error propagation in the inversion was calculated using the method described in [33,38,39]. The fitting errors in both the experimental measurements as well as in the estimation of the instrument function were very small and negligible. The photon, dark, and readout noises were also considered for the standard deviation of the signal observed during the Abel inversion to obtain the radial profile of the poloidal rotation velocity from the chord integrated measurement. The error propagation in the inversion is calculated considering σb2 = [Lij2a2, where b and a are the brightness and emissivity vectors, respectively, operated by the length matrix [Lij], b = [Lij]a, and σa and σb are the standard deviations of the brightness and emissivity vectors, a and b respectively. The subscripts i and j correspond to the line of sights and emission zones respectively. The length matrix is determined from the geometry, and hence, the error in [Lij] is negligible. The error arising in the Abel inversion method was found to be ~10%. Further considered is the error in the wavelength arising due to the dispersion while deducing the wavelength shift of the measured spectra using a wavelength calibration spectra. The error in the dispersion depends on the distance in terms of pixels of the measured spectral line from the reference line used for the wavelength calibration and the error is the distance times the error in the dispersion value [32]. Table 2 shows the Doppler shift with total errors at the time of 100 ms for shot number of 33057. The total error in the velocity measurement was found to be ~20%.
Figure 6 shows the line integrated and Abel-inverted rotation velocity profile for shot number 33057 and 33081, respectively. The Abel inverted values give the radial profile of the plasma poloidal rotation. As shown in Figure 6, during the plasma current flat top at 55 ms (CCD exposure, 44–66 ms) of the discharge, the maximum poloidal rotation velocity of carbon ion was observed to be ~4 km/s towards the plasma edge. The Abel inverted rotation velocity at the plasma minor radius towards low field side of ~11.55 cm was observed to be ~–1.8 km/s during 44–64 ms of the plasma discharge. This indicates that the core plasma rotates in the opposite direction as compared to the edge plasma during this time of the plasma discharge. The poloidal rotation reduced towards the edge with the progression of the discharge and the peak value of rotation shifted toward the plasma inner region. The maximum value of the poloidal rotation at the edge was observed to be approximately 3 times lower than the peak value of the toroidal rotation observed in the central region of plasma in Aditya-U tokamak [33]. The Doppler width at the plasma edge having radial location of 21.55 cm was 0.0652 ± 0.0006 nm and the estimated C2+ ion temperature was 40.1 ± 0.003 eV. Figure 7 shows the Gaussian fitted spectrum to obtain the ion temperature from the Doppler broadening.
Further, the estimation of the temporal evolution of the measured poloidal rotation velocity of carbon impurity ion at the plasma edge having a radial location of 21.55 cm has been carried out for two discharges as shown in Figure 8a. The maximum poloidal rotation velocity was observed to be ~4 km/s at the time of 55 ms of the discharge. The rotation velocity shows a tendency of the gradual fall with plasma discharge progression. Similarly, Figure 8b shows the impurity ion temperature from the same radial location for the above mentioned two discharges. The maximum edge ion temperature was measured to be ~40 eV.

4. Summary

The paper presents the first measurements of the impurity poloidal rotation profile for Aditya-U tokamak using spectral line emission of C2+ at 464.74 nm captured with a high-resolution spectroscopic diagnostic. The measurements were carried out for the Ohmic heated discharges of the Aditya-U tokamak. The spatial profile of the spectral line emissions was obtained using four LoS covering the plasma minor radius from r = 11.55 to r = 21.55 cm viewing from the top port of the tokamak using a rectangular view port. The poloidal rotation velocity and ion temperature of the carbon ion were measured from the Doppler shifted and broadened spectral line profile, respectively. The radial profiles of the rotation velocity and ion temperature were obtained using the Abel-like matrix inversion technique from the line integrated values. The maximum poloidal rotation, radial location of ~21.55 cm in the plasma edge during plasma current flat top was observed to be ~4.5 km/s for the analyzed ohmic discharges of the Aditya-U tokamak. The ion temperatures measured using C2+ ion in the edge were in the range of 32–40 eV.

Author Contributions

Conceptualization, G.S., J.G., M.B.C.; methodology, G.S., M.B.C. and J.G.; software, G.S., K.S.; validation, M.B.C., J.G.; formal analysis, G.S.; investigation, G.S., K.S., M.B.C. and J.G.; resources, R.M., N.Y. and M.B.C.; data curation, G.S., N.Y., K.A.J., R.L.T., M.B.C. and Aditya-U team.; writing—original draft preparation, G.S.; writing—review and editing, K.S., M.B.C. and J.G.; visualization, G.S., K.S.; supervision, M.B.C., J.G.; project administration, J.G. and B.K.M.K.; funding acquisition, J.G. and B.K.M.K.

Funding

“This research was partially funded by Dept of Atomic energy- Board of Research in Nuclear Science, grant number 2931”

Conflicts of Interest

The authors declare no conflict of interest.

References

  1. Moyer, R.A.; Burrell, K.H.; Carlstrom, T.N.; Coda, S.; Conn, R.W.; Doyle, E.J.; Gohil, P.; Groebner, R.J.; Kim, J.; Lehmer, R. Beyond paradigm: Turbulance, transport, and the origin of the radil electric field in low to high confinement mode transitions in the DIII-D tokamak. Phys. Plasmas 1995, 2, 2397–2407. [Google Scholar] [CrossRef]
  2. Burrel, K.H. Effects of E x B velocity shear and magnetic shear on turbulence and transport in magnetic confinement devices. Phys. Plasmas 1997, 4, 1499–1518. [Google Scholar] [CrossRef]
  3. Bitter, M.; Hsuan, H.; Rice, J.E.; Hill, K.W.; Diesso, M.; Grek, B.; Hulse, R.; Johnson, D.W.; Johnson, L.C.; Von Goeler, S. Measurements of radial profiles of the ion temperature and the plasma rotation velocity with the TFTR vertical x-ray crystal spectrometer. Rev. Sci. Instrum. 1988, 59, 2131–2134. [Google Scholar] [CrossRef]
  4. Crombe, K.; Andrew, Y.; Brix, M.; Giroud, C.; Hacquin, S.; Hawkes, N.C.; Murari, A.; Nave, M.F.F.; Ongena, J.; Parail, V.; et al. Poloidal rotation dynamics, Radial electric field, and Neoclassical theory in the JET internal transport barrier region. Phys. Rev. Lett. 2005, 95, 155003. [Google Scholar] [CrossRef] [PubMed]
  5. Field, A.R.; Michael, C.; Akers, R.J.; Candy, J.; Colyer, G.; Guttenfelder, W.; Ghim, Y.-C.; Roach, C.M.; Saarelma, S.; MAST Team. Plasma rotation and transport in Spherical tokamak. Nucl. Fusion 2011, 51, 063006. [Google Scholar] [CrossRef]
  6. Gates, D.A.; Ahn, J.; Allain, J.; Andre, R.; Bastasz, R.; Bell, M.; Bell, R.; Belova, E.; Berkery, J.; Betti, R.; et al. Overview of results from the National Spherical Torus Experiment (NSTX). Nucl. Fusion 2009, 49, 104016. [Google Scholar] [CrossRef]
  7. Li, Y.Y.; Yin, X.H.; Fu, J.; Jiang, D.; Feng, S.Y.; Lyu, B.; Shi, Y.J.; Yi, Y.; Zhou, X.J.; Hu, C.D.; et al. First measurement of the edge charge exchange recombination spectroscopy on EAST tokamak. Rev. Sci. Instrum. 2016, 87, 11E501. [Google Scholar] [CrossRef]
  8. McDermott, R.M.; Angioni, C.; Conway, G.D.; Dux, R.; Fable, E.; Fischer, R.; Putterich, T.; Ryter, F.; Viezzer, E.; ASDEX Upgrade Team. Core intrinsic rotation behavior in ASDEX upgrade Ohmic L-mode plasmas. Nucl. Fusion 2014, 54, 043009. [Google Scholar] [CrossRef]
  9. Romannikov, A.; Bourdelle, C.; Bucalossi, J.; Hutter, T.; Platz, P.; Saint-Laurent, F. Measurement of central toroidal rotation in Ohmic Tore Supra plasmas. Nucl. Fusion 2000, 40, 319–324. [Google Scholar] [CrossRef]
  10. Grierson, B.A.; Burrell, K.H.; Solomon, W.M.; Budny, R.V.; Candy, J. Collisionality scaling of main-ion toroidal and poloidal rotation in low torque DIII-D plasmas. Nucl. Fusion 2013, 53, 063010. [Google Scholar] [CrossRef]
  11. Scarabosio, A.; Bortolon, A.; Duval, B.P.; Karpushov, A.; Ponchelon, A. Toroidal plasma rotation in TCV tokamak. Plasma Phys. Control. Fusion 2006, 48, 663–683. [Google Scholar] [CrossRef]
  12. Rice, J.E.; Marmar, E.S.; Bombarda, F.; Qu, L. X ray observations of central toroidal rotation in Ohmic ALCATOR C-Mod plasmas. Nucl. Fusion 1997, 37, 421–426. [Google Scholar] [CrossRef]
  13. Rice, J.E.; Hughes, J.W.; Diamond, P.H.; Kosuga, Y.; Podpaly, Y.A.; Reinke, M.L.; Greenwald, M.J.; Gurcan, O.D.; Hahm, T.S.; Hubbard, A.E.; et al. Edge temperature gradient as intrinsic rotation drive in Alcator C-Mod tokamak plasmas. Phys. Rev. Lett. 2011, 106, 215001. [Google Scholar] [CrossRef] [PubMed]
  14. Nave, M.F.F.; Johnson, T.; Eriksson, L.-G.; Crombe, K.; Giroud, C.; Mayoral, M.-L.; Ongena, J.; Salmi, A.; Tala, T.; Tsalas, M. Influence of magnetic field ripple on the intrinsic rotation of tokamak plasmas. Phys. Rev. Lett. 2010, 105, 105005. [Google Scholar] [CrossRef] [PubMed]
  15. Gohil, P.; Burrell, K.H.; Hassam, A.B.; Osborne, T.H. Plasma rotation and the radial electric field during off-axis NBI in the DIII-D tokamak. Plasma Phys. Control. Fusion 1996, 38, 1243–1247. [Google Scholar] [CrossRef]
  16. Rice, J.E.; Boivin, R.L.; Bonoli, P.T.; Goetz, J.A.; Granetz, R.S.; Greenwald, M.J.; Hutchinson, I.H.; Marmar, E.S.; Schilling, G.; Snipes, J.A.; et al. Observations of impurity toroidal rotation suppression with ITB formation in ICRF and Ohmic H –mode Alcator C-Mod plasmas. Nucl. Fusion 2001, 41, 277–284. [Google Scholar] [CrossRef]
  17. Porte, L.; Coda, S.; Alberti, S.; Arnoux, G.; Blanchard, P.; Bortolon, A.; Fasoli, A.; Goodman, T.P.; Klimanov, Y.; Martin, Y.; et al. Plasma dynamics with second and third harmonic ECRH and access to quasi stationary ELM-free H-mode on TCV. Nucl. Fusion 2007, 47, 952–960. [Google Scholar] [CrossRef]
  18. Doyle, E.J.; Houlberg, W.A.; Kamada, Y.; Mukhovatov, V.; Osborne, T.H.; Polevoi, A.; Bateman, G.; Connor, J.W.; Cordey, J.G.; Fujita, T. Chapter 2: Plasma confinement and transport. Nucl. Fusion 2008, 47, S18–S127. [Google Scholar]
  19. Chrystal, C.; Grierson, B.A.; Staebler, G.M.; Petty, C.C.; Solomon, W.M.; de Grassie, J.S.; Burrell, K.H.; Tala, T.; Salmi, A. Predicting rotation for ITER via studies of intrinsic torque and momentum transport in DIII-D. Phys. Plasmas 2017, 24, 056113. [Google Scholar] [CrossRef]
  20. Shaing, K.C. An estimate of the ion orbit loss rate in tokamaks. Phys. Fluids B Plasma Phys. 1992, 4, 3310–3315. [Google Scholar] [CrossRef]
  21. Kim, Y.B.; Diamond, P.H.; Groebner, R.J. Neoclassical poloidal and toroidal rotation in tokamaks. Phys. Fluids B Plasma Phys. 1991, 3, 2050–2060. [Google Scholar] [CrossRef]
  22. Shaing, K.C.; Crume, E.C., Jr. Bifurcation theory of poloidal rotation in tokamaks: A model for the L-H transitions. Phys. Rev. Lett. 1989, 63, 2369–2372. [Google Scholar] [CrossRef] [PubMed]
  23. Hazeltine, R.D. Rotation of toroidally confined, collisional plasma. Phys. Fluids 1974, 17, 961–968. [Google Scholar] [CrossRef]
  24. Bortolon, A.; Duval, B.P.; Pochelon, A.; Scarabosio, A. Observation of spontaeneous toroidal rotation inversion in ohmically heated tokamak plasmas. Phys. Rev. Lett. 2006, 97, 235003. [Google Scholar] [CrossRef] [PubMed]
  25. Camenen, Y.; Angioni, C.; Bortolon, A.; Duval, B.P.; Fable, E.; Hornsby, W.A.; McDermott, R.M.; Na, Y.-S.; Peeters, A.G.; Rice, J.E. Experimental observations and modeling of intrinsic rotation reversals in tokamaks. Plasma Phys. Control. Fusion 2017, 59, 034001. [Google Scholar] [CrossRef]
  26. Bortolon, A.; Camenen, Y.; Karpushov, A.N.; Federspiel, L.; Sauter, O.; TCV Team. Indirect measurement of poloidal rotation using inboard-outboard asymmetry of toroidal rotation and comparison with neoclassical predictions. Nucl. Fusion 2013, 53, 023002. [Google Scholar] [CrossRef]
  27. Bell, R.E.; Andre, R.; Kaye, S.M.; Kolesnikov, R.A.; LeBlanc, B.P.; Rewoldt, G.; Wang, W.X.; Sabbagh, S.A. Comparision of poloidal rotation measurements to neoclassical theory on the National Sperical Torus Experiment. Phys. Plasmas 2010, 17, 82507. [Google Scholar] [CrossRef]
  28. Bell, R.E.; Levinton, F.M.; Batha, S.H.; Synakowski, E.J.; Zarnstorff, M.C. Poloidal rotation in TFTR reversed Shear Plasmas. Phys. Rev. Lett. 1998, 81, 1429–1432. [Google Scholar] [CrossRef]
  29. Solomon, W.M.; Burrell, K.H.; Andre, R.; Baylor, L.R.; Budny, R.; Gohil, P.; Groebner, R.J.; Holcomb, C.T.; Houlberg, W.A.; Wade, M.R. Experimental test of the neoclassical theory of impurity polodal rotation in tokamaks. Phys. Plasmas 2006, 13, 056116. [Google Scholar] [CrossRef]
  30. Weinzettl, V.; Shukla, G.; Ghosh, J.; Melich, R.; Panek, R.; Tomes, M.; Imrisek, M.; Naydenova, D.; Varju, J.; Gomes, R. High-resolution spectroscopy diagnostics for measureing impurity ion temperature and velocity on the COMPASS tokamak. Fusion Eng. Des. 2015, 96–97, 1006–1011. [Google Scholar] [CrossRef]
  31. Severo, J.H.F.; Ronchi, G.; Galvao, R.M.O.; Nascimento, I.C.; Guimaraes-Filho, Z.O.; Kuznetsov, Y.K.; Nave, M.F.F.; Oliveira, A.M.; Nascimento, F.D.; Tendler, M. Investigation of rotation at the plasma edge in TCABR. Nucl. Fusion 2015, 55, 093001. [Google Scholar] [CrossRef]
  32. Banerjee, S.; Ghosh, J.; Manchanda, R.; Dey, R.; Ramasubramanian, N.; Chowdhuri, M.B.; Patel, M.; Kumar, V.; Vasu, P.; Chattopadhyay, P.K.; et al. Observations of Hα emission profiles in Aditya tokamak. J. Plasma Fusion Res. 2010, 9, 29–32. [Google Scholar]
  33. Shukla, G.; Chowdhuri, M.B.; Shah, K.; Manchanda, R.; Mayya, K.B.K.; Ghosh, J.; Aditya-U Team. Plasma rotation measurement using UV and visible spectroscopy on Aditya-U tokamak. Rev. Sci. Instrum. 2018, 89, 10D132. [Google Scholar] [CrossRef] [PubMed]
  34. Shukla, G.; Shah, K.; Chowdhuri, B.M.; Raj, H.; Manchanda, R.; Nagora, U.C.; Tanna, R.L.; Jadeja, K.A.; Patel, K.; Atrey, P.K.; et al. Observation of toroidal plasma rotation reversal in Aditya-U tokamak. Accept. Nucl. Fusion 2019. [Google Scholar] [CrossRef]
  35. Tanna, R.L.; Ghosh, J.G.; Raj, H.; Kumar, R.; Aich, S.; Ranjan, V.; Jadeja, K.A.; Patel, K.M.; Bhatt, S.B.; Sathyanarayana, K.; et al. Plasma production and preliminary results from the Aditya Upgrade tokamak. Plasma Sci. Technol. 2018, 20, 074002. [Google Scholar] [CrossRef]
  36. Koubiti, M.; Nakano, T.; Capes, H.; Marendat, Y.; Mouret, L.; Rosato, J.; Stamm, R. Diagnostics of tokamak divertor plasmas by Stark broadening of impurity emission lines. In Proceedings of the 37th EPS Conference on Plasma Physics, Dublin, Ireland, 21–25 June 2010. [Google Scholar]
  37. Yadava, N.; Ghosh, J.; Chowdhuri, B.M.; Manchanda, R.; Punchithaya, K.S.; Dey, R.; Raj, H.; Banerjee, S.; Tanna, L.R.; Tanna, R.L.; et al. Observation of poloidal asymmetry in measured neutral temperatures in the Aditya-U tokamak plasma. Nucl. Fusion 2019, 59, 106003. [Google Scholar] [CrossRef]
  38. Condrea, I.; Haddad, E.; Gregory, B.C.; Abel, G. Local poloidal and toroidal rotation velocities and ion temperature in a tokamak plasma obtained with a matrix inversion method considering asymmetries. Phys. Plasmas 2000, 7, 3641–3653. [Google Scholar] [CrossRef]
  39. Bell, R.E. Inversion technique to obtain an emissivity profile from tangential line-integrated hard x-ray measurements. Rev. Sci. Instrum. 1995, 66, 558–560. [Google Scholar] [CrossRef]
Figure 1. The lines of sight (LoS) for poloidal rotation measurements on Aditya-U tokamak with an image of fibers on the charge coupled device (CCD) detector.
Atoms 07 00093 g001
Figure 2. Scheme of wavelength calibration for poloidal rotation measurement on Aditya-U tokamak.
Atoms 07 00093 g002
Figure 3. (a) Doppler shift measurement using C2+ spectra, solid and dot-dashed line represents unshifted and shifted wavelengths respectively, (b) Gaussian fitted Hg spectrum at 435.8 nm to obtain instrumental function.
Atoms 07 00093 g003
Figure 4. Time evolution of Aditya-U discharge for shot # 33057. (a) Plasma current (Ip in kA), (b) loop voltage (Vloop in V), (c) Hα emission (a.u.), (d) Soft X-ray emission (a.u.).
Atoms 07 00093 g004
Figure 5. (a) Space resolved spectra of C2+ for four tracks corresponding to four lines of sight and (b) total counts along each line of sight with respect to plasma minor radius.
Atoms 07 00093 g005
Figure 6. Radial profile of the carbon ion poloidal rotation velocity (km/s) along with the error bars for Aditya-U tokamak for (a) shot # 33057 and (b) shot # 33081.
Atoms 07 00093 g006
Figure 7. Doppler broadening measurement using C2+ spectra.
Atoms 07 00093 g007
Figure 8. Temporal profile of (a) poloidal rotation velocity (km/s) and (b) edge ion temperature (eV) measured at 21.55 cm of plasma minor radius for discharges # 33057 and 33081.
Atoms 07 00093 g008
Table 1. Aditya-U plasma and machine parameters.
Major radius (R)0.75 m
Minor radius (r)0.25 m
Toroidal magnetic field (BT)1.3–1.4 T
Plasma current (Ip) 120–140 kA
Safety factor (q)3.0–4.5
Loop voltage (Vloop)1.5–2.2 V
Table 2. Doppler shifts and velocities along with the error at different minor radii.
Minor Radius (cm)Doppler Shift (nm)Velocity (km/s)
11.550.0055 ± 0.000943.6 ± 0.60
14.550.0073 ± 0.001004.7 ± 0.64
18.550.0066 ± 0.001054.3 ± 0.67
21.550.0065 ± 0.001004.2 ± 0.64

