Fluorogenic and Bioorthogonal Modification of RNA Using Photoclick Chemistry


Institute of Organic Chemistry, Karlsruhe Institute of Technology (KIT), Fritz-Haber-Weg 6, 76131 Karlsruhe, Germany
*
Author to whom correspondence should be addressed.
Biomolecules 2020, 10(3), 480; https://doi.org/10.3390/biom10030480
Submission received: 2 March 2020
/
Revised: 16 March 2020
/
Accepted: 17 March 2020
/
Published: 21 March 2020
(This article belongs to the Special Issue Novel Approaches in Biomolecule Labeling)
Abstract
:A bromoaryltetrazole-modified uridine was synthesized as a new RNA building block for bioorthogonal, light-activated and postsynthetic modification with commercially available fluorescent dyes. It allows “photoclick”-type modifications by irradiation with light (300 nm LED) at internal and terminal positions of presynthesized RNA with maleimide-conjugated fluorophores in good yields. The reaction was evidenced for three different dyes. During irradiation, the emission increases due to the formation of an intrinsically fluorescent pyrazoline moiety as photoclick product. The fluorogenecity of the photoclick reaction was significantly enhanced by energy transfer between the pyrazoline as the reaction product (poor emitter) and the photoclicked dye as the strong emitter. The RNA-dye conjugates show remarkable fluorescent properties, in particular an up to 9.4 fold increase of fluorescence, which are important for chemical biology and fluorescent imaging of RNA in cells.
1. Introduction
Bioorthogonal reactions are widely employed for the labeling of biomolecules, including proteins, carbohydrates and nucleic acids, with fluorescent markers and probes [1,2,3]. The widely used Cu(I)-catalyzed azide-alkyne cycloaddition (CuAAC) offers not only a broad substrate scope, but also high selectivity and fast reaction kinetics [4,5]. Although a huge variety of modifications of biomolecules by CuAAC have been reported based on Cu-chelating ligands [6], and even a few in living cells, the use of copper(I) is problematic because of its cytotoxicity, and therefore alternatives are needed [7,8,9]. Considering the reaction kinetics, both (i) the inverse electron-demand Diels-Alder reaction (iEDDA) between 1,2,4,5-tetrazines [10,11] or 1,2,4-triazines [12] and strained olefins or alkynes, and (ii) the photoclick reaction between in situ generated nitrile-imines and electron-deficient alkenes offer second order rate kinetics that are comparable to CuAAC [13,14].
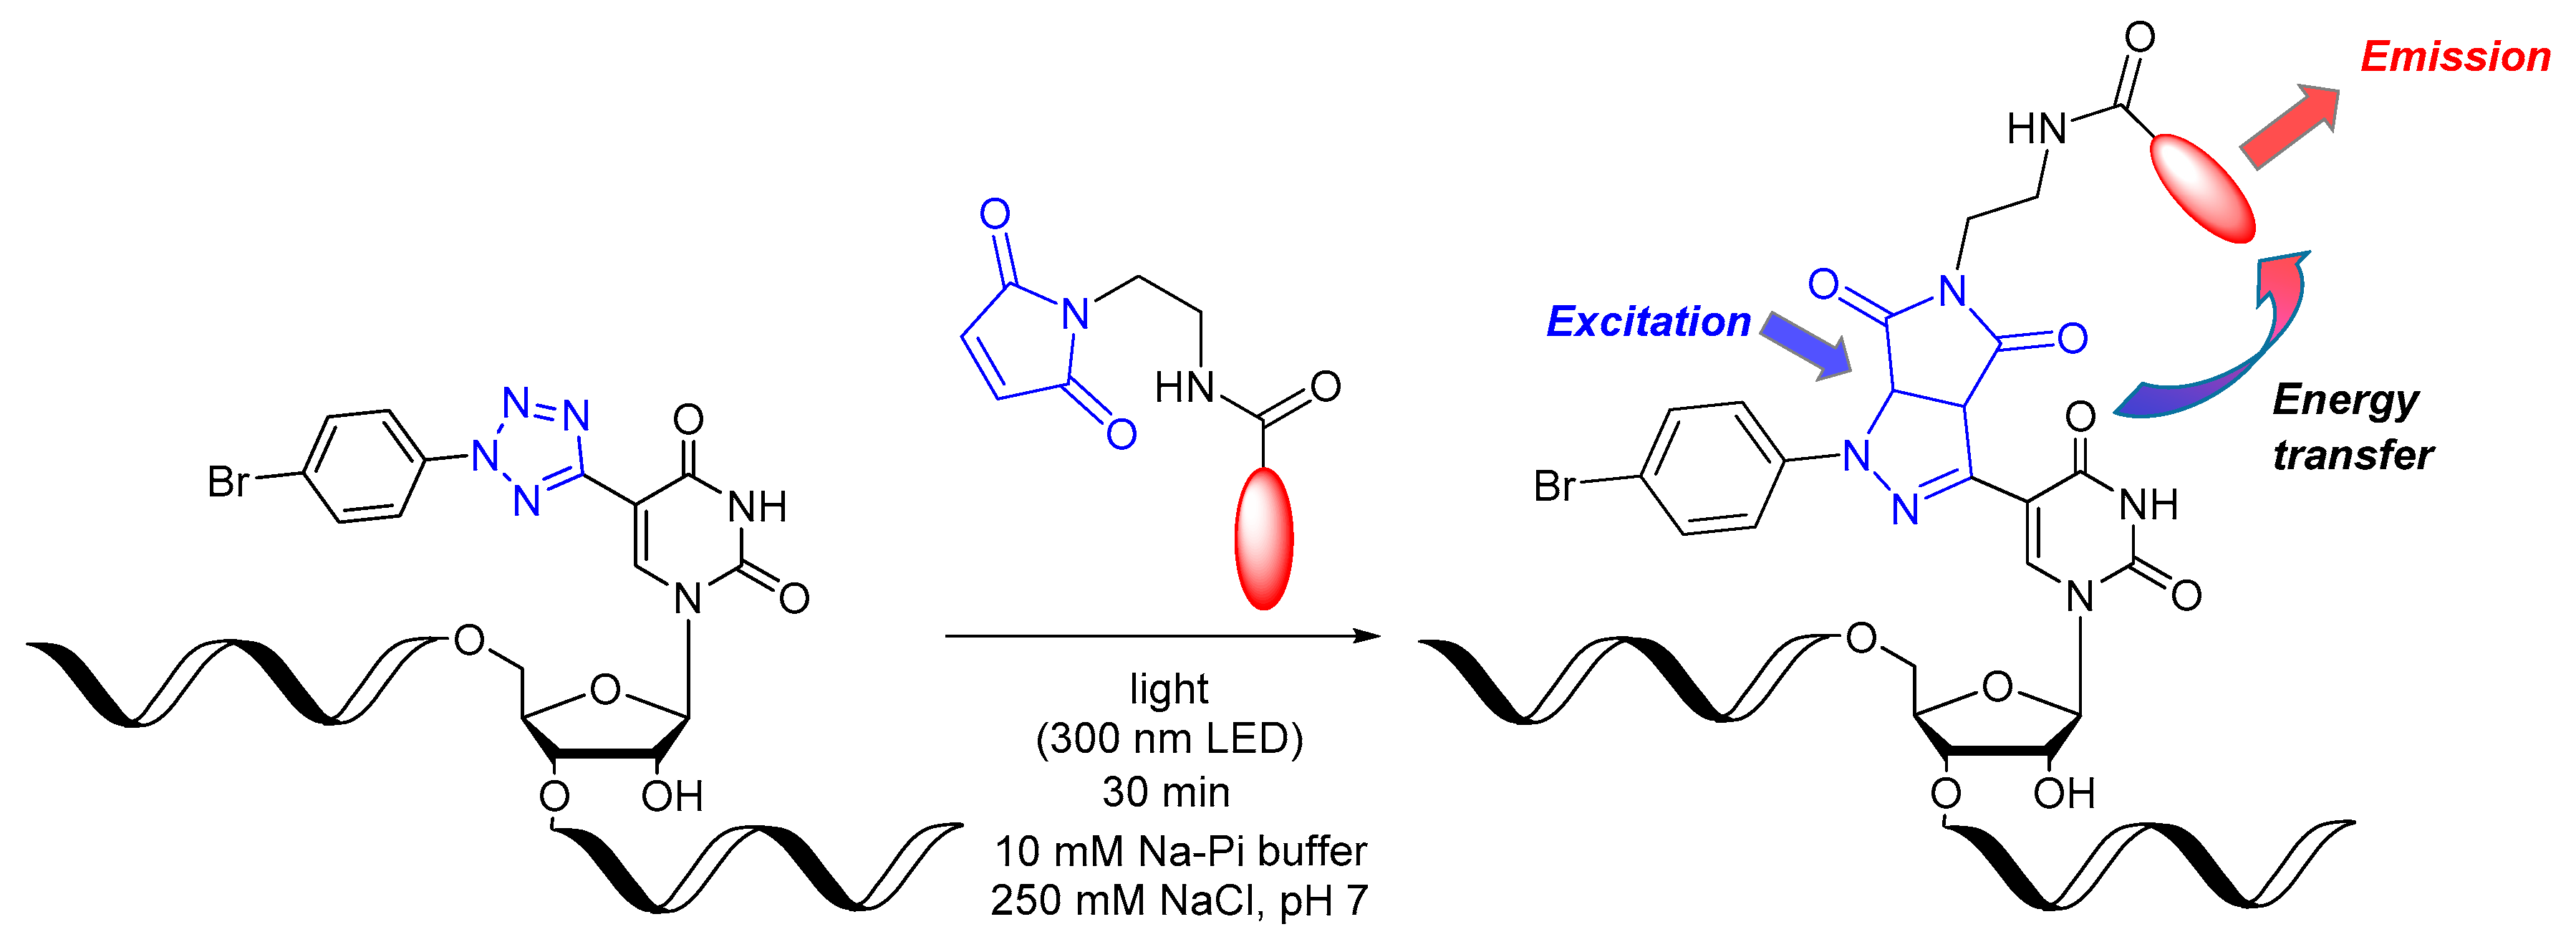
The great advantage of the photoclick reaction compared to iEDDA reactions is the spatiotemporal control by the use of light to initiate the reaction [15,16]. An additional and important characteristic of the photoclick reaction is the intrinsic fluorogenecity of the reaction (Figure 1). Fluorogenecity is an increasingly important feature of bioorthogonal labeling strategies that allows to reduce undesired background fluorescence by using light-up probes [16]. This is particularly important if molecular imaging is performed not only with fixed cells but also with living cells, because excess dye labels cannot be simply washed away [17,18]. During irradiation, the emission increases due to the formation of an intrinsically fluorescent pyrazoline moiety as photoclick product. This work focuses on enhancing the fluorogenic properties of the photoclick reaction by energy transfer between the pyrazoline as the reaction product, which is a poor emitter, and the photoclicked dye as the strong emitter. Recently, our group reported such photoclick reactions on tetrazole-modified DNA, whereas this work focuses on the modification of RNA single strands [19]. We present herein the new phosphoramidite 9 as a synthetic RNA building block, its incorporation in two RNA sequences by automated solid-phase chemistry, and its photochemical evaluation for fluorogenic modification at internal and terminal positions in single-stranded RNA using three different commercially available dyes.
2. Materials and Methods
General
All Reagents were purchased from commercial sources and used without further purification. The compounds were purified via silica gel column chromatography (230–400 mesh). The completion of the reactions was monitored via t.l.c. on silica gel F254-coated plates and under a 254 nm lamp. Nucleosides were stained with 3% H2SO4 in methanol followed by heating with a heat gun. 1H and 13C-NMR spectra were recorded either on a Bruker Ascend 500 MHz or Bruker Ascend 400 MHz spectrometer in DMSO-d6. Chemical shifts δ are given in ppm relative to tetramethylsilane, the spectra were referenced to the solvent peak (DMSO-d6, 2.50 ppm). Coupling constants J are given in Hz. For multiplicities, the following abbreviations are used: s (singlet), d (doublet), dd (doublet of doublets), ddd (doublet of doublets of doublets), t (triplet), dt (doublet of triplets), q (quartet), m (multiplet).
Oligonucleotide synthesis was performed on a H-6 synthesizer by K&A Laborgeräte (Schaafheim, Germany), the coupling time of the artificial building block was increased to 24 min. After cleavage, the oligonucleotides were purified on a semi-preparative reversed-phase HPLC system (RP-C18 column, A = NH4HCO3 buffer, B = acetonitrile). The purified oligonucleotide strands were quantified photometrically using a NanoDrop ND-1000 spectrometer and the extinction coefficient of the strands (ε260 = 165 807 L mol−1 cm−1). Photoclicked oligonucleotides were purified via illustraTM NAP-5 columns (GE Healthcare, Chicago, USA) to remove excess dyes. MS were measured on a Shimadzu Axima Confidence using 3-hydroxypicolinic acid as matrix substance. Irradiation experiments were performed in 10 mm quartz glass cuvettes and irradiated with 300 nm LEDs for defined time spans in 10 mM Na-Pi buffer, 250 mM NaCl with 2.5 μM RNA and 3.75 μM dye-maleimide conjugates at 20 °C. Spectroscopic measurements were carried out on a Cary 100 Scan UV/vis spectrometer by Varian and a Fluoromax-4 spectrofluorometer by Horiba Jobin-Yvon (Kyoto, Japan).
Synthesis of compound 2
To a stirred solution of 5-hydroxyuracil [20] (1.41 g, 9.91 mmol; 1.00 equiv.) and β-D-ribofuranose 1-acetate 2,3,5-tribenzoate (5.00 g, 9.91 mmol, 1.00 eq) in anhydrous acetonitrile (50 mL), N,O-bistrimethylsilyl acetamide (6.05 g, 29.7 mmol; 3.00 equiv.) was added. The solution was stirred for 30 min at 60 °C. Trimethylsilyl trifluoromethanesulfonate (7.71 g, 34.7 mmol; 3.50 equiv.) was added and the reaction mixture was stirred for 2 h at 60 °C. After dilution with ethyl acetate (200 mL), the solution was washed with water (3 × 300 mL) and brine (100 mL). The organic phase was dried over sodium sulfate and concentrated under vacuum. After flash chromatography (dichloromethane/methanol 40:1 – 20:1), the product was obtained as a white foam (4.07 g; 70%). Rf (dichloromethane/methanol 19:1) = 0.26. 1H-NMR (400 MHz, DMSO, Figure S1) δ = 11.55 (s, 1H), 8.02 (dd, J = 8.2, 1.4 Hz, 2H), 7.93 – 7.85 (m, 4H), 7.74 (t, J = 1.2 Hz, 1H), 7.69 – 7.61 (m, 3H), 7.51 (t, J = 7.8 Hz, 2H), 7.44 (td, J = 7.7, 3.7 Hz, 4H), 6.28 – 6.22 (m, 1H), 5.95 – 5.90 (m, 2H), 5.03 (t, J = 5.4 Hz, 1H), 4.75 (dt, J = 5.5, 2.7 Hz, 1H), 4.67 (t, J = 4.1 Hz, 2H), 4.19 – 4.09 (m, 2H). 13C-NMR (101 MHz, DMSO, Figure S2) δ = 165.5, 164.7, 164.6, 162.6, 150.3, 138.2, 133.9, 133.8, 133.5, 129.3, 129.3, 129.2, 128.8, 128.7, 128.6, 128.5, 114.8, 89.5, 78.7, 73.1, 70.5, 63.7, 55.9. HRMS (FAB, Figures S3 and S4): Calcd. for C31H27O10N2 [MH]+: 587.1666, found: 587.1667.
Synthesis of compound 3
2 (2.33 g, 3.97 mmol; 1.00 equiv.) was dissolved in dichloromethane (150 mL). Dess-Martin Periodinane (15% w/w in dichloromethane, 9.90 mL, 13.5 g, 4.77 mmol, 1.20 equiv.) was added. The reaction mixture was stirred at r.t. for 2 h and filtered. The solvent was evaporated under reduced pressure and the crude product purified via flash chromatography (dichloromethane/methanol 60:1). The product was obtained as a white foam (1.68 g, 72%) Rf (dichloromethane/methanol 19:1) = 0.37. 1H-NMR (400 MHz, DMSO, Figure S5) δ = 11.98 (s, 1H), 9.75 (s, 1H), 8.59 (s, 1H), 8.04 – 7.97 (m, 2H), 7.89 (ddd, J = 16.4, 8.3, 1.4 Hz, 4H), 7.68 – 7.60 (m, 3H), 7.51 – 7.40 (m, 6H), 6.29 (d, J = 3.5 Hz, 1H), 6.03 (dd, J = 6.3, 3.5 Hz, 1H), 5.97 (t, J = 6.5 Hz, 1H), 4.80 (ddd, J = 6.5, 5.1, 3.5 Hz, 1H), 4.73 – 4.63 (m, 2H). 13C-NMR (101 MHz, DMSO, Figure S6) δ = 186.2, 165.5, 164.6, 164.5, 161.7, 149.4, 148.5, 133.9, 133.8, 133.5, 129.4, 129.3, 129.1, 128.8, 128.7, 128.6, 128.5, 111.1, 90.9, 79.3, 73.8, 70.1, 63.4. HRMS (FAB, Figures S7 and S8): Calcd. for C31H25O10N2 [MH]+: 585.1509, found: 585.1508.
Synthesis of compound 4
3 (1.68 g, 2.87 mmol; 1.00 equiv.) and benzenesulfonyl hydrazide (494 mg, 2.87 mmol; 1.00 equiv.) were dissolved in dichloromethane (100 mL) and stirred for 2 h at 40 °C. The reaction mixture was concentrated under reduced pressure and purified via column chromatography (dichloromethane/methanol 40:1). The product was obtained as a white foam (1.74g, 82%). Rf (dichloromethane/methanol 19:1) = 0.28. 1H-NMR (400 MHz, DMSO, Figure S9) δ = 11.88 (s, 1H), 11.45 (s, 1H), 8.21 (s, 1H), 8.00 – 7.96 (m, 2H), 7.93 – 7.86 (m, 6H), 7.81 (s, 1H), 7.67 – 7.54 (m, 6H), 7.50 – 7.40 (m, 6H), 6.28 (d, J = 3.2 Hz, 1H), 6.03 (dd, J = 6.4, 3.2 Hz, 1H), 5.97 (t, J = 6.6 Hz, 1H), 4.76 (td, J = 6.0, 3.7 Hz, 1H), 4.67 (qd, J = 12.0, 4.7 Hz, 2H). 13C-NMR (101 MHz, DMSO, Figure S10) δ = 165.5, 164.7, 164.6, 161.9, 149.5, 140.3, 140.0, 139.0, 138.2, 133.9, 133.8, 133.5, 133.0, 132.6, 129.4, 129.3, 129.2, 129.2, 129.0, 128.7, 128.7, 128.6, 128.6, 127.6, 127.2, 107.9, 92.0, 79.0, 73.6, 70.5, 63.7. HR-MS (FAB, Figures S11 and S12) Calcd. for C37H31O11N4S1 [MH]+: 739.1710, found: 739.1709.
Synthesis of compound 5
4 (890 mg 1.20 mmol; 1.00 equiv.) was dissolved in pyridine (50 mL) and cooled to -15 °C. 4-Bromobenzenediazonium tetrafluoroborate (489 mg, 1.81 mmol; 1.50 equiv.) was added and the reaction mixture was stirred for 30 min. It was diluted with dichloromethane (100 mL) and washed 3 times with 1 M hydrochloric acid, 2 times with water and once with brine. After the organic phase was dried over sodium sulfate and evaporated under reduced pressure, the crude product was redissolved in dichloromethane (5 mL) and precipitated by addition of n-hexane (200 mL). The precipitation was repeated, until no further precipitation occurred. The product was obtained as a pale orange powder (451 mg, 48%). Rf (dichloromethane/methanol 19:1) = 0.51. 1H-NMR (400 MHz, DMSO, Figure S13) δ = 12.01 (s, 1H), 8.68 (s, 1H), 8.00 – 7.91 (m, 6H), 7.90 – 7.86 (m, 4H), 7.65 (dt, J = 11.1, 7.5 Hz, 2H), 7.52 – 7.41 (m, 5H), 7.34 (t, J = 7.7 Hz, 2H), 6.36 (d, J = 3.8 Hz, 1H), 6.06 (dd, J = 6.2, 3.8 Hz, 1H), 6.02 (t, J = 6.2 Hz, 1H), 4.84 (dt, J = 6.3, 3.9 Hz, 1H), 4.74 (dd, J = 12.3, 3.3 Hz, 1H), 4.65 (dd, J = 12.3, 4.6 Hz, 1H). 13C-NMR (101 MHz, DMSO, Figure S14) δ = 165.5, 164.6, 164.6, 159.8, 159.5, 149.6, 143.3, 135.2, 133.9, 133.8, 133.3, 133.1, 129.4, 129.3, 129.2, 129.0, 128.8, 128.7, 128.6, 128.5, 122.9, 121.7, 102.1, 89.9, 79.4, 73.9, 70.3, 63.6. HRMS (FAB, Figures S15 and S16): Calcd. for C37H28O9N6Br [MH]+: 779.1101, found: 779.1102.
Synthesis of compound 6
In a pressure tube, 5 (385 mg, 0.494 mmol; 1.00 equiv.) was suspended in 7M ammonia in methanol (50 mL) and stirred at 80 °C for 24 h. The solvent was removed under reduced pressure and the crude product was purified via flash chromatography (dichloromethane/methanol 10:1). The product was obtained as a white powder (150 mg; 65%). Rf (dichloromethane/methanol 9:1) = 0.18. 1H-NMR (500 MHz, DMSO, Figure S17) δ = 11.83 (s, 1H), 8.88 (s, 1H), 8.08 – 8.04 (m, 2H), 7.91 – 7.87 (m, 2H), 5.86 (d, J = 4.5 Hz, 1H), 5.51 (d, J = 5.3 Hz, 1H), 5.18 (t, J = 4.7 Hz, 1H), 5.13 (d, J = 5.4 Hz, 1H), 4.14 (q, J = 4.9 Hz, 1H), 4.03 (q, J = 5.0 Hz, 1H), 3.92 (dt, J = 5.0, 2.6 Hz, 1H), 3.69 (ddd, J = 11.9, 4.7, 2.8 Hz, 1H), 3.59 (ddd, J = 12.0, 4.6, 2.7 Hz, 1H). 13C-NMR (126 MHz, DMSO, Figure S18) δ = 160.0, 159.9, 150.0, 142.6, 135.3, 133.1, 123.0, 121.8, 101.7, 88.7, 84.8, 74.2, 69.5, 60.3. HRMS (FAB Figures S19 and S20): Calcd. for C16H16O6N6Br [MH]+: 467.0315, found: 467.0314.
Synthesis of compound 7
6 (315 mg, 0.674 mmol; 1.00 equiv.) was dissolved in anhydrous DMF (5 mL). 4,4′-Dimethoxytrityl chloride (228 mg, 0.674 mmol; 1.00 equiv.) and silver(II) nitrate (114 mg, 0.674 mmol, 1.00 equiv.) were added and the reaction mixture was stirred for 2 h at r.t. The solvent was evaporated under reduced pressure and the crude product purified via column chromatography (dichloromethane/methanol 50:1 → 20:1 + 0.1 % triethylamine). The pure product was obtained as a white powder (315 mg; 61%). Rf (dichloromethane/methanol 20:1) = 0.22. 1H-NMR (500 MHz, DMSO, Figure S20) δ = 11.87 (s, 1H), 8.44 (s, 1H), 7.73 – 7.68 (m, 2H), 7.67 – 7.63 (m, 2H), 7.33 (dd, J = 8.5, 1.3 Hz, 2H), 7.25 – 7.18 (m, 4H), 7.15 (t, J = 7.8 Hz, 2H), 7.07 – 7.02 (m, 1H), 6.71 (d, J = 8.9 Hz, 4H), 5.82 (d, J = 3.4 Hz, 1H), 5.65 (d, J = 5.0 Hz, 1H), 5.16 (d, J = 6.3 Hz, 1H), 4.24 (td, J = 5.0, 3.4 Hz, 1H), 4.18 – 4.12 (m, 1H), 4.06 (dt, J = 6.2, 2.9 Hz, 1H), 3.63 (d, J = 2.0 Hz, 6H), 3.23 (d, J = 3.3 Hz, 2H). 13C-NMR (126 MHz, DMSO, Figure S21) δ 160.1, 159.4, 157.8, 149.8, 149.6, 144.4, 141.3, 135.5, 135.3, 135.0, 132.7, 129.5, 129.5, 127.6, 127.6, 126.5, 123.9, 122.5, 121.5, 112.9, 112.9, 101.7, 89.7, 85.7, 82.6, 74.1, 69.2, 62.5, 54.8, 54.8. MS (MALDI-TOF, Figure S22): Calcd. for C37H32BrN6NaO8 [M+Na]+: 790.1363, found: 789.43.
Synthesis of compound 8
In a brown glass flask, 7 (500 mg, 0.649 mmol; 1.00 equiv.) was dissolved in anhydrous tetrahydrofuran (5 mL). Silver (II) nitrate (143 mg, 0.844 mmol; 1.30 equiv.) and anhydrous pyridine (209 μL, 206 mg; 2.60 mmol; 4.00 equiv.) were added and stirred for 20 min under exclusion of light. tert-Butyldimethylsilyl chloride (137 mg, 0.909 mmol; 1.40 equiv.) were added and the reaction mixture was stirred at r. t. for 6 h. The solution was diluted with ethyl acetate (20 mL) and filtrated. The solvent was removed under reduced pressure and the crude product was purified via column chromatography (dichloromethane/methanol 50:1 → 30:1 + 0.1 % triethylamine). The product was obtained as a white powder (125 mg; 36%). Rf (dichloromethane/methanol 20:1) = 0.27. 1H-NMR (500 MHz, DMSO, Figure S24) δ = 11.90 (s, 1H), 8.48 (s, 1H), 7.71 – 7.67 (m, 2H), 7.65 – 7.60 (m, 2H), 7.36 – 7.31 (m, 2H), 7.21 (dd, J = 10.8, 8.9 Hz, 4H), 7.13 (t, J = 7.7 Hz, 2H), 7.07 – 7.02 (m, 1H), 6.71 (d, J = 2.5 Hz, 2H), 6.69 (d, J = 2.6 Hz, 2H), 5.80 (d, J = 3.1 Hz, 1H), 5.20 (d, J = 6.0 Hz, 1H), 4.37 (dd, J = 4.5, 3.1 Hz, 1H), 4.18 – 4.12 (m, 1H), 4.10 (dt, J = 6.2, 2.6 Hz, 1H), 3.63 (s, 3H), 3.62 (s, 3H), 3.25 (s, 2H), 0.89 (s, 9H), 0.13 (s, 3H), 0.10 (s, 3H). 13C-NMR (126 MHz, DMSO, Figure S25) δ = 160.0, 159.3, 157.8, 157.8, 149.7, 144.4, 140.9, 135.4, 135.2, 135.0, 132.6, 129.5, 129.5, 127.6, 127.5, 126.5, 122.5, 121.5, 112.9, 112.9, 101.7, 89.7, 85.8, 82.5, 76.3, 69.0, 62.2, 54.8, 54.8, 25.7, 18.0, -3.2, -4.7, -5.0. HRMS (FAB, Figures S26 and S27): Calcd. for C43H47O8N6BrSi [M]+: 882.2408, found: 882.2411.
Synthesis of compound 9
8 (120 mg 0.135 mmol: 1.00 equiv.) was lyophilized out of benzene, then dissolved in anhydrous dichloromethane (4 mL). Diisopropylethyl amine (71 μL, 0.407 mmol; 3.00 equiv.) and 2-cyanoethyl-N,N-diisopropylchlorophoshoramidite (45 μL, 0.204 mmol; 1.50 eq) were added and stirred for 6 h at r.t.. The crude product was purified via column chromatography (dichloromethane/acetone 5:1 + 0.1% triethylamine). The product was obtained as a white powder (131 mg; 87%). Rf (dichloromethane/acetone 5:1) = 0.28. 31P-NMR (202 MHz, DMSO, Figure S28) δ = 148.89, 148.74. MS (MALDI-TOF, Figure S29): Calcd. for C52H64O9N8BrP [M+Na]+: 1105.39, found: 1105.10.
3. Results and Discussion
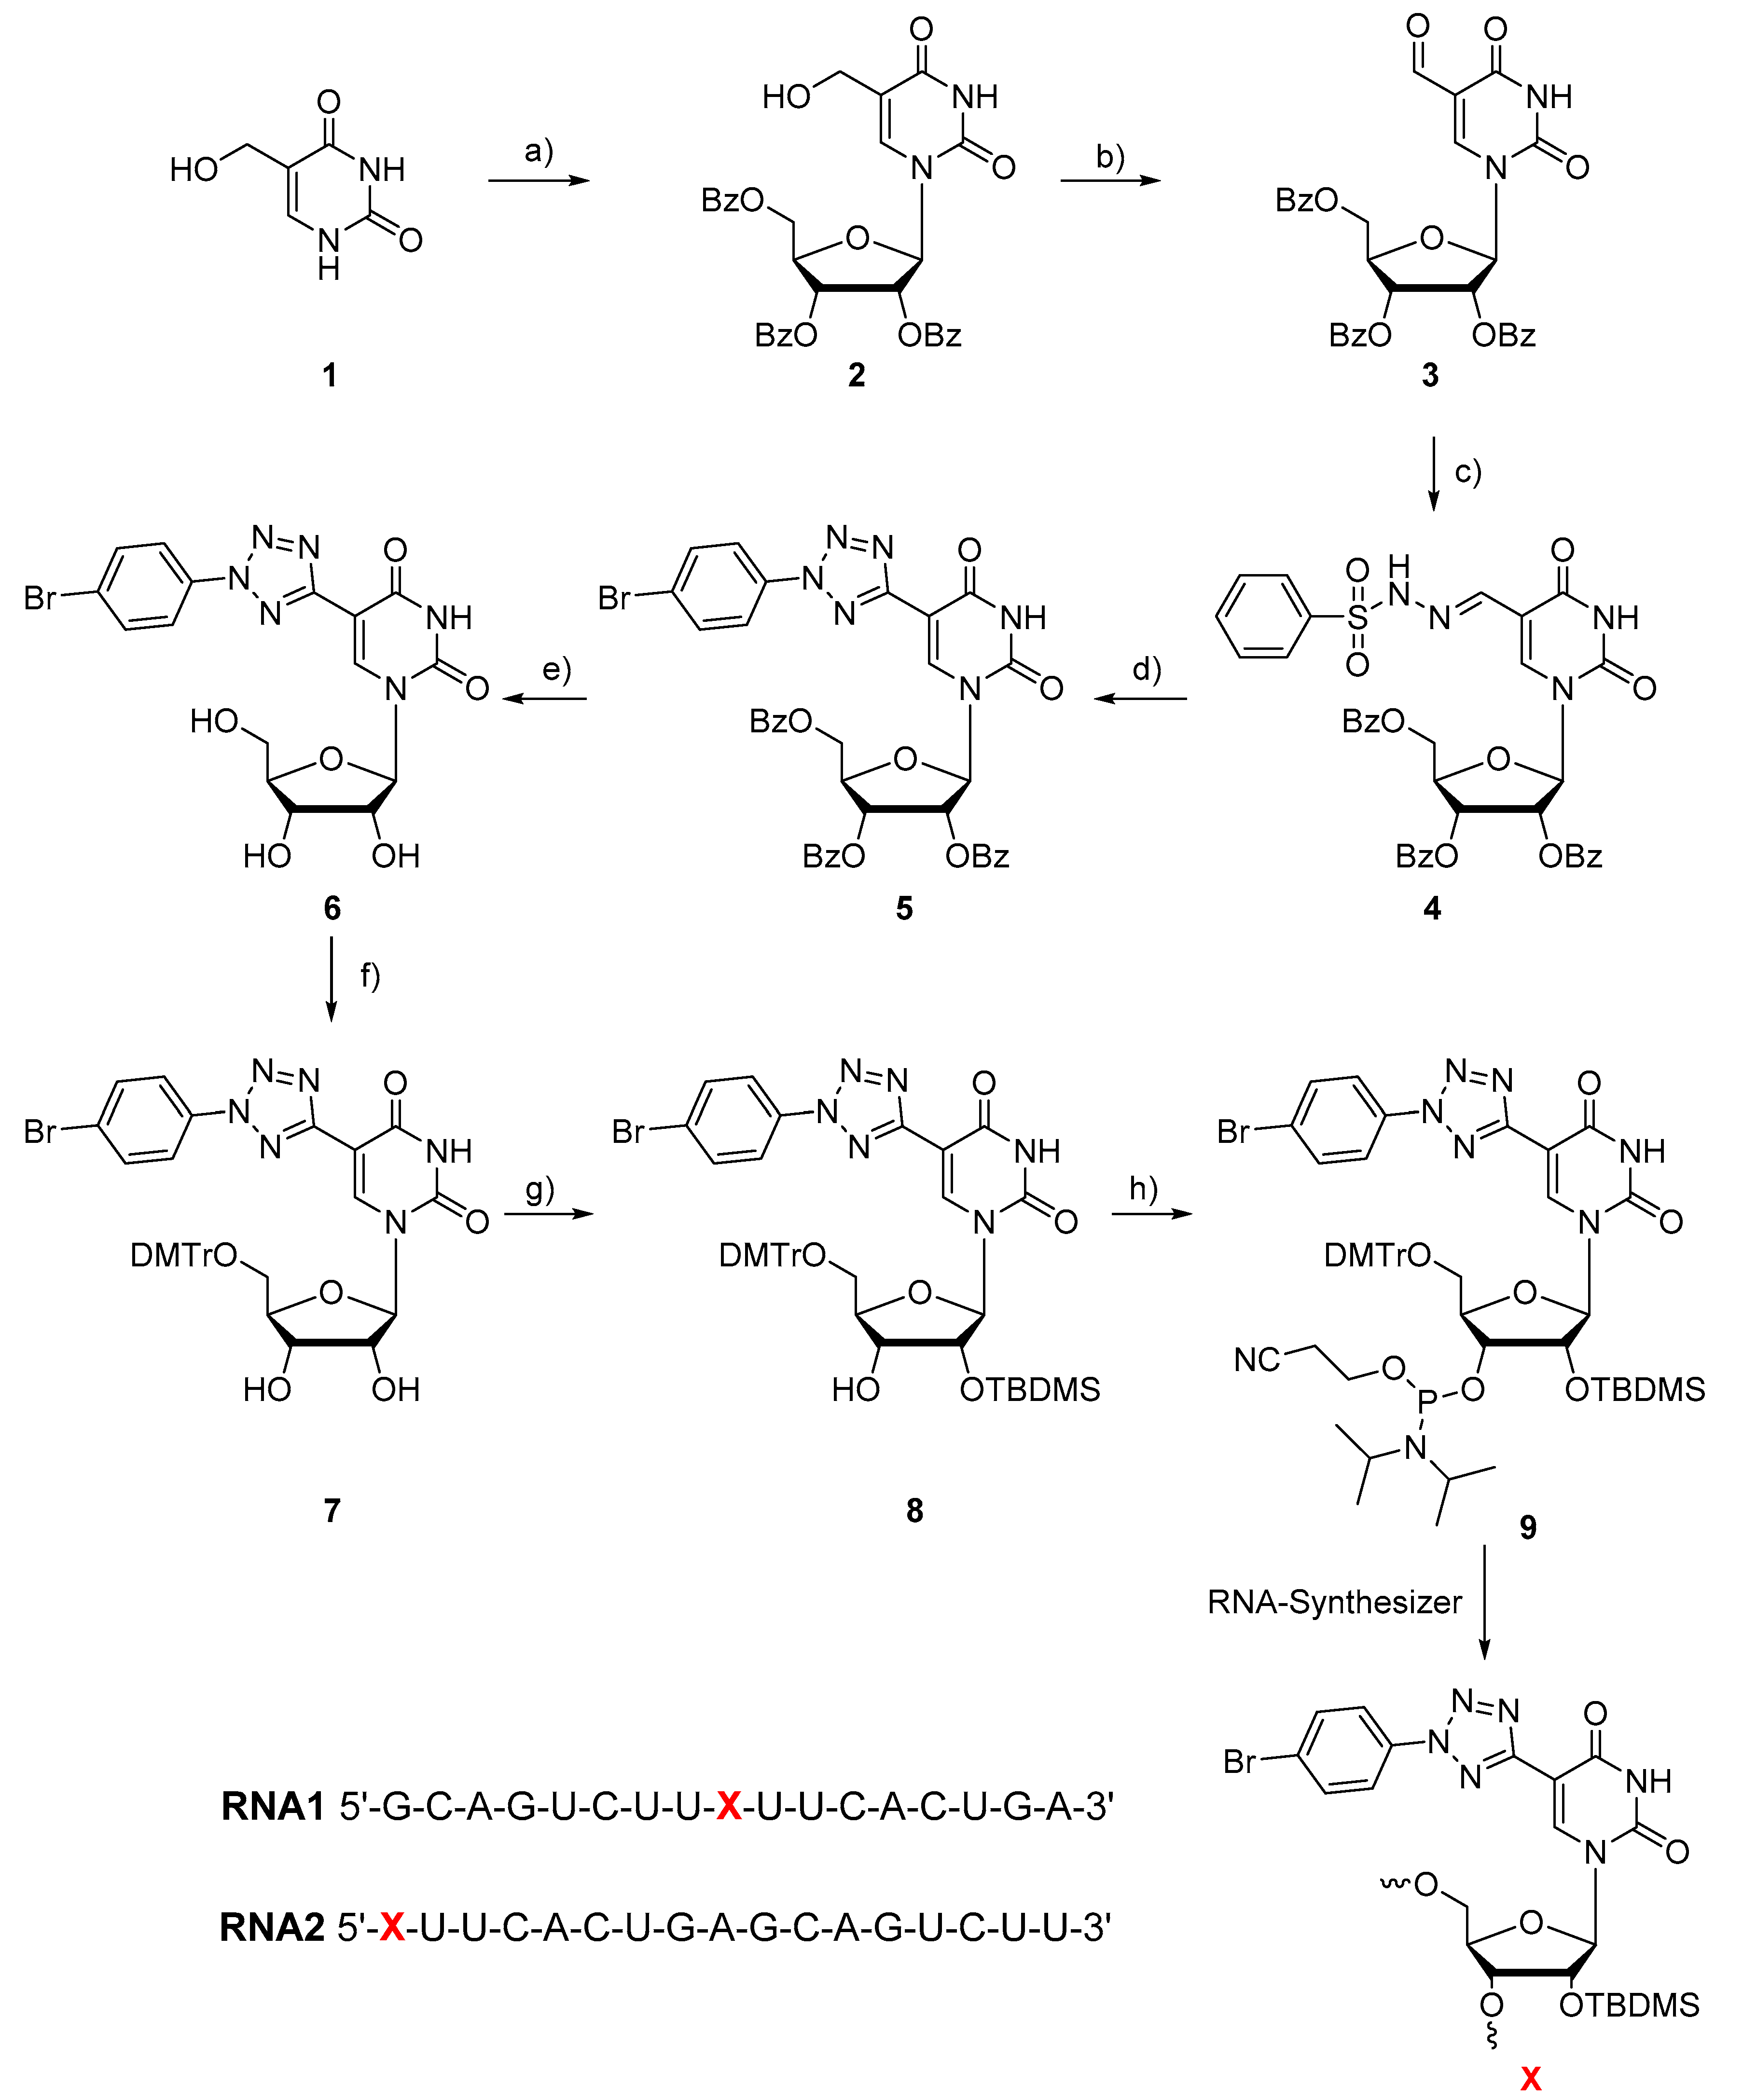
In principle, diaryltetrazoles are chemically stable but they are also bioorthogonally reactive groups when excited by UV-B light [21]. The RNA building block 9 bears the reactive tetrazole at its position 5. In order to keep the modified nucleotide as small as possible the uracil moiety replaces one of the aryl groups of conventional diaryltetrazoles. The bromo substituent at the opposite aryl group is needed for efficient photoclick chemistry [19] presumably by its heavy-atom effect on populating the photochemically active triplet state [22]. The synthetic route (Scheme 1) was adapted from the synthesis of a similar 2′-deoxyuridine building block for DNA recently published by our group [19] but contains improved synthetic procedures and a different protection scheme due to the presence of the 2′-hydroxy group. Accordingly, the 2′,3′,5′-tribenzoyl-protected 5-hydroxymethyluridine (2) was synthesized by coupling 5-hydroxymethyluracil that was prepared following published procedures [20] with the commercially available 1-acetate-2,3,5-tribenzoate of β-D-ribofuranoside using modified Vorbrüggen conditions in 70% yield [23]. The 5-hydroxymethyl group was oxidized by Dess-Martin periodinane in 72% yield [24]. The conversion of the aldehyde moiety of 3 to the hydrazone 4 was achieved in 82% yield by treatment with benzenesulfonyl hydrazide [25]. Upon addition of the commercially available 4-bromobenzenediazonium tetrafluoroborate, the tetrazole 5 was formed in 48% yield [25]. The next steps comprised the deprotection of all benzoyl groups of 5 by 7 M ammonia in methanol to obtain nucleoside 6, selective protection of the 5′-hydroxy group of 6 by the dimethoxytrityl group to get nucleoside 7, and protection of the 2′ group of 7 with a tert-butyldimethyl silyl group. The latter reaction gave nucleoside 8 in 36% yield using silver nitrate as catalyst [26]. Finally, the hydroxy group at the 3′-position of 8 was phosphitylated by 2-cyanoethyl N,N-diisopropylchlorophosphoramidite to yield the final RNA phosphoramidite 9. The RNA building block 9 was then incorporated via solid-phase synthesis into two different RNA sequences with the tetrazole moiety either at an internal (RNA1) or at a 5′-terminal position (RNA2) of the sequences. The synthesized oligonucleotide strands were purified by semi-preparative HPLC, identified by MALDI-TOF mass spectrometry and quantified by their UV/vis absorbance at 260 nm.
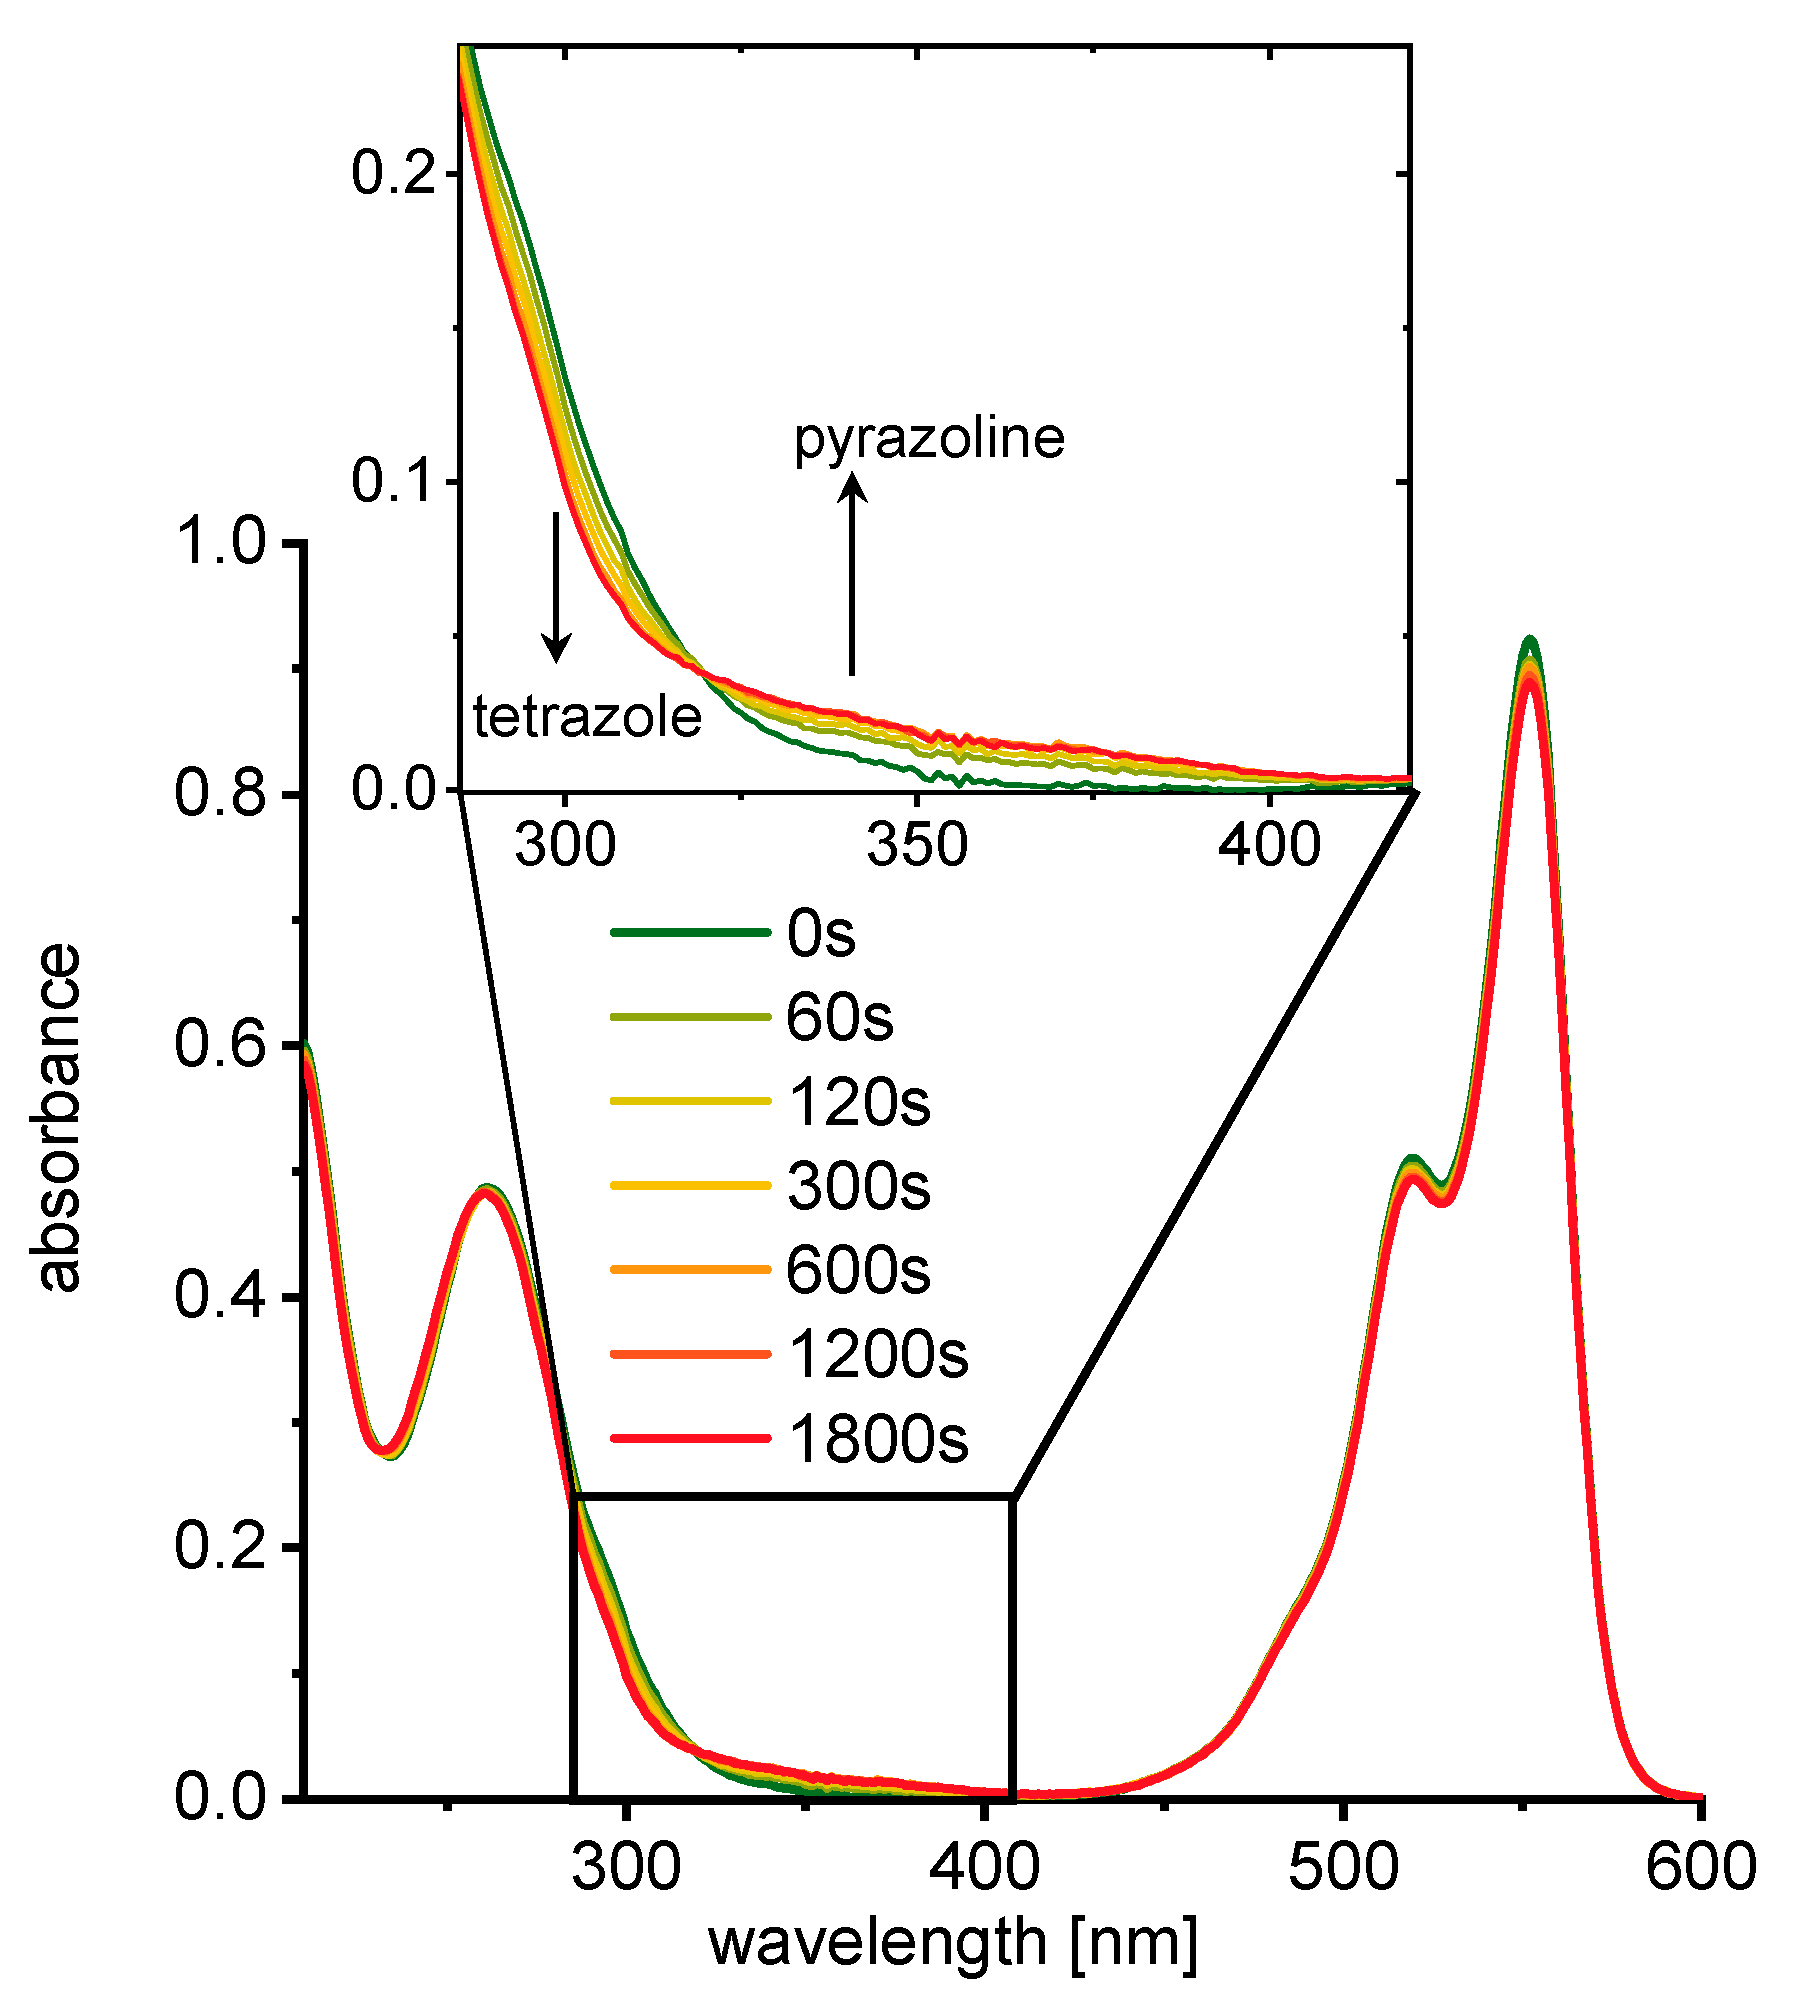
As reaction partners for the photoclick labeling of RNA1 and RNA2, three commercially available maleimide-dye conjugates were chosen, including sulfo-Cy3 (Cy3), AlexaFluor555 (AF555) and AlexaFluor647 (AF647). During the 30 min reaction course, the UV/Vis absorbance and fluorescence changes were recorded (representatively shown for RNA1 and the AF555 modification in Figure 2, for the others see Figures S31–S41). The tetrazole absorbance is visible as tailing side band at 300 nm, which is at the border of the strong RNA absorbance. According to these measured UV/Vis spectra, 300 nm light from the appropriate LED was chosen to induce the photoclick reaction. The RNA building block 6 has an extinction coefficient of ε300=20.300 M−1cm−1 which is significantly larger compared to the extinction coefficients of the natural RNA components A, C, G and U (ε300=60–260 M−1 cm−1, see Supporting Information). Accordingly, in RNA1 and RNA2 the excitation selectivity for the tetrazole at 300 nm is approximately 10:1 that excludes an inner filter effect by the RNA. In the presence of 1.5 equiv. of the dye-maleimide conjugate, a new and broad band between 320 and 420 nm is formed, which can be assigned to the pyrazoline moiety formed in the RNA product, whereas the tetrazole absorbance between 280 and 320 nm concomitantly decreases. The UV/Vis spectra show distinct isosbestic points that indicate the clean conversions from the tetrazoles to the pyrazolines in all cases without the formation of a long-living intermediate. According to these UV/Vis absorbance changes, the reaction is finished after 30 min irradiation.
The oligonucleotide products were evidenced by MALDI-TOF mass spectrometric analysis (Figures S42–S53). After chromatographic removal of excess and unreacted dyes (see SI for experimental details and Figures S54–S57) the sample concentrations were calculated based on their UV/Vis absorbances. The yields of the postsynthetic photoclick modifications were determined for each sample separately after the purification (The Cy3-conjugates show the lowest yields of 27% for RNA1 and 31% for RNA2, albeit its strong increase in fluorescence (vide infra). Exemplarily, the photoclick conjugation was repeated with 10.0 equiv. of the Cy3-maleimide and RNA2 to determine whether the yield could be further enhanced. In fact, the yield of this irradiation reaction was 70%, which of course caused a remarkably higher fluorescence. With respect to potential cell experiments, however, such an excess of dye might be critical due to the high background fluorescence of the dye. The highest yields of 78% for RNA1 and 84% for RNA2 could be achieved by reaction with the AF555 maleimide (1.50 equiv.), although these samples display the lowest absolute fluorescence (see Figures S38 and S40 and Table 1). The Cy3-conjugates show the lowest yields of 27% for RNA1 and 31% for RNA2, albeit its strong increase in fluorescence (vide infra). Exemplarily, the photoclick conjugation was repeated with 10.0 equiv. of the Cy3-maleimide and RNA2 to determine whether the yield could be further enhanced. In fact, the yield of this irradiation reaction was 70%, which of course caused a remarkably higher fluorescence. With respect to potential cell experiments, however, such an excess of dye might be critical due to the high background fluorescence of the dye. The highest yields of 78% for RNA1 and 84% for RNA2 could be achieved by reaction with the AF555 maleimide (1.50 equiv.), although these samples display the lowest absolute fluorescence (see Figures S38 and S40).
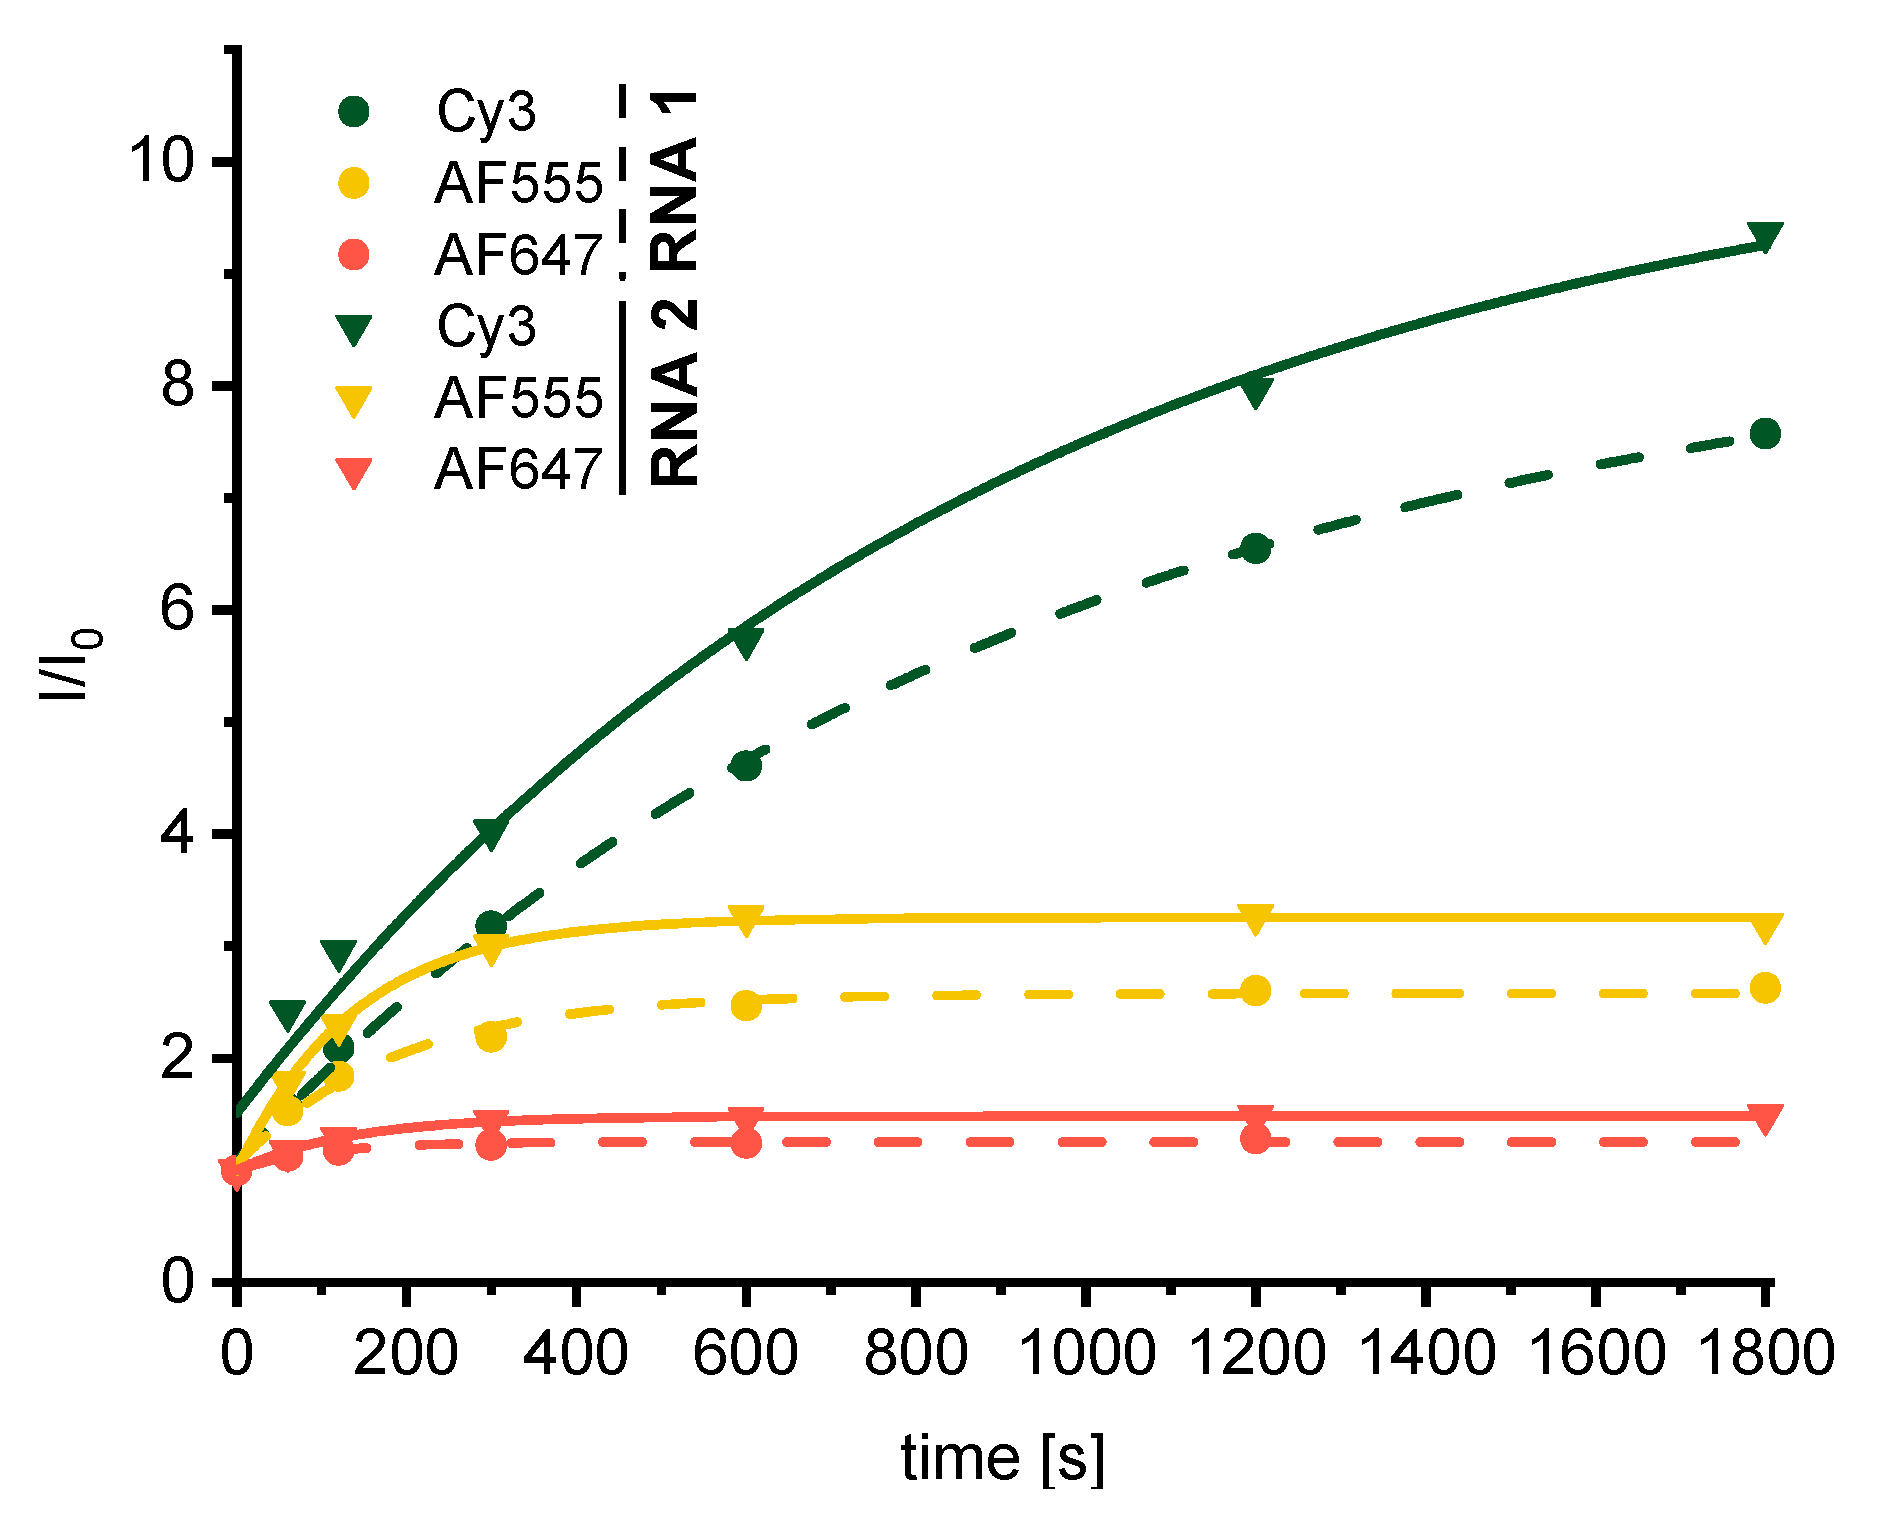
The excitation of the fluorescence was set to 358 nm, which is close to the absorption maximum of the pyrazoline moiety. The extinction of the applied dyes Cy3, AF647 and AF555 is very low at 358 nm, which nearly completely eliminates direct excitation of these dyes. Thus, the observed fluorescence can be assigned to the pyrazoline as direct photoclick product and the attached dyes that were coupled to the RNA and light up as a result of the energy transfer from the pyrazoline chromophore to these dyes. The recorded fluorescence spectra during the irradiations (Figure 3) show only minor increases of fluorescence intensity between 400 and 500 nm, which is the characteristic emission range of the pyrazoline chromophore, but strong increases of fluorescence intensity in the emission range of the attached dyes (with maxima at 564 nm for Cy3, 666 nm for AF647 and 565 nm for AF555). Based on the assumption that direct excitation of these dyes can be excluded, as mentioned above, this result clearly evidences the energy transfer between the pyrazoline and the dyes [19]. However, the gain of fluorescence intensity strongly depends on both the type of fluorophore (Cy3, AF647, AF655) and the position of the photoclick modification in the RNA strand (terminal, internal). In general, the terminally modified RNA2 displays a higher fluorogenicity than the internally modified sequence RNA1. In case of the Cy3 dye, remarkable 7.5-fold (RNA1) and 9.4-fold (RNA2) fluorescence intensity increases could be achieved. Even though Cy3 and AF555 are spectroscopically similar, the energy transfer between the pyrazoline moiety and Cy3 seems to be more efficient compared to AF555 because only 2.6-fold (RNA1) and 3.2-fold (RNA2) fluorescence intensity increases were yielded with AF555. Although structural details of both AF-maleimides are reported in literature [27], the exact structure was not provided by the manufacturer of the dyes. Therefore, the varying energy transfer efficiency cannot conclusively be explained, but we assume differing Förster radii or competing photochemical processes could be possible explanations for the lower efficiency. The lowest fluorescence gains were achieved with the AF647 dye.
4. Conclusions
In conclusion, we present an efficient synthetic route to the new tetrazole-modified phosphoramidite building block 9. The uridine substitutes one of the aryl groups of the photoactive diaryltetrazole. This modification was incorporated internally and 5′-terminally into two RNA strands using conventional automated solid-phase chemistry. Photoclick reactions were carried out as postsynthetic modifications by irradiation with 300 nm light (LED) in aqueous media and in the presence of three different commercially available dye-maleimide conjugates (Cy3, AF555 and AF647). The yields vary significantly for the different dye-maleimide conjugates: AF555 maleimide produces the highest yields of up to 84% (RNA2), whereas the Cy3-maleimide shows smaller yields down to 27% (RNA1). In contrast, Cy3 provides the highest fluorogenic effect by the 7.5-fold (RNA1) to 9.4-fold (RNA2) fluorescence intensity increase, which is nearly one magnitude of order increase of fluorescence intensity. The concept has a broad substrate scope, both with respect to the dye-maleimide conjugates and with respect to the position within RNA sequence. This photoclick chemistry is a highly promising candidate for cell applications. Although the 300 nm light is in principle harmful to biological cells, the short irradiation times may be tolerable. Due to the fact that cytotoxic copper salts are avoided and the application of time allows spatiotemporal resolution, this postsynthetic RNA chemistry is a new tool for fluorescent imaging of RNA in biological cells.
Supplementary Materials
The following are available online at https://www.mdpi.com/2218-273X/10/3/480/s1. Figure S1. 1H NMR spectrum (400 MHz) of 2. Spectrum contains traces of dichloromethane (δ = 5.76 ppm). Figure S2. 13C NMR spectrum (101 MHz) of 2. Spectrum contains traces of dichloromethane (δ = 54.8 ppm). Figure S3. MS (FAB) analysis of 2. Figure S4. HR-MS (FAB) analysis of 2. Figure S5. 1H NMR spectrum (400 MHz) of 3. Spectrum contains traces of dichloromethane (δ = 5.76 ppm). Figure S6. 13C NMR spectrum (101 MHz) of 3. Spectrum contains traces of dichloromethane (δ = 54.8 ppm). Figure S7. MS (FAB) analysis of 3. Figure S8. HR-MS (FAB) analysis of 3. Figure S9. 1H NMR spectrum (400 MHz) of 4. Spectrum contains traces of toluene (δ = 7.25 ppm, 7.18 ppm, 2.30 ppm), dichloromethane (δ = 5.76 ppm) and ethyl acetate (δ = 1.17 ppm, 4.03 ppm, 1.99 ppm). Figure S10. 13C NMR spectrum (101 MHz) of 4. Spectrum contains traces of toluene (δ = 137.4 ppm, 128.9 ppm, 128.2 ppm, 125.3 ppm, 21.0 ppm), dichloromethane (δ = 54.9 ppm) and ethyl acetate (δ = 170.3 ppm, 59.8 ppm, 20.7 ppm, 14.1 ppm). Figure S11. MS (FAB) analysis of 4. Figure S12. HR-MS (FAB) analysis of 4. Figure S13. 1H NMR spectrum (400 MHz) of 5. Spectrum contains traces of dichloromethane (δ = 5.76 ppm). Figure S14. 13C NMR spectrum (101 MHz) of 5. Figure S15. MS (FAB) analysis of 5. Figure S16. HR-MS (FAB) analysis of 5. Figure S17. 1H NMR spectrum (500 MHz) of 6. The spectrum contains traces of methanol (δ = 4.01 ppm, 3.16 ppm). Figure S18. 13C NMR spectrum (126 MHz) of 6. The spectrum contains traces of methanol (δ = 48.6 ppm). Figure S19. MS (FAB) analysis of 6. Figure S20. HR-MS (FAB) analysis of 6. Figure S21. 1H NMR spectrum (500 MHz) of 7. Spectrum contains traces of dichloromethane (δ = 5.76ppm). Figure S22. 13C NMR spectrum (126 MHz) of 7. Spectrum contains traces of dichloromethane (δ = 54.9 ppm). Figure S23. MS (MALDI-TOF) analysis of 7. Figure S24. 1H NMR spectrum (500 MHz) of 8. Spectrum contains traces of dichloromethane (δ = 5.76 ppm). Figure S25. 13C NMR spectrum (126 MHz) of 8. Spectrum contains traces of dichloromethane (δ = 54.9 ppm). Figure S26. MS (FAB) analysis of 8. Figure S27. HR-MS (FAB) analysis of 8. Figure S28. 31P NMR spectrum (202 MHz) of 9. Figure S29. MS (MALDI-TOF) analysis of 9. Figure S30. UV/Vis absorbance of RNA1 and RNA2 (2.5 μM) in 10 mM Na-Pi buffer, 250 mM NaCl, pH 7. The spectra were normalized to evaluate the relative tetrazole absorbances. Figure S31. UV/Vis absorbance recorded during reaction of RNA1 (2.5 μM) with Cy3-maleimide (3.75 μM, 1.50 equiv.), irradiated at 300 nm (LED) in 10 mM Na-Pi buffer, 250 mM NaCl, pH 7. Figure S32. Fluorescence recorded during reaction of RNA1 (2.5 μM) with Cy3-maleimide (3.75 μM, (1.50 equiv.), irradiated at 300 nm (LED) in 10 mM Na-Pi buffer, 250 mM NaCl, pH 7. Fluorescence excitation at 358 nm. Figure S33. Fluorescence recorded during reaction of RNA1 (2.5 μM) with AF555-maleimide (3.75 μM, (1.50 equiv.), irradiated at 300 nm (LED) in 10 mM Na-Pi buffer, 250 mM NaCl, pH 7. Fluorescence excitation at 358 nm. Figure S34. UV/Vis absorbance recorded during reaction of RNA1 (2.5 μM) with AF647-maleimide (3.75 μM, 1.50 equiv.), irradiated at 300 nm (LED) in 10 mM Na-Pi buffer, 250 mM NaCl, pH 7. Figure S35. Fluorescence recorded during reaction of RNA1 (2.5 μM) with AF647-maleimide (3.75 μM, 1.50 eq), irradiated at 300 nm (LED) in 10 mM Na-Pi buffer, 250 mM NaCl, pH 7. Fluorescence excitation at 358 nm. Figure S36. UV/vis absorbance recorded during reaction of RNA2 (2.5 μM) with Cy3-maleimide (3.75 μM, 1.50 equiv.), irradiated at 300 nm (LED) in 10 mM Na-Pi buffer, 250 mM NaCl, pH 7. Figure S37. Fluorescence recorded during reaction of RNA2 (2.5 μM) with Cy3-maleimide (3.75 μM, 1.50 equiv.), irradiated at 300 nm (LED) in 10 mM Na-Pi buffer, 250 mM NaCl, pH 7. Fluorescence excitation at 358 nm. Figure S38. UV/Vis absorbance recorded during reaction of RNA2 (2.5 μM) with AF555-maleimide (3.75 μM, 1.50 equiv.), irradiated at 300 nm (LED) in 10 mM Na-Pi buffer, 250 mM NaCl, pH 7. Figure S39. Fluorescence recorded during reaction of RNA2 (2.5 μM) with AF555-maleimide (3.75 μM, 1.50 equiv.), irradiated at 300 nm (LED) in 10 mM Na-Pi buffer, 250 mM NaCl, pH 7. Fluorescence excitation at 358 nm. Figure S40. UV/Vis absorbance recorded during reaction of RNA2 (2.5 μM) with AF647-maleimide (3.75 μM, 1.50 equiv.), irradiated at 300 nm (LED) in 10 mM Na-Pi buffer, 250 mM NaCl, pH 7. Figure S41. Fluorescence recorded during reaction of RNA2 (2.5 μM) with AF647-maleimide (3.75 μM, 1.50 equiv.), irradiated at 300 nm (LED) in 10 mM Na-Pi buffer, 250 mM NaCl at pH 7. Fluorescence excitation at 358 nm. Figure S42. MS (MALDI-TOF) analysis of RNA1. Calculated mass [M+]: 5544.6; m/z = 5546.99 [M+], 5584.98 [M+K+]. Figure S43. MS (MALDI-TOF) analysis of RNA1-Cy3 adduct. Calculated mass [M+]: 6253.9; m/z = 5523.65 [RNA1-N2+], 5541.82 [RNA1-N2+H2O+], 6261.44 [M+]. Figure S44. MS (MALDI-TOF) analysis of RNA1-AF555 adduct. Calculated mass: 6485.9 [M+]; m/z = 5518.14 [RNA1-N2+], 5536.19 [RNA1-N2+H2O+], 6486.22 [M+]. The molecular mass of AF555-maleimide was reported in literature and verified by MS (MALDI-TOF) analysis. Figure S45. Zoomed area of MS (MALDI-TOF) analysis (Figure S44) of RNA1-AF555 adduct. Figure S46. MS (MALDI-TOF) analysis of RNA1-AF647 adduct. Calculated Mass [M+]: 6497.9; m/z = 5519.49 [RNA1-N2+], 5537.50 [RNA1-N2+H20+], 6499.90 [M+]. The molecular mass of AF647-maleimide was reported in literature and verified by MS (MALDI-TOF) analysis. Figure S47. Zoomed area of MS (MALDI-TOF) analysis (Figure S46) of RNA1-AF647 adduct. Figure S48. MS (MALDI-TOF) analysis of RNA2. Calculated mass [M+]: 5544.6; m/z = 5546.50 [M+], 5584.48 [M+K+],5622.49 [M+2K+], 5659.92 [M+3K+]. Figure S49. MS (MALDI-TOF) analysis of RNA2-Cy3 adduct. Calculated mass [M+]: 6253.9; m/z = 5516.65 [RNA2-N2+], 5534.67 [RNA2-N2+H2O+], 6254.67 [M+]. Figure S50. MS (MALDI-TOF) analysis of RNA2-AF555 adduct. Calculated Mass [M+]: 6485.9; m/z = 5519.45 [RNA2-N2+], 5537.50 [RNA2-N2+H2O+], 6485.06 [M+]. The molecular mass AF555-maleimide was reported in literature and verified by MS (MALDI-TOF) analysis. Figure S51. Zoomed area of MS (MALDI-TOF) analysis (Figure S50) of RNA2-AF555 adduct. Figure S52. MS (MALDI-TOF) analysis of RNA2-AF647 adduct. Calculated mass [M+]: 6497.9; m/z = 5519.01 [RNA2-N2+], 5537.02 [RNA2-N2+H2O+], 6499.74 [M+]. The molecular mass AF647-maleimide was reported in literature and verified by MS (MALDI-TOF) analysis. Figure S53. Zoomed area of MS (MALDI-TOF) analysis (Figure S53) of RNA2-AF647 adduct. Figure S54. UV/vis absorbance of “photoclicked“ RNA1 dye adducts (reaction with 1.50 equiv. dye-maleimide) strands after purification. cAF647 = 1.19 µM ≙ 48% yield, cAF555 = 1.96 µM ≙ 78% yield, cCy3 = 0.67 µM ≙ 27% yield. Figure S55. Fluorescence of “photoclicked” RNA1 dye adducts (reaction with 1.50 equiv. dye-maleimide) after purification. cAF647 = 1.19 µM, cAF555 = 1.96 µM, cCy3 = 0.67 µM. Figure S56. UV/vis absorbance of “photoclicked“ RNA2 dye adducts (reaction with 1.50 equiv. dye-maleimide) after purification. cAF647 = 1.20 µM ≙ 48% yield, cAF555 = 2.10 µM ≙ 84% yield, cCy3 = 0.77 µM ≙ 31% yield. Figure S57. Fluorescence of “photoclicked” RNA2 dye adducts (after reaction with 1.50 equiv. dye-maleimide) after purification. cAF647 = 1.20 µM, cAF555 = 2.10 µM, cCy3 = 0.77 µM. Figure S58. UV/vis absorbance of “photoclicked“ RNA1-Cy3 adduct (reaction with 10.0 equiv. Cy3-maleimide) after purification. cCy3 = 1.76 µM ≙ 70% yield. Figure S59. Fluorescence spectrum of “photoclicked” RNA2-Cy3 adduct (reaction with 10.0 equiv. Cy3-maleimide) after purification. cCy3 = 1.76 µM. Figure S60. UV/vis absorbance of A, C, G, U and 6 in comparison. Table S1. Molar extinction coefficients of the natural bases and the artificial nucleoside 6.
Author Contributions
K.K. performed the experiments and wrote parts of the manuscript. H.-A.W. supervised the research and wrote parts of the manuscript. All authors have read and agreed to the published version of the manuscript.
Funding
This research was funded by the Deutsche Forschungsgemeinschaft, grant number Wa 1386/15-2.
Acknowledgments
We acknowledge financial and general support by KIT.
Conflicts of Interest
The authors declare no conflict of interest.
References
- Row, R.D.; Prescher, J.A. Constructing New Bioorthogonal Reagents and Reactions. Accounts Chem. Res. 2018, 51, 1073–1081. [Google Scholar] [CrossRef] [PubMed]
- Shieh, P.; Bertozzi, C.R. Design strategies for bioorthogonal smart probes. Org. Biomol. Chem. 2014, 12, 9307–9320. [Google Scholar] [CrossRef] [PubMed]
- Devaraj, N.K. The Future of Bioorthogonal Chemistry. ACS Central Sci. 2018, 4, 952–959. [Google Scholar] [CrossRef] [PubMed] [Green Version]
- Kolb, H.C.; Finn, M.G.; Sharpless, K.B. Click Chemistry: Diverse Chemical Function from a Few Good Reactions. Angew. Chem. Int. Ed 2001, 40, 2004–2021. [Google Scholar] [CrossRef]
- Tornøe, C.W.; Christensen, C.; Meldal, M. Peptidotriazoles on Solid Phase: [1,2,3]-Triazoles by Regiospecific Copper(I)-Catalyzed 1,3-Dipolar Cycloadditions of Terminal Alkynes to Azides. J. Org. Chem. 2002, 67, 3057–3064. [Google Scholar] [CrossRef] [PubMed]
- Chan, T.R.; Hilgraf, R.; Sharpless, K.B.; Fokin, V.V. Polytriazoles as Copper(I)-Stabilizing Ligands in Catalysis. Org. Lett. 2004, 6, 2853–2855. [Google Scholar] [CrossRef]
- Hong, V.; Steinmetz, N.F.; Manchester, M.; Finn, M.G. Labeling Live Cells by Copper-Catalyzed Alkyne−Azide Click Chemistry. Bioconjugate Chem. 2010, 21, 1912–1916. [Google Scholar] [CrossRef] [Green Version]
- Yang, M.; Li, J.; Chen, P.R. Transition metal-mediated bioorthogonal protein chemistry in living cells. Chem. Soc. Rev. 2014, 43, 6511–6526. [Google Scholar] [CrossRef]
- Kennedy, D.; McKay, C.S.; Legault, M.C.B.; Danielson, D.C.; Blake, J.A.; Pegoraro, A.F.; Stolow, A.; Mester, Z.; Pezacki, J.P. Cellular Consequences of Copper Complexes Used To Catalyze Bioorthogonal Click Reactions. J. Am. Chem. Soc. 2011, 133, 17993–18001. [Google Scholar] [CrossRef]
- Devaraj, N.K.; Weissleder, R.; Hilderbrand, S.A. Tetrazine-Based Cycloadditions: Application to Pretargeted Live Cell Imaging. Bioconjugate Chem. 2008, 19, 2297–2299. [Google Scholar] [CrossRef] [Green Version]
- Lang, K.; Mayer, S. Tetrazines in Inverse-Electron-Demand Diels–Alder Cycloadditions and Their Use in Biology. Synthesis 2016, 49, 830–848. [Google Scholar] [CrossRef]
- Kamber, D.N.; Liang, Y.; Blizzard, R.J.; Liu, F.; Mehl, R.A.; Houk, K.N.; Prescher, J.A. 1,2,4-Triazines Are Versatile Bioorthogonal Reagents. J. Am. Chem. Soc. 2015, 137, 8388–8391. [Google Scholar] [CrossRef] [PubMed]
- Lang, K.; Chin, J.W. Bioorthogonal Reactions for Labeling Proteins. ACS Chem. Biol. 2014, 9, 16–20. [Google Scholar] [CrossRef] [PubMed]
- Oliveira, B.; Guo, Z.; Bernardes, G.J.L. Inverse electron demand Diels–Alder reactions in chemical biology. Chem. Soc. Rev. 2017, 46, 4895–4950. [Google Scholar] [CrossRef] [Green Version]
- Lim, R.K.V.; Lin, Q. Photoinducible Bioorthogonal Chemistry: A Spatiotemporally Controllable Tool to Visualize and Perturb Proteins in Live Cells. Accounts Chem. Res. 2011, 44, 828–839. [Google Scholar] [CrossRef] [Green Version]
- Nadler, A.; Schultz, C. The Power of Fluorogenic Probes. Angew. Chem. Int. Ed. 2013, 52, 2408–2410. [Google Scholar] [CrossRef]
- Wu, H.; Devaraj, N.K. Advances in Tetrazine Bioorthogonal Chemistry Driven by the Synthesis of Novel Tetrazines and Dienophiles. Accounts Chem. Res. 2018, 51, 1249–1259. [Google Scholar] [CrossRef]
- Wieczorek, A.; Werther, P.; Euchner, J.; Wombacher, R. Green- to far-red-emitting fluorogenic tetrazine probes - synthetic access and no-wash protein imaging inside living cells. Chem. Sci. 2017, 8, 1506–1510. [Google Scholar] [CrossRef] [Green Version]
- Lehmann, B.; Wagenknecht, H.-A. Fluorogenic “photoclick”-type labelling of DNA using a Cy3 dye. Org. Biomol. Chem. 2018, 16, 7579–7582. [Google Scholar] [CrossRef]
- Hudson, R.H.; Wojciechowski, F. The detrimental effect of orotic acid substitution in the peptide nucleic acid strand on the stability of PNA2:NA triple helices. Can. J. Chem. 2005, 83, 1731–1740. [Google Scholar] [CrossRef]
- Clovis, J.S.; Eckell, A.; Huisgen, R.; Sustmann, R. 1.3-Dipolare Cycloadditionen, XXV. Der Nachweis des freien Diphenylnitrilimins als Zwischenstufe bei Cycloadditionen. Eur. J. Inorg. Chem. 1967, 100, 60–70. [Google Scholar] [CrossRef]
- Blasco, E.; Sugawara, Y.; Lederhose, P.; Blinco, J.P.; Kelterer, A.-M.; Barner-Kowollik, C. Understanding Reactivity Patterns in Light-Induced Nitrile Imine Mediated Tetrazole-Ene Cycloadditions. ChemPhotoChem 2017, 1, 159–163. [Google Scholar] [CrossRef]
- Vorbrüggen, H.; Krolikiewicz, K. Neue Katalysatoren für die Nucleosidsynthese. Angew. Chem. 1975, 87, 417. [Google Scholar] [CrossRef]
- Dess, D.B.; Martin, J.C. A useful 12-I-5 triacetoxyperiodinane (the Dess-Martin periodinane) for the selective oxidation of primary or secondary alcohols and a variety of related 12-I-5 species. J. Am. Chem. Soc. 1991, 113, 7277–7287. [Google Scholar] [CrossRef]
- Kakehi, A.; Tanaka, Y.; Ito, S.; Kondo, K. A Facile Synthesis of 2,5-Disubstituted Tetrazoles by the Reaction of Phenylsulfonylhydrazones with Arenediazonium Salts. Bull. Chem. Soc. Jpn. 1976, 49, 1920–1923. [Google Scholar]
- Hakimelahi, G.H.; Proba, Z.A.; Ogilvie, K.K. New catalysts and procedures for the dimethoxytritylation and selective silylation of ribonucleosides. Can. J. Chem. 1982, 60, 1106–1113. [Google Scholar] [CrossRef]
- Tridgett, M.; Moore-Kelly, C.; Duprey, J.-L.H.A.; Iturbe, L.O.; Tsang, C.W.; Little, H.A.; Sandhu, S.K.; Hicks, M.R.; Dafforn, T.R.; Rodger, A. Linear dichroism of visible-region chromophores using M13 bacteriophage as an alignment scaffold. RSC Adv. 2018, 8, 29535–29543. [Google Scholar] [CrossRef] [Green Version]
Figure 1.
Principle of fluorogenic RNA photoclick labeling using the tetrazole-modified uridine (marked in blue, for building block structure see Scheme 1) as a photoreactive building block in single-stranded RNA and maleimide-conjugated dyes (maleimide marked in blue, dye in red). The energy transfer between the pyrazoline as a photoclick product and the attached dye yield a fluorogenic photoclick reaction.
Scheme 1.
Synthesis of RNA building block 9: (a) 2,3,5-Tribenzoyl-β-D-ribofuranoside-1-acetate, N,O-bis(trimethylsilyl)acetamide, trimethylsilyl trifluoromethanesulfonate, acetonitrile, 60 °C, 2 h, 70%. (b) Dess-Martin periodinane, CH2Cl2, r.t., 2 h, 72%. (c) Benzenesulfonyl hydrazide, dichloromethane, 40 °C, 2 h, 82%. (d) 4-bromobenzenediazonium tetrafluoroborate, pyridine, −15 °C, 0.5 h, 48%. (e) Ammonia (7M) in MeOH, 80 °C, 24 h, 65%. (f) DMT-Cl, silver(II) nitrate, pyridine, r.t., 2 h, 61%. (g) AgNO3, TBDMS-Cl, pyridine, r.t., 6 h, 36%. (h) DIPEA, 2-cyanoethyl N,N-diisopropyl-chlorophosphoramidite, CH2Cl2, r. t., 6 h, 87%.

Figure 2.
UV/Vis absorbances recorded during irradiation of RNA1 (2.5 μM) with 1.50 equiv. AF555-maleimide (3.75 μM) in 10 mM Na-Pi buffer (250 mM NaCl, pH 7).
Figure 2.
UV/Vis absorbances recorded during irradiation of RNA1 (2.5 μM) with 1.50 equiv. AF555-maleimide (3.75 μM) in 10 mM Na-Pi buffer (250 mM NaCl, pH 7).
Figure 3.
Fluorescence intensity changes during the photoclick modification of RNA1 (2.5 μM, dashed lines) and RNA2 (2.5 μM, solid lines) in the presence of Cy3-maleimide, AF555-maleimide and AF647 maleimide (each 3.75 μM, 1.5 equiv.); irradiation at 300 nm, fluorescence excitation at 358 nm, in 10 mM Na-Pi buffer (250 mM NaCl, pH 7). I0 is the fluorescence intensity before the irradiation.

Table 1.
Yields of the photoclick reaction. RNA1 or RNA2 (2.5 µM) were irradiated with 300 nm light (LED) in the presence of 1.50 equiv (3.75 µM) Cy3-maleimide, AF555-maleimide and AF647-maleimide, respectively, in 10 mM Na-Pi buffer (250 mM NaCl, pH 7).
Table 1.
Yields of the photoclick reaction. RNA1 or RNA2 (2.5 µM) were irradiated with 300 nm light (LED) in the presence of 1.50 equiv (3.75 µM) Cy3-maleimide, AF555-maleimide and AF647-maleimide, respectively, in 10 mM Na-Pi buffer (250 mM NaCl, pH 7).
| Dye Adduct of | RNA1 | RNA2 |
|---|---|---|
| Cy3 | 27% | 31% (70%) a |
| AF555 | 78% | 84% |
| AF647 | 48% | 48% |
a after reaction in the presence of 10.0 equiv. Cy3-maleimide.
© 2020 by the authors. Licensee MDPI, Basel, Switzerland. This article is an open access article distributed under the terms and conditions of the Creative Commons Attribution (CC BY) license (http://creativecommons.org/licenses/by/4.0/).
Share and Cite
MDPI and ACS Style
Krell, K.; Wagenknecht, H.-A. Fluorogenic and Bioorthogonal Modification of RNA Using Photoclick Chemistry. Biomolecules 2020, 10, 480. https://doi.org/10.3390/biom10030480
AMA Style
Krell K, Wagenknecht H-A. Fluorogenic and Bioorthogonal Modification of RNA Using Photoclick Chemistry. Biomolecules. 2020; 10(3):480. https://doi.org/10.3390/biom10030480
Chicago/Turabian StyleKrell, Katja, and Hans-Achim Wagenknecht. 2020. "Fluorogenic and Bioorthogonal Modification of RNA Using Photoclick Chemistry" Biomolecules 10, no. 3: 480. https://doi.org/10.3390/biom10030480
Note that from the first issue of 2016, this journal uses article numbers instead of page numbers. See further details here.