Article

Sporadic Amyotrophic Lateral Sclerosis Skeletal Muscle Transcriptome Analysis: A Comprehensive Examination of Differentially Expressed Genes

by
Elisa Gascón
1,2,3,4,
Pilar Zaragoza
1,2,3,4,
Ana Cristina Calvo
1,2,3,4 and
Rosario Osta
1,2,3,4,*
1
Department of Anatomy, Embryology and Animal Genetics, University of Zaragoza, 50013 Zaragoza, Spain
2
Centro de Investigación Biomédica en Red de Enfermedades Neurodegenerativas (CIBERNED), 28029 Madrid, Spain
3
Agroalimentary Institute of Aragon (IA2), University of Zaragoza, 50013 Zaragoza, Spain
4
Institute of Health Research of Aragon (IIS), 50009 Zaragoza, Spain
*
Author to whom correspondence should be addressed.
Biomolecules 2024, 14(3), 377; https://doi.org/10.3390/biom14030377
Submission received: 8 February 2024 / Revised: 15 March 2024 / Accepted: 18 March 2024 / Published: 20 March 2024
(This article belongs to the Special Issue Advances in Biomarkers for Neurodegenerative Diseases)

Abstract

:
Amyotrophic lateral sclerosis (ALS) that comprises sporadic (sALS) and familial (fALS) cases, is a devastating neurodegenerative disorder characterized by progressive degeneration of motor neurons, leading to muscle atrophy and various clinical manifestations. However, the complex underlying mechanisms affecting this disease are not yet known. On the other hand, there is also no good prognosis of the disease due to the lack of biomarkers and therapeutic targets. Therefore, in this study, by means of bioinformatics analysis, sALS-affected muscle tissue was analyzed using the GEO GSE41414 dataset, identifying 397 differentially expressed genes (DEGs). Functional analysis revealed 320 up-regulated DEGs associated with muscle development and 77 down-regulated DEGs linked to energy metabolism. Protein–protein interaction network analysis identified 20 hub genes, including EIF4A1, HNRNPR and NDUFA4. Furthermore, miRNA target gene networks revealed 17 miRNAs linked to hub genes, with hsa-mir-206, hsa-mir-133b and hsa-mir-100-5p having been previously implicated in ALS. This study presents new potential biomarkers and therapeutic targets for ALS by correlating the information obtained with a comprehensive literature review, providing new potential targets to study their role in ALS.

1. Introduction

Amyotrophic lateral sclerosis (ALS) is a devastating neurodegenerative disorder, characterized by the progressive degeneration of upper and lower motor neurons, resulting in muscle atrophy and diverse clinical manifestations. The disease exhibits an estimated prevalence of 4–8 cases per 100,000 individuals across most populations [1]. Alongside motor neuron degeneration, ALS patients may present cognitive and behavioral impairments, adding to the complexity of the disease [2,3]. The median survival post-symptom onset typically ranges from 3 to 5 years, although prognostic factors can influence this timeframe [4].
ALS is broadly classified into sporadic (sALS) and familial (fALS) forms, accounting for 90–95% and 5–10% of cases, respectively [5]. Presently, only two approved drugs, edaravone and riluzole, are available for ALS treatment, emphasizing the urgent need for further therapeutic options [6].
While the precise etiology of ALS remains elusive, genetic factors related to RNA metabolism, protein homeostasis, DNA damage repair, nucleocytoplasmic transport, excitotoxicity, oxidative stress and axonal transport have been implicated [7,8,9,10,11,12,13]. Specific mutations have been described in genes such as SOD1, FUS, C9ORF72, ATXN2, OPTN, VCP, PFN1, MATR3, SETX and UBQLN2 [14,15,16,17,18,19,20,21,22,23,24]. Advancements in whole-genome sequencing have led to the discovery of new ALS-associated genes such as LGALSL, FIG4 or ALS2 [25,26,27]. Despite these insights, ALS remains a multifactorial disease, which reflects the difficulty of achieving more effective therapies [28].
Biomarkers can play a pivotal role in ALS research, enabling early diagnosis, prognosis prediction, treatment evaluation and therapeutic discovery [29]. Bioinformatics, a field of remarkable progress, has become relevant in the biomarker exploration of various diseases [30,31,32]. Previous studies conducted by Lin, Huang, Chen, Ye, Su and Yao [2] have delved into bioinformatic analyses using gene expression series (GSE) from human spinal cord motor neuron data. However, human muscle samples, a primary site affected by ALS, remain largely unexplored. Interestingly, growing evidence suggests alterations in the neuromuscular junction from the presymptomatic stage. These alterations could indicate that the degenerations observed in motor neurons could be influenced by pathogenic alterations in muscles [33].
In this study, we scrutinized the GEO dataset GSE41414 [34] to identify differentially expressed genes (DEGs) in sALS-affected muscle samples compared to healthy controls. Subsequently, GO and pathway enrichment analyses shed light on the functions and pathways influenced by these DEGs. Furthermore, we constructed protein–protein interaction networks to pinpoint subnetworks and hub genes. Additionally, miRNA–target gene networks were developed, offering insights into potential gene interactions in the context of ALS.

2. Materials and Methods

2.1. Microarray Dataset

An extensive search was conducted within the Gene Expression Omnibus (GEO) database, a globally accessible public repository established in 2020 to investigate pertinent gene expression datasets [35]. The search strategy used a combination of specific keywords: ALS and skeletal muscle (ALS [All Fields] AND skeletal muscle [All Fields]). Stringent criteria were applied, including a restriction to datasets exclusively associated with Homo sapiens and categorized under the study type of expression profiling by array. We focused on samples of skeletal muscle to provide new insights on this tissue that is affected by the disease.
Among the identified datasets, GSE41414 emerged as the dataset of choice. This dataset, residing on the Affymetrix Human HG-Focus Target Array platform, encompasses a comprehensive collection of samples, including seven control and seven sporadic ALS (sALS) patient specimens (Table S2). All control samples encompass fibers from the deltoid skeletal muscle. For samples from individuals with sporadic amyotrophic lateral sclerosis (sALS), three come from the quadriceps skeletal muscle, and four come from the deltoid skeletal muscle. Both cohorts underwent extensive analysis, and subsequent observation revealed no discernible differences. Consequently, these groups were combined into a singular category representing skeletal muscle affected by sporadic amyotrophic lateral sclerosis (sALS).

2.2. Identification and Analysis of Differentially Expressed Genes (DEGs)

The gene expression data were analyzed using RStudio environment and specific Bioconductor packages [36]: affy (v1.78.2), oligo (v1.64.1), GEOquery (v2.68.0), limma (v3.56.2) and ggplot2 (v3.4.3). Data correction and normalization were initially performed. Subsequently, the limma package’s moderated t-test, based on the empirical parametric Bayes method, identified differentially expressed genes (DEGs) between ALS patient and control samples. The criteria for DEGs included |logFC| > 0.5 (1.4-fold change) for up-regulated genes, |logFC| < 0.5 (0.7-fold change) for down-regulated genes and a p-value < 0.05. The results were visualized using a volcano plot created with ggplot2 packages.

2.3. Functional and Enrichment Analysis of DEG Pathways

The functional enrichment analysis of up- and down-regulated genes was carried out using the Bioconductor R package clusterProfiler (v4.8.2) [37] with default statistical thresholds and OrgDb set to “org.Hs.eg.db”. clusterProfiler is a well-known package for performing comprehensive functional and pathway enrichment analyses that are needed for the analysis and visualization of enrichment across numerous organisms. The analysis specifically focused on Gene Ontology (GO) terms, categorizing them into (1) biological processes, (2) molecular functions and (3) cellular components. Significance was determined with a stringent criterion: GO scores with a p-value < 0.05 were considered statistically significant.

2.4. Protein–Protein Interaction (PPI) Network Construction and Subnetwork Identification

The STRING online database (https://string-db.org/, accessed on 5 February 2024) was used to predict and analyze protein–protein interactions of positively and negatively regulated genes [38]. These interactions were visually represented using Cytoscape software (v3.9.1), which allowed modification and visualization of biological networks [39]. In addition, the MCODE (Molecular Complex Detection) add-on of Cytoscape [40] facilitated the analysis of densely connected clusters within the networks based on specific criteria (degree limit = 2, node score limit = 0.2, kernel K = 2 and max. depth = 100). Subsequently, the highest scoring subnetworks for positively and negatively regulated genes were selected. For further analysis and enrichment, we used Metascape (https://metascape.org, accessed on 5 February 2024), a user-friendly online bioinformatics portal recognized for its functional enrichment and interactome analysis capabilities, which ensures meticulous exploration of the biological processes studied [41].

2.5. Analysis of Hub Genes and PPI Networks

To identify positively regulated and negatively regulated hub genes, the Cytoscape add-on cytoHubba was used. cytoHubba is capable of performing topological analysis using 11 methods, among which the most commonly used are degree MCC (maximum clique centrality) and betweenness [42]. The ten hub genes with the highest degrees were identified in the PPI networks that were positively and negatively regulated.

2.6. Prediction of miRNAs Targeting Hub Genes

The miRNet database (https://www.mirnet.ca/, accessed on 5 February 2024) served as a crucial bioinformatics platform for predicting target-gene and miRNA pairs [43]. This powerful tool integrates data from 14 distinct miRNA databases, including TarBase, miRTarBase, miRecords, miRanda, miR2Disease, HMDD, PhenomiR, SM2miR, PharmacomiR, EpimiR, starBase, TransmiR, ADmiRE and TAM 2.0. Specifically, for this research, miRNAs specific to both positively and negatively regulated hub genes were predicted. The resulting target-gene–miRNA regulatory network was depicted and visually represented using Cytoscape.

3. Results

3.1. Identification and Analysis of Differentially Expressed Genes (DEGs)

The GSE41414 dataset contained a total of 8793 genes, of which, a total of 397 differentially expressed genes (DEGs) were identified. Among these DEGs, there were 320 up-regulated genes and 77 down-regulated genes. These genes were represented in a volcano plot (Figure 1).

3.2. Functional and Enrichment Analysis of DEG Pathways

GO analysis consists of three parts: (1) biological processes (BPs), (2) cellular component (CC) and (3) molecular function (MF). In this study, a functional analysis of up-regulated DEGs and down-regulated DEGs (Figure 2) was performed.
The analysis revealed that up-regulated DEGs were involved in biological processes such as muscle structure development, myoblast differentiation and regulation of myoblast differentiation, among others. In terms of the CC, DEGs were mainly enriched in collagen-containing extracellular matrix, external encapsulating structure and extracellular matrix. The molecular functions associated with these DEGs were mainly structural molecule activity, mRNA binding and extracellular matrix structural constituent.
On the other hand, down-regulated DEGs were involved in biological processes of generation of precursor metabolites and energy, aerobic respiration, cellular respiration and oxidative phosphorylation, among others. The most enriched CC terms for these DEGs were the mitochondrial membrane, mitochondrial protein-containing complex and inner mitochondrial membrane protein complex. The molecular functions associated with these DEGs were electron transfer activity, oxidoreduction-driven active transmembrane transporter activity and primary active transmembrane transporter activity.

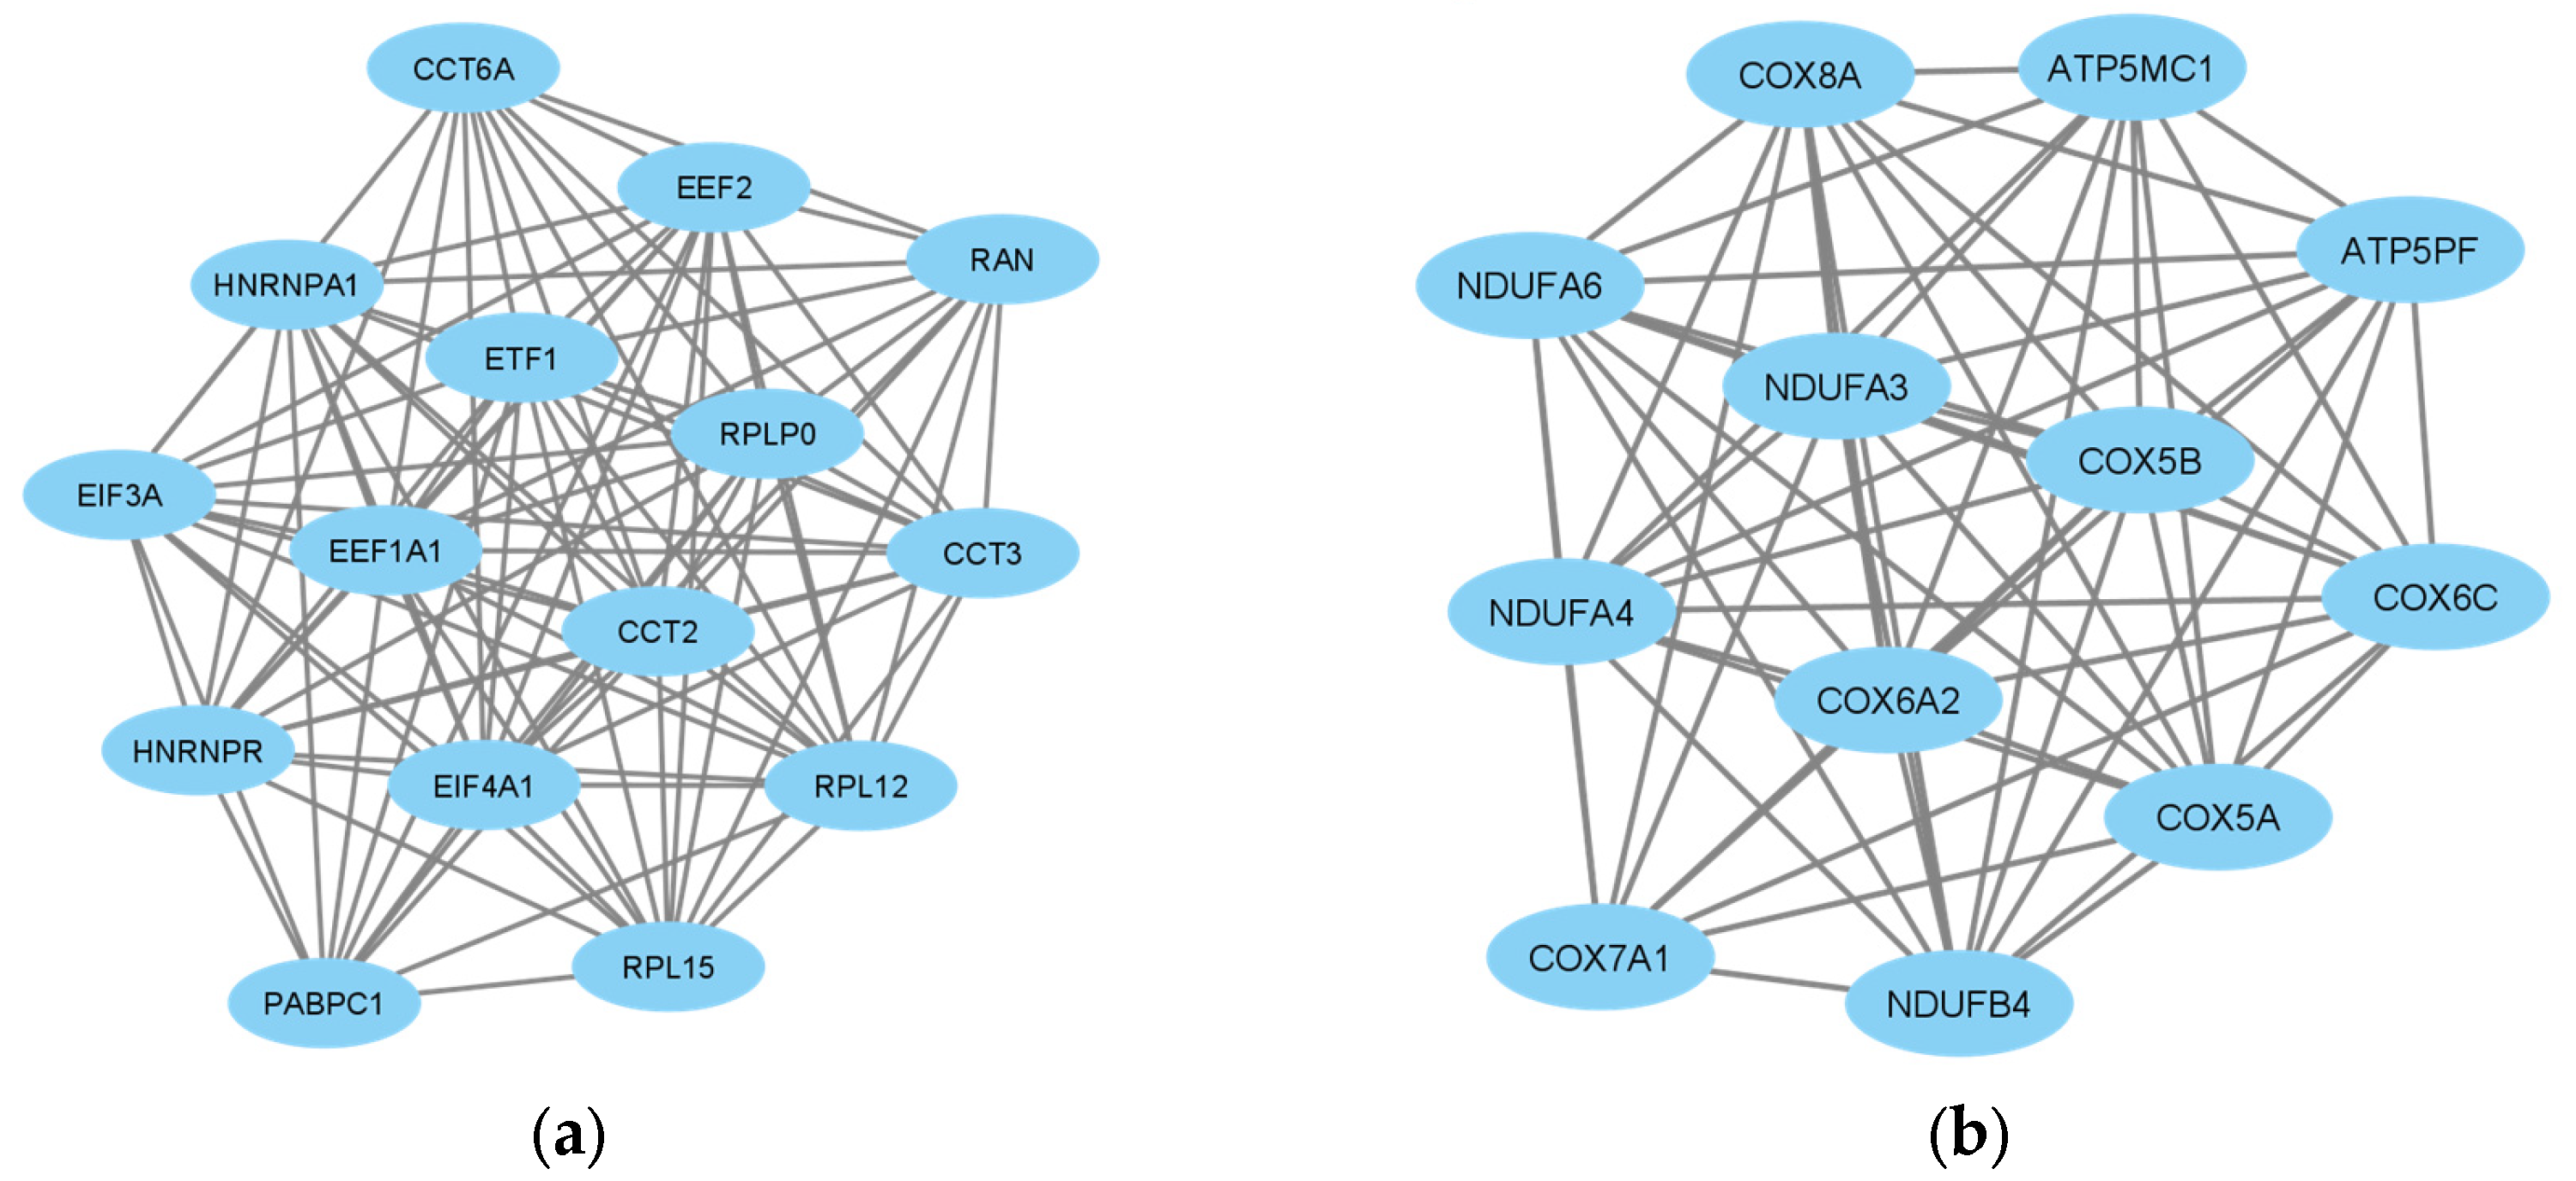
3.3. Protein–Protein Interaction (PPI) Network Construction and Subnetwork Identification

The protein–protein interaction network of the 397 DEGs was constructed with medium confidence using STRING. A PPI network was constructed for the up- and down-regulated DEGs. The obtained files were subsequently visualized by Cytoscape, and their possible subnetworks were analyzed with MCODE to investigate the molecular networks related to these deregulated genes. Up to nine subnetworks were identified for up-regulated DEGs and three subnetworks for down-regulated DEGs. We selected the subnetworks with the highest MCODE scores for up- and down-regulated DEGs. The subnetwork of up-regulated DEGs consisted of 15 genes: EIF4A1, CCT2, ETF1, PABPC1, HNRNPR, EIF3A, EEF2, HNRNPA1, RPLP0, EEF1A1, RAN, RPL12, CCT6A, RPL15 and CCT3 (Figure 3a). The subnetwork of down-regulated DEGs consisted of 12 genes: COX5B, COX6A2, NDUFA4, COX6C, NDUFB4, ATP5MC1, COX8A, NDUFA3, ATP5PF, COX7A1, COX5A and NDUFA6 (Figure 3b).
Finally, these subnetworks were enriched using Metascape. Metascape serves as a user-friendly online bioinformatics portal, facilitating the expeditious and precise acquisition of functional enrichment and interactome analysis outcomes from a designated list of genes of interest. The most enriched pathways for the up-regulated DEG subnetwork included translation, translation factors and metabolism of RNA (Figure 4). Conversely, the most enriched pathways for the down-regulated DEG subnetwork comprised the electron transport chain, oxidative phosphorylation and respiratory electron transport (Figure 5).

3.4. Identification of Hub Genes

The 10 hub genes of the PPI network of up-regulated DEGs with the highest MCC (maximum clique centrality) hub according to the cytoHubba complement were EEF1A1, RPLP0, EEF2, EIF4A1, CCT2, HNRNPR, RPL12, RPL15, HNRNPA1 and PABPC1 (Figure 6a). On the other hand, the 10 hub genes in the PPI network of down-regulated DEGs with the highest MCC hub were NDUFA4, COX5B, COX6C, NDUFA3, NDUFB4, COX5A, COX6A2, NDUFA6, COX8A and ATP5MC1 (Figure 6b).
By integrating the information from the 20 hub genes identified through PPI network analysis of both up- and down-regulated DEGs with the results from subnetwork identification using MCODE, it was observed that all up- and down-regulated hub genes were present in their respective highest-scoring subnetworks, which were mentioned in the previous section. This observation suggests that these 20 hub genes might serve as potential biomarkers and could lead to the identification of novel targets for amyotrophic lateral sclerosis (ALS) therapeutics. The hub genes identified as up-regulated were intricately linked to the maintenance, regeneration and differentiation of muscle tissue, as well as RNA metabolism. These findings highlighted that the maintenance of the regenerative capacity of this tissue under neurodegenerative conditions. Conversely, the down-regulated hub genes were associated with metabolism and oxidative stress, which become altered during disease progression.
Consequently, a literature review was conducted, limited to studies published within the last 5 years, to determine whether research has been conducted on each of these ALS-related genes. Among the hub genes derived from the up-regulated DEGs, no ALS-related literature was found for the EEF1A1, RPLP0, EEF2, CCT2, RPL12 and RPL15 genes. However, studies related to ALS were identified for the EIF4A1 [44], HNRNPR [45], HNRNPA1 [45,46] and PABPC1 genes [47]. In the case of hub genes obtained from the down-regulated DEGs, only the NDUFA4 gene was associated with ALS-related studies [48].
Additionally, while no studies directly related to ALS were discovered, other studies related to other neurological diseases were found in the cases of the EEF1A1 [49], COX5A [50] and RPL12 and RPL15 genes [51].

3.5. Prediction of miRNAs Targeting Hub Genes

A total of 17 microRNAs (miRNAs) associated with the hub genes were identified using the miRNet tool, a powerful and comprehensive online tool that integrates more than 14 miRNA databases. The detailed results are presented in Table 1. Several target genes, including EIF4A1, HNRNPA1 and COX5A, were found to be associated with three or more miRNAs. Finally, an exhaustive bibliographic review was conducted, limited to studies published in the last five years, to determine if research had been conducted on each of the microRNAs (miRNAs) related to amyotrophic lateral sclerosis (ALS). It was found that some of them, such as hsa-mir-100-5p, hsa-mir-125b-5p, hsa-mir-133a-3p, hsa-miR-206 and hsa-miR-133b [52,53,54,55,56], are closely associated with ALS. On the other hand, certain miRNAs, such as hsa-let-7a-5p and hsa-mir-26a-5p, have been linked to neurological diseases other than ALS [57].

4. Discussion

ALS, a devastating neurological disorder, was initially recognized in the 19th century; however, the fundamental etiology and pathophysiological mechanisms of the disease remain elusive to this day [58]. Therefore, importance needs to be given to studying the progression of ALS and developing new therapeutic strategies. ALS is a complex multifactorial pathophysiology in which numerous molecular and cellular processes appear to cause the neurodegeneration of ALS [59].
Currently, many computational approaches and high-throughput multi-omics technologies have been used for the identification of genes and pathways associated with ALS [31]. Remarkably, the study of multi-omics data (transcriptomics, proteomics and metabolomics) that aims to investigate new potential biomarkers and therapeutic targets is becoming key in the study of ALS disease. The original authors of this database, Bernadini et al. [34], performed a DEG study, as well as a functional study, a principal component analysis (PCA) and interconnected biological networks. Therefore, our aim was to introduce a novel approach to use this database with a less restrictive cutoff for DEG analysis to perform functional and enrichment analyses of DEG pathways. We also introduced additional protein–protein interaction (PPI) studies to identify subnetworks and hub genes. These hub genes were then used to predict associated miRNAs.
In this study, after analyzing the gene expression profiles of the patients, we obtained 320 up-regulated genes and 77 down-regulated genes. Compared to the results presented by the original authors [34], our results aligned with the differences in methodology used. We applied cut-off criteria of |logFC| > 0.5 for up-regulated genes and |logFC| < 0.5 for down-regulated genes, whereas cut-off criteria of |logFC| > 1 and |logFC| < 1, respectively, were previously used [34]. These variations in cut-off criteria contributed to the observed differences in the differentially expressed genes that were identified. The most significant pathways identified were related to the development of muscle structure for the up-regulated genes and to the generation of precursor metabolites and energy for the down-regulated genes. These findings were in accordance with the skeletal muscle dysfunction that can contribute to progressive muscle weakness in ALS [60]. In addition, it has also been observed that energy metabolism is altered in human ALS muscle cells, which correlates with energy metabolism pathways [61], as was also suggested by Bernadini and coworkers, indicating that the biological processes were mainly related to skeletal muscle development/contraction and the generation of precursor metabolites and energy [34].
From this group of both up- and down-regulated genes, those genes with the greatest potential as biomarkers were identified. The relevant up-regulated hub genes were EEF1A1, RPLP0, EEF2, EIF4A1, CCT2, HNRNPR, RPL12, RPL15, HNRNPA1 and PABPC1. No ALS-related scientific evidence was found for the RPLP0, EEF2 and CCT2 genes. However, some studies related to the EIF4A1, HNRNPR, HNRNPA1 and PABPC1 genes were considered. EIF4A1 has been found to play a role in the formation of stress granules in motor neurons [44,62]. Elevated expression of HNRNPR and HNRNPA1 together with a subset of human RNA-binding proteins that bind to the GGGGCC repeat RNA of the C9orf72 gene, one of the most common causes of ALS, reduces the level of GGGGCC repeat RNA, leading to the suppression of neurodegeneration. In addition, the involvement of HNRNPA1 in the different molecular pathways related to ALS neurodegeneration is increasingly being studied, as this protein is thought to play a key role in mRNA transcription, splicing, stability, transport and translation [46,63]. The PABPC1 gene has been associated with the UBQLN2 gene, one of the key genes linked to amyotrophic lateral sclerosis (ALS). Specifically, it has been observed to play a role in regulating stress granule dynamics and the pathogenesis of ALS [47]. All these genes could be potential targets for conducting new studies on their gene expression in ALS and investigating the possibility of them serving as new and potential biomarkers. Finally, although the EEF1A1, RPL12 and RPL15 genes have not been directly linked to ALS, they have been associated with other neurological diseases, such as Parkinson’s and Alzheimer’s [49,51]. EEF1A1 has demonstrated involvement in the regulation of genes associated with the neuroinflammatory process in Parkinson’s disease [49]. Conversely, the RPL12 and RPL15 genes exhibited significant up-regulation in brain capillary samples obtained from patients diagnosed with Alzheimer’s disease [51]. Notably, these processes have also been described in ALS, especially those ones related to neuroinflammation [64,65], identifying them as interesting candidates for further investigation.
Among the genes that were notably down-regulated (NDUFA4, COX5B, COX6C, NDUFA3, NDUFB4, COX5A, COX6A2, NDUFA6, COX8A and ATP5MC1), only NDUFA4 has been previously identified in connection with ALS. The NDUFA4 gene is associated with REEP1 and plays a crucial role in maintaining the integrity of mitochondrial complex IV. It has been observed that the interaction between NDUFA4 and REEP1 could block the access of mitochondrial proteases to the proteolysis sites of NDUFA4 [48]. This gene could be an interesting candidate for study since one of the characteristic pathologies of ALS is the alteration of mitochondrial bioenergetics. Therefore, it would be interesting to conduct future studies to explore its role in ALS. Additionally, many studies have already demonstrated the feasibility of using small molecules to enhance OXPHOS mitochondrial activity as a novel therapeutic approach in ALS [66]. For the rest of the genes, not much information is available, but it is known that they are involved in electron transport processes and ATP syntheses that have been found altered in the ALS pathogenesis [67].
Nowadays, miRNAs provide new avenues for research on diseases. In this study, combining computational and bioinformatics analysis, a total of 17 miRNAs targeting hub genes were identified (12 miRNAs for up-regulated genes and 5 miRNAs for down-regulated genes).
In particular, hsa-mir-100-5p has been associated with neuronal apoptosis in the central nervous system, contributing to the neurodegeneration of motor neurons [52]. One role of hsa-mir-125b-5p is to regulate genes related to DNA repair in ALS associated with the FUS gene [53]. Regarding hsa-mir-133a-3p, it has been proposed as a potential preclinical progression biomarker for ALS associated with G376D-TARDBP [55]. Studies have also suggested hsa-miR-206 and hsa-miR-133b as promising biomarkers for ALS [54,56,68,69].
In relation to the rest of the miRNAs, relevant information has been found related to other neurological diseases. For example, hsa-let-7a-5p and hsa-mir-26a-5p have been linked to major depressive disorder [57], and hsa-mir-140-3p has been studied for its potential role as a diagnostic biomarker for patients with acute ischemic stroke [70]. In general, this information is valuable to consider, as there is scientific evidence related to this group of miRNAs. This opens the possibility of new study approaches by combining information on hub genes and their miRNAs, providing new ideas for potential targets of studying their role in ALS, such as in the case of hsa-miR-206. Hsa-miR-206 is a miRNA targeting the HNRNPA1 gene, which, as mentioned earlier, is likely involved in the pathogenesis of ALS. Additionally, this gene is associated not only with hsa-miR-206 but also with hsa-mir-140-3p and hsa-mir-27a-3p. Therefore, these two miRNAs could likely play a role in ALS.

5. Conclusions

This study allowed us the opportunity to initiate an exploratory investigation using skeletal muscle samples to identify potential hub gene and microRNAs (miRNAs) of interest and to analyze their roles in amyotrophic lateral sclerosis (ALS) by using bioinformatics tools. These computational tools provide the potential for identifying distinct molecular targets that may exhibit interrelated associations by using data from patients’ samples. Consequently, we suggested some candidate genes for further scrutiny in future investigations. This study presented an initial assessment through bioinformatics analyses. A single gene expression profile from the skeletal muscle samples of sporadic patients was used to provide new insights on this affected tissue. Therefore, we suggest that the information obtained in this study can be validated through cellular experiments, high-throughput analyses, RT-qPCR, next-generation sequencing analyses, animal studies and an even larger cohort. These validations will provide a better understanding of ALS genetics or genetic variations among ALS patients, thereby enabling the monitoring of patients in the clinical practice.

Supplementary Materials

The following supporting information can be downloaded at https://www.mdpi.com/article/10.3390/biom14030377/s1, Table S1: List of Abbreviations; Table S2: GSE41414 Sample Set Information.

Author Contributions

R.O., P.Z., E.G. and A.C.C. conceived and designed the structure of the manuscript; E.G. designed the methodology and selected the software; R.O., E.G. and A.C.C. discussed, analyzed the results and reviewed the manuscript; R.O. and P.Z. enabled resources; E.G., R.O., P.Z. and A.C.C. participated in the data curation; E.G. was involved in writing—original draft preparation and editing; E.G., R.O., P.Z. and A.C.C. participated in visualization; R.O. and A.C.C. supervised and were involved in project administration; P.Z. and R.O. were involved in funding acquisition. All authors have read and agreed to the published version of the manuscript.

Funding

This research was funded by Instituto de Salud Carlos III, PI17/00949, and Fondo Europeo de Desarrollo Regional (FEDER) “Una manera de hacer Europa” from the European Union, A19_23R. “LAGENBIO GRUPO INVESTIGACION” was supported by Gobierno de Aragón, Centro de Investigación Biomédica en Red sobre Enfermedades Neurodegenerativas, grant number CIBERNED-612-CB18/05/00037. E.G. was supported by “Programa Investigo” from the University of Zaragoza and Next Generation EU.

Institutional Review Board Statement

Not applicable.

Informed Consent Statement

Not applicable.

Data Availability Statement

Data used in this study are publicly available on the gene expression omnibus (GEO) database and can be accessed through GSE41414.

Conflicts of Interest

The authors declare no conflicts of interest.

References

  1. Longinetti, E.; Fang, F. Epidemiology of Amyotrophic Lateral Sclerosis: An Update of Recent Literature. Curr. Opin. Neurol. 2019, 32, 771–776. [Google Scholar] [CrossRef]
  2. Lin, J.; Huang, P.; Chen, W.; Ye, C.; Su, H.; Yao, X. Key Molecules and Pathways Underlying Sporadic Amyotrophic Lateral Sclerosis: Integrated Analysis on Gene Expression Profiles of Motor Neurons. Front. Genet. 2020, 11, 578143. [Google Scholar] [CrossRef]
  3. Šoltić, D.; Bowerman, M.; Stock, J.; Shorrock, H.K.; Gillingwater, T.H.; Fuller, H.R. Multi-Study Proteomic and Bioinformatic Identification of Molecular Overlap between Amyotrophic Lateral Sclerosis (Als) and Spinal Muscular Atrophy (Sma). Brain Sci. 2018, 8, 212. [Google Scholar] [CrossRef]
  4. Chia, R.; Chio, A.; Traynor, B.J. Novel Genes Associated with Amyotrophic Lateral Sclerosis: Diagnostic and Clinical Implications. Lancet Neurol. 2018, 17, 94–102. [Google Scholar] [CrossRef]
  5. Kumar, R.; Haider, S. Protein Network Analysis to Prioritize Key Genes in Amyotrophic Lateral Sclerosis. IBRO Neurosci. Rep. 2022, 12, 25–44. [Google Scholar] [CrossRef] [PubMed]
  6. Sever, B.; Ciftci, H.; DeMirci, H.; Sever, H.; Ocak, F.; Yulug, B.; Tateishi, H.; Tateishi, T.; Otsuka, M.; Fujita, M.; et al. Comprehensive Research on Past and Future Therapeutic Strategies Devoted to Treatment of Amyotrophic Lateral Sclerosis. Int. J. Mol. Sci. 2022, 23, 2400. [Google Scholar] [CrossRef] [PubMed]
  7. Butti, Z.; Patten, S.A. Rna Dysregulation in Amyotrophic Lateral Sclerosis. Front. Genet. 2018, 9, 712. [Google Scholar] [CrossRef] [PubMed]
  8. Cykowski, M.D.; Dickson, D.W.; Powell, S.Z.; Arumanayagam, A.S.; Rivera, A.L.; Appel, S.H. Dipeptide Repeat (Dpr) Pathology in the Skeletal Muscle of Als Patients with C9orf72 Repeat Expansion. Acta Neuropathol. 2019, 138, 667–670. [Google Scholar] [CrossRef] [PubMed]
  9. Brenner, D.; Muller, K.; Wieland, T.; Weydt, P.; Bohm, S.; Lule, D.; Hubers, A.; Neuwirth, C.; Weber, M.; Borck, G.; et al. Nek1 Mutations in Familial Amyotrophic Lateral Sclerosis. Brain 2016, 139 Pt 5, e28. [Google Scholar] [CrossRef] [PubMed]
  10. Kim, H.J.; Taylor, J.P. Lost in Transportation: Nucleocytoplasmic Transport Defects in Als and Other Neurodegenerative Diseases. Neuron 2017, 96, 285–297. [Google Scholar] [CrossRef] [PubMed]
  11. Foerster, B.R.; Pomper, M.G.; Callaghan, B.C.; Petrou, M.; Edden, R.A.E.; Mohamed, M.A.; Welsh, R.C.; Carlos, R.C.; Barker, P.B.; Feldman, E.L. An Imbalance between Excitatory and Inhibitory Neurotransmitters in Amyotrophic Lateral Sclerosis Revealed by Use of 3-T Proton Magnetic Resonance Spectroscopy. JAMA Neurol. 2013, 70, 1009–1016. [Google Scholar] [CrossRef]
  12. Mitsumoto, H.; Santella, R.M.; Liu, X.; Bogdanov, M.; Zipprich, J.; Wu, H.C.; Mahata, J.; Kilty, M.; Bednarz, K.; Bell, D.; et al. Oxidative Stress Biomarkers in Sporadic Als. Amyotroph. Lateral Scler. 2008, 9, 177–183. [Google Scholar] [CrossRef] [PubMed]
  13. De Vos, K.J.; Chapman, A.L.; Tennant, M.E.; Manser, C.; Tudor, E.L.; Lau, K.F.; Brownlees, J.; Ackerley, S.; Shaw, P.J.; McLoughlin, D.M.; et al. Familial Amyotrophic Lateral Sclerosis-Linked Sod1 Mutants Perturb Fast Axonal Transport to Reduce Axonal Mitochondria Content. Hum. Mol. Genet. 2007, 16, 2720–2728. [Google Scholar] [CrossRef] [PubMed]
  14. Rosen, D.R.; Siddique, T.; Patterson, D.; Figlewicz, D.A.; Sapp, P.; Hentati, A.; Donaldson, D.; Goto, J.; O’Regan, J.P.; Deng, H.X.; et al. Mutations in Cu/Zn Superoxide Dismutase Gene Are Associated with Familial Amyotrophic Lateral Sclerosis. Nature 1993, 362, 59–62. [Google Scholar] [CrossRef] [PubMed]
  15. Kwiatkowski, T.J., Jr.; Bosco, D.A.; Leclerc, A.L.; Tamrazian, E.; Vanderburg, C.R.; Russ, C.; Davis, A.; Gilchrist, J.; Kasarskis, E.J.; Munsat, T.; et al. Mutations in the Fus/Tls Gene on Chromosome 16 Cause Familial Amyotrophic Lateral Sclerosis. Science 2009, 323, 1205–1208. [Google Scholar] [CrossRef] [PubMed]
  16. DeJesus-Hernandez, M.; Mackenzie, I.R.; Boeve, B.F.; Boxer, A.L.; Baker, M.; Rutherford, N.J.; Nicholson, A.M.; Finch, N.A.; Flynn, H.; Adamson, J.; et al. Expanded Ggggcc Hexanucleotide Repeat in Noncoding Region of C9orf72 Causes Chromosome 9p-Linked Ftd and Als. Neuron 2011, 72, 245–256. [Google Scholar] [CrossRef] [PubMed]
  17. Renton, A.E.; Majounie, E.; Waite, A.; Simón-Sánchez, J.; Rollinson, S.; Gibbs, J.R.; Schymick, J.C.; Laaksovirta, H.; van Swieten, J.C.; Myllykangas, L.; et al. A Hexanucleotide Repeat Expansion in C9orf72 Is the Cause of Chromosome 9p21-Linked Als-Ftd. Neuron 2011, 72, 257–268. [Google Scholar] [CrossRef] [PubMed]
  18. Elden, A.C.; Kim, H.J.; Hart, M.P.; Chen-Plotkin, A.S.; Johnson, B.S.; Fang, X.; Armakola, M.; Geser, F.; Greene, R.; Lu, M.M.; et al. Ataxin-2 Intermediate-Length Polyglutamine Expansions Are Associated with Increased Risk for Als. Nature 2010, 466, 1069–1075. [Google Scholar] [CrossRef] [PubMed]
  19. Maruyama, H.; Morino, H.; Ito, H.; Izumi, Y.; Kato, H.; Watanabe, Y.; Kinoshita, Y.; Kamada, M.; Nodera, H.; Suzuki, H.; et al. Mutations of Optineurin in Amyotrophic Lateral Sclerosis. Nature 2010, 465, 223–226. [Google Scholar] [CrossRef]
  20. Johnson, J.O.; Mandrioli, J.; Benatar, M.; Abramzon, Y.; Van Deerlin, V.M.; Trojanowski, J.Q.; Gibbs, J.R.; Brunetti, M.; Gronka, S.; Wuu, J.; et al. Exome Sequencing Reveals Vcp Mutations as a Cause of Familial Als. Neuron 2010, 68, 857–864. [Google Scholar] [CrossRef]
  21. Wu, C.H.; Fallini, C.; Ticozzi, N.; Keagle, P.J.; Sapp, P.C.; Piotrowska, K.; Lowe, P.; Koppers, M.; McKenna-Yasek, D.; Baron, D.M.; et al. Mutations in the Profilin 1 Gene Cause Familial Amyotrophic Lateral Sclerosis. Nature 2012, 488, 499–503. [Google Scholar] [CrossRef]
  22. Johnson, J.O.; Pioro, E.P.; Boehringer, A.; Chia, R.; Feit, H.; Renton, A.E.; Pliner, H.A.; Abramzon, Y.; Marangi, G.; Winborn, B.J.; et al. Mutations in the Matrin 3 Gene Cause Familial Amyotrophic Lateral Sclerosis. Nat. Neurosci. 2014, 17, 664–666. [Google Scholar] [CrossRef]
  23. Hirano, M.; Quinzii, C.M.; Mitsumoto, H.; Hays, A.P.; Roberts, J.K.; Richard, P.; Rowland, L.P. Senataxin Mutations and Amyotrophic Lateral Sclerosis. Amyotroph. Lateral Scler. 2011, 12, 223–227. [Google Scholar] [CrossRef] [PubMed]
  24. Deng, H.X.; Chen, W.; Hong, S.T.; Boycott, K.M.; Gorrie, G.H.; Siddique, N.; Yang, Y.; Fecto, F.; Shi, Y.; Zhai, H.; et al. Mutations in Ubqln2 Cause Dominant X-Linked Juvenile and Adult-Onset Als and Als/Dementia. Nature 2011, 477, 211–215. [Google Scholar] [CrossRef] [PubMed]
  25. Gelfman, S.; Dugger, S.; de Araujo Martins Moreno, C.; Ren, Z.; Wolock, C.J.; Shneider, N.A.; Phatnani, H.; Cirulli, E.T.; Lasseigne, B.N.; Harris, T.; et al. A New Approach for Rare Variation Collapsing on Functional Protein Domains Implicates Specific Genic Regions in Als. Genome Res. 2019, 29, 809–818. [Google Scholar] [CrossRef] [PubMed]
  26. Liu, C.Y.; Lin, J.L.; Feng, S.Y.; Che, C.H.; Huang, H.P.; Zou, Z.Y. Novel Variants in the Fig4 Gene Associated with Chinese Sporadic Amyotrophic Lateral Sclerosis with Slow Progression. J. Clin. Neurol. 2022, 18, 41–47. [Google Scholar] [CrossRef] [PubMed]
  27. Daneshmandpour, Y.; Bahmanpour, Z.; Kazeminasab, S.; Moghadam, E.A.; Alehabib, E.; Chapi, M.; Tafakhori, A.; Aghaei, N.; Darvish, H.; Emamalizadeh, B. A Novel Mutation in the Als2 Gene in an Iranian Kurdish Family with Juvenile Amyotrophic Lateral Sclerosis. Amyotroph. Lateral Scler. Front. Degener. 2023, 24, 148–151. [Google Scholar] [CrossRef] [PubMed]
  28. González-Mingot, C.; Miana-Mena, F.J.; Iñarrea, P.J.; Iñiguez, C.; Capablo, J.L.; Osta, R.; Gil-Sánchez, A.; Brieva, L.; Larrodé, P. Mitochondrial Aconitase Enzymatic Activity: A Potential Long-Term Survival Biomarker in the Blood of Als Patients. J. Clin. Med. 2023, 12, 3560. [Google Scholar] [CrossRef] [PubMed]
  29. Wilkins, H.M.; Dimachkie, M.M.; Agbas, A. Blood-Based Biomarkers for Amyotrophic Lateral Sclerosis. In Amyotrophic Lateral Sclerosis; Exon Publications: Brisbane, Australia, 2021. [Google Scholar]
  30. Zhang, P.; Feng, J.; Wu, X.; Chu, W.; Zhang, Y.; Li, P. Bioinformatics Analysis of Candidate Genes and Pathways Related to Hepatocellular Carcinoma in China: A Study Based on Public Databases. Pathol. Oncol. Res. 2021, 27, 588532. [Google Scholar] [CrossRef] [PubMed]
  31. Ganekal, P.; Vastrad, B.; Kavatagimath, S.; Vastrad, C.; Kotrashetti, S. Bioinformatics and Next-Generation Data Analysis for Identification of Genes and Molecular Pathways Involved in Subjects with Diabetes and Obesity. Medicina 2023, 59, 309. [Google Scholar] [CrossRef]
  32. Mohanan, E.M.; Jhala, D.; More, C.B.; Patel, A.K.; Joshi, C. Bioinformatics Analysis of Mirna and Its Associated Genes to Identify Potential Biomarkers of Oral Submucous Fibrosis and Oral Malignancy. Cancer Rep. 2023, 6, e1787. [Google Scholar] [CrossRef] [PubMed]
  33. Verma, S.; Vats, A.; Ahuja, V.; Vats, K.; Khurana, S.; Vats, Y.; Gourie-Devi, M.; Wajid, S.; Ganguly, N.K.; Chakraborti, P.; et al. Functional Consequences of Familial Als-Associated Sod1(L84f) in Neuronal and Muscle Cells. FASEB J. 2024, 38, e23461. [Google Scholar] [CrossRef]
  34. Bernardini, C.; Censi, F.; Lattanzi, W.; Barba, M.; Calcagnini, G.; Giuliani, A.; Tasca, G.; Sabatelli, M.; Ricci, E.; Michetti, F. Mitochondrial Network Genes in the Skeletal Muscle of Amyotrophic Lateral Sclerosis Patients. PLoS ONE 2013, 8, e57739. [Google Scholar] [CrossRef] [PubMed]
  35. Clough, E.; Barrett, T. The Gene Expression Omnibus Database. In Statistical Genomics: Methods and Protocols; Mathé, E., Davis, S., Eds.; Springer: New York, NY, USA, 2016; pp. 93–110. [Google Scholar]
  36. Reimers, M.; Carey, V.J. Bioconductor: An Open Source Framework for Bioinformatics and Computational Biology. Methods Enzymol. 2006, 411, 119–134. [Google Scholar]
  37. Yu, G.C.; Wang, L.G.; Han, Y.Y.; He, Q.Y. Clusterprofiler: An R Package for Comparing Biological Themes among Gene Clusters. OMICS J. Integr. Biol. 2012, 16, 284–287. [Google Scholar] [CrossRef]
  38. Szklarczyk, D.; Kirsch, R.; Koutrouli, M.A.-O.; Nastou, K.A.-O.; Mehryary, F.A.-O.; Hachilif, R.; Gable, A.L.; Fang, T.A.-O.; Doncheva, N.A.-O.; Pyysalo, S.; et al. The String Database in 2023: Protein-Protein Association Networks and Functional Enrichment Analyses for Any Sequenced Genome of Interest. Nucleic Acids Res. 2023, 51, D638–D646. [Google Scholar] [CrossRef]
  39. Shannon, P.; Markiel, A.; Ozier, O.; Baliga, N.S.; Wang, J.T.; Ramage, D.; Amin, N.; Schwikowski, B.; Ideker, T. Cytoscape: A Software Environment for Integrated Models of Biomolecular Interaction Networks. Genome Res. 2003, 13, 2498–2504. [Google Scholar] [CrossRef] [PubMed]
  40. Bader, G.D.; Hogue, C.W.V. An Automated Method for Finding Molecular Complexes in Large Protein Interaction Networks. BMC Bioinform. 2003, 4, 2. [Google Scholar] [CrossRef]
  41. Zhou, Y.; Zhou, B.; Pache, L.; Chang, M.; Khodabakhshi, A.H.; Tanaseichuk, O.; Benner, C.; Chanda, S.K. Metascape Provides a Biologist-Oriented Resource for the Analysis of Systems-Level Datasets. Nat. Commun. 2019, 10, 1523. [Google Scholar] [CrossRef]
  42. Chin, C.-H.; Chen, S.-H.; Wu, H.-H.; Ho, C.-W.; Ko, M.-T.; Lin, C.-Y. Cytohubba: Identifying Hub Objects and Sub-Networks from Complex Interactome. BMC Syst. Biol. 2014, 8, S11. [Google Scholar] [CrossRef]
  43. Chang, L.; Zhou, G.; Soufan, O.; Xia, J. Mirnet 2.0: Network-Based Visual Analytics for Mirna Functional Analysis and Systems Biology. Nucleic Acids Res. 2020, 48, W244–W251. [Google Scholar] [CrossRef]
  44. Wang, T.; Tian, X.; Kim, H.B.; Jang, Y.; Huang, Z.; Na, C.H.; Wang, J. Intracellular Energy Controls Dynamics of Stress-Induced Ribonucleoprotein Granules. Nat. Commun. 2022, 13, 5584. [Google Scholar] [CrossRef] [PubMed]
  45. Taminato, T.; Takeuchi, T.; Ueyama, M.; Mori, K.; Ikeda, M.; Mochizuki, H.; Nagai, Y. Therapeutic Reduction of Ggggcc Repeat Rna Levels by Hnrnpa3 Suppresses Neurodegeneration in Drosophila Models of C9orf72-Linked Als/Ftd. Hum. Mol. Genet. 2023, 32, 1673–1682. [Google Scholar] [CrossRef] [PubMed]
  46. Naskar, A.; Nayak, A.; Salaikumaran, M.R.; Vishal, S.S.; Gopal, P.P. Phase Separation and Pathologic Transitions of Rnp Condensates in Neurons: Implications for Amyotrophic Lateral Sclerosis, Frontotemporal Dementia and Other Neurodegenerative Disorders. Front. Mol. Neurosci. 2023, 16, 1242925. [Google Scholar] [CrossRef]
  47. Peng, G.; Gu, A.; Niu, H.; Chen, L.; Chen, Y.; Zhou, M.; Zhang, Y.; Liu, J.; Cai, L.; Liang, D.; et al. Amyotrophic Lateral Sclerosis (Als) Linked Mutation in Ubiquilin 2 Affects Stress Granule Assembly Via Tia-1. CNS Neurosci. Ther. 2022, 28, 105–115. [Google Scholar] [CrossRef]
  48. Qin, S.; You, P.; Yu, H.; Su, B. Reep1 Preserves Motor Function in Sod1g93a Mice by Improving Mitochondrial Function Via Interaction with Ndufa4. Neurosci. Bull. 2023, 39, 929–946. [Google Scholar] [CrossRef]
  49. Aisha, Z.; Lei, J.; Zhang, Y.; Ma, J. Eef1a1 Is Involved the Regulating Neuroinflammatory Processes in Parkinson’s Disease. J. Integr. Neurosci. 2023, 22, 122. [Google Scholar] [CrossRef] [PubMed]
  50. Liang, L.; Yan, J.; Huang, X.; Zou, C.; Chen, L.; Li, R.; Xie, J.; Pan, M.; Zou, D.; Liu, Y. Identification of Molecular Signatures Associated with Sleep Disorder and Alzheimer’s Disease. Front. Psychiatry 2022, 13, 925012. [Google Scholar] [CrossRef]
  51. Suzuki, M.; Tezuka, K.; Handa, T.; Sato, R.; Takeuchi, H.; Takao, M.; Tano, M.; Uchida, Y. Upregulation of Ribosome Complexes at the Blood-Brain Barrier in Alzheimer’s Disease Patients. J. Cereb. Blood Flow. Metab. 2022, 42, 2134–2150. [Google Scholar] [CrossRef]
  52. Wallach, T.; Mossmann, Z.J.; Szczepek, M.; Wetzel, M.; Machado, R.; Raden, M.; Miladi, M.; Kleinau, G.; Kruger, C.; Dembny, P.; et al. Microrna-100-5p and Microrna-298-5p Released from Apoptotic Cortical Neurons Are Endogenous Toll-Like Receptor 7/8 Ligands That Contribute to Neurodegeneration. Mol. Neurodegener. 2021, 16, 80. [Google Scholar] [CrossRef]
  53. Nogami, M.; Ishikawa, M.; Doi, A.; Sano, O.; Sone, T.; Akiyama, T.; Aoki, M.; Nakanishi, A.; Ogi, K.; Yano, M.; et al. Identification of Hub Molecules of Fus-Als by Bayesian Gene Regulatory Network Analysis of Ipsc Model: Ibrn. Neurobiol. Dis. 2021, 155, 105364. [Google Scholar] [CrossRef]
  54. Malacarne, C.; Galbiati, M.; Giagnorio, E.; Cavalcante, P.; Salerno, F.; Andreetta, F.; Cagnoli, C.; Taiana, M.; Nizzardo, M.; Corti, S.; et al. Dysregulation of Muscle-Specific Micrornas as Common Pathogenic Feature Associated with Muscle Atrophy in Als, Sma and Sbma: Evidence from Animal Models and Human Patients. Int. J. Mol. Sci. 2021, 22, 5673. [Google Scholar] [CrossRef]
  55. Ruffo, P.; Catalano, S.; La Bella, V.; Conforti, F.L. Deregulation of Plasma Microrna Expression in a Tardbp-Als Family. Biomolecules 2023, 13, 706. [Google Scholar] [CrossRef]
  56. Cheng, J.; Ho, W.K.; Wu, B.T.; Liu, H.P.; Lin, W.Y. Mirna Profiling as a Complementary Diagnostic Tool for Amyotrophic Lateral Sclerosis. Sci. Rep. 2023, 13, 13805. [Google Scholar] [CrossRef]
  57. Rasheed, M.; Asghar, R.; Firdoos, S.; Ahmad, N.; Nazir, A.; Ullah, K.M.; Li, N.; Zhuang, F.; Chen, Z.; Deng, Y. A Systematic Review of Circulatory Micrornas in Major Depressive Disorder: Potential Biomarkers for Disease Prognosis. Int. J. Mol. Sci. 2022, 23, 1294. [Google Scholar] [CrossRef]
  58. Keon, M.; Musrie, B.; Dinger, M.; Brennan, S.E.; Santos, J.; Saksena, N.K. Destination Amyotrophic Lateral Sclerosis. Front. Neurol. 2021, 12, 596006. [Google Scholar] [CrossRef]
  59. Abel, O.; Powell, J.F.; Andersen, P.M.; Al-Chalabi, A. Alsod: A User-Friendly Online Bioinformatics Tool for Amyotrophic Lateral Sclerosis Genetics. Hum. Mutat. 2012, 33, 1345–1351. [Google Scholar] [CrossRef]
  60. Shefner, J.M.; Musaro, A.; Ngo, S.T.; Lunetta, C.; Steyn, F.J.; Robitaille, R.; De Carvalho, M.; Rutkove, S.; Ludolph, A.C.; Dupuis, L. Skeletal Muscle in Amyotrophic Lateral Sclerosis. Brain 2023, 146, 4425–4436. [Google Scholar] [CrossRef]
  61. Pradat, P.F.; Barani, A.; Wanschitz, J.; Dubourg, O.; Lombes, A.; Bigot, A.; Mouly, V.; Bruneteau, G.; Salachas, F.; Lenglet, T.; et al. Abnormalities of Satellite Cells Function in Amyotrophic Lateral Sclerosis. Amyotroph. Lateral Scler. 2011, 12, 264–271. [Google Scholar] [CrossRef] [PubMed]
  62. Feneberg, E.; Gordon, D.; Thompson, A.G.; Finelli, M.J.; Dafinca, R.; Candalija, A.; Charles, P.D.; Mager, I.; Wood, M.J.; Fischer, R.; et al. An Als-Linked Mutation in Tdp-43 Disrupts Normal Protein Interactions in the Motor Neuron Response to Oxidative Stress. Neurobiol. Dis. 2020, 144, 105050. [Google Scholar] [CrossRef] [PubMed]
  63. Sharma, K.; Banerjee, S.; Savran, D.; Rajes, C.; Wiese, S.; Girdhar, A.; Schwierz, N.; Lee, C.; Shorter, J.; Schmidt, M.; et al. Cryo-Em Structure of the Full-Length Hnrnpa1 Amyloid Fibril. J. Mol. Biol. 2023, 435, 168211. [Google Scholar] [CrossRef]
  64. Moreno-García, L.; Miana-Mena, F.J.; Moreno-Martínez, L.; de la Torre, M.; Lunetta, C.; Tarlarini, C.; Zaragoza, P.; Calvo, A.C.; Osta, R. Inflammasome in Als Skeletal Muscle: Nlrp3 as a Potential Biomarker. Int. J. Mol. Sci. 2021, 22, 2523. [Google Scholar] [CrossRef] [PubMed]
  65. Larson, K.C.; Martens, L.H.; Marconi, M.; Dejesus, C.; Bruhn, S.; Miller, T.A.; Tate, B.; Levenson, J.M. Preclinical Translational Platform of Neuroinflammatory Disease Biology Relevant to Neurodegenerative Disease. J. Neuroinflamm. 2024, 21, 37. [Google Scholar] [CrossRef] [PubMed]
  66. Li, X.; Chen, C.; Zhan, X.; Li, B.; Zhang, Z.; Li, S.; Xie, Y.; Song, X.; Shen, Y.; Liu, J.; et al. R13 Preserves Motor Performance in Sod1(G93a) Mice by Improving Mitochondrial Function. Theranostics 2021, 11, 7294–7307. [Google Scholar] [CrossRef] [PubMed]
  67. Jhanji, R.; Behl, T.; Sehgal, A.; Bungau, S. Mitochondrial Dysfunction and Traffic Jams in Amyotrophic Lateral Sclerosis. Mitochondrion 2021, 58, 102–110. [Google Scholar] [CrossRef] [PubMed]
  68. Toivonen, J.M.; Manzano, R.; Oliván, S.; Zaragoza, P.; García-Redondo, A.; Osta, R. Microrna-206: A Potential Circulating Biomarker Candidate for Amyotrophic Lateral Sclerosis. PLoS ONE 2014, 9, e89065. [Google Scholar] [CrossRef]
  69. Liu, H.; Lan, S.; Shi, X.J.; Fan, F.C.; Liu, Q.S.; Cong, L.; Cheng, Y. Systematic Review and Meta-Analysis on Micrornas in Amyotrophic Lateral Sclerosis. Brain Res. Bull. 2023, 194, 82–89. [Google Scholar] [CrossRef]
  70. Ju, H.Y.; Tang, S.S.; Li, B.J.; Luo, X.; Li, Q. The Expression Levels of Circulating Mir-140-3p, Mir-130a-3p, and Mir-320b as Diagnostic Biomarkers in Acute Ischemic Stroke. Kaohsiung J. Med. Sci. 2023, 39, 927–935. [Google Scholar] [CrossRef]
Figure 1. Volcano plot of differentially expressed genes (DEGs). Red dots represent up-regulated genes according to p-values < 0.05 and |logFC| > 0.5. Blue dots represent down-regulated genes according to p-values < 0.05 and |logFC| < 0.5.
Biomolecules 14 00377 g001
Figure 2. Gene Ontology (GO) function and pathway enrichment analysis of up-regulated DEGs and down-regulated DEGs. The top 10 terms for each of the GO analysis categories’ biological processes (BPs), cellular component (CC) and molecular function (MF) are presented. (a) BPs of up-regulated DEGs; (b) CC of up-regulated DEGs; (c) MF of up-regulated DEGs; (d) BPs of down-regulated DEGs; (e) CC of down-regulated DEGs; and (f) MF of down-regulated DEGs.
Biomolecules 14 00377 g002aBiomolecules 14 00377 g002b
Figure 3. Analysis of differentially expressed gene (DEG) networks. (a) MCODE-clustered subnetwork of up-regulated DEGs. (b) MCODE-clustered subnetwork of down-regulated DEGs.
Biomolecules 14 00377 g003
Figure 4. Enrichment analysis of MCODE-clustered subnetwork of up-regulated DEGs by Metascape.
Biomolecules 14 00377 g004
Figure 5. Enrichment analysis of MCODE-clustered subnetwork of down-regulated DEGs by Metascape.
Biomolecules 14 00377 g005
Figure 6. Hub genes identified by cytoHubba. (a) Hub genes of the PPI network of up-regulated DEGs. (b) Hub genes of the PPI network of down-regulated DEGs.
Biomolecules 14 00377 g006
Table 1. List of miRNAs and their target genes. Each miRNA is associated with one or more target genes.
miRNAmiRNA AccessionGene TargetTissueUp/Down
hsa-let-7a-5pMIMAT0000062EEF2MuscleUp
hsa-mir-100-5pMIMAT0000098EEF1A1
RPL15
RPL12
MuscleUp
EEF1A1
RPL15
RPL12
hsa-mir-125b-5pMIMAT0000423EEF1A1MuscleUp
RPLP0
PABPC1
EEF2
hsa-mir-133a-3pMIMAT0000427EIF4A1MuscleUp
hsa-mir-133bMIMAT0000770EIF4A1MuscleUp
hsa-mir-134-3pMIMAT0026481RPL12MuscleUp
hsa-mir-1-3pMIMAT0000416HNRNPA1
HNRNPR
EEF1A1
EIF4A1
RPL15
RPL12
MuscleUp
hsa-mir-140-3pMIMAT0004597RPLP0 HNRNPA1
EIF4A1
EEF2
RPL15
MuscleUp
hsa-mir-193a-5pMIMAT0004614PABPC1MuscleUp
hsa-mir-206MIMAT0000462HNRNPA1MuscleUp
hsa-mir-26a-5pMIMAT0000082EEF2MuscleUp
hsa-mir-27a-3pMIMAT0000084PABPC1 HNRNPA1
EEF2
MuscleUp
hsa-let-7a-5pMIMAT0000062NDUFB4 NDUFA3
COX8A
MuscleDown
hsa-mir-100-5pMIMAT0000098COX5AMuscleDown
hsa-mir-134-5pMIMAT0000447COX8AMuscleDown
hsa-mir-1-3pMIMAT0000416NDUFB4 COX6C
NDUFA3 COX5A
NDUFA6
MuscleDown
hsa-mir-26a-5pMIMAT0000082COX5A
COX5B
COX8A
MuscleDown
Disclaimer/Publisher’s Note: The statements, opinions and data contained in all publications are solely those of the individual author(s) and contributor(s) and not of MDPI and/or the editor(s). MDPI and/or the editor(s) disclaim responsibility for any injury to people or property resulting from any ideas, methods, instructions or products referred to in the content.

