Review

Initial Events in Bacterial Transcription Initiation

by
Emily F. Ruff
1,
M. Thomas Record, Jr.
2 and
Irina Artsimovitch
3,4,*
1
Department of Biochemistry, University of Wisconsin-Madison, 1101 University Ave. Madison, Madison, WI 53706, USA
2
Departments of Chemistry and Biochemistry, University of Wisconsin-Madison, 1101 University Ave. Madison, Madison, WI 53706, USA
3
Department of Microbiology, The Ohio State University, 105 Biological Sciences, 484 W 12th Ave, Columbus, OH 43210, USA
4
Center for RNA Biology, The Ohio State University, 105 Biological Sciences, 484 W 12th Ave, Columbus, OH 43210, USA
*
Author to whom correspondence should be addressed.
Biomolecules 2015, 5(2), 1035-1062; https://doi.org/10.3390/biom5021035
Submission received: 28 March 2015 / Accepted: 14 May 2015 / Published: 27 May 2015
(This article belongs to the Special Issue Bacterial RNA Polymerase)

Abstract

:
Transcription initiation is a highly regulated step of gene expression. Here, we discuss the series of large conformational changes set in motion by initial specific binding of bacterial RNA polymerase (RNAP) to promoter DNA and their relevance for regulation. Bending and wrapping of the upstream duplex facilitates bending of the downstream duplex into the active site cleft, nucleating opening of 13 bp in the cleft. The rate-determining opening step, driven by binding free energy, forms an unstable open complex, probably with the template strand in the active site. At some promoters, this initial open complex is greatly stabilized by rearrangements of the discriminator region between the −10 element and +1 base of the nontemplate strand and of mobile in-cleft and downstream elements of RNAP. The rate of open complex formation is regulated by effects on the rapidly-reversible steps preceding DNA opening, while open complex lifetime is regulated by effects on the stabilization of the initial open complex. Intrinsic DNA opening-closing appears less regulated. This noncovalent mechanism and its regulation exhibit many analogies to mechanisms of enzyme catalysis.

1. Introduction

Transcription is the first step of gene expression and is therefore one of the most fundamental processes of life. All living organisms, as well as many viruses, encode at least one RNA polymerase (RNAP) enzyme that synthesizes an RNA copy of the template DNA; the core structure and many mechanistic and regulatory elements are shared by bacterial, eukaryotic and archaeal RNAPs (reviewed in [1,2]). Bacterial RNAPs are composed of a core enzyme, which carries out RNA synthesis, and a specificity (σ) subunit for recognition of promoter DNA sequence and subsequent events of initiation (Figure 1 and Figure 2). Specific binding to promoter DNA forms an initial closed complex and sets in motion a series of large conformational changes which bend the downstream duplex DNA into the active site cleft of RNAP and then open the DNA to form a transcription bubble, placing the template DNA strand into the active site. At some (but not all) promoters, subsequent conformational changes in RNAP and the nontemplate strand stabilize this initial open complex (reviewed in [3]). Many steps of this process are highly regulated by promoter DNA sequence, accessory protein factors and small ligands, nucleotide concentration, temperature, salt and solute concentrations, and other environmental variables; aspects of regulation are reviewed in [1,4,5,6,7].
Figure 1. Sequence-specific interactions between σ70 RNAP and regions of the promoter. Schematic representations of the subunits of RNAP core, σ70, and promoter DNA. RNAP: α2: cyan; β and β': gray; ω: black. σ regions: as shown. Promoter: UP element: cyan; −35 element: blue; extended −10: red; −10 element: yellow; discriminator: orange; transcription start site: green; DNA downstream of the transcription start site: gray. Linker regions in α and σ subunits are shown as springs. Nontemplate strand sequences of a “consensus” and λPR, T7A1 and rrnB P1 promoters are shown below; missing bases are indicated by dashes.
Biomolecules 05 01035 g001
Figure 2. Structural representation of key functional regions of Eσ70 holoenzyme. Structure created from PDB 4LK1, looking down the cleft in (A) and rotated 90° into the page and 90° counterclockwise in (B). Colors of regions of σ are the same as in Figure 1. Additionally shown: β' jaw (β' 1149–1990), brown; β' SI3 (β' insert 6; β' 943–1130), green; β SI1 (β insert 4; β 225–343), pink; active site Mg2+, red ball; αNTD (α 1–234), cyan.
Biomolecules 05 01035 g002
A detailed understanding of the mechanism of initiation and its regulation is centrally important throughout biology, with many applications in biotechnology, pharmacology, and medicine. Determination of noncovalent mechanisms like that of open complex formation and stabilization require both kinetic and structural studies. High resolution structural studies provide detailed information about reactants and products, as well as any intermediates that can be trapped and stabilized [8,9,10,11,12,13,14,15,16,17], but intermediates in open complex formation have been challenging to obtain and characterize in this way. Kinetic studies are used to investigate effects of promoter and RNAP variants, regulators, and regulatory variables [18,19,20,21,22], as well as to establish reaction conditions necessary to obtain transient high concentrations (bursts) of key intermediates for characterization by footprinting and other methods [23,24]. Real-time DNA footprinting provides snapshots of the population of intermediates (and any reactants and products) at any given time, as well as kinetic information about the change in the distribution of these species with time [23,25,26,27]. Ensemble and single-molecule experiments with fluorescent probes can provide unparalleled combinations of structural, dynamic and kinetic-mechanistic information [21,28,29,30,31,32,33,34,35].
Studies with Escherichia coli RNAP reveal that the early steps of open complex formation, including initial specific binding to the promoter and some or all of the coupled conformational changes that bend DNA into the cleft, are often rapidly reversible in comparison to the slower “isomerization” step that includes DNA opening and is the rate-determining step of open complex formation. The forward direction of the subsequent large conformational changes that stabilize the initial open complex are faster than the “bottleneck” opening step, and hence must be investigated by dissociation kinetic and mechanistic studies starting with the stable open complex. In the dissociation direction, these conformational changes are reversible on the time scale of the rate-determining DNA closing step. These and other aspects of this noncovalent RNAP-promoter mechanism make it formally analogous to mechanisms of enzyme (covalent) catalysis, wherein binding of substrate (or product, in the reverse direction) and subsequent conformational changes are typically rapidly reversible on the time scale of the rate-determining covalent catalytic step that, like noncovalent DNA opening, occurs in a local environment in the active site. For enzyme-catalyzed reactions, most regulation by inhibitors, activators, and allosteric effectors, as well as the cooperativity of multisite enzymes, occurs in the reversible initial binding steps, while the central catalytic step is relatively insensitive.
In this review, we first discuss the status of the mechanism of forming and stabilizing the open complex between the E. coli σ70 RNAP holoenzyme and promoter DNA, including what is known about the key RNAP structural and DNA sequence determinants of the rates and equilibria of the steps of this mechanism. We then briefly discuss implications of this mechanism for regulating the rate of open complex formation.

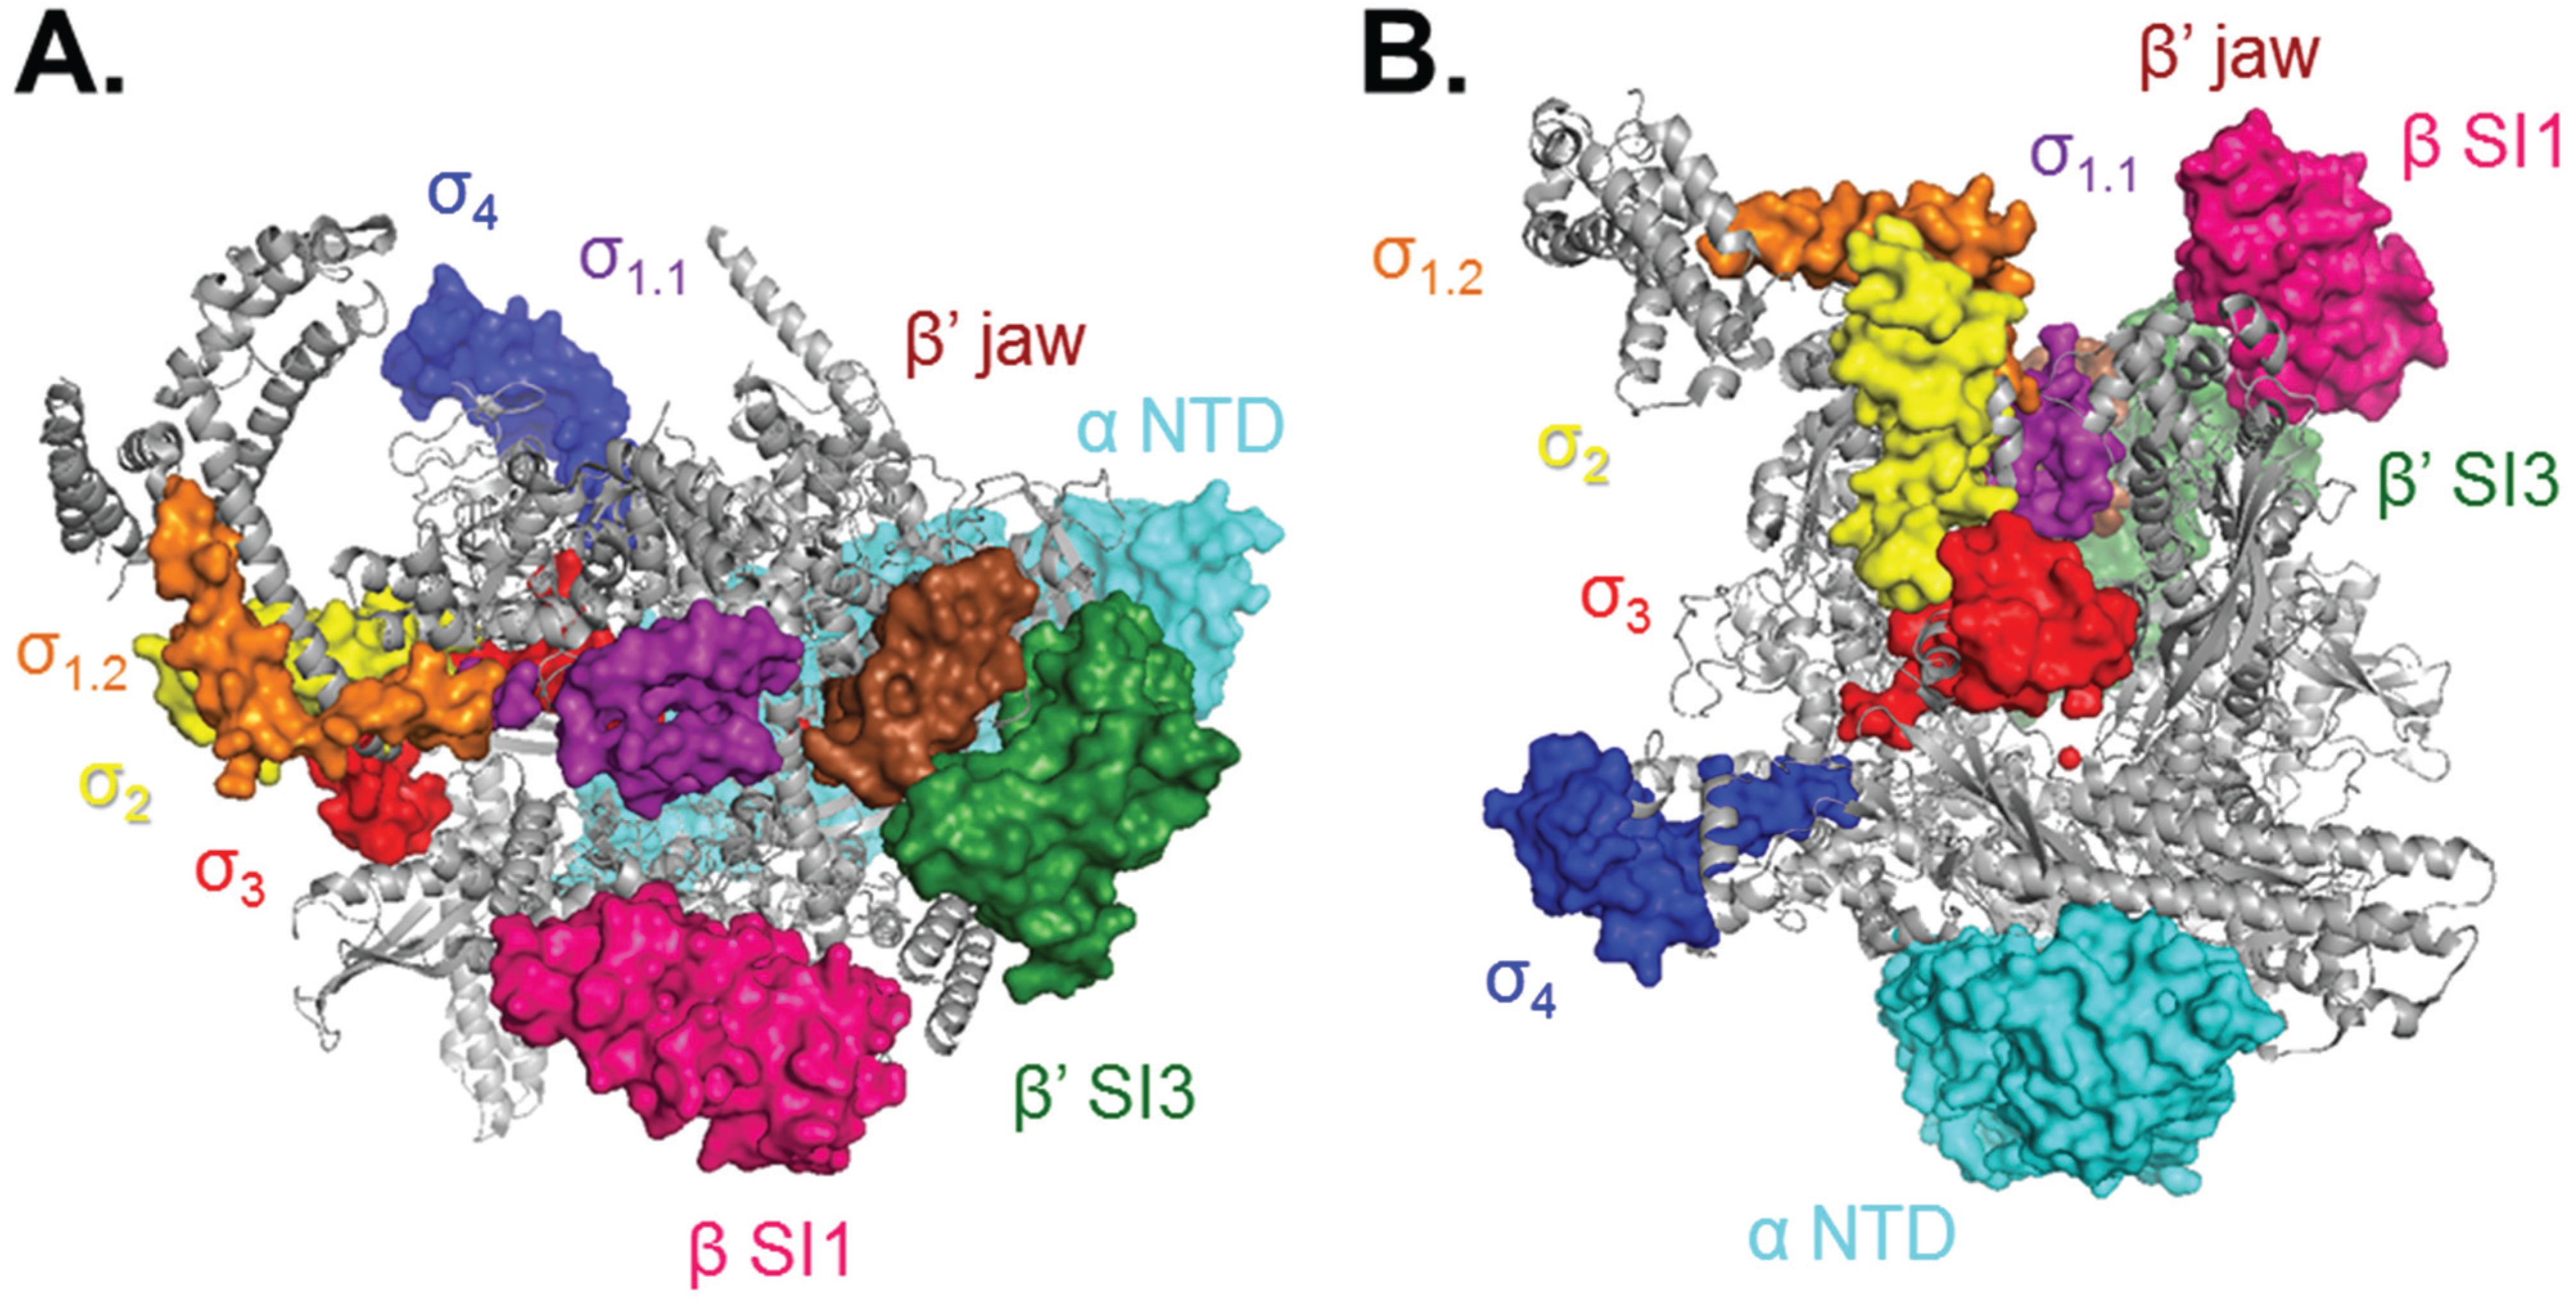
2. Bacterial RNAP σ70 Holoenzyme

E. coli RNAP core enzyme is a five-subunit 370 kDa assembly (α2β'βω) [36]; for an extensive review of this structure, see [37]. RNAP is shaped roughly like a crab claw, with an active site cleft running between the β' and β subunits [38]. Although the active site and the overall crab claw shape of RNAPs are highly conserved across all kingdoms [39,40], much of the enzyme is not. The surface of the RNAP is highly divergent, and in many organisms large insertions are present in the β, β' and σ subunits [41]. The functions of many of these regions have yet to be identified.
RNAP core enzyme carries out all steps of transcription except promoter-specific initiation, which requires an accessory σ factor. There are seven σ factors in E. coli, which mediate transcription of distinct sets of genes (reviewed in [5,42]). Holoenzyme containing σ70 (termed the “housekeeping σ”) transcribes most of the genes required for growth and cell maintenance, whereas others have more specialized roles, e.g., during stress and nutrient limitation. By itself σ70 is incapable of promoter binding and DNA opening. Binding to RNAP core enzyme unmasks specificity determinants in σ70 [14,16] and creates the functional holoenzyme.
As part of holoenzyme, σ70 recognizes a promoter composed of two well-conserved sequence elements, the −10 and −35 hexamers (Figure 1), which are separated by a 16–19 bp spacer region. σ70 is folded into four domains connected by flexible linkers [43]. Upon binding of σ to core, the domains remain independently folded while the linkers extend [13,14,16]. Each domain of σ70 interacts with both RNAP and DNA; domains 2 and 4 make specific contacts with the −10 and −35 regions, respectively [43], while domain 3 interacts with the extended −10 region present in some promoters [44].
The flexible N-terminal σ70 region 1.1 (σ1.1; Figure 2, purple) consists of a three-helix bundle connected by a flexible linker to σ1.2 [45]. σ1.1, found only in the homologous group 1 σ factors, autoinhibits free σ factor from binding to DNA in the absence of core [46] and occupies the active site cleft in the absence of DNA [8,12]. Kinetics experiments with RNAP lacking σ1.1 indicate that this mobile element increases both the isomerization rate (including DNA opening) [47] and the dissociation rate of open complexes [18,19].
In crystal structures [8,12,14,16], the active site cleft is ~70 Å deep and 100 Å long, but only ~15 Å wide. Early cryo-EM structures [48] and a recent FRET study in solution [49] reveal that the cleft is dynamic, with a significant fraction of holoenzyme molecules displaying a much wider (20–25 Å) cleft. This flexibility is likely due to the movement of comparatively rigid RNAP “modules” relative to each other. Multisubunit RNAPs contain five “switch” regions [39,40], which undergo conformational changes during open complex formation, altering relative positions of the modules. Wider clefts, resulting largely from different positioning of the “clamp” module, have been observed in a paused complex [50] and a complex with transcription factor Gfh1 [51]. Opening of the clamp has been proposed to underlie the mechanism of action by the stress alarmone ppGpp [52,53]. Several antibiotics inhibit modular movements of RNAP by binding to or near these switch regions [54,55,56].
Opening of the RNAP clamp likely permits loading of the duplex DNA during initiation. Since the hydrated DNA duplex is about 25 Å wide, early models of open complex formation proposed that DNA opening occurred outside the cleft before entry of the strands [13,37,57]. However, the extended downstream footprint (to +20, relative to the transcription start site) observed for advanced closed complexes demonstrates that the downstream duplex enters the active site cleft before it is opened [27,58,59,60]. A more open cleft obviates the need for separating the strands prior to entry.

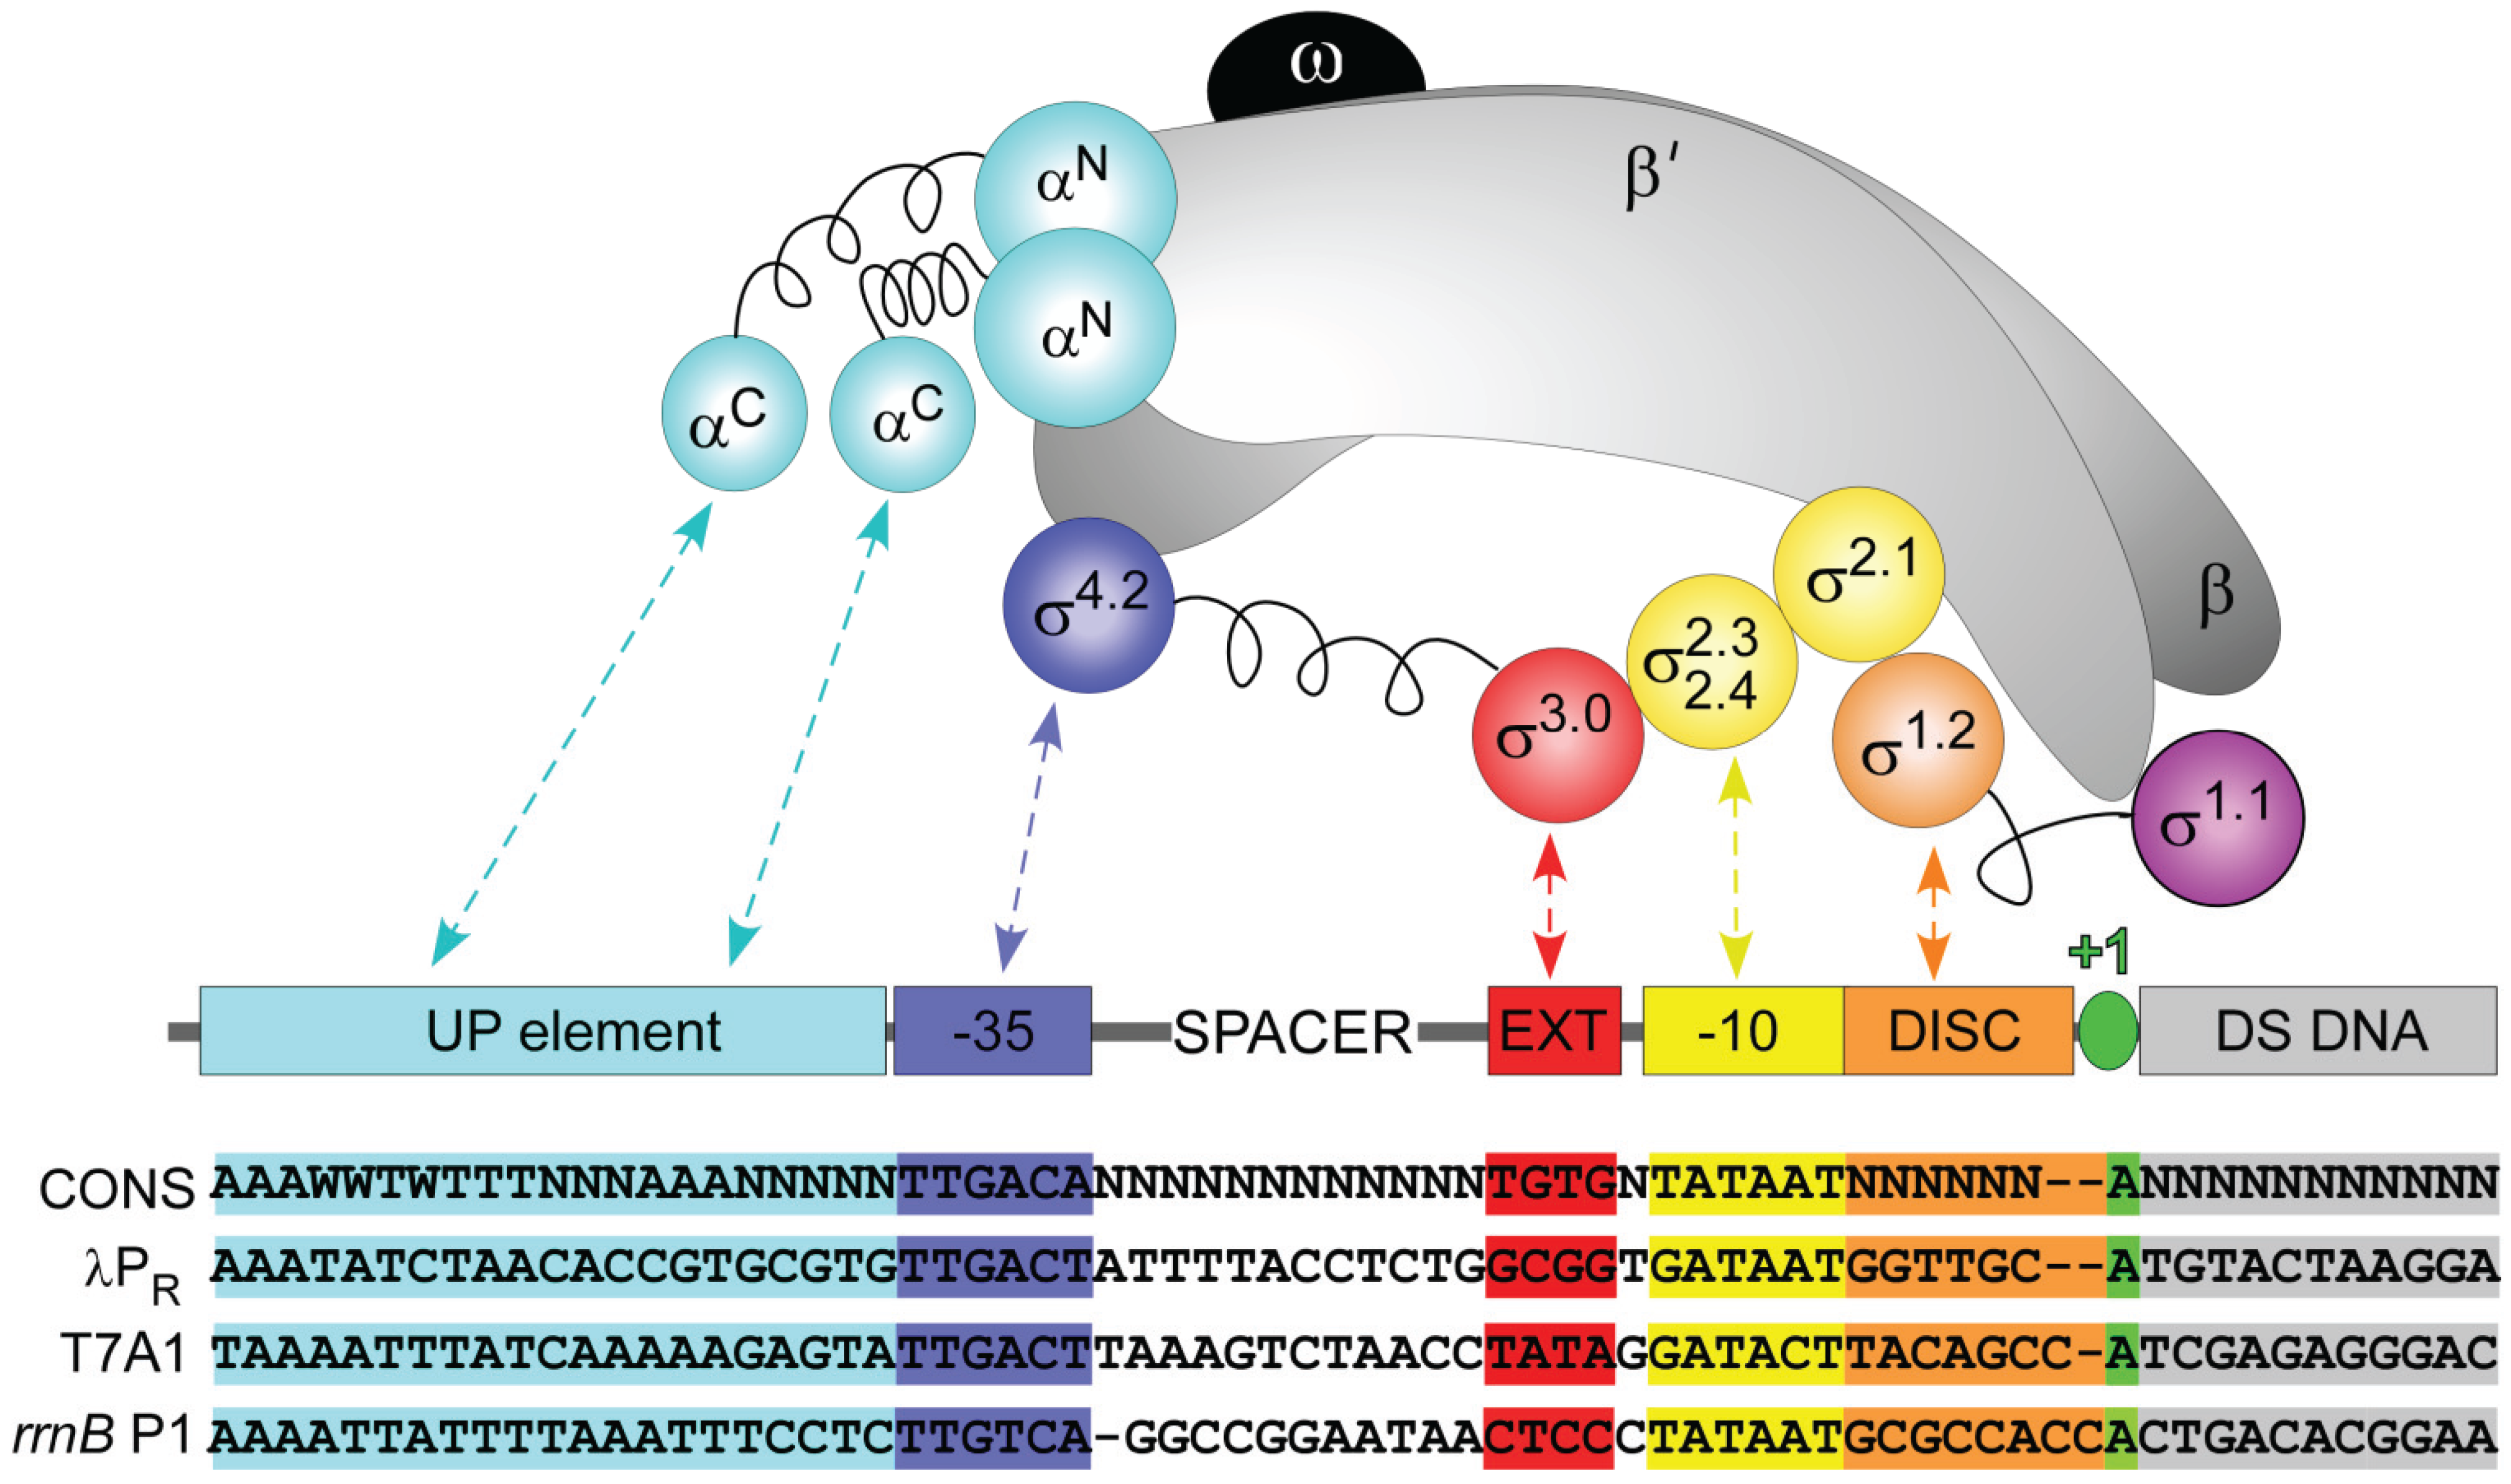
3. E. coli σ70 Promoter Recognition

In vivo, initiation rates vary at least 10,000-fold for different promoters [61,62]. Rates of open complex formation (at a specified [RNAP]) and dissociation in vitro both span a similar range determined by the sequence and structure of the promoter DNA [61,62]. For a given promoter sequence, changes in temperature, salt, and solute concentrations [24,63,64,65,66], as well as additions of protein factors and ligands, can affect these kinetics by 10–1000-fold or more.
Promoter elements have been defined structurally, genetically, and/or functionally (summarized in Figure 1). What promoter regions are most important for which steps in the mechanism? As an extension of the bipartite proposal of promoter function [67], a working hypothesis is that promoter sequence and structure upstream of (and including at least part of) the −10 element direct the steps of initial binding of RNAP and subsequent conformational changes that culminate in bending of the downstream duplex into the cleft. These steps precede the central DNA opening step, which opens approximately 13 bp (−11 to +2 at λPR) of the promoter DNA. Collectively these steps determine the rate of open complex formation. For some (but not all) promoters, promoter elements in and downstream of the −10 element direct post-opening steps of the mechanism (in particular open complex stabilization) that determine the lifetime of the open complex. All of these steps are discussed in subsequent sections.
The farthest upstream sequence-specific interactions between RNAP and promoter DNA are in the UP element region from approximately base −40 to −60 (Figure 1, cyan; reviewed in [68]). UP elements are phased AT-tracts recognized by the C-terminal domains of the α subunits (αCTDs); the narrow minor groove at these sequences favors specific αCTD binding [69]. UP elements were first noted for their ability to increase transcription from the rRNA promoters, and a consensus UP element sequence determined using mutational analysis increased transcription 330-fold in vivo [70,71]. The entire UP element consists of two subsites, proximal and distal, one for each αCTD; promoters may have one or both, although the distal UP element tends to function nearly as well as a full UP element [72]. Because of the curvature generally observed at phased A- or T-tracts, it was hypothesized that the main function of UP elements was to bend the DNA. However, not all UP elements display significant curvature [73] as even single base disruptions in an A- or T-tract can practically abolish bending [74].
At λPR and T7A1, real time and low temperature DNase and hydroxyl radical (OH) footprinting of closed complexes reveals that recognition of the −35, −10, and UP elements induces bending of upstream DNA at −38 and −48 [27,59,75] and wrapping of the region from ~ −60 to −80 on RNAP [25,26,27,59,75,76]. Structural evidence for bending at the −35 element is provided by [43,77], and a discussion of functional bending by the αCTDs is provided in [68]. These upstream interactions are very important for efficient open complex formation at λPR and lacUV5 (see below) [75,78].
The −35 element (Figure 1, blue) has the consensus sequence 5'-TTGACA-3' [79] with the −35T, −34T, and −33G being the most highly conserved [80]. These bases interact via the major groove with a helix-turn-helix motif of σ4.2 (Figure 1 and Figure 2, blue), which bends the DNA approximately 36° in cocrystal structures of the −35 element and Thermus aquaticus σ4.2 [13,43] and a recent initiation complex structure with E. coli holoenzyme [77]. Strong DNase I footprinting enhancements suggestive of bending are also observed at the upstream end of the −35 element at λPR [75]. This strong bend observed in solution may be due to σ4 interacting with the αCTDs [12,81]. At some promoters, σ4 interacts with activators such as λCI [82] and CAP [11,83,84,85], influencing multiple steps of transcription initiation. This region can also interact with the core RNAP to mediate recruitment of elongation factors [86].
There is no consensus sequence for the majority of the spacer between the −35 and −10 elements, but there is a consensus length, which is dictated largely by the spacing between σ4.2 and σ2.3 [13]. The most common spacer length for σ70 promoters is 17 bp [79,87,88], and promoters with 17 bp spacers produce greater amounts of transcript in multi-round assays than otherwise identical promoters [89,90,91]. The length and extent of bending (as predicted by molecular modeling) of the spacer region modulate the effect of σ1.1 on transcription initiation kinetics and the structure of the open complex [92]; the underlying mechanism is unknown, but the authors speculate that this may be due to σ1.1 acting as a “gatekeeper”, discriminating between promoter and non-promoter DNA based on the trajectory of the spacer from the −35 element to the −10. Recent structures of E. coli σ70 initiation complexes formed with 4–5 nt nascent RNAs reveal that rotation of σ4 is required to accommodate different promoter spacer lengths [77]. A region within the spacer defined as the “Z-element” (bases −24 to −18) was also identified in a recent study as interacting with the β' zipper (residues 40–45), increasing the amount of abortive transcription from a synthetic promoter [93]. It is not known, however, whether this interaction is sequence-specific or simply specific to a certain spacer conformation or trajectory.
At some promoters, an “extended −10” sequence (TGn; Figure 1, red) increases activity through specific contacts with σ3.0 [44,94] (Figure 1 and Figure 2, red), perhaps by increasing the lifetime of the open complex [95]. The TGn motif was found in 20% of the 554 promoters identified in one study [87], with 44% of these promoters having a G at −14. The TGn motif may be particularly important at promoters with weaker −35 elements [43] or longer spacers [87]. In E. coli initiation complex structure, the extended −10 element is recognized by the insertion of two perpendicular helices of σ2 and σ3 into the major groove [77].
The −10 element (Figure 1, yellow), with an all-AT bp consensus sequence (5'-TATAAT-3') constitutes the upstream half of the region opened by RNAP, with opening likely initiated near its upstream end. The transcription bubble forms downstream of base −12 (for λPR and other promoters with six bp discriminators; see Figure 1). This position remains base paired [77,96], with the E. coli σ70 Q437 likely making a key sequence-specific contact [97] with base −12A of the template strand [10]. After opening, the −10 region of the nontemplate strand interacts with conserved residues of σ, with the nearly invariant bases −11A and −7T in pockets of σ70 [10,17,98,99]. Residues of both template and nontemplate strands interact with σ2.4 [10,17]. Modeling and biochemical data suggest that these contacts require prior strand separation [10]. It remains unresolved whether recognition of this region requires the DNA to be single-stranded.
The base −11A is thought to nucleate DNA opening; alanine substitutions of aromatic residues in the −11A binding pocket on σ2.3 impair open complex formation, but not binding to duplex DNA [100]. Flipping of base −11A into its pocket may thus nucleate bending of the DNA into the cleft before opening at some promoters; alternatively, other RNAP-DNA interactions may first bend the DNA, nucleating −11A flipping [10]. A recent comparative kinetic study of all 4096 −10 variants [22] finds that RNAP interactions with −7T play a relatively stronger role in open complex formation kinetics, suggesting a model in which bubble nucleation occurs at −7T, or −7T flipping stabilizes the bubble in the transition state, or both. While −11A and −7T are the most conserved bases of the −10 element [79,88,101], they are not absolutely required for relatively fast initiation kinetics, particularly if the −10 element is sufficiently AT-rich [22]. A recent structure shows that E. coli σE uses a similar base flipping mechanism to recognize, and possibly nucleate opening at, the −10 element [102].
The discriminator region between the −10 element and the start site (Figure 1, orange) is involved in regulation of open complex lifetime. Its upstream end interacts with σ1.2 [9,17,77,95,103] (Figure 1 and Figure 2, orange). Most discriminators are 6–8 bases in length [88]. Mutational analyses [104,105,106] indicate that lifetime decreases as discriminator length increases from 6 to 8 bases. A bioinformatic analysis of E. coli promoters [107] found that the frequency of discriminators also decreases with increasing length from 6 to 8 bases. These observations together indicate that many E. coli promoters form long-lived open complexes. More recent efforts to comprehensively map the transcription start sites in E. coli [108] will no doubt lead to elucidation of the in vivo importance of the sequence of this region. Structural data indicate that for a six-base discriminator, −6G on the nontemplate strand flips into a pocket on the surface of σ1.2 [17]. The −5 nontemplate strand base is also very important for open complex stability, with a G being relatively stabilizing and a C being relatively destabilizing [95]. Similarly, σA from T. aquaticus binds most favorably to a 5'-GGG-3' sequence immediately downstream of the −10 element [109]. The rRNA promoters generally have a C on the nontemplate strand two bases downstream of the −10 element [110], leading to short open complex lifetimes; this sequence element is important for their regulation in vitro and in vivo [95].
A recent crystal structure of a model open complex identifies a “core recognition element” (or “CRE”, bases −4 to +2 on the nontemplate strand) recognized by the β subunit [17]. Base +2G is flipped into a pocket, increasing the lifetime of an RNAP-fork junction complex containing a consensus −10 element and strong discriminator [17]. Each CRE base except −1 appears to be specifically recognized, and substitutions in the corresponding β residues lead to defects in transcription initiation. No consensus sequence of CRE has been detected [87] and thymine bases in this region are generally observed to be reactive to permanganate, implying that they are exposed to solvent. However, in vivo footprinting argues that CRE interacts with RNAP during elongation [111] and base-specific interactions involving the CRE have been implicated in pausing [112].
The most common transcription start site base is A ≥ G > T >> C [106]. Subsaturating concentrations of the initiating nucleotides affect the kinetics of initiation, just as the concentration of any substrate affects the velocity V of an enzyme-catalyzed reaction for subsaturating concentrations (where V < Vmax). In addition, binding of initiating NTP stabilizes the short-lived open complex at rRNA promoters [113], shifting the distribution of promoter complexes from closed to open in a NTP concentration-dependent manner.

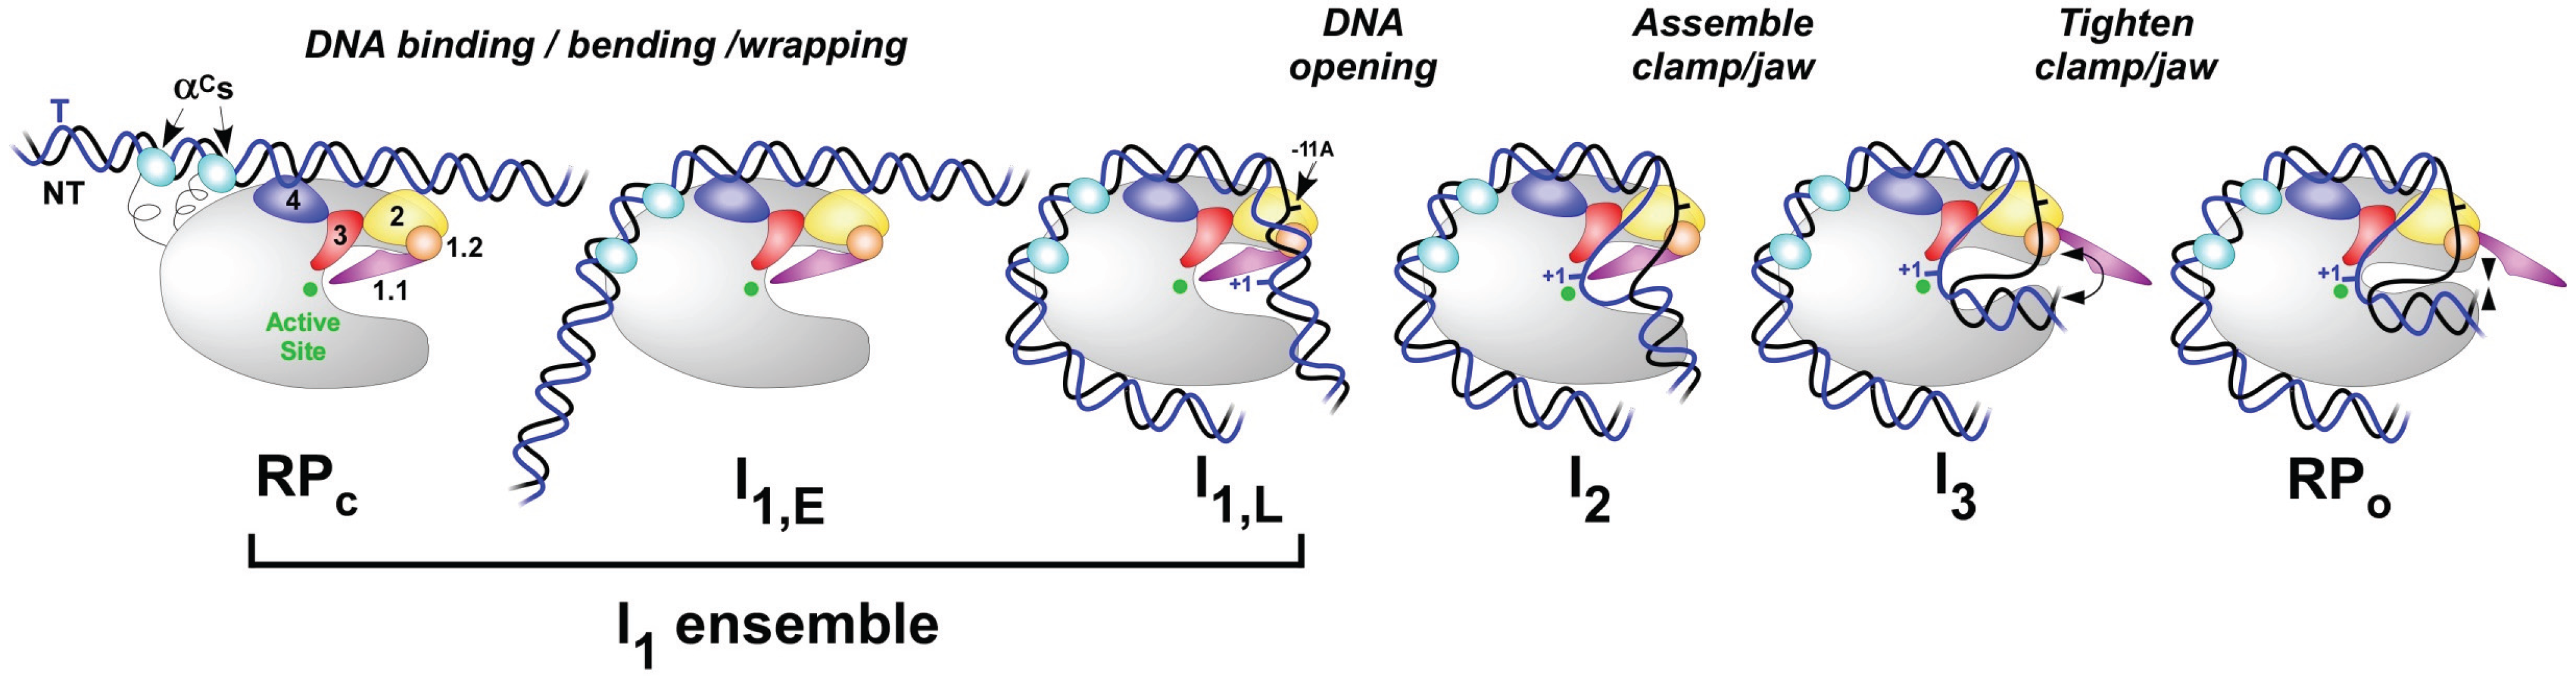
4. Initial Binding and Subsequent Conformational Changes to Form and Stabilize the Open Complex at Eσ70 Promoters

Ensemble and single-molecule kinetic-mechanistic studies with wild-type or variant RNAP and promoter DNA, DNA footprinting in real time or at low temperature, crosslinking and fluorescence studies, and high resolution structures of initial and final states provide much information about the sequences of conformational changes and intermediate complexes on the pathway that forms the initial open complex and converts it (at some but not all promoters) to a more stable, longer-lived open complex (Figure 3). Initial specific binding to the promoter sets in motion conformational changes in which the RNAP molecular machine operates on promoter DNA to bend, wrap, and open the duplex and stabilize the open complex, with mobile regions of RNAP playing key roles. The rates and equilibria of these conformational changes are functions of promoter sequence, solution conditions, and regulatory factors or ligands. Rates of open complex formation and lifetimes of the most stable open complex differ by three to four orders of magnitude or more for different promoters under typical in vitro transcription conditions. In this section, we qualitatively discuss this pathway. In the following section, we discuss the interpretation of the experimentally determined rate and equilibrium constants for open complex formation and dissociation in terms of these conformational changes.
Figure 3. Schematic representation of proposed intermediates in open complex formation and dissociation at λPR promoter. Closed complexes like RPC, I1,E (early), or I1,L (late) can be significant members of the rapidly equilibrating I1 ensemble. The αCTDs are shown in cyan; other colors are the same as in Figure 1.
Biomolecules 05 01035 g003

4.1. The Promoter Search and Initial Specific Binding to Form RPC

During initiation, RNAP holoenzyme first searches for and specifically recognizes promoter DNA, forming an initial closed complex generally called RPC (Figure 3). The bimolecular rate constant for formation of a closed complex between Eσ70 and rrnB P1 promoter on a short (204 bp) DNA is 2 × 10⁸ M−1·s−1 [71]; that for a closed complex between Eσ54 RNAP and an 853 bp fragment containing the S. typhimurium glnAp2 promoter is 2.1 × 10⁷ M−1·s−1 [21]. These provide lower bounds on the rate constant for RPC formation at these promoters, which are one or two orders of magnitude less than the theoretical three-dimensional (3D) diffusion limit (~6 × 10⁹ M−1·s−1 for equal-sized reactants). Is the rate of formation of the initial specific complex RPC determined by 3D diffusion of RNAP and promoter DNA, or by nonpromoter binding followed by 1D diffusion (i.e., sliding) and/or hopping of RNAP which can increase the rate constant above the 3D limit? Although some early studies (including [114,115,116,117,118]) argued in favor of RNAP sliding, recent single-molecule studies provide evidence against it [119,120], while suggesting a role for RNAP hopping [121]. Since thermodynamics is path-independent, sliding or hopping should not affect the equilibrium constant for forming RPC. This equilibrium constant and not the second order rate constant for forming RPC is generally the significant quantity for the kinetics of open complex formation (see Section 5). Hence sliding or hopping (if they occur) will increase the rate of open complex formation and initiation only if RPC formation is irreversible. Nonpromoter binding of RNAP [122] can have either a competitive or facilitating effect on promoter binding, depending on DNA length and solution conditions.
The initial specific closed complex RPC (Figure 3) and/or other early specific promoter complexes have been characterized by real time OH and permanganate footprinting of the T7A1 promoter [25,26] and by low temperature DNase, OH and permanganate footprinting of other promoters [58,123,124,125,126,127]. Footprinting reveals that RPC is closed and that RNAP is bound to the UP element, −35, spacer and −10 regions, protecting the upstream DNA from −55 to −5. Since no sites of enhanced DNase reactivity are observed in RPCs [58,123,124,125,126,127] the downstream duplex is presumably unbent. At λPR, only more advanced closed complexes than RPC have been detected, indicating that RPC must be significantly less stable than these extended-footprint closed complexes under the conditions studied.

4.2. Upstream Bending and Wrapping to Form More Advanced Closed Complexes

The first conformational changes induced by RPC formation may occur upstream of the −35 region. DNase footprinting of λPR closed complexes reveals enhanced reactivity at −38 on the template strand and within the UP element region (−48 on the template strand, −45 on the nontemplate strand), indicating DNA bending or other distortions at these positions [75]. Periodic protection of the upstream DNA from OH attack is observed upstream to approximately base −80 [27], and downstream to base +20. This indicates that the far upstream promoter duplex is lying on the “back” surface of RNAP (see Figure 3 and [27]).
The mechanism of forming this bent, wrapped interface is unclear. Since the αCTD are on flexible tethers, extension of the tethers allows them to bind specifically to the UP element or nonspecifically to DNA upstream of the −35 element in RPC (see Figure 3). Specific binding to the proximal UP element brings one αCTD (binding site centered at −42) into contact with region 4 of σ70; mutation of σ region 4 residues within this σ4-αCTD interface reduces transcription from some, but not all, UP element-containing promoters [81,83]. A second αCTD binds to the distal site, centered at base −52 [72]. There is no evidence that the two αCTD interact in open complex formation [68], but efficient transcription from promoters having only a distal UP element requires both αCTDs, suggesting that the second αCTD must somehow affect the overall stability of the complex [68,72]. In the model of Davis et al. [27], formation of these interfaces bends the DNA between −35 and −60 nearly 100°, driving presumably nonspecific interactions between RNAP and DNA upstream of base −60.
Interactions of the upstream promoter DNA with the αCTD are observed to be very important for efficient open complex formation at λPR, which appears to have a distal UP element [75], and for efficient initiation at lacUV5, which has no UP element [78]. Truncation of λPR at base −47 (removing the specific distal UP element sequence and upstream DNA and, thus, probably most of the effect of the UP element [72]), or of lacUV5 at base −45 reduces the rate of the isomerization/DNA opening step (see Section 5) by 1.5–2 orders of magnitude; deletion of the αCTD and mutation of a single residue which eliminates αCTD-DNA binding have similar effects [78,128]. Smaller but significant effects of truncations upstream of −60 on the isomerization/DNA opening step are also observed [78,128]. Because the strong dependences of the kinetics on upstream DNA length are similar for both promoters, only nonspecific interactions with the αCTD appear necessary to generate these effects.
Far upstream interactions persist in the open complex at some (perhaps many) promoters. For lacUV5 open complexes, crosslinks between the αCTDs and nonspecific upstream DNA are observed even to base −90 [129]. Atomic force microscopy demonstrates that at λPR, DNA is extensively wrapped around RNAP in the open complex [76].

4.3. Bending the Downstream Duplex into the Cleft

In RPC, the downstream duplex (−5 to +20) is unprotected from OH and DNase, indicating that it is not interacting with the RNAP cleft [58,123,124,125,126,127]. By contrast, at λPR, the OH footprint of an advanced closed complex (like I1,L in Figure 3, obtained in real time [27]) is periodic and extends from −80 to +20, indicating that one face of the downstream duplex is in the cleft or otherwise protected by RNAP. Closed complexes with similar downstream footprint boundaries (between +15 and +25) are observed at other promoters and have been variously called RPi (at rrnB P1 [130,131], lacUV5 [127], and T7A1 [126]), RPC (at λprmup-1 Δ265[132]) and RPC2 (at the σ32 promoter groE [58,125]).
In the conversion of RPC to I1,L (Figure 3) the downstream DNA must be bent by at least 90° at the upstream end of the −10 element to enter the cleft [16,60]. What bends the duplex is not known. The −11A base flips out of the stacked duplex and into a pocket of σ70 region 2 [9,10,17]. If base flipping occurs before this region is bent, it would introduce a point of greater flexibility into the duplex, resulting in spontaneous bending of the duplex and its capture by the cleft. Alternatively, bending of the −10 region by RNAP may occur first, destabilizing the stacking and resulting in base flipping. If the interaction of σ70 region 2 with the unbent −10 region in early closed complexes were limited to the −12 position, this interaction might either induce flipping of the adjacent −11A base or dictate the site of bending and subsequent base flipping after a downstream interaction [10,97].
In-cleft elements like σ1.1 and downstream mobile elements (DME; see below) of free RNAP holoenzyme are positioned (Figure 2) to prevent entry of nonpromoter DNA into the active site cleft. These elements of RNAP appear to be part of an extensive, sophisticated network of upstream and downstream interactions that regulate the access of the downstream duplex to the cleft to form I1,L. Conversion of RPC to I1,L appears to involve a series of closed intermediates with different extents of downstream interaction, in which the extent of bending into the cleft may be coupled to the extent of upstream bending and wrapping discussed above. This regulatory network responds to promoter sequence and structure, as well as factor binding and solution conditions. Many of these same elements may also be involved in the regulation of open complex lifetime (see below).
Several lines of evidence exist for this network. As discussed above, truncation of upstream DNA greatly reduces the rate of the isomerization step of open complex formation. In addition to this, truncation of λPR at −47 shortens the downstream DNase footprint boundary of the advanced closed complex ensemble from +20 to +7 on the nontemplate strand and +2 on the template strand, indicating that only the upstream half of the downstream duplex (−10 to +2/+7) is inserted in the cleft in this closed complex [75]. Similarly, a RNAP variant lacking σ1.1 forms a closed complex footprint at early times at λPR, with a downstream boundary of ~ −5 [47]. Thus, upstream DNA interactions and σ1.1 facilitate bending of the downstream duplex into the cleft.
Similarly, at rrnB P1, the complex formed at equilibrium in the absence of nucleotides at 12 °C has a downstream boundary which is approximately +1 [130,131]. This footprint boundary requires that there be some bending at the −10 element, but not enough to fully load bases −10 to +20 into the cleft. What could be the reason for this partial bending in these complexes? We propose that impediments (σ1.1 and/or DME) to full entry of the downstream duplex into the cleft have not been fully removed.
At λPR, the series of conformational changes initiated by the binding interactions in RPC and culminating with bending the downstream duplex fully into the active site cleft are prerequisite for subsequent efficient DNA opening [27,64]. Upstream bending and wrapping are clearly targets of regulation by factors and ligands. Some transcription factors (e.g., CAP, IHF, Fis, and other nucleoid associated proteins) bind in or near the −40 to −60 region, bending DNA while also replacing or affecting the interaction of this region with the αCTD [6,7,68,133].

4.4. DNA Opening and Closing in the Cleft

At λPR opening of the entire 13 bp transcription bubble occurs in the rate-determining isomerization step that forms the first open intermediate, I2 (k2 in Figure 4) [23]. As for DNA melting in solution in the absence of RNAP, this step is highly temperature dependent, increasing 1000-fold between 7 °C and 42 °C with an activation energy of 34 kcal [60,66]. However, unlike in solution, the DNA opening step on RNAP is only weakly dependent on the concentrations of salt and solutes, consistent with a scenario in which it occurs in the local environment of the cleft [64]. The process of transcription bubble closing (k-2 in Figure 4), which is rate determining in dissociation, is even less affected by salt and solute concentration [24] and, at λPR and T7A1, does not appear to be strongly affected by DNA sequence or any modification of RNAP tested thus far, including large deletions [18].
Because the rate and equilibrium constants for transcription bubble opening and closing are only weakly (if at all) dependent on salt and solute concentrations, we propose that the regulation of the rate of open complex formation (and the rate of initiation in cases when open complex formation is the bottleneck) occurs primarily in the steps that form and remodel the closed complex, but not in the actual DNA opening step. However, whether this mechanism is universal is still a subject of some debate. Comparison of the timing of permanganate reactivity and downstream DNA protection at T7A1 has led to the proposal that at T7A1 opening occurs before the DNA is bent into the active site cleft [25].

4.5. Open Complex Stabilization

The conversion of the relatively unstable initial open complex (I2) to the highly stable open complex (RPO) at λPR involves conformational changes in DNA and RNAP. Comparison of permanganate footprints of λPR I2 and RPO indicates that the discriminator region of the nontemplate strand is repositioned in the cleft, becoming more reactive in RPO [23,95]. The large dependences of the equilibrium constant K3 for this step on urea and salt concentration indicate the folding/assembly of approximately 120 RNAP residues of the jaw and other DME on the downstream duplex [134]. Comparative quantitative studies with λPR truncated at base +12 and a β' jaw deletion mutant of RNAP indicate that the β' jaw DME [127] (Figure 2, brown) and β' sequence insertion 3 DME (also termed β' insertion 6; Figure 2, green) are involved in the assembly-DNA binding process that converts I2 to the much more stable RPO at λPR. In this model, supported by studies using RNAP and DNA heteroduplexes of varying lengths [29,30,31,135], the DME assemble on downstream DNA, stabilizing the open complex. Recent evidence suggests that the interaction of DNA between positions +4 and +6 with switch regions 1 and 2 may trigger cleft closure and DME folding/assembly and clamping [29].
Figure 4. Mechanism of transcription initiation: resolvable kinetic steps. Minimal mechanisms of open complex formation and dissociation, showing by color coding the steps that contribute to the observed rate constants (kobs, kd) for promoters like λPR that form a stable open complex RPO. For the common experimental situation of excess RNAP, the rate constant for open complex formation (kobs) is determined by the front half of the mechanism (boxed in purple), including the equilibrium constant K1 for formation of the ensemble of closed (I1) intermediates, the forward rate constant k2 of the isomerization step that includes DNA opening, and the excess RNAP concentration. Likewise, kd is determined by the late steps of the mechanism (boxed in green), including the rate constant k-2 for DNA closing and the equilibrium constant K3 for stabilization of the initial open complex I2 to form longer-lived I3 and/or RPO complexes [65,66].
Biomolecules 05 01035 g004
Kinetic dissection of open complex stabilization at λPR led to the discovery of a third on-pathway intermediate designated I3 [24]. Formation of I3 from I2 involves the majority (approximately two-thirds) of the folding and assembly of RNAP DME involved in converting I2 to RPO. The extent of this assembly is intriguingly similar to that observed for the open complex formed by a β' jaw deletion variant, which may therefore be an analog of I3 [134]. Another potential analog, based on similarity in lifetime and downstream interactions, might be the open complex formed at T7A1 [18,136]. The lifetime of the open complex formed with rrnB P1 (~1 s) [95] is intriguingly similar to that of I2 [24], consistent with the idea that the rrnB P1 sequence (in particular the weak discriminator and short spacer) precludes the stabilizing interaction from cleft closing and DME assembly induced by promoters like λPR and T7A1. Further experiments are required to explore the roles of promoter elements in the mechanism, and the potential relevance of I2, I3 and other forms of the open complex to transcription initiation and its control.

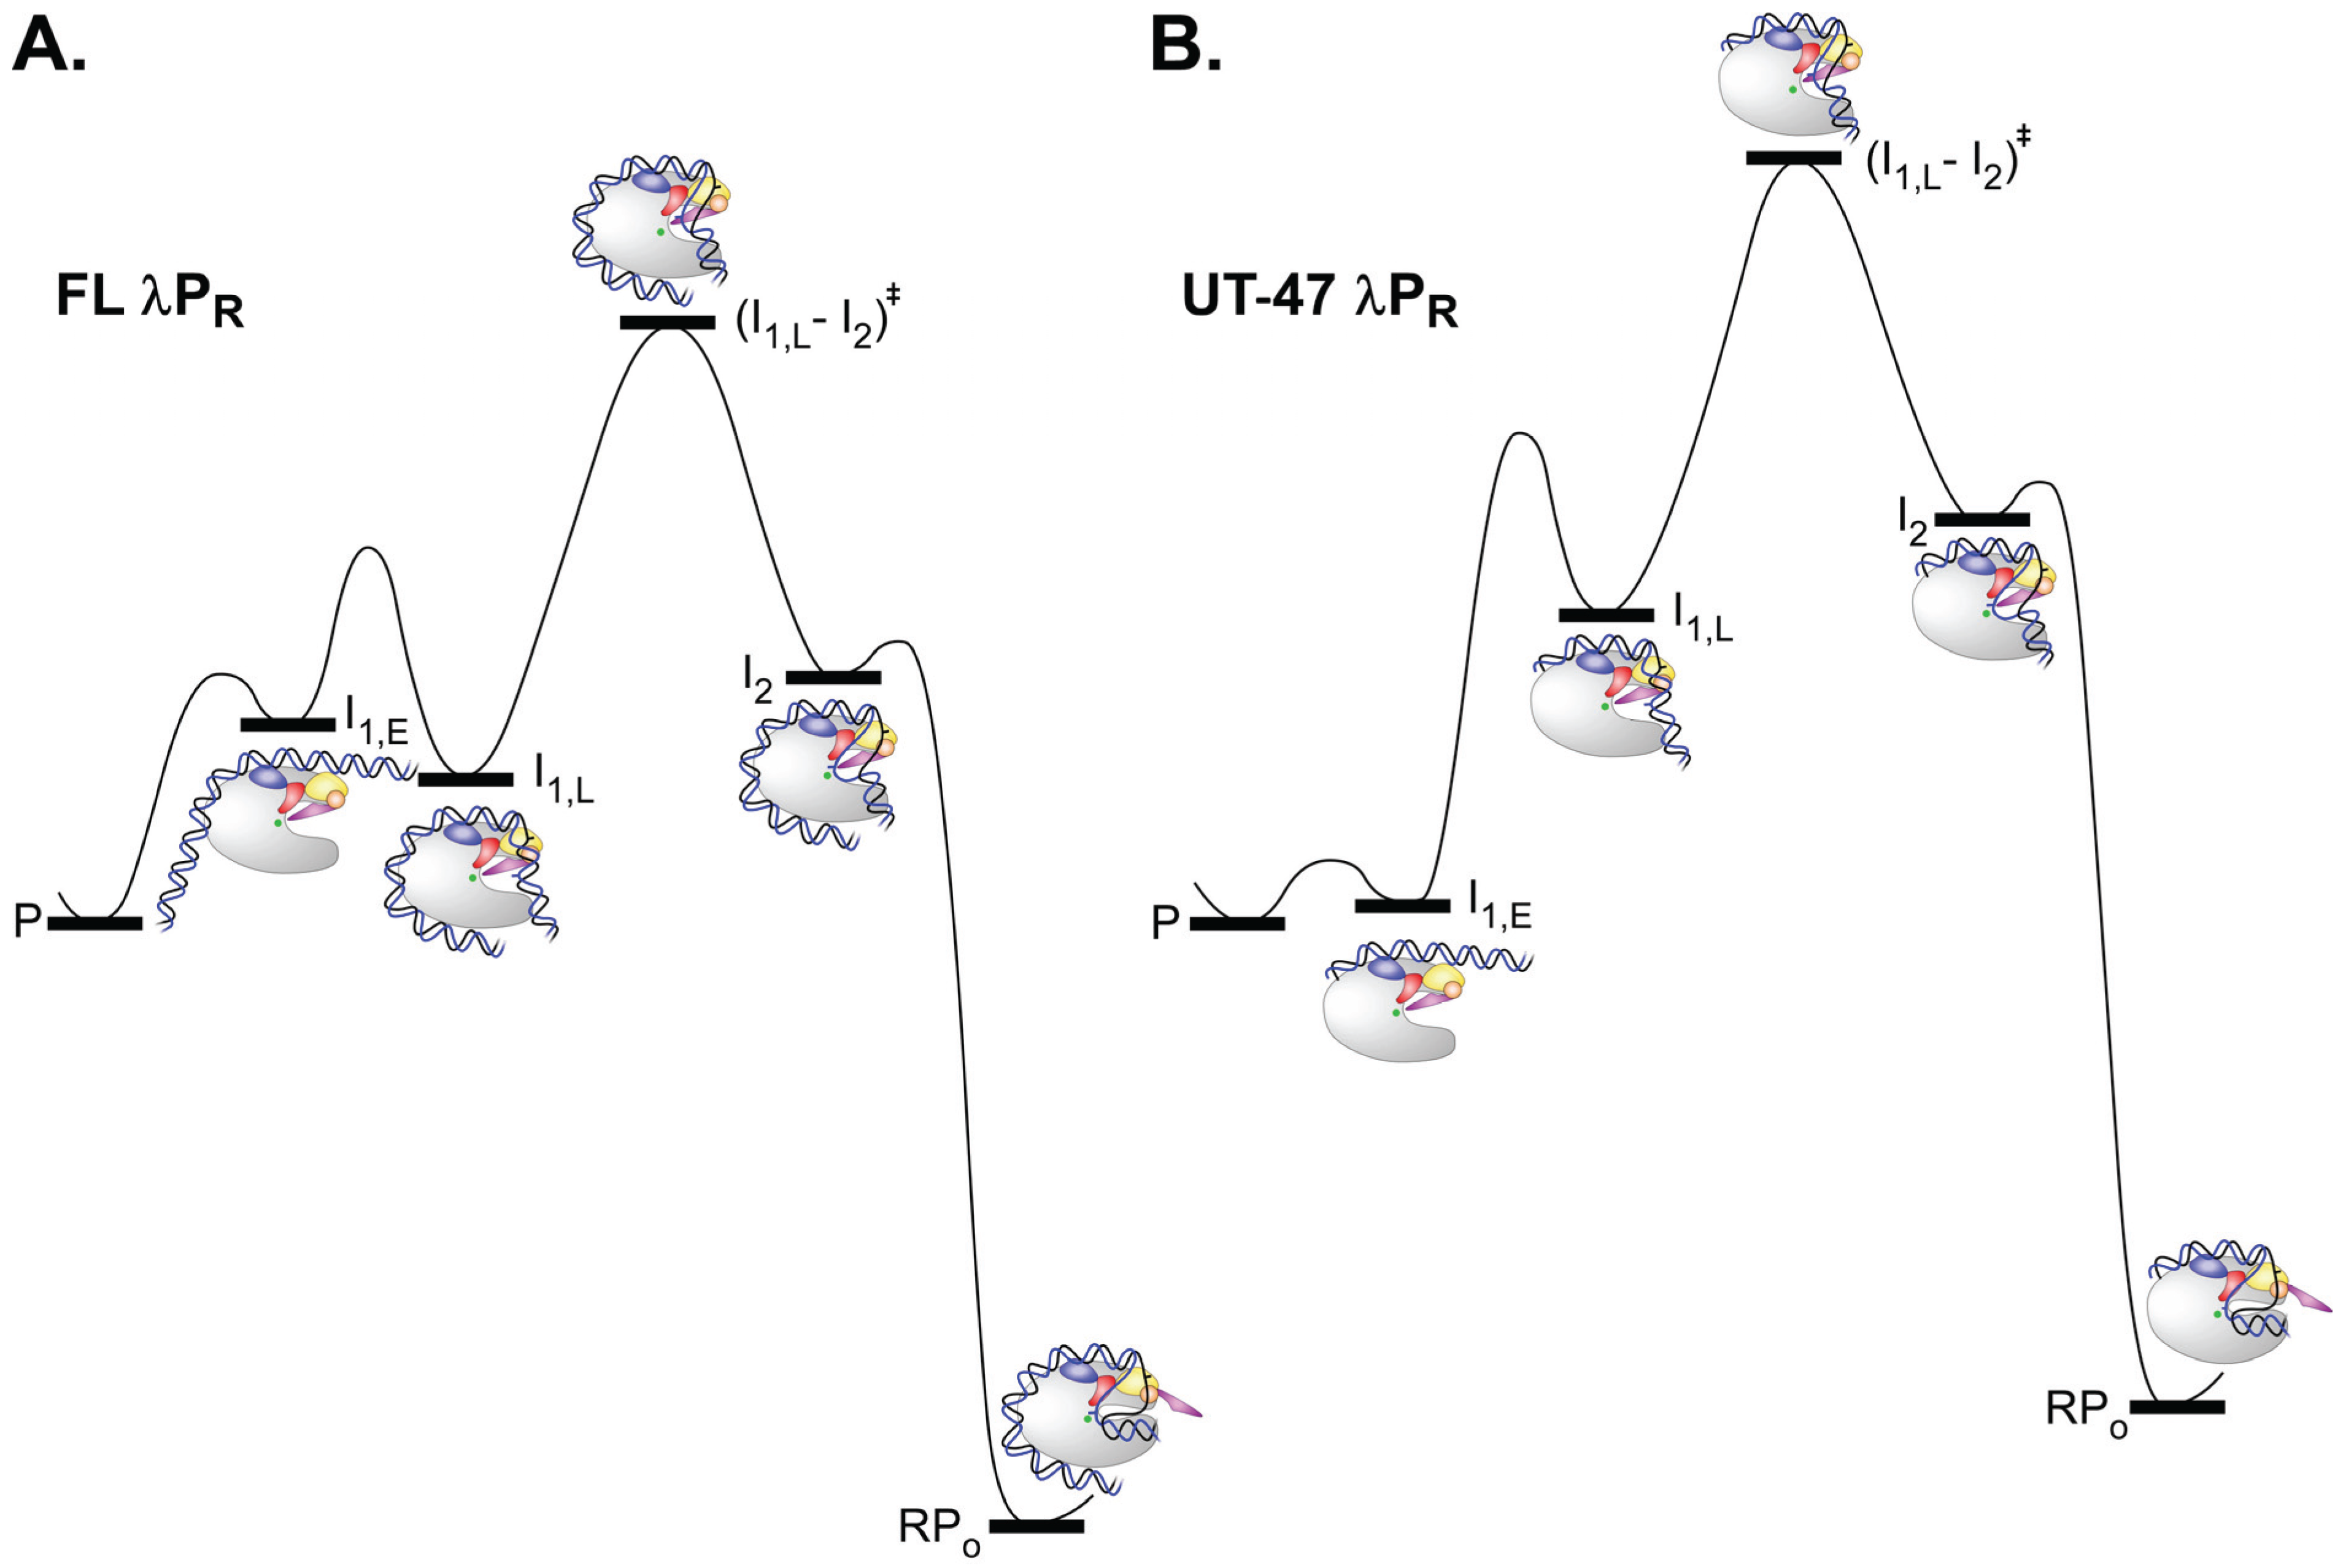
5. Forming and Stabilizing the Open Complex; Regulation of the Kinetics by Promoter Sequence, Length and Other Variables

Kinetic studies are essential to any determination of mechanism, together with structural information about intermediates. Among other insights, kinetic data provide evidence for the minimum number of key intermediates and indicate how to trap or populate them. Knowledge of kinetics and mechanism is necessary to understand how promoter sequence, regulatory factors, ligands, and solutes/salts exert their effects, and to design inhibitors, including antibiotics.

5.1. Kinetics and Mechanism of Open Complex Formation

The kinetics of open complex formation in excess RNAP at concentration [R] are found to be single exponential with a rate constant (kobs), which is a hyperbolic function of [R]. These kinetic data are well described by Mechanism 1 (see also Figure 4) with a reversible initial step (with equilibrium constant K1) that includes promoter binding and forms a closed intermediate I1, followed by a rate determining “isomerization” step (with rate constant k2) to convert I1 to the stable open complex (RPO) [137,138].
K 1             k 2 R + P I 1 R P O
While evidence now exists for an ensemble of closed intermediates I1 and several different intermediate open complexes, Mechanism 1 remains useful for analysis of the kinetics of open complex formation, and the quantities K1 and k2 are interpretable in terms of the species in the I1 ensemble.
The observation of single exponential kinetics means that the species in the I1 ensemble rapidly equilibrate with one another and with free P on the time scale of its conversion to RPO [139]. Analysis of Mechanism 1 for this situation (see Figure 4, bottom) yields:
kobs = θI1k2
where θI1 is the fraction of closed promoter DNA present as I1 complexes:
θ I 1 = [I 1 ] [ P ]  + [I 1 = K 1 [ R ] 1 + K 1 [ R ]
The interpretation of K1 and k2 depends on the details of the I1 ensemble, as indicated for the particular case of two closed complexes below.

5.2. Kinetics of Open Complex Formation for λPR and λPR Variants: Interpretation of kobs

As an example relevant for analysis of the single-exponential kinetics of open complex formation by full-length (FL) and upstream truncated (UT) λPR promoters, consider the situation where the I1 ensemble consists of one early closed complex (designated I1,E) and the most advanced closed complex (I1,L). Since the kinetics of RPO formation are single-exponential, I1,E and I1,L are in rapid equilibrium with one another and with P on the time scale of conversion of I1,L to RPO. For this case Mechanism 1 is rewritten as:
K 1,E             K 1,L             k open R + P I 1,E I 1,L R P O
where kopen is the rate constant for the elementary, rate-determining DNA opening step involving I1,L.
For Mechanism 2, kobs in excess RNAP is given by Equation (3):
kobs = θI1Lkopen
where θI1L is the fraction of closed promoter DNA present as I1,L complexes:
θ I1L = I 1,L P+ I 1,E  + I 1,L = K 1,E K 1,L [R] 1+ K 1,E (1+ K 1,L )[R]
Comparison of Equations (1)–(4) shows that the observed isomerization rate constant k2 of Mechanism 1 is interpreted using Mechanism 2 as:
k 2 = K 1,L 1+ K 1,L k open = f I1,L k open
where f I1,L is the fraction of I1 complexes that are I1,L:
f I1,L = K 1,L 1+ K 1,L = [I 1,L ] [I 1,E ] + [I 1,L ]
The observed closed complex binding constant K1 of Mechanism 1 is interpreted using Mechanism 2 as:
K 1 = K 1,E   ( 1 + K 1,L ) = [I 1,E ] + [I 1,L ] [P][R]
In words, K1 of Mechanism 1 is the overall I1 binding constant written in terms of total I1 concentration. If the mechanism is more complicated than Mechanism 2, with additional on-pathway closed complexes in rapid equilibrium with one another on the time scale of DNA opening, Equations (5) and (7) increase in complexity, but the general principle still applies that the observed isomerization rate constant k2 is the product of kopen and the fraction of closed complexes that are I1,L. Only if all closed complexes are I1,L (i.e., K1,L >> 1) does k2 = kopen; in this case K1 = K1,EK1,L for Mechanism 2.
Here we apply Mechanism 2 to interpret the large differences in K1 and especially in k2 for open complex formation by full length (FL) and upstream-truncated UT-47 λPR promoters at 37 °C [75]. Isomerization is much faster for FL λPR (k2 = 0.66 s−1) than for UT-47 λPR (k2 = 0.03 s−1), but closed complex binding is weaker (K1 = 5.8 × 10⁶ M−1 for FL; K1 = 2.6 × 10⁷ M−1 for UT-47.) For FL λPR, low temperature equilibrium OH footprinting [59] and fast OH footprinting [140,141] reveal that the population of closed I1 intermediates is advanced with the DNA significantly protected to +20. Hence the observed isomerization rate constant k2 is probably not much less than the DNA opening rate constant kopen. Here, for purposes of illustration, we estimate kopen to be 1 s−1 at 37 °C. (The maximum rate of transcription initiation at 37 °C is known to be ~ 1 s−1 [61,62], indicating that kopen ≥ 1 s−1.) From k2/kopen = 0.66 and Equation (5), K1,L = 2 so 2/3 of closed complexes are I1,L, consistent with the footprinting data on the I1 ensemble. From K1 = 5.8 × 10⁶ M−1 and the interpretation of k2 in Equation (5) and Mechanism 2, K1,E = K1/3 = 1.9 × 10⁶ M−1. For FL λPR a plausible free energy vs. progress diagram for the steps of open complex formation is given in Figure 5A, which is drawn to scale for [R] = 30 nM, corresponding to K1,E[R] = 0.06 and a correspondingly small occupancy of I1,E at 30 nM RNAP. The barrier height for the rate determining opening step (rate constant kopen = 1 s−1) is set for (I1,L-I2) transition state decomposition frequencies of 103 s−1 in each direction [128].
For the UT-47 λPR variant, in which the distal UP element and far upstream DNA are missing, k2 is only 3% of the FL λPR value [75], even though there is no obvious reason for upstream truncation to affect the intrinsic opening rate constant kopen, and the closed complex binding constant K1 is 4.5 fold larger than for FL λPR, even though favorable distal UP element interactions are eliminated by truncation at −47. Should the large reduction in k2 for UT-47 be interpreted as a reduction in kopen or as a shift in the closed complex ensemble to less advanced species? Footprinting evidence supports the latter interpretation: in UT-47 I1 ensemble, the downstream boundary of DNase protection is at +2/+7, indicating that the downstream duplex is only partially bent into the cleft. Hence, the absence of far-upstream DNA results in a less advanced closed complex ensemble for UT-47 λPR.
Figure 5. Reaction progress diagrams for open complex formation by (A) FL and (B) UT−47 λPR, interpreted using Mechanism 2. Free energies of the rapidly-equilibrating closed intermediates I1,E and I1,L, the rate- determining transition state (I1,L-I2), and the initial (I2) and stable (RPO) open complexes are calculated relative to promoter DNA (P) for [R] = 30 nM from experimentally-determined values of K1, k2, k-2 and kd for FL λPR [24,60] and UT-47 λPR [75] at 37 °C (see text for details). Free energies of FL and UT-47 λPR are set at the same value. For purposes of illustration, for both variants, we estimate that kopen = 1 s−1 and that (I1,L-I2) decomposition frequencies are 103 s−1 in each direction, and assume that k-2 for UT-47 λPR is the same as that determined for FL λPR [24].
Biomolecules 05 01035 g005
At 37 °C, interpretation of k2 = 0.02 s−1 for UT-47 λPR [75] in terms of Mechanism 2 with kopen = 1 s−1 indicates that K1,L ~ 0.02, indicating that only 2% of the population of closed complexes are I1,L and 98% are I1,E, very different from the 66% I1,L, 34% I1,E distribution for FL λPR. From K1 = 2.6 × 10⁷ M−1 [75] and this interpretation of k2, K1,E = K1/1.02 = 2.5 × 10⁷ M−1, 13-fold larger than that calculated for FL λPR. The free energy vs progress diagram for the steps of open complex formation with UT-47 λPR is given in Figure 5B, which is also drawn to scale for an excess RNAP concentration of 30 nM, corresponding to K1,E[R] = 0.76 and a much higher occupancy of I1,E, relative to both free promoter DNA and I1,L, than for FL λPR. As in Figure 5A, the barrier height for the rate determining opening step (rate constant kopen = 1 s−1) is set for a transition state decomposition frequency of 103 s−1 in each direction.
For UT-47, formation of I1,L, required for the subsequent opening step, is greatly disfavored by upstream truncation of the promoter DNA, resulting in a much reduced isomerization rate even though the intrinsic opening rate kopen is left unchanged. The very significant increases in K1 (and K1,E in Figure 5B) for UT-47 relative to FL λPR are difficult to explain, since they indicate that the far-upstream DNA actually destabilizes early closed intermediates like I1,E. Presumably only the αCTD are capable of extending sufficiently to interact with far upstream DNA in I1,E, but if such interactions are unfavorable it is unclear why they would occur. Published kinetic data for the effect of deleting σ1.1 on the kinetics of open complex formation show similar effects to those of upstream truncation: the isomerization rate constant is dramatically reduced while the closed complex binding constant increases [47]. In this case, deletion of 1.1 may reduce both K1,L and kopen, while increasing K1,E.

5.3. Kinetics and Mechanism of Open Complex Dissociation

Dissociation of the stable open complex RPO to free promoter DNA upon addition of a competitor (to make dissociation irreversible) exhibits first order, single-exponential kinetics with rate constant kd (Figure 4). For the two promoters investigated, λPR [65,66] and lacUV5 [61], both of which form long-lived RPO complexes at 37 °C, kd decreases strongly with increasing temperature. This negative activation energy of dissociation indicates that one or more intermediates are kinetically significant in dissociation, and (together with the single-exponential kinetics) indicates these intermediates are in rapid equilibrium with RPO on the time scale of the rate-determining step in dissociation. These intermediates occur after the “bottleneck” step in the forward direction and do not contribute to the rate of RPO formation. How many intermediates are there, and are they open or closed? A combination of kinetic and fast permanganate footprinting studies reveal that at least two such intermediates are kinetically significant at λPR (designated I2 and I3 in Figure 3 and Figure 4); these are open complexes with the bubble extending from −11 to +2 (like RPO) which are much less stable than RPO [23,24]. DNA closing occurs in the conversion of I2 to I1,L [23]; this step is rate-determining in dissociation [24], as indicated in Figure 5. Though the barrier for conversion of RPO to I2 is much larger than that for conversion of I2 to I1, the rate constant k-3 for conversion of RPO to I2 does not determine the rate of dissociation because this step is rapidly reversible on the time scale of conversion of I2 to I1. Hence, the equilibrium constant K3 for conversion of RPO to I2 and not the rate constant k-3 appears in the equation for kd in Figure 4.
Even though more than one open intermediate is involved in dissociation of RPO at λPR, kinetic data are well described by Mechanism 3, involving one intermediate open complex (I2):
1 K 3   k -2 R P O I 2 R + P
The observation of single exponential dissociation kinetics means that I2 and any other intermediates like I3 rapidly equilibrate with RPO on the time scale of conversion of I2 to closed complexes [139]. In other words, in dissociation of RPO without a high salt upshift (see below), any I2 formed usually reverts to RPO but occasionally undergoes the rate-determining DNA closing step to form I1,L, which rapidly dissociates.
Analysis of Mechanism 3 relates the observed rate constant kd for RPO dissociation to the DNA closing rate constant k-2:
kd = fI2k-2
where fI2 is the fraction of open complexes that are I2:
f I2 = 1 1 + K 3     =   [I 2 ] [ I 2 ]  + [RP O
To date the intermediate open complex I3 at λPR has been treated as part of the RPO population, as shown in Figure 4, because neither the equilibrium constant nor rate constants for forming I3 from RPO have been determined [24]. Hence, the equilibrium constant K3 in Equation (9) is a composite of those for the conversions of I2 to I3 and I3 to RPO.

5.4. Determining the DNA Closing Rate Constant (k-2) and the Stabilization (K3) of the Initial Open Complex

Fast salt-upshift dissociation experiments provide a valuable method of determining the DNA closing rate constant k-2 [24]. For λPR (and presumably other promoters with long-lived open complexes), the stabilization equilibrium constant K3 decreases strongly with increasing salt or urea concentration, so a fast salt or urea upshift rapidly converts the initial population of RPO to I2 [24]. Because the DNA closing step is found to be independent of salt concentration, a transient burst of I2 is obtained, suitable for determining the DNA closing rate constant k-2 [24] and for fast DNA footprinting of I2 [23]. Moreover, once determined at high salt concentration, k-2 is used at lower salt concentrations to dissect kd and determine K3 from Equation (9). For λPR at 37 °C, RPO lifetime (1/kd) is approximately 11 hours, while that of I2 (1/k-2) is about 1 second. Therefore, K3 is about 105, and RPO is approximately 105 fold more stable than I2.
The strong dependences of K3 on urea and KCl concentration [18,24] and the effect on K3 of deleting the β' jaw or the downstream duplex [134] indicate that a major part of this stabilization involves assembly of the jaw and other DMEs on the downstream duplex, schematically illustrated in Figure 3. Movements of the downstream (discriminator) region of the nontemplate strand [23] and of RNAP elements in the cleft in concert with tightening of interactions in the cleft are also implicated in stabilization of the initial open complex.

5.5. Fundamental Similarities of the RNAP-Promoter Mechanism to a Mechanism of Enzyme Catalysis; Implications for Regulation of Open Complex Formation and Lifetime

Mechanism 1 is of course formally the same as the minimal two-step mechanism of enzyme catalysis. The hyperbolic dependence of kobs on [RNAP] in Equation (1) is completely analogous to the hyperbolic dependence of the initial velocity of the enzyme catalyzed reaction on substrate concentration for noncooperative enzymes; K1 and k2 are the counterparts of 1/KM and kcat in enzyme kinetic analysis. Another fundamental analogy, at least for λPR, is that the DNA opening-closing step in mid-mechanism is rate-determining in both directions of the mechanism, just as the central catalytic steps are typically rate determining for both directions of an enzyme catalyzed reaction.
Regulation of the kinetics of enzyme catalyzed reactions by ligands or cooperativity of multi-subunit enzymes is primarily at the level of the initial reversible steps of substrate binding and conformational change that precede the central catalytic step, while the catalytic step itself is typically not regulated. Is this also true of the kinetics of open complex formation and the lifetime of the stable open complex? Both the initial binding step and the conformational changes in the I1 ensemble that prepare the DNA to be opened are highly regulated; equilibrium constants for these steps are strong functions of promoter sequence and length [142] and of concentrations of transcription factors, ligands, solutes and salts [24,60,63,64,65,66]. Likewise, the steps converting the initial open complex I2 to the stable open complex (RPo at λPR) are strong functions of promoter sequence and solute and salt concentrations, and are, thus, also likely targets of regulation.
On the other hand, evidence to date indicates that while the DNA opening and closing rates are strongly temperature dependent (especially DNA opening), these analogs of the catalytic step are relatively insensitive to solution variables. For example, closing rate constants k-2 are moderately temperature dependent [24] but only weakly dependent on promoter sequence, and are similar for WT and deletion variant RNAP lacking σ1.1 and/or DME regions. Isomerization rate constant k2 for λPR, thought to be a close approximation to kopen (see above), is strongly temperature dependent [60] but is independent of urea concentration and is only weakly salt concentration dependent [24,60,63,64]. We therefore propose that the central DNA opening-closing step is relatively universal and unregulated for Eσ70 promoters, and always involves interconverting the most advanced closed complex and the initial open complex. Sophisticated networks of interactions and conformational changes, directed by promoter sequence elements, determine the equilibrium constants of the steps that bracket the central DNA opening-closing and thereby regulate the rate of open complex formation and open complex lifetime.

6. Conclusions

In this review, we summarize evidence for the series of large conformational changes, set in motion by binding of bacterial RNAP to promoter DNA to form the initial closed complex and involving bending and wrapping of upstream DNA, which allow the downstream duplex DNA to be bent into the active site cleft of RNAP to form an advanced closed complex. Studies of full-length and upstream truncated promoters indicate that formation of this advanced closed complex is necessary for the subsequent bottleneck step in which the transcription bubble is opened using binding free energy, placing the template strand in the RNAP active site and forming an initial open complex. We also review the evidence that, at some but not all promoters, the initial open complex is stabilized and its lifetime greatly increased by a network of interactions involving the discriminator region of the nontemplate strand and mobile in-cleft and downstream elements of RNAP.
We review the strong formal parallels between the kinetics and mechanism of RNAP-promoter open complex formation and stabilization and the kinetics and mechanism of enzyme catalysis. Both mechanisms divide into three classes of steps with the central bottleneck step (catalysis, DNA opening; the focus of the mechanism) bracketed by reversible binding and conformational steps. In enzyme catalysis, reversible substrate binding and conformational steps are the focus of regulation by inhibitors, activators, and cooperative enzymes, while the central catalytic step is relatively unregulated. Evidence indicates that a similar, previously-unrecognized principle apply to regulation of transcription initiation. Most regulation of the rate of open complex formation occurs in the rapidly-reversible binding and closed-complex conformational steps that precede the central DNA opening step. Likewise, most regulation of open complex lifetime is in the steps that stabilize the initial open complex. The intrinsic DNA opening-closing step, the analog of the catalytic step, appears relatively universal and unregulated, with rates in both directions of approximately 1 s−1 at 37 °C.

Acknowledgments

We thank Rick Gourse, Wilma Ross and members of their laboratory for discussions of the mechanism of initiation and its regulation at the rrnB P1 promoter, and Bob Landick and his laboratory for discussions of RNAP structure and function throughout the transcription cycle. Support for the research from the authors’ laboratories reviewed here was provided by NIH GM103061 and GM067153.

Author Contributions

Emily F. Ruff and Irina Artsimovitch contributed text and made figures. M. Thomas Record, Jr. contributed text. All authors made equal contributions to the preparation of this review.

Conflicts of Interest

The authors declare no conflict of interest.

References

  1. Decker, K.B.; Hinton, D.M. Transcription regulation at the core: Similarities among bacterial, archaeal, and eukaryotic RNA polymerases. Annu. Rev. Microbiol. 2013, 67, 113–139. [Google Scholar] [CrossRef] [PubMed]
  2. Ebright, R.H. RNA polymerase: Structural similarities between bacterial RNA polymerase and eukaryotic RNA polymerase II. J. Mol. Biol. 2000, 304, 687–698. [Google Scholar] [CrossRef] [PubMed]
  3. Saecker, R.M.; Record, M.T., Jr.; Dehaseth, P.L. Mechanism of bacterial transcription initiation: RNA polymerase—Promoter binding, isomerization to initiation-competent open complexes, and initiation of RNA synthesis. J. Mol. Biol. 2011, 412, 754–771. [Google Scholar] [CrossRef] [PubMed]
  4. Dorman, C.J. Co-operative roles for DNA supercoiling and nucleoid-associated proteins in the regulation of bacterial transcription. Biochem. Soc. Trans. 2013, 41, 542–547. [Google Scholar] [CrossRef] [PubMed]
  5. Feklistov, A.; Sharon, B.D.; Darst, S.A.; Gross, C.A. Bacterial sigma factors: A historical, structural, and genomic perspective. Annu. Rev. Microbiol. 2014, 68, 357–376. [Google Scholar] [CrossRef] [PubMed]
  6. Haugen, S.P.; Ross, W.; Gourse, R.L. Advances in bacterial promoter recognition and its control by factors that do not bind DNA. Nat. Rev. Microbiol. 2008, 6, 507–519. [Google Scholar] [CrossRef] [PubMed]
  7. Lee, D.J.; Minchin, S.D.; Busby, S.J. Activating transcription in bacteria. Annu. Rev. Microbiol. 2012, 66, 125–152. [Google Scholar] [CrossRef] [PubMed]
  8. Bae, B.; Davis, E.; Brown, D.; Campbell, E.A.; Wigneshweraraj, S.; Darst, S.A. Phage T7 Gp2 inhibition of Escherichia coli RNA polymerase involves misappropriation of σ70 domain 1.1. Proc. Natl. Acad. Sci. USA 2013, 110, 19772–19777. [Google Scholar] [CrossRef] [PubMed]
  9. Basu, R.S.; Warner, B.A.; Molodtsov, V.; Pupov, D.; Esyunina, D.; Fernandez-Tornero, C.; Kulbachinskiy, A.; Murakami, K.S. Structural basis of transcription initiation by bacterial RNA polymerase holoenzyme. J. Biol. Chem. 2014, 289, 24549–24559. [Google Scholar] [CrossRef] [PubMed]
  10. Feklistov, A.; Darst, S.A. Structural basis for promoter-10 element recognition by the bacterial RNA polymerase sigma subunit. Cell 2011, 147, 1257–1269. [Google Scholar] [CrossRef] [PubMed]
  11. Lawson, C.L.; Swigon, D.; Murakami, K.S.; Darst, S.A.; Berman, H.M.; Ebright, R.H. Catabolite activator protein: DNA binding and transcription activation. Curr. Opin. Struct. Biol. 2004, 14, 10–20. [Google Scholar] [CrossRef] [PubMed]
  12. Murakami, K.S. X-ray crystal structure of Escherichia coli RNA polymerase σ70 holoenzyme. J. Biol. Chem. 2013, 288, 9126–9134. [Google Scholar] [CrossRef] [PubMed]
  13. Murakami, K.S.; Masuda, S.; Campbell, E.A.; Muzzin, O.; Darst, S.A. Structural basis of transcription initiation: An RNA polymerase holoenzyme-DNA complex. Science 2002, 296, 1285–1290. [Google Scholar] [CrossRef] [PubMed]
  14. Murakami, K.S.; Masuda, S.; Darst, S.A. Structural basis of transcription initiation: RNA polymerase holoenzyme at 4 Å resolution. Science 2002, 296, 1280–1284. [Google Scholar] [CrossRef] [PubMed]
  15. Murakami, K.S.; Masuda, S.; Darst, S.A. Crystallographic analysis of Thermus aquaticus RNA polymerase holoenzyme and a holoenzyme/promoter DNA complex. Methods Enzymol. 2003, 370, 42–53. [Google Scholar] [PubMed]
  16. Vassylyev, D.G.; Sekine, S.; Laptenko, O.; Lee, J.; Vassylyeva, M.N.; Borukhov, S.; Yokoyama, S. Crystal structure of a bacterial RNA polymerase holoenzyme at 2.6 Å resolution. Nature 2002, 417, 712–719. [Google Scholar] [CrossRef] [PubMed]
  17. Zhang, Y.; Feng, Y.; Chatterjee, S.; Tuske, S.; Ho, M.X.; Arnold, E.; Ebright, R.H. Structural basis of transcription initiation. Science 2012, 338, 1076–1080. [Google Scholar] [CrossRef] [PubMed]
  18. Ruff, E.F.; Drennan, A.; Capp, M.W.; Poulos, M.A.; Artsimovitch, I.; Record, M.T., Jr. Escherichia coli RNA polymerase determinants of open complex lifetime and structure. J. Mol. Biol. In press. 2015. [Google Scholar]
  19. Rutherford, S.T. Insights into the Mechanism of DksA Action at Ribosomal RNA Promoters in Escherichia coli; University of Wisconsin: Madison, WI, USA, 2008. [Google Scholar]
  20. Rammohan, J.; Ruiz Manzano, A.; Garner, A.L.; Stallings, C.L.; Galburt, E.A. CarD stabilizes mycobacterial open complexes via a two-tiered kinetic mechanism. Nucleic Acids Res. 2015, 43, 3272–3285. [Google Scholar] [CrossRef] [PubMed]
  21. Friedman, L.J.; Gelles, J. Mechanism of transcription initiation at an activator-dependent promoter defined by single-molecule observation. Cell 2012, 148, 679–689. [Google Scholar] [CrossRef] [PubMed]
  22. Heyduk, E.; Heyduk, T. Next generation sequencing-based parallel analysis of melting kinetics of 4096 variants of a bacterial promoter. Biochemistry 2014, 53, 282–292. [Google Scholar] [CrossRef] [PubMed]
  23. Gries, T.J.; Kontur, W.S.; Capp, M.W.; Saecker, R.M.; Record, M.T., Jr. One-step DNA melting in the RNA polymerase cleft opens the initiation bubble to form an unstable open complex. Proc. Natl. Acad. Sci. USA 2010, 107, 10418–10423. [Google Scholar] [CrossRef] [PubMed]
  24. Kontur, W.S.; Saecker, R.M.; Capp, M.W.; Record, M.T., Jr. Late steps in the formation of E. coli RNA polymerase-λPR promoter open complexes: Characterization of conformational changes by rapid [perturbant] upshift experiments. J. Mol. Biol. 2008, 376, 1034–1047. [Google Scholar] [CrossRef] [PubMed]
  25. Rogozina, A.; Zaychikov, E.; Buckle, M.; Heumann, H.; Sclavi, B. DNA melting by RNA polymerase at the T7A1 promoter precedes the rate-limiting step at 37 degrees C and results in the accumulation of an off-pathway intermediate. Nucleic Acids Res. 2009, 37, 5390–5404. [Google Scholar] [CrossRef] [PubMed]
  26. Sclavi, B.; Zaychikov, E.; Rogozina, A.; Walther, F.; Buckle, M.; Heumann, H. Real-time characterization of intermediates in the pathway to open complex formation by Escherichia coli RNA polymerase at the T7A1 promoter. Proc. Natl. Acad. Sci. USA 2005, 102, 4706–4711. [Google Scholar] [CrossRef] [PubMed]
  27. Davis, C.A.; Bingman, C.A.; Landick, R.; Record, M.T., Jr.; Saecker, R.M. Real-time footprinting of DNA in the first kinetically significant intermediate in open complex formation by Escherichia coli RNA polymerase. Proc. Natl. Acad. Sci. USA 2007, 104, 7833–7838. [Google Scholar] [CrossRef] [PubMed]
  28. Ko, J.; Heyduk, T. Kinetics of promoter escape by bacterial RNA polymerase: Effects of promoter contacts and transcription bubble collapse. Biochem. J. 2014, 463, 135–144. [Google Scholar] [CrossRef] [PubMed]
  29. Mekler, V.; Minakhin, L.; Borukhov, S.; Mustaev, A.; Severinov, K. Coupling of downstream RNA polymerase-promoter interactions with formation of catalytically competent transcription initiation complex. J. Mol. Biol. 2014, 426, 3973–3984. [Google Scholar] [CrossRef] [PubMed]
  30. Mekler, V.; Minakhin, L.; Severinov, K. A critical role of downstream RNA polymerase-promoter interactions in the formation of initiation complex. J. Biol. Chem. 2011, 286, 22600–22608. [Google Scholar] [CrossRef] [PubMed]
  31. Mekler, V.; Pavlova, O.; Severinov, K. Interaction of Escherichia coli RNA polymerase σ70 subunit with promoter elements in the context of free σ70, RNA polymerase holoenzyme, and the β'-σ70 complex. J. Biol. Chem. 2011, 286, 270–279. [Google Scholar] [CrossRef] [PubMed]
  32. Revyakin, A.; Ebright, R.H.; Strick, T.R. Promoter unwinding and promoter clearance by RNA polymerase: Detection by single-molecule DNA nanomanipulation. Proc. Natl. Acad. Sci. USA 2004, 101, 4776–4780. [Google Scholar] [CrossRef] [PubMed]
  33. Revyakin, A.; Liu, C.; Ebright, R.H.; Strick, T.R. Abortive initiation and productive initiation by RNA polymerase involve DNA scrunching. Science 2006, 314, 1139–1143. [Google Scholar] [CrossRef] [PubMed]
  34. Robb, N.C.; Cordes, T.; Hwang, L.C.; Gryte, K.; Duchi, D.; Craggs, T.D.; Santoso, Y.; Weiss, S.; Ebright, R.H.; Kapanidis, A.N. The transcription bubble of the RNA polymerase-promoter open complex exhibits conformational heterogeneity and millisecond-scale dynamics: Implications for transcription start-site selection. J. Mol. Biol. 2013, 425, 875–885. [Google Scholar] [CrossRef] [PubMed]
  35. Schroeder, L.A.; Gries, T.J.; Saecker, R.M.; Record, M.T., Jr.; Harris, M.E.; DeHaseth, P.L. Evidence for a tyrosine-adenine stacking interaction and for a short-lived open intermediate subsequent to initial binding of Escherichia coli RNA polymerase to promoter DNA. J. Mol. Biol. 2009, 385, 339–349. [Google Scholar] [CrossRef] [PubMed]
  36. Burgess, R.R. Separation and characterization of the subunits of ribonucleic acid polymerase. J. Biol. Chem. 1969, 244, 6168–6176. [Google Scholar] [PubMed]
  37. Murakami, K.S.; Darst, S.A. Bacterial RNA polymerases: The wholo story. Curr. Opin. Struct. Biol. 2003, 13, 31–39. [Google Scholar] [CrossRef] [PubMed]
  38. Zhang, G.; Campbell, E.A.; Minakhin, L.; Richter, C.; Severinov, K.; Darst, S.A. Crystal structure of Thermus aquaticus core RNA polymerase at 3.3 Å resolution. Cell 1999, 98, 811–824. [Google Scholar] [CrossRef] [PubMed]
  39. Cramer, P.; Bushnell, D.A.; Kornberg, R.D. Structural basis of transcription: RNA polymerase II at 2.8 angstrom resolution. Science 2001, 292, 1863–1876. [Google Scholar] [CrossRef] [PubMed]
  40. Gnatt, A.L.; Cramer, P.; Fu, J.; Bushnell, D.A.; Kornberg, R.D. Structural basis of transcription: An RNA polymerase II elongation complex at 3.3 Å resolution. Science 2001, 292, 1876–1882. [Google Scholar] [CrossRef] [PubMed]
  41. Lane, W.J.; Darst, S.A. Molecular evolution of multisubunit RNA polymerases: Sequence analysis. J. Mol. Biol. 2010, 395, 671–685. [Google Scholar] [CrossRef] [PubMed]
  42. Gruber, T.M.; Gross, C.A. Multiple sigma subunits and the partitioning of bacterial transcription space. Annu. Rev. Microbiol. 2003, 57, 441–466. [Google Scholar] [CrossRef] [PubMed]
  43. Campbell, E.A.; Muzzin, O.; Chlenov, M.; Sun, J.L.; Olson, C.A.; Weinman, O.; Trester-Zedlitz, M.L.; Darst, S.A. Structure of the bacterial RNA polymerase promoter specificity sigma subunit. Mol. Cell 2002, 9, 527–539. [Google Scholar] [CrossRef] [PubMed]
  44. Keilty, S.; Rosenberg, M. Constitutive function of a positively regulated promoter reveals new sequences essential for activity. J. Biol. Chem. 1987, 262, 6389–6395. [Google Scholar] [PubMed]
  45. Schwartz, E.C.; Shekhtman, A.; Dutta, K.; Pratt, M.R.; Cowburn, D.; Darst, S.; Muir, T.W. A full-length group 1 bacterial sigma factor adopts a compact structure incompatible with DNA binding. Chem. Biol. 2008, 15, 1091–1103. [Google Scholar] [CrossRef] [PubMed]
  46. Dombroski, A.J.; Walter, W.A.; Gross, C.A. Amino-terminal amino acids modulate sigma-factor DNA-binding activity. Genes Dev. 1993, 7, 2446–2455. [Google Scholar] [CrossRef] [PubMed]
  47. Wilson, C.; Dombroski, A.J. Region 1 of σ70 is required for efficient isomerization and initiation of transcription by Escherichia coli RNA polymerase. J. Mol. Biol. 1997, 267, 60–74. [Google Scholar] [CrossRef] [PubMed]
  48. Darst, S.A. Bacterial RNA polymerase. Curr. Opin. Struct. Biol. 2001, 11, 155–162. [Google Scholar] [CrossRef] [PubMed]
  49. Chakraborty, A.; Wang, D.; Ebright, Y.W.; Korlann, Y.; Kortkhonjia, E.; Kim, T.; Chowdhury, S.; Wigneshweraraj, S.; Irschik, H.; Jansen, R.; et al. Opening and closing of the bacterial RNA polymerase clamp. Science 2012, 337, 591–595. [Google Scholar] [CrossRef] [PubMed]
  50. Weixlbaumer, A.; Leon, K.; Landick, R.; Darst, S.A. Structural basis of transcriptional pausing in bacteria. Cell 2013, 152, 431–441. [Google Scholar] [CrossRef] [PubMed]
  51. Tagami, S.; Sekine, S.; Kumarevel, T.; Hino, N.; Murayama, Y.; Kamegamori, S.; Yamamoto, M.; Sakamoto, K.; Yokoyama, S. Crystal structure of bacterial RNA polymerase bound with a transcription inhibitor protein. Nature 2010, 468, 978–982. [Google Scholar] [CrossRef] [PubMed]
  52. Ross, W.; Vrentas, C.E.; Sanchez-Vazquez, P.; Gaal, T.; Gourse, R.L. The magic spot: A ppGpp binding site on E. coli RNA polymerase responsible for regulation of transcription initiation. Mol. Cell 2013, 50, 420–429. [Google Scholar] [CrossRef] [PubMed]
  53. Zuo, Y.; Wang, Y.; Steitz, T.A. The mechanism of E. coli RNA polymerase regulation by ppGpp is suggested by the structure of their complex. Mol. Cell 2013, 50, 430–436. [Google Scholar] [CrossRef] [PubMed]
  54. Belogurov, G.A.; Vassylyeva, M.N.; Sevostyanova, A.; Appleman, J.R.; Xiang, A.X.; Lira, R.; Webber, S.E.; Klyuyev, S.; Nudler, E.; Artsimovitch, I.; et al. Transcription inactivation through local refolding of the RNA polymerase structure. Nature 2009, 457, 332–335. [Google Scholar] [CrossRef] [PubMed]
  55. Ho, M.X.; Hudson, B.P.; Das, K.; Arnold, E.; Ebright, R.H. Structures of RNA polymerase-antibiotic complexes. Curr. Opin. Struct. Biol. 2009, 19, 715–723. [Google Scholar] [CrossRef] [PubMed]
  56. Tupin, A.; Gualtieri, M.; Leonetti, J.P.; Brodolin, K. The transcription inhibitor lipiarmycin blocks DNA fitting into the RNA polymerase catalytic site. EMBO J. 2010, 29, 2527–2537. [Google Scholar] [CrossRef] [PubMed]
  57. Chen, J.; Darst, S.A.; Thirumalai, D. Promoter melting triggered by bacterial RNA polymerase occurs in three steps. Proc. Natl. Acad. Sci. USA 2010, 107, 12523–12528. [Google Scholar] [CrossRef] [PubMed]
  58. Cowing, D.W.; Mecsas, J.; Record, M.T., Jr.; Gross, C.A. Intermediates in the formation of the open complex by RNA polymerase holoenzyme containing the sigma factor σ32 at the groE promoter. J. Mol. Biol. 1989, 210, 521–530. [Google Scholar] [CrossRef] [PubMed]
  59. Craig, M.L.; Tsodikov, O.V.; McQuade, K.L.; Schlax, P.E., Jr.; Capp, M.W.; Saecker, R.M.; Record, M.T., Jr. DNA footprints of the two kinetically significant intermediates in formation of an RNA polymerase-promoter open complex: Evidence that interactions with start site and downstream DNA induce sequential conformational changes in polymerase and DNA. J. Mol. Biol. 1998, 283, 741–756. [Google Scholar] [CrossRef] [PubMed]
  60. Saecker, R.M.; Tsodikov, O.V.; McQuade, K.L.; Schlax, P.E., Jr.; Capp, M.W.; Record, M.T., Jr. Kinetic studies and structural models of the association of E. coli σ70 RNA polymerase with the λPR promoter: Large scale conformational changes in forming the kinetically significant intermediates. J. Mol. Biol. 2002, 319, 649–671. [Google Scholar] [CrossRef] [PubMed]
  61. McClure, W.R. Mechanism and control of transcription initiation in prokaryotes. Annu. Rev. Biochem. 1985, 54, 171–204. [Google Scholar] [CrossRef] [PubMed]
  62. Record, M.T., Jr.; Reznikoff, W.S.; Craig, M.L.; McQuade, K.L.; Schlax, P.J. Escherichia coli RNA polymerase (Eσ70), promoters, and the kinetics of the steps of transcription initiation. In Escherichia coli and Salmonella Cellular and Molecular Biology; Neidhardt, F.C., Ed.; ASM Press: Washington, DC, USA, 1996; pp. 792–821. [Google Scholar]
  63. Kontur, W.S.; Capp, M.W.; Gries, T.J.; Saecker, R.M.; Record, M.T., Jr. Probing DNA binding, DNA opening, and assembly of a downstream clamp/jaw in Escherichia coli RNA polymerase-λPR promoter complexes using salt and the physiological anion glutamate. Biochemistry 2010, 49, 4361–4373. [Google Scholar] [CrossRef] [PubMed]
  64. Kontur, W.S.; Saecker, R.M.; Davis, C.A.; Capp, M.W.; Record, M.T., Jr. Solute probes of conformational changes in open complex (RPo) formation by Escherichia coli RNA polymerase at the λPR promoter: Evidence for unmasking of the active site in the isomerization step and for large-scale coupled folding in the subsequent conversion to RPo. Biochemistry 2006, 45, 2161–2177. [Google Scholar] [CrossRef] [PubMed]
  65. Roe, J.H.; Burgess, R.R.; Record, M.T., Jr. Kinetics and mechanism of the interaction of Escherichia coli RNA polymerase with the λPR promoter. J. Mol. Biol. 1984, 176, 495–522. [Google Scholar] [CrossRef] [PubMed]
  66. Roe, J.H.; Burgess, R.R.; Record, M.T., Jr. Temperature dependence of the rate constants of the Escherichia coli RNA polymerase-λPR promoter interaction. Assignment of the kinetic steps corresponding to protein conformational change and DNA opening. J. Mol. Biol. 1985, 184, 441–453. [Google Scholar] [CrossRef] [PubMed]
  67. Gilbert, W. Starting and stopping sequences for the RNA polymerase. In RNA Polymerase; Losick, R., Chamberlin, M.J., Eds.; Cold Spring Harbor Laboratory: Cold Spring Harbor, NY, USA, 1976; pp. 193–205. [Google Scholar]
  68. Gourse, R.L.; Ross, W.; Gaal, T. UPs and downs in bacterial transcription initiation: The role of the alpha subunit of RNA polymerase in promoter recognition. Mol. Microbiol. 2000, 37, 687–695. [Google Scholar] [CrossRef] [PubMed]
  69. Ross, W.; Gosink, K.K.; Salomon, J.; Igarashi, K.; Zou, C.; Ishihama, A.; Severinov, K.; Gourse, R.L. A third recognition element in bacterial promoters: DNA binding by the alpha subunit of RNA polymerase. Science 1993, 262, 1407–1413. [Google Scholar] [CrossRef] [PubMed]
  70. Estrem, S.T.; Gaal, T.; Ross, W.; Gourse, R.L. Identification of an UP element consensus sequence for bacterial promoters. Proc. Natl. Acad. Sci. USA 1998, 95, 9761–9766. [Google Scholar] [CrossRef] [PubMed]
  71. Rao, L.; Ross, W.; Appleman, J.A.; Gaal, T.; Leirmo, S.; Schlax, P.J.; Record, M.T., Jr.; Gourse, R.L. Factor independent activation of rrnB P1. An “extended” promoter with an upstream element that dramatically increases promoter strength. J. Mol. Biol. 1994, 235, 1421–1435. [Google Scholar] [CrossRef] [PubMed]
  72. Estrem, S.T.; Ross, W.; Gaal, T.; Chen, Z.W.; Niu, W.; Ebright, R.H.; Gourse, R.L. Bacterial promoter architecture: Subsite structure of UP elements and interactions with the carboxy-terminal domain of the RNA polymerase alpha subunit. Genes Dev. 1999, 13, 2134–2147. [Google Scholar] [CrossRef] [PubMed]
  73. Gaal, T.; Rao, L.; Estrem, S.T.; Yang, J.; Wartell, R.M.; Gourse, R.L. Localization of the intrinsically bent DNA region upstream of the E.coli rrnB P1 promoter. Nucleic Acids Res. 1994, 22, 2344–2350. [Google Scholar] [CrossRef] [PubMed]
  74. Koo, H.S.; Wu, H.M.; Crothers, D.M. DNA bending at adenine · thymine tracts. Nature 1986, 320, 501–506. [Google Scholar] [CrossRef] [PubMed]
  75. Davis, C.A.; Capp, M.W.; Record, M.T., Jr.; Saecker, R.M. The effects of upstream DNA on open complex formation by Escherichia coli RNA polymerase. Proc. Natl. Acad. Sci. USA 2005, 102, 285–290. [Google Scholar] [CrossRef] [PubMed]
  76. Mangiarotti, L.; Cellai, S.; Ross, W.; Bustamante, C.; Rivetti, C. Sequence-dependent upstream DNA-RNA polymerase interactions in the open complex with λPR and λPRM promoters and implications for the mechanism of promoter interference. J. Mol. Biol. 2009, 385, 748–760. [Google Scholar] [CrossRef] [PubMed]
  77. Zuo, Y.; Steitz, T.A. Crystal structures of the E. coli transcription initiation complexes with a complete bubble. Mol. Cell 2015, 58, 534–540. [Google Scholar] [CrossRef] [PubMed]
  78. Ross, W.; Gourse, R.L. Sequence-independent upstream DNA-alphaCTD interactions strongly stimulate Escherichia coli RNA polymerase-lacUV5 promoter association. Proc. Natl. Acad. Sci. USA 2005, 102, 291–296. [Google Scholar] [CrossRef] [PubMed]
  79. Hawley, D.K.; McClure, W.R. Compilation and analysis of Escherichia coli promoter DNA sequences. Nucleic Acids Res. 1983, 11, 2237–2255. [Google Scholar] [CrossRef] [PubMed]
  80. Lisser, S.; Margalit, H. Compilation of E. coli mRNA promoter sequences. Nucleic Acids Res. 1993, 21, 1507–1516. [Google Scholar] [CrossRef] [PubMed]
  81. Ross, W.; Schneider, D.A.; Paul, B.J.; Mertens, A.; Gourse, R.L. An intersubunit contact stimulating transcription initiation by E coli RNA polymerase: Interaction of the alpha C-terminal domain and sigma region 4. Genes Dev. 2003, 17, 1293–1307. [Google Scholar] [CrossRef] [PubMed]
  82. Dove, S.L.; Huang, F.W.; Hochschild, A. Mechanism for a transcriptional activator that works at the isomerization step. Proc. Natl. Acad. Sci. USA 2000, 97, 13215–13220. [Google Scholar] [CrossRef] [PubMed]
  83. Chen, H.; Tang, H.; Ebright, R.H. Functional interaction between RNA polymerase alpha subunit C-terminal domain and σ70 in UP-element- and activator-dependent transcription. Mol. Cell 2003, 11, 1621–1633. [Google Scholar] [CrossRef] [PubMed]
  84. Dove, S.L.; Darst, S.A.; Hochschild, A. Region 4 of sigma as a target for transcription regulation. Mol. Microbiol. 2003, 48, 863–874. [Google Scholar] [CrossRef] [PubMed]
  85. Niu, W.; Kim, Y.; Tau, G.; Heyduk, T.; Ebright, R.H. Transcription activation at class II CAP-dependent promoters: Two interactions between CAP and RNA polymerase. Cell 1996, 87, 1123–1134. [Google Scholar] [CrossRef] [PubMed]
  86. Nickels, B.E.; Roberts, C.W.; Roberts, J.W.; Hochschild, A. RNA-mediated destabilization of the σ70 region 4/β flap interaction facilitates engagement of RNA polymerase by the Q antiterminator. Mol. Cell 2006, 24, 457–468. [Google Scholar] [CrossRef] [PubMed]
  87. Mitchell, J.E.; Zheng, D.; Busby, S.J.; Minchin, S.D. Identification and analysis of ‘extended-10’ promoters in Escherichia coli. Nucleic Acids Res. 2003, 31, 4689–4695. [Google Scholar] [CrossRef] [PubMed]
  88. Shimada, T.; Yamazaki, Y.; Tanaka, K.; Ishihama, A. The whole set of constitutive promoters recognized by RNA polymerase RpoD holoenzyme of Escherichia coli. PLoS ONE 2014, 9, e90447. [Google Scholar] [CrossRef] [PubMed]
  89. Aoyama, T.; Takanami, M.; Ohtsuka, E.; Taniyama, Y.; Marumoto, R.; Sato, H.; Ikehara, M. Essential structure of E. coli promoter: Effect of spacer length between the two consensus sequences on promoter function. Nucleic Acids Res. 1983, 11, 5855–5864. [Google Scholar] [CrossRef] [PubMed]
  90. Mulligan, M.E.; Brosius, J.; McClure, W.R. Characterization in vitro of the effect of spacer length on the activity of Escherichia coli RNA polymerase at the TAC promoter. J. Biol. Chem. 1985, 260, 3529–3538. [Google Scholar] [PubMed]
  91. Stefano, J.E.; Gralla, J.D. Spacer mutations in the lac ps promoter. Proc. Natl. Acad. Sci. USA 1982, 79, 1069–1072. [Google Scholar] [CrossRef] [PubMed]
  92. Hook-Barnard, I.G.; Hinton, D.M. The promoter spacer influences transcription initiation via σ70 region 1.1 of Escherichia coli RNA polymerase. Proc. Natl. Acad. Sci. USA 2009, 106, 737–742. [Google Scholar] [CrossRef] [PubMed]
  93. Yuzenkova, Y.; Tadigotla, V.R.; Severinov, K.; Zenkin, N. A new basal promoter element recognized by RNA polymerase core enzyme. EMBO J. 2011, 30, 3766–3775. [Google Scholar] [CrossRef] [PubMed]
  94. Barne, K.A.; Bown, J.A.; Busby, S.J.; Minchin, S.D. Region 2.5 of the Escherichia coli RNA polymerase σ70 subunit is responsible for the recognition of the ‘extended-10’ motif at promoters. EMBO J. 1997, 16, 4034–4040. [Google Scholar] [CrossRef] [PubMed]
  95. Haugen, S.P.; Berkmen, M.B.; Ross, W.; Gaal, T.; Ward, C.; Gourse, R.L. rRNA promoter regulation by nonoptimal binding of sigma region 1.2: An additional recognition element for RNA polymerase. Cell 2006, 125, 1069–1082. [Google Scholar] [CrossRef] [PubMed]
  96. Guo, Y.; Lew, C.M.; Gralla, J.D. Promoter opening by σ54 and σ70 RNA polymerases: σ factor-directed alterations in the mechanism and tightness of control. Genes Dev. 2000, 14, 2242–2255. [Google Scholar] [CrossRef] [PubMed]
  97. Waldburger, C.; Gardella, T.; Wong, R.; Susskind, M.M. Changes in conserved region 2 of Escherichia coli σ70 affecting promoter recognition. J. Mol. Biol. 1990, 215, 267–276. [Google Scholar] [CrossRef] [PubMed]
  98. Marr, M.T.; Roberts, J.W. Promoter recognition as measured by binding of polymerase to nontemplate strand oligonucleotide. Science 1997, 276, 1258–1260. [Google Scholar] [CrossRef] [PubMed]
  99. Roberts, C.W.; Roberts, J.W. Base-specific recognition of the nontemplate strand of promoter DNA by E. coli RNA polymerase. Cell 1996, 86, 495–501. [Google Scholar] [CrossRef] [PubMed]
  100. Cook, V.M.; Dehaseth, P.L. Strand opening-deficient Escherichia coli RNA polymerase facilitates investigation of closed complexes with promoter DNA: Effects of DNA sequence and temperature. J. Biol. Chem. 2007, 282, 21319–21326. [Google Scholar] [CrossRef] [PubMed]
  101. Shultzaberger, R.K.; Chen, Z.; Lewis, K.A.; Schneider, T.D. Anatomy of Escherichia coli σ70 promoters. Nucleic Acids Res. 2007, 35, 771–788. [Google Scholar] [CrossRef] [PubMed]
  102. Campagne, S.; Marsh, M.E.; Capitani, G.; Vorholt, J.A.; Allain, F.H. Structural basis for –10 promoter element melting by environmentally induced sigma factors. Nat. Struct. Mol. Biol. 2014, 21, 269–276. [Google Scholar] [CrossRef] [PubMed]
  103. Haugen, S.P.; Ross, W.; Manrique, M.; Gourse, R.L. Fine structure of the promoter-sigma region 1.2 interaction. Proc. Natl. Acad. Sci. USA 2008, 105, 3292–3297. [Google Scholar] [CrossRef] [PubMed]
  104. Jeong, W.; Kang, C. Start site selection at lacUV5 promoter affected by the sequence context around the initiation sites. Nucleic Acids Res. 1994, 22, 4667–4672. [Google Scholar] [CrossRef] [PubMed]
  105. Lewis, D.E.; Adhya, S. Axiom of determining transcription start points by RNA polymerase in Escherichia coli. Mol. Microbiol. 2004, 54, 692–701. [Google Scholar] [CrossRef] [PubMed]
  106. Liu, J.; Turnbough, C.L., Jr. Effects of transcriptional start site sequence and position on nucleotide-sensitive selection of alternative start sites at the pyrC promoter in Escherichia coli. J. Bacteriol. 1994, 176, 2938–2945. [Google Scholar] [PubMed]
  107. O’Neill, M.C. Escherichia coli promoters. I. Consensus as it relates to spacing class, specificity, repeat substructure, and three-dimensional organization. J. Biol. Chem. 1989, 264, 5522–5530. [Google Scholar] [PubMed]
  108. Thomason, M.K.; Bischler, T.; Eisenbart, S.K.; Forstner, K.U.; Zhang, A.; Herbig, A.; Nieselt, K.; Sharma, C.M.; Storz, G. Global transcriptional start site mapping using differential RNA sequencing reveals novel antisense RNAs in Escherichia coli. J. Bacteriol. 2015, 197, 18–28. [Google Scholar] [CrossRef] [PubMed]
  109. Feklistov, A.; Barinova, N.; Sevostyanova, A.; Heyduk, E.; Bass, I.; Vvedenskaya, I.; Kuznedelov, K.; Merkiene, E.; Stavrovskaya, E.; Klimasauskas, S.; et al. A basal promoter element recognized by free RNA polymerase sigma subunit determines promoter recognition by RNA polymerase holoenzyme. Mol. Cell 2006, 23, 97–107. [Google Scholar] [CrossRef] [PubMed]
  110. Travers, A.A. Promoter sequence for stringent control of bacterial ribonucleic acid synthesis. J. Bacteriol. 1980, 141, 973–976. [Google Scholar] [PubMed]
  111. Guerin, M.; Leng, M.; Rahmouni, A.R. High resolution mapping of E.coli transcription elongation complex in situ reveals protein interactions with the non-transcribed strand. EMBO J. 1996, 15, 5397–5407. [Google Scholar] [PubMed]
  112. Vvedenskaya, I.O.; Vahedian-Movahed, H.; Bird, J.G.; Knoblauch, J.G.; Goldman, S.R.; Zhang, Y.; Ebright, R.H.; Nickels, B.E. Transcription. Interactions between RNA polymerase and the “core recognition element” counteract pausing. Science 2014, 344, 1285–1289. [Google Scholar] [CrossRef] [PubMed]
  113. Gaal, T.; Bartlett, M.S.; Ross, W.; Turnbough, C.L., Jr.; Gourse, R.L. Transcription regulation by initiating NTP concentration: RRNA synthesis in bacteria. Science 1997, 278, 2092–2097. [Google Scholar] [CrossRef] [PubMed]
  114. Guthold, M.; Zhu, X.; Rivetti, C.; Yang, G.; Thomson, N.H.; Kasas, S.; Hansma, H.G.; Smith, B.; Hansma, P.K.; Bustamante, C. Direct observation of one-dimensional diffusion and transcription by Escherichia coli RNA polymerase. Biophys. J. 1999, 77, 2284–2294. [Google Scholar] [CrossRef] [PubMed]
  115. Harada, Y.; Funatsu, T.; Murakami, K.; Nonoyama, Y.; Ishihama, A.; Yanagida, T. Single-molecule imaging of RNA polymerase-DNA interactions in real time. Biophys. J. 1999, 76, 709–715. [Google Scholar] [CrossRef] [PubMed]
  116. Kabata, H.; Kurosawa, O.; Arai, I.; Washizu, M.; Margarson, S.A.; Glass, R.E.; Shimamoto, N. Visualization of single molecules of RNA polymerase sliding along DNA. Science 1993, 262, 1561–1563. [Google Scholar] [CrossRef] [PubMed]
  117. Ricchetti, M.; Metzger, W.; Heumann, H. One-dimensional diffusion of Escherichia coli DNA-dependent RNA polymerase: A mechanism to facilitate promoter location. Proc. Natl. Acad. Sci. USA 1988, 85, 4610–4614. [Google Scholar] [CrossRef] [PubMed]
  118. Singer, P.; Wu, C.W. Promoter search by Escherichia coli RNA polymerase on a circular DNA template. J. Biol. Chem. 1987, 262, 14178–14189. [Google Scholar] [PubMed]
  119. Friedman, L.J.; Mumm, J.P.; Gelles, J. RNA polymerase approaches its promoter without long-range sliding along DNA. Proc. Natl. Acad. Sci. USA 2013, 110, 9740–9745. [Google Scholar] [CrossRef] [PubMed]
  120. Wang, F.; Redding, S.; Finkelstein, I.J.; Gorman, J.; Reichman, D.R.; Greene, E.C. The promoter-search mechanism of Escherichia coli RNA polymerase is dominated by three-dimensional diffusion. Nat. Struct. Mol. Biol. 2013, 20, 174–181. [Google Scholar] [CrossRef] [PubMed]
  121. Bakshi, S.; Dalrymple, R.M.; Li, W.; Choi, H.; Weisshaar, J.C. Partitioning of RNA polymerase activity in live Escherichia coli from analysis of single-molecule diffusive trajectories. Biophys. J. 2013, 105, 2676–2686. [Google Scholar] [CrossRef] [PubMed]
  122. deHaseth, P.L.; Lohman, T.M.; Burgess, R.R.; Record, M.T., Jr. Nonspecific interactions of Escherichia coli RNA polymerase with native and denatured DNA: Differences in the binding behavior of core and holoenzyme. Biochemistry 1978, 17, 1612–1622. [Google Scholar] [CrossRef] [PubMed]
  123. Hofer, B.; Muller, D.; Koster, H. The pathway of E. coli RNA polymerase-promoter complex formation as visualized by footprinting. Nucleic Acids Res. 1985, 13, 5995–6013. [Google Scholar] [CrossRef] [PubMed]
  124. Kovacic, R.T. The 0 degree C closed complexes between Escherichia coli RNA polymerase and two promoters, T7-A3 and lacUV5. J. Biol. Chem. 1987, 262, 13654–13661. [Google Scholar] [PubMed]
  125. Mecsas, J.; Cowing, D.W.; Gross, C.A. Development of RNA polymerase-promoter contacts during open complex formation. J. Mol. Biol. 1991, 220, 585–597. [Google Scholar] [CrossRef] [PubMed]
  126. Schickor, P.; Metzger, W.; Werel, W.; Lederer, H.; Heumann, H. Topography of intermediates in transcription initiation of E. coli. EMBO J. 1990, 9, 2215–2220. [Google Scholar] [PubMed]
  127. Spassky, A.; Kirkegaard, K.; Buc, H. Changes in the DNA structure of the lac UV5 promoter during formation of an open complex with Escherichia coli RNA polymerase. Biochemistry 1985, 24, 2723–2731. [Google Scholar] [CrossRef] [PubMed]
  128. Ruff, E.F.; Zorn, K.; Capp, M.W.; Artsimovitch, I.; Record, M.T., Jr. Effects of upstream Escherichia coli RNA polymerase-DNA interactions on open complex formation. Unpublished work. 2015. [Google Scholar]
  129. Naryshkin, N.; Revyakin, A.; Kim, Y.; Mekler, V.; Ebright, R.H. Structural organization of the RNA polymerase-promoter open complex. Cell 2000, 101, 601–611. [Google Scholar] [CrossRef] [PubMed]
  130. Bartlett, M.S.; Gaal, T.; Ross, W.; Gourse, R.L. RNA polymerase mutants that destabilize RNA polymerase-promoter complexes alter NTP-sensing by rrn P1 promoters. J. Mol. Biol. 1998, 279, 331–345. [Google Scholar] [CrossRef] [PubMed]
  131. Rutherford, S.T.; Villers, C.L.; Lee, J.H.; Ross, W.; Gourse, R.L. Allosteric control of Escherichia coli rRNA promoter complexes by DksA. Genes Dev. 2009, 23, 236–248. [Google Scholar] [CrossRef] [PubMed]
  132. Li, X.Y.; McClure, W.R. Characterization of the closed complex intermediate formed during transcription initiation by Escherichia coli RNA polymerase. J. Biol. Chem. 1998, 273, 23549–23557. [Google Scholar] [CrossRef] [PubMed]
  133. Browning, D.F.; Busby, S.J. The regulation of bacterial transcription initiation. Nat. Rev. Microbiol. 2004, 2, 57–65. [Google Scholar] [CrossRef] [PubMed]
  134. Drennan, A.C.; Kraemer, M.; Capp, M.; Gries, T.; Ruff, E.; Sheppard, C.; Wigneshweraraj, S.; Artsimovitch, I.; Record, M.T., Jr. Key roles of the downstream mobile jaw of Escherichia coli RNA polymerase in transcription initiation. Biochemistry 2012, 51, 9447–9459. [Google Scholar] [CrossRef] [PubMed]
  135. Mekler, V.; Minakhin, L.; Sheppard, C.; Wigneshweraraj, S.; Severinov, K. Molecular mechanism of transcription inhibition by phage T7 Gp2 protein. J. Mol. Biol. 2011, 413, 1016–1027. [Google Scholar] [CrossRef] [PubMed]
  136. Artsimovitch, I.; Svetlov, V.; Murakami, K.S.; Landick, R. Co-overexpression of Escherichia coli RNA polymerase subunits allows isolation and analysis of mutant enzymes lacking lineage-specific sequence insertions. J. Biol. Chem. 2003, 278, 12344–12355. [Google Scholar] [CrossRef] [PubMed]
  137. Hawley, D.K.; Malan, T.P.; Mulligan, M.E.; McClure, W.R. Intermediates on the pathway to open complex formation. In Promoters: Structure and Function; Praeger: New York, NY, USA, 1982; pp. 54–68. [Google Scholar]
  138. McClure, W.R. Rate-limiting steps in RNA chain initiation. Proc. Natl. Acad. Sci. USA 1980, 77, 5634–5638. [Google Scholar] [CrossRef] [PubMed]
  139. Tsodikov, O.V.; Record, M.T., Jr. General method of analysis of kinetic equations for multistep reversible mechanisms in the single-exponential regime: Application to kinetics of open complex formation between Eσ70 RNA polymerase and λPR promoter DNA. Biophys. J. 1999, 76, 1320–1329. [Google Scholar] [CrossRef] [PubMed]
  140. Drennan, A.C. Key conformational changes of Escherichia coli RNA polymerase and promoter DNA in transcription initiation. Ph.D. Thesis, University of Wisconsin, Madison, WI, USA, 2012. [Google Scholar]
  141. Heitkamp, S.E. Real-Time characterization of transcription initiation intermediates for E. coli RNA polymerase using fast footprinting and equilibrium and stopped-flow fluorescence. Ph.D. Thesis, University of Wisconsin, Madison, WI, USA, 2012. [Google Scholar]
  142. Hook-Barnard, I.G.; Hinton, D.M. Transcription initiation by mix and match elements: Flexibility for polymerase binding to bacterial promoters. Gene Regul. Syst. Biol. 2007, 1, 275–293. [Google Scholar]

