Integrative Analyses of Genes Associated with Subcutaneous Insulin Resistance


1
Department of Medicine, Pooja Hospital, Davangere 577002, Karnataka, India
2
Department of Pharmaceutics, SET`S College of Pharmacy, Dharwad 580002, Karnataka, India
3
Biostatistics and Bioinformatics, Chanabasava Nilaya, Bharthinagar, Dharwad 580001, Karanataka, India
*
Author to whom correspondence should be addressed.
Biomolecules 2019, 9(2), 37; https://doi.org/10.3390/biom9020037
Submission received: 12 December 2018
/
Accepted: 16 January 2019
/
Published: 22 January 2019
(This article belongs to the Special Issue Obesity and Hormones)
Abstract
:Insulin resistance is present in the majority of patients with non-insulin-dependent diabetes mellitus (NIDDM) and obesity. In this study, we aimed to investigate the key genes and potential molecular mechanism in insulin resistance. Expression profiles of the genes were extracted from the Gene Expression Omnibus (GEO) database. Pathway and Gene Ontology (GO) enrichment analyses were conducted at Enrichr. The protein–protein interaction (PPI) network was settled and analyzed using the Search Tool for the Retrieval of Interacting Genes (STRING) database constructed by Cytoscape software. Modules were extracted and identified by the PEWCC1 plugin. The microRNAs (miRNAs) and transcription factors (TFs) which control the expression of differentially expressed genes (DEGs) were analyzed using the NetworkAnalyst algorithm. A database (GSE73108) was downloaded from the GEO databases. Our results identified 873 DEGs (435 up-regulated and 438 down-regulated) genetically associated with insulin resistance. The pathways which were enriched were pathways in complement and coagulation cascades and complement activation for up-regulated DEGs, while biosynthesis of amino acids and the Notch signaling pathway were among the down-regulated DEGs. Showing GO enrichment were cardiac muscle cell–cardiac muscle cell adhesion and microvillus membrane for up-regulated DEGs and negative regulation of osteoblast differentiation and dendrites for down-regulated DEGs. Subsequently, myosin VB (MYO5B), discs, large homolog 2(DLG2), axin 2 (AXIN2), protein tyrosine kinase 7 (PTK7), Notch homolog 1 (NOTCH1), androgen receptor (AR), cyclin D1 (CCND1) and Rho family GTPase 3 (RND3) were diagnosed as the top hub genes in the up- and down-regulated PPI network and modules. In addition, GATA binding protein 6 (GATA6), ectonucleotide pyrophosphatase/phosphodiesterase 5 (ENPP5), cyclin D1 (CCND1) and tubulin, beta 2A (TUBB2A) were diagnosed as the top hub genes in the up- and down-regulated target gene–miRNA network, while tubulin, beta 2A (TUBB2A), olfactomedin-like 1 (OLFML1), prostate adrogen-regulated mucin-like protein 1 (PARM1) and aldehyde dehydrogenase 4 family, member A1 (ALDH4A1)were diagnosed as the top hub genes in the up- and down-regulated target gene–TF network. The current study based on the GEO database provides a novel understanding regarding the mechanism of insulin resistance and may provide novel therapeutic targets.
1. Introduction
Obesity is a major risk factor for non-insulin-dependent diabetes mellitus (NIDDM), which has a prevalence that is positively correlated with body mass index [1]. The NIDDM/Type 2 diabetes is a complicated metabolic disorder which arises from a complex interaction of a vast number of genetic and environmental factors [2]. Insulin resistance is the condition in which the cells of the muscles, fat, and liver do not respond well to insulin and do not easily take up glucose from blood [3]. Obesity, NIDDM, hypertension, atherosclerotic cardiovascular disease, ayslipidemia, and hyperinsulinemia are the most common and severe disorders related to insulin resistance [4]. High plasma free fatty acid concentrations are typically linked with many insulin-resistant states, including obesity and NIDDM [5]. Modified fatty acid metabolism contributes to insulin resistance in patients with non-insulin-dependent diabetes mellitus [6]. High secretion of tumor necrosis factor-alpha (TNF-α) [7], interleukin-6 (IL-6) [8], monocyte chemoattractant protein-1 (MCP-1) [9], and additional products of macrophages [10] by adipose tissue with low sensitivity to insulin has also been detected in obesity.
Accumulating evidence has demonstrated that signaling pathways and genes are associated with insulin resistance [11,12]. High expression of Retinol Binding Protein 4 (RBP4) is responsible for the development of insulin resistance in obesity and NIDDM [13]. Polymorphism in Pacific Crossing 1 (PC-1) strongly linked with insulin resistance [14]. Alteration in Adiponectin receptor 1 (ADIPOR1) and Adiponectin receptor 2 (ADIPOR1) ADIPOR2 is important for development of insulin resistance in NIDDM [15]. Low expression of FOXC2 is identified with insulin resistance [16]. The activation of the peptidase inhibitor 3 (PI3)-kinase- and mitogen activated protein (MAP) -kinase-mediated signaling pathways can cause insulin resistance in muscle [17]. Activation of inhibitor of nuclear factor kappa-B kinase subunit beta (IKK-β) is important for the improvement of insulin resistance in obesity [18]. Improper activation of the tuberous sclerosis complex (TSC)/ Ras homolog enriched in brain (Rheb)/mechanistic target of rapamycin kinase (MTOR) signaling pathway leads to insulin resistance [19]. Stimulation of the JNK pathway has an important role in the advancement of insulin resistance in obesity [20].
However, due to the lack of effective early diagnostic methods and limited therapeutic options for preventing insulin resistance development in obesity and non-insulin-dependent diabetes mellitus, the real outcome for patients with insulin resistance still needs to be improved. Therefore, it is essential to understand the precise molecular mechanisms associated with the development of insulin resistance and thus develop effective early diagnostic and therapeutic strategies.
During the last few decades, microarray technology and bioinformatics analysis have been widely used to screen genetic modifications at the genome level, which has helped us diagnose the differentially expressed genes (DEGs) and functional pathways associated with the development of insulin resistance. In the current study, a messenger RNA (mRNA) microarray dataset (GSE73108) from the gene expression omnibus (GEO) was downloaded and analyzed in order to obtain DEGs between omental adipose tissue with insulin resistance and subcutaneous adipose tissue with insulin resistance. Subsequently, gene ontology (GO), pathway enrichment analysis, protein–protein interaction (PPI) network analysis, module analysis, target gene–miRNA networks and target gene–transcription factors (TF) networks were investigated to help us understand the molecular mechanisms underlying the progression of insulin resistance.
2. Materials and Methods
2.1. Microarray Data
Gene Expression Omnibus (http://www.ncbi.nlm.nih.gov/geo) [21] is a public functional genomics data repository of high-throughput gene expression data, chips, and microarrays. A gene expression dataset (GSE73108) was downloaded from GEO (Illumina HumanHT-12 V4.0 expression bead chip GPL10558 Platform, San Diego, CA, USA); this dataset was submitted by Wentworth et al. [22]. The probes were transformed into the corresponding gene symbol according to the annotation information in the platform. The GSE73108 dataset contained six omental adipose tissue samples with insulin resistance and six subcutaneous adipose tissue samples with insulin resistance.
2.2. Identification of Differentially Expressed Geness
The DEGs between omental adipose tissue samples with insulin resistance and subcutaneous adipose tissue samples with insulin resistance were screened using the limma (linear models for microarray data) package of R software (version 3.5.1) [23]. The Benjamini and Hochberg false discovery rate (FDR) was applied to provide a balance between the discovery of statistically significant genes and the limitations of false positives. An absolute value of log FC (fold change) > 1.24 was the cutoff for up-regulated genes, log FC (fold change) >−0.725 was the cutoff for down-regulated genes, and p < 0.05 was considered statistically significant.
2.3. Pathway Enrichment Analyses of Differentially Expressed Genes
Enrichr (http://amp.pharm.mssm.edu/Enrichr/) [24] is an online biological information database that integrates biological databases (Kyoto Encyclopedia of Genes and Genomes (KEGG) (http://www.genome.jp/kegg/pathway.html) [25], WikiPathways (https://www.wikipathways.org) [26], BioCarta (https://cgap.nci.nih.gov/Pathways/BioCarta_Pathways) [27] HumanCyc (https://humancyc.org/) [28], Panther (http://www.pantherdb.org/pathway/) [29] and NCI-Nature (http://pid.nci.nih.gov/) [30]) and analysis tools and provides a comprehensive set of functional annotation information on genes and proteins for users to extract biological information. These databases are resources for understanding high-level functions and biological systems from large-scale molecular datasets generated by high-throughput experimental technologies [31]. A value of p < 0.05 was considered statistically significant.
2.4. Gene OntologyEnrichment Analyses of Differentially Expressed Genes
In order to investigate the underlying function of DEGs, we employed the Enrichr [24] online tool for gene ontology (GO) (http://www.geneontology.org/) [32] enrichment analysis; it includes biological processes (BPs), cellular components (CCs), and molecular functions (MFs). A value of p < 0.05 was considered statistically significant.
2.5. Construction of a Protein–Protein Interaction Network and Topological Analysis
The Search Tool for the Retrieval of Interacting Genes (STRING) (http://www.string-db.org/) [33] is an online database implementing experimental and predicted PPI information. In this investigation, the STRING database was used to evaluate the PPIs among the proteins encoded by the DEGs with a combined score of >0.4; then, the PPI networks for the up-regulated and down-regulated genes were independently envisioned using Cytoscape software (http://www.cytoscape.org/) [34]. Network topological properties were used to analyze and compare the network. The network topological properties which were analyzed include node degree [35], betweenness centrality [36], stress centrality [37], closeness centrality [38], and cluster coefficient [39].
2.6. Module Analysis
The PEWCC1 is an automated algorithm which can be used as an integrated plugin in Cytoscape and which provides a way to establish highly connected dense modules in a PPI network [40]. The interconnected genes in the modules were diagnosed and selected for further analysis based on the number of genes. We used n > 10 as a parameter for selecting highly interconnected modules.
2.7. Construction of the Target Gene–MicroRNA Network
MicroRNAs control the expression of genes in a disease condition by interacting with their target genes at the post-transcription phase [41]. In the current study, the miRNAs associated with DEGs were searched using the NetworkAnalyst (https://www.networkanalyst.ca/) [42] online tool which integrates microRNA databases such as TarBase (http://diana.imis.athena-innovation.gr/DianaTools/index.php?r=tarbase/index) [43] and miRTarBase (http://mirtarbase.mbc.nctu.edu.tw/php/download.php) [44], and the target gene–miRNA network was visualized using Cytoscape software [34].
2.8. Construction of the Target Gene–Tanscription FactorNetwork
Transcription factors control the expression of genes in a disease condition by interacting with their target genes at the transcription phase [45]. In the current study, the TFs associated with DEGs were searched using the NetworkAnalyst [42] tool which integrates TF database JASPAR (http://jaspar.genereg.net/) [46], and the target gene–TF network was visualized using Cytoscape software [34].
3. Results
3.1. Identification of Differentially Expressed Genes in Insulin Resistance
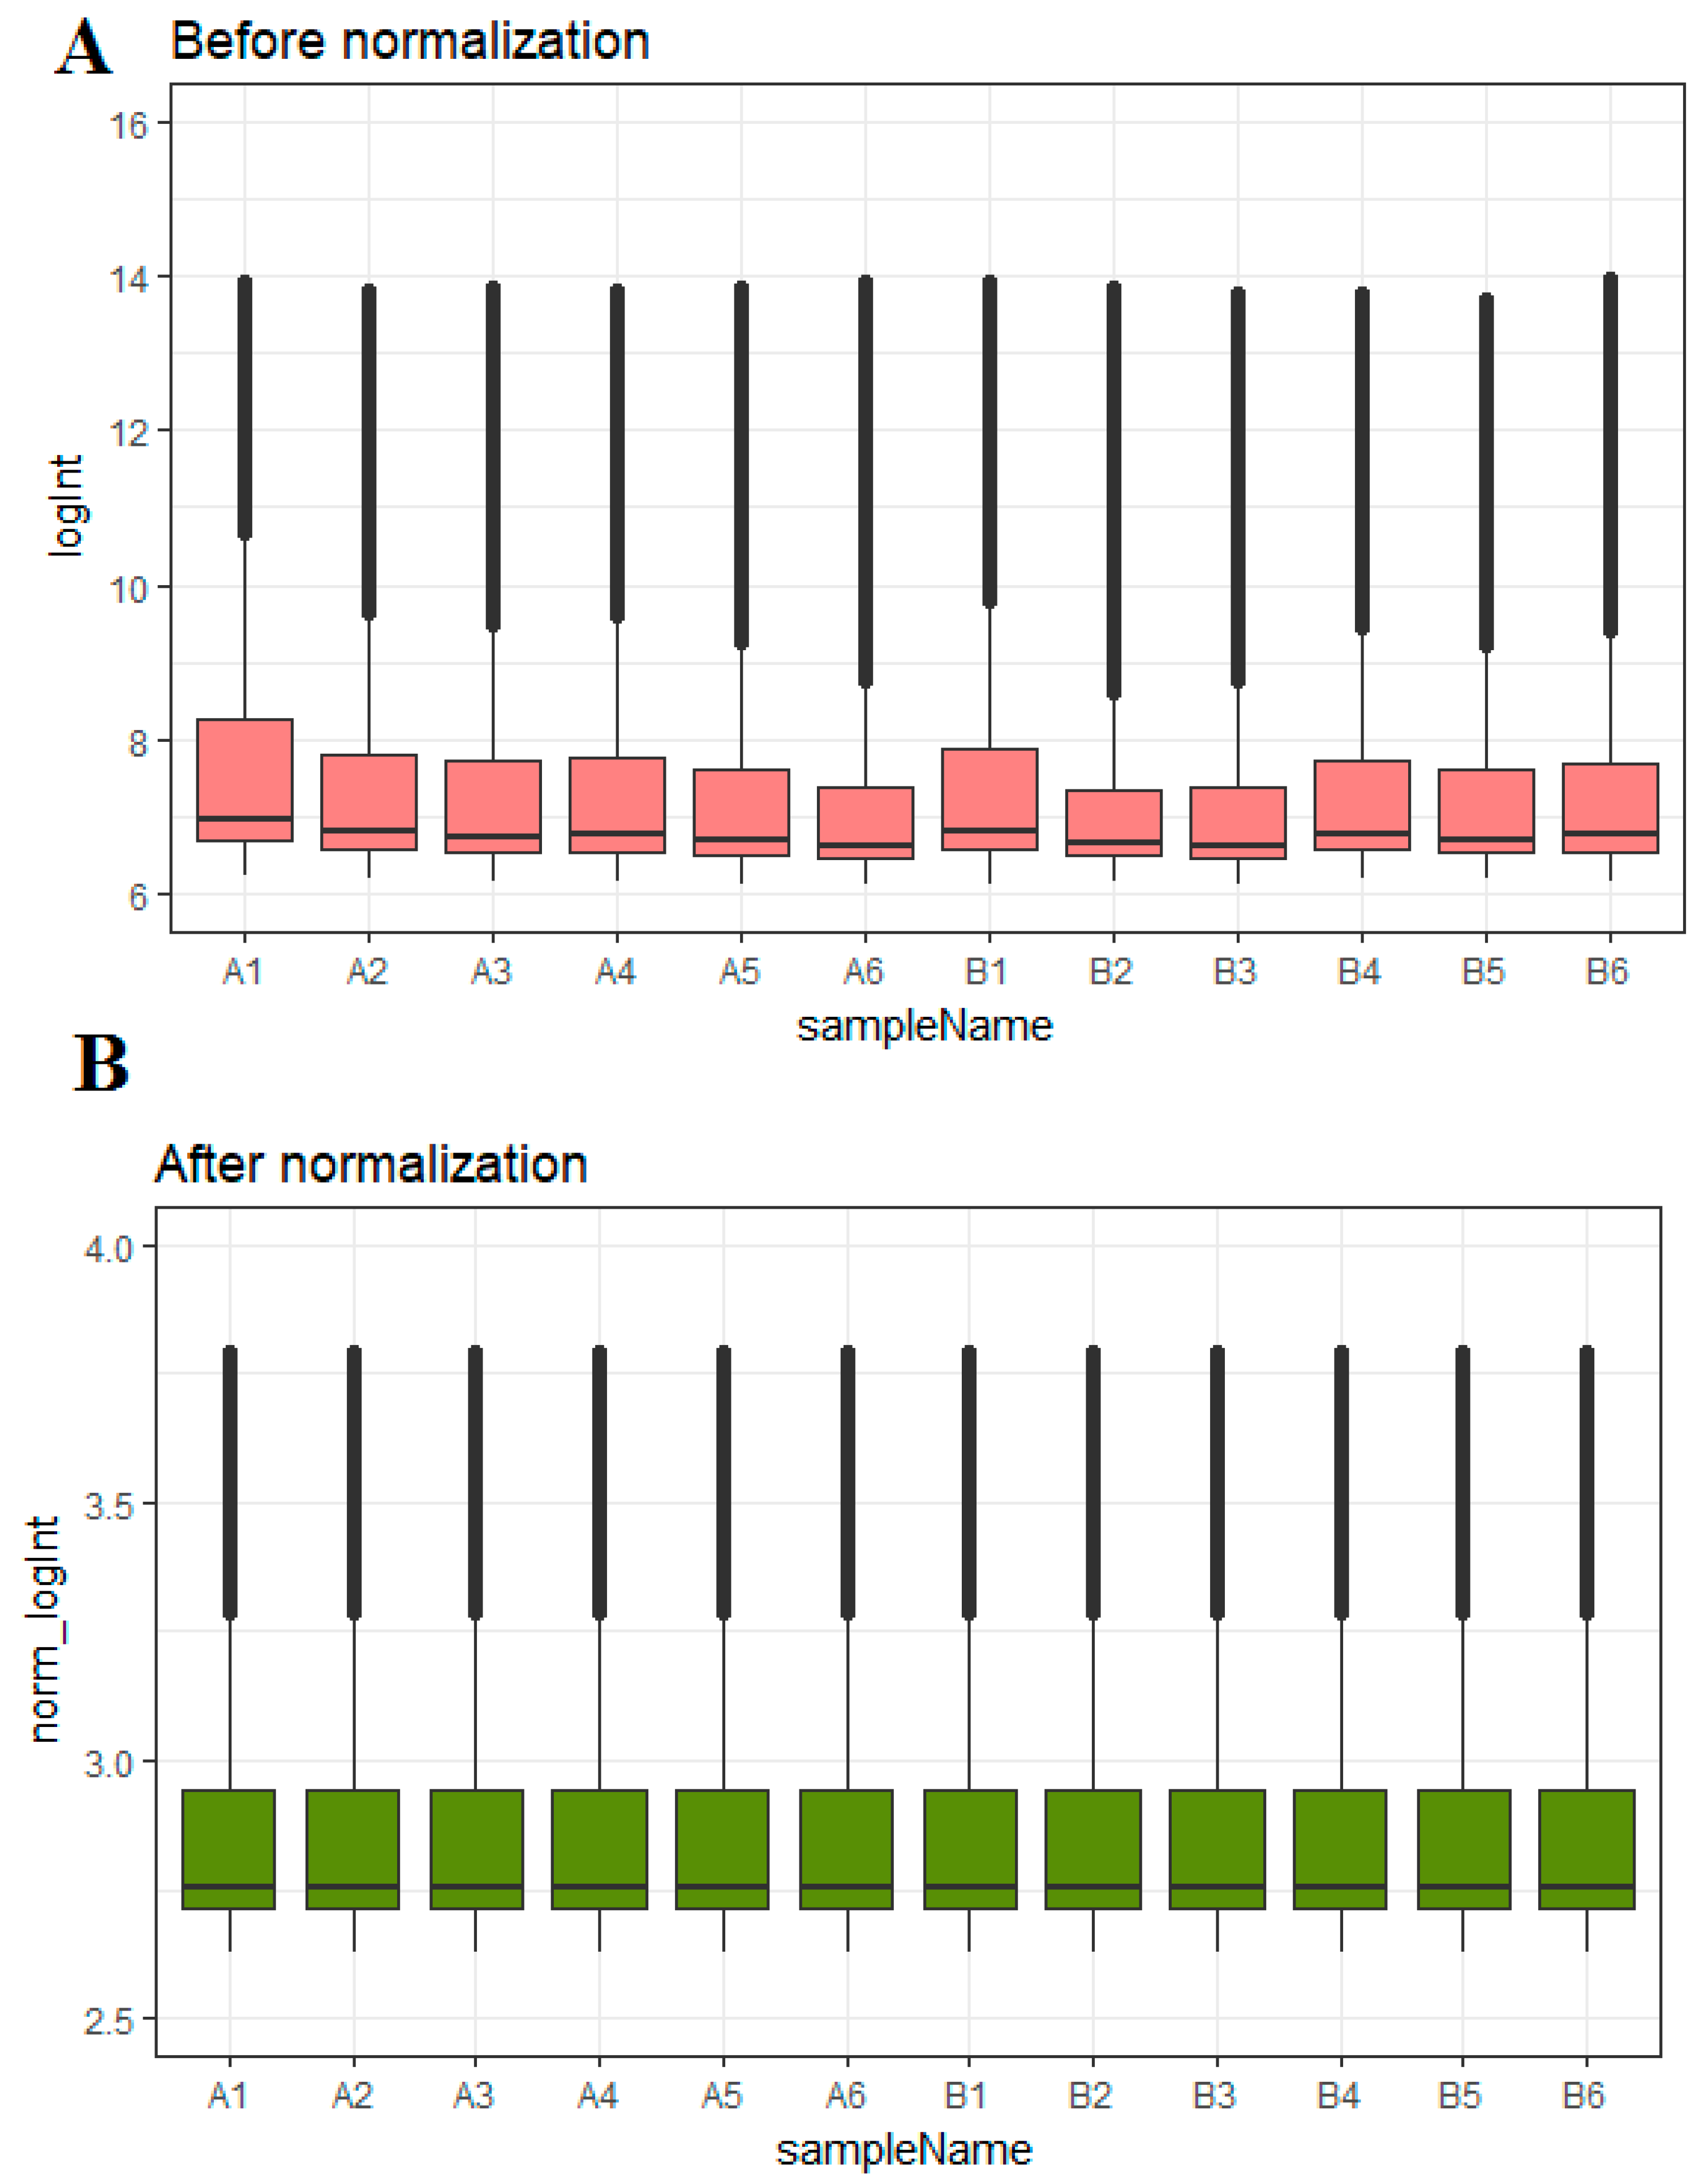
A box plot of the data before and after normalization is shown in Figure 1A,B.
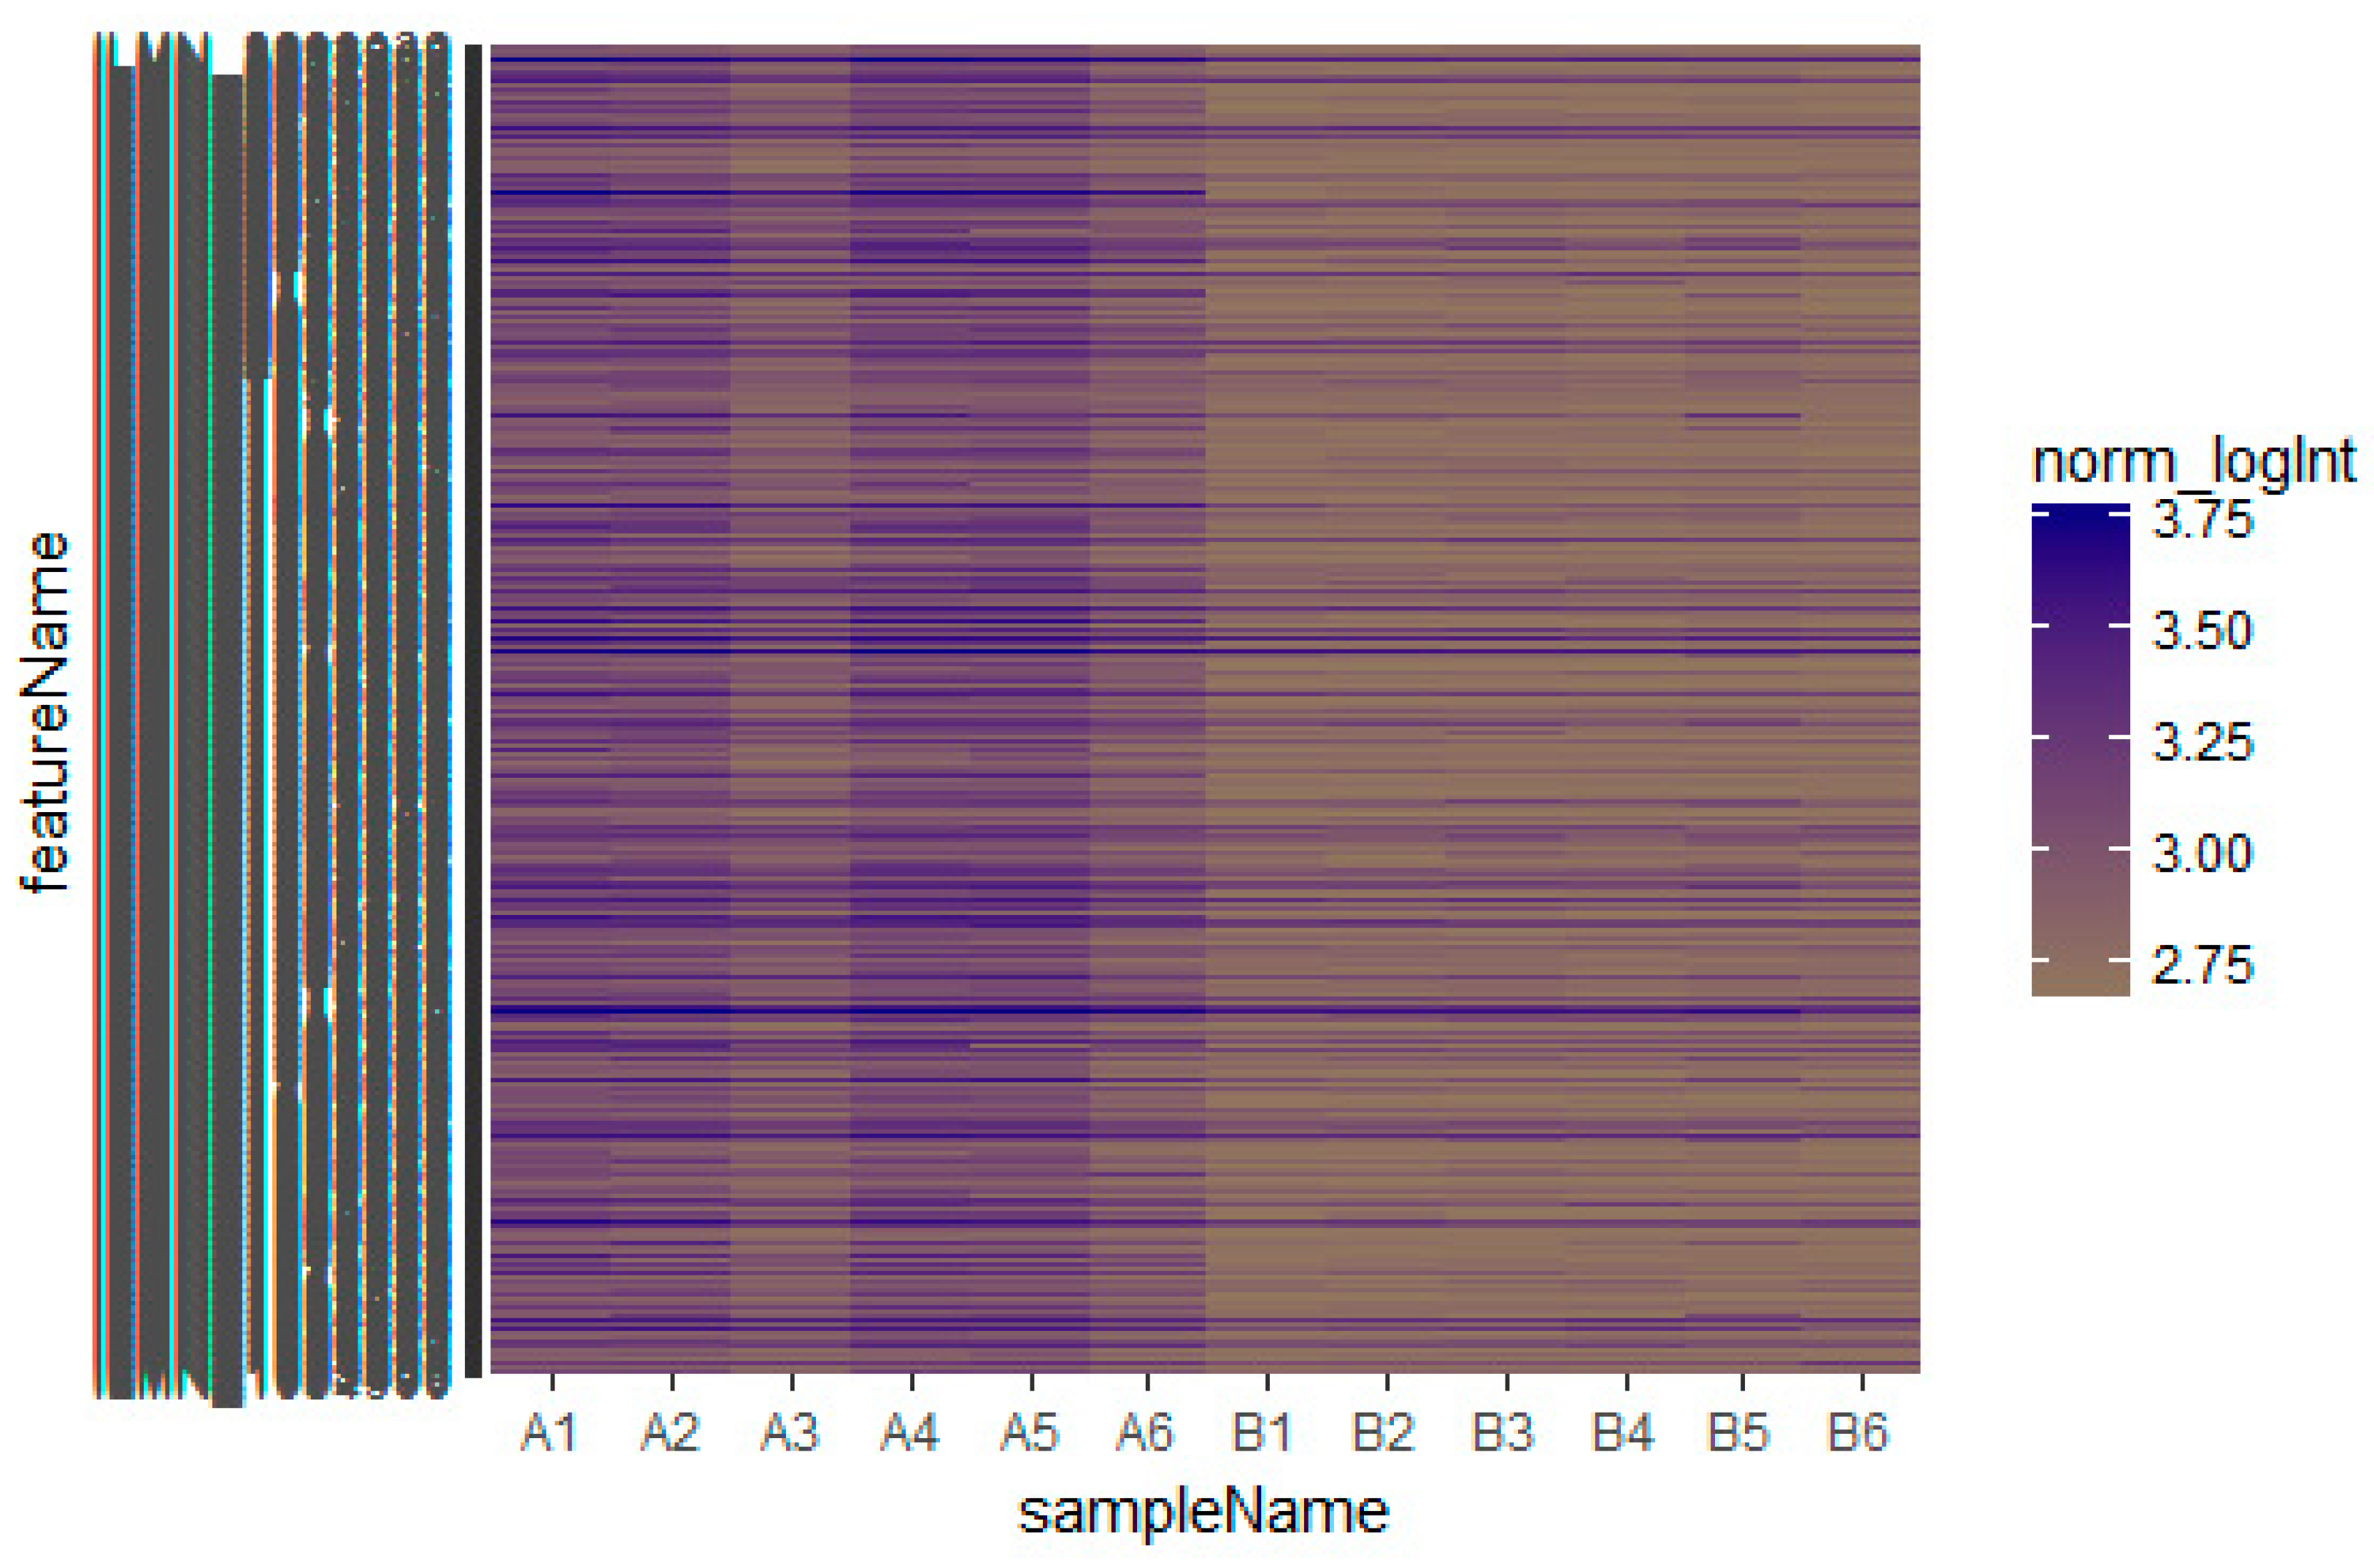
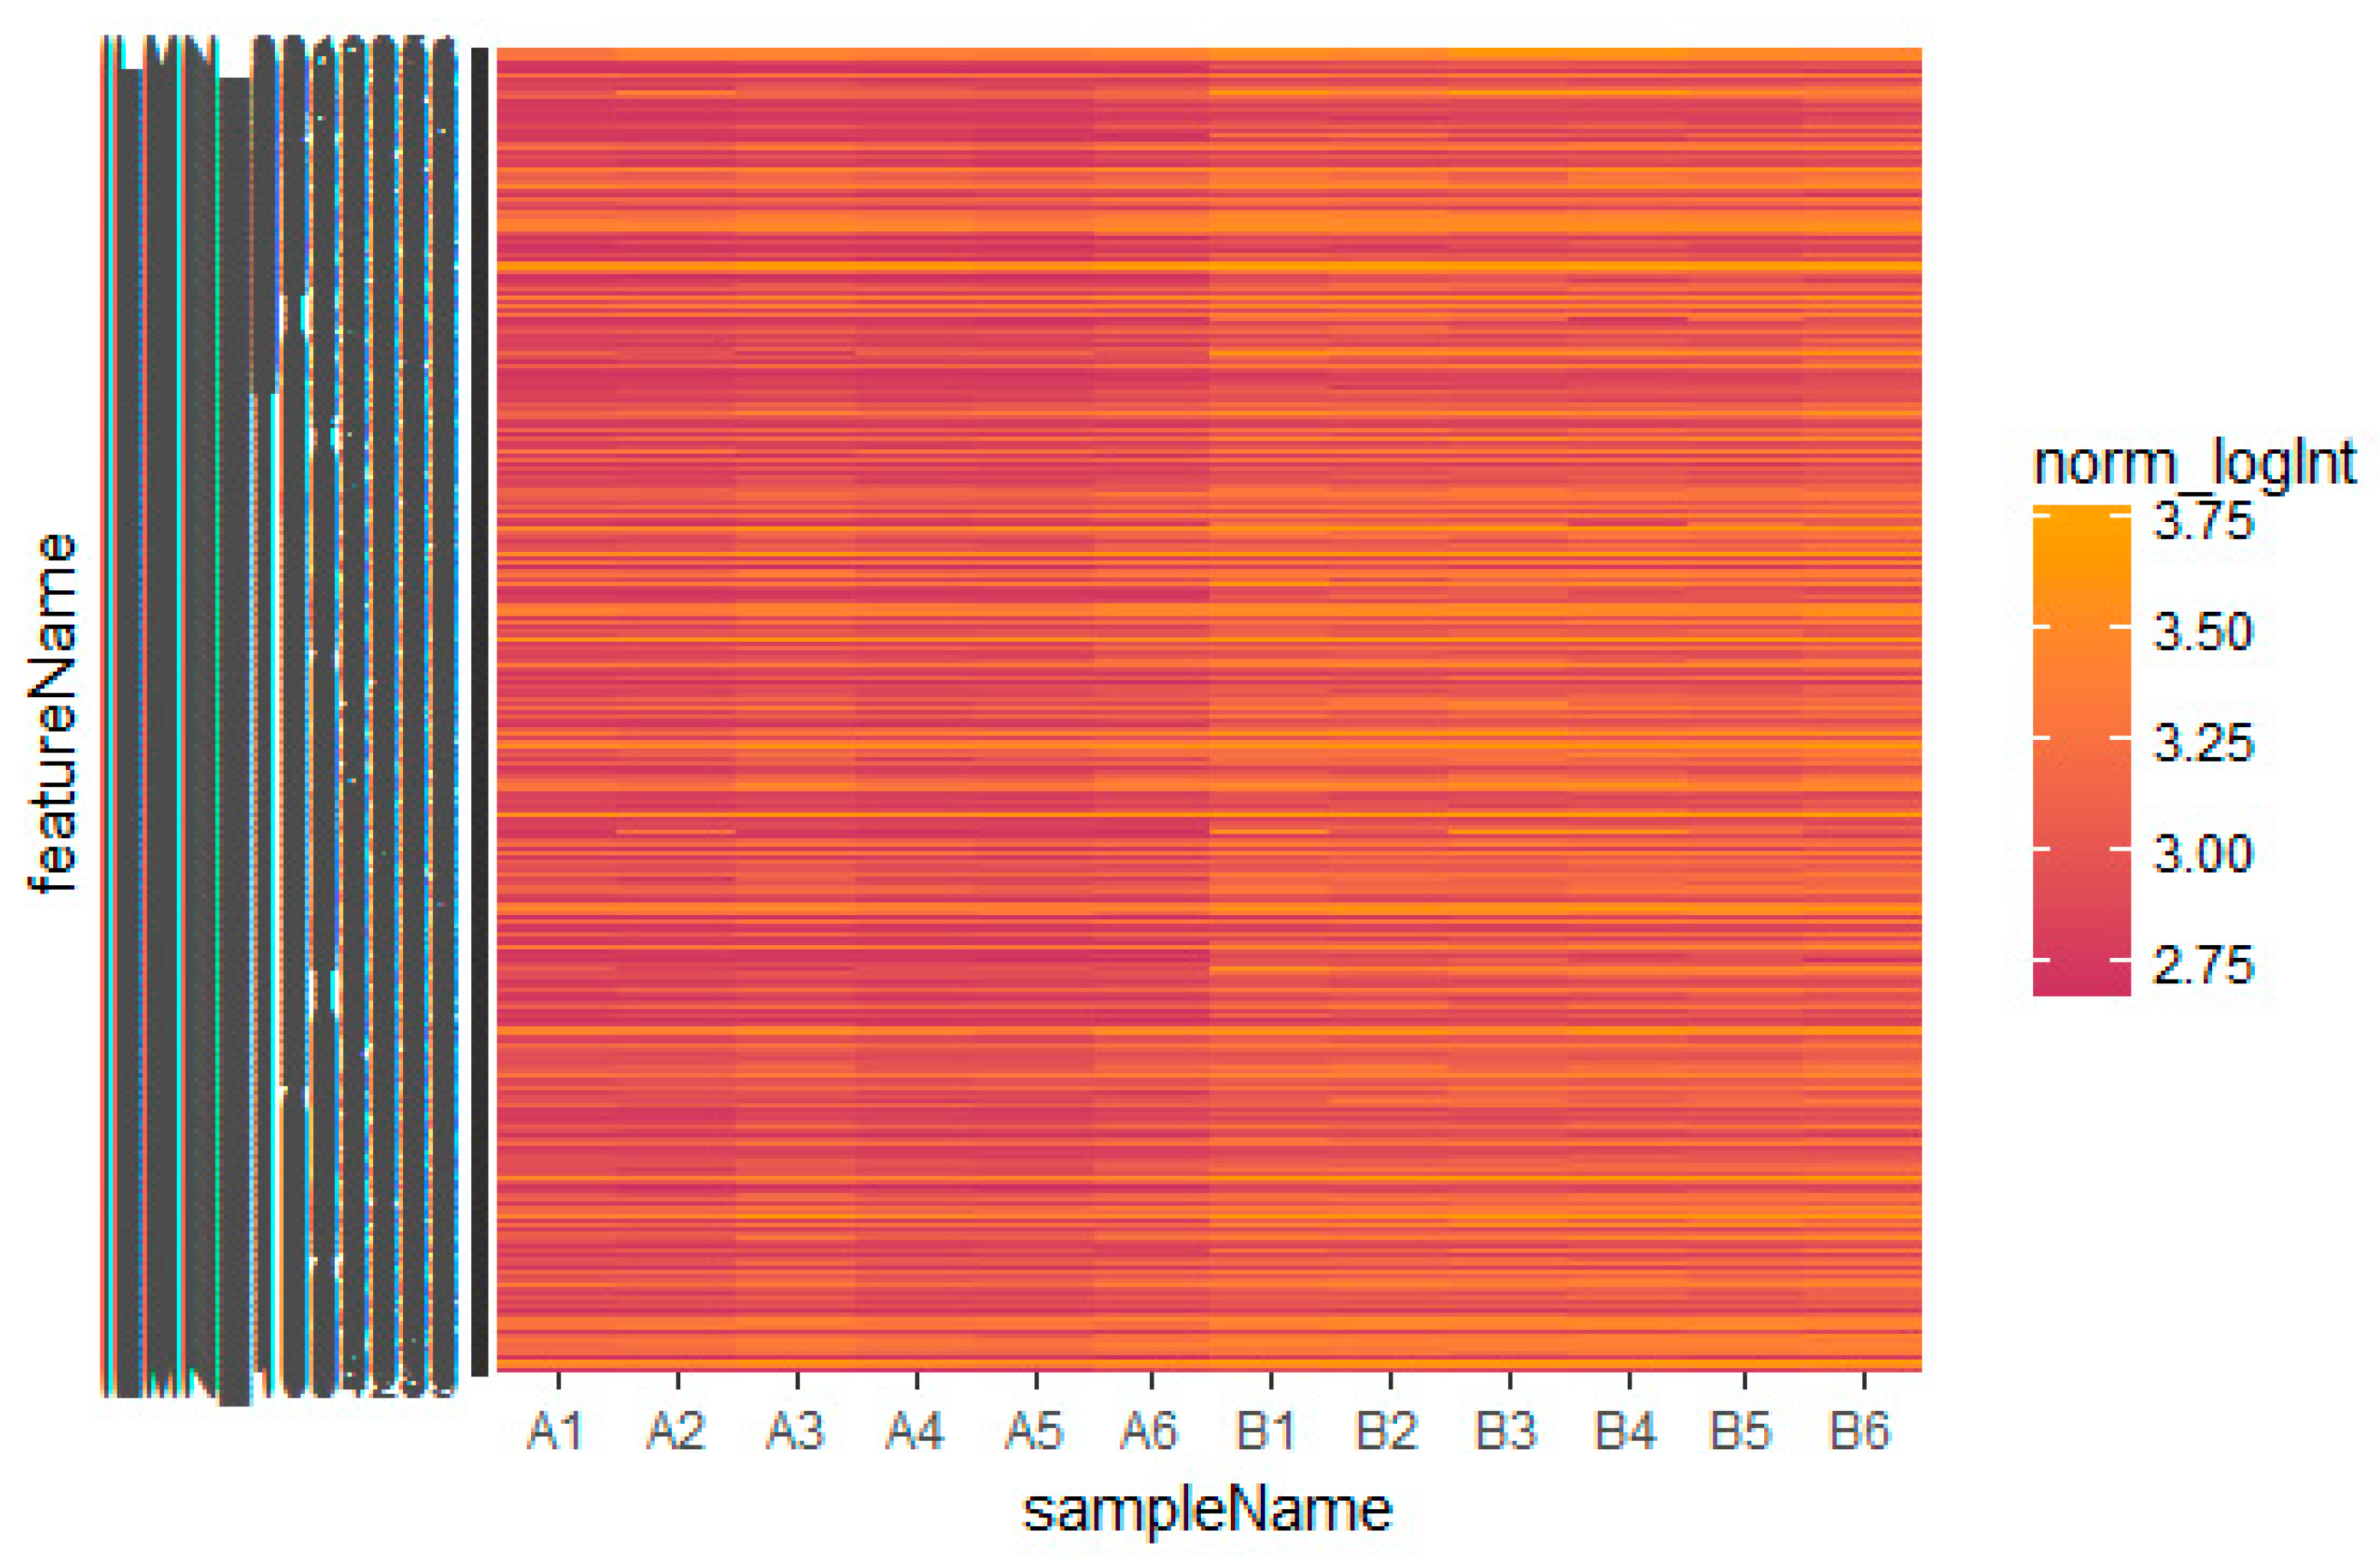
Based on the defined criteria (log FC (fold change) > 1.24 for up-regulated genes and log FC (fold change) −0.725 for down-regulated genes) we compared the results for the two types of samples in the dataset in terms of the total differentially expressed genes using R Bioconductor. Among the total of 873 DEGs diagnosed in the GEO data sets were 435 up-regulated and 438 down-regulated DEGs (Table S1). A heatmap showed that the identified up-regulated and down-regulated DEGs could differentiate the omental adipose tissue samples with insulin resistance and the subcutaneous adipose tissue samples with insulin resistance (Figure 2 and Figure 3).
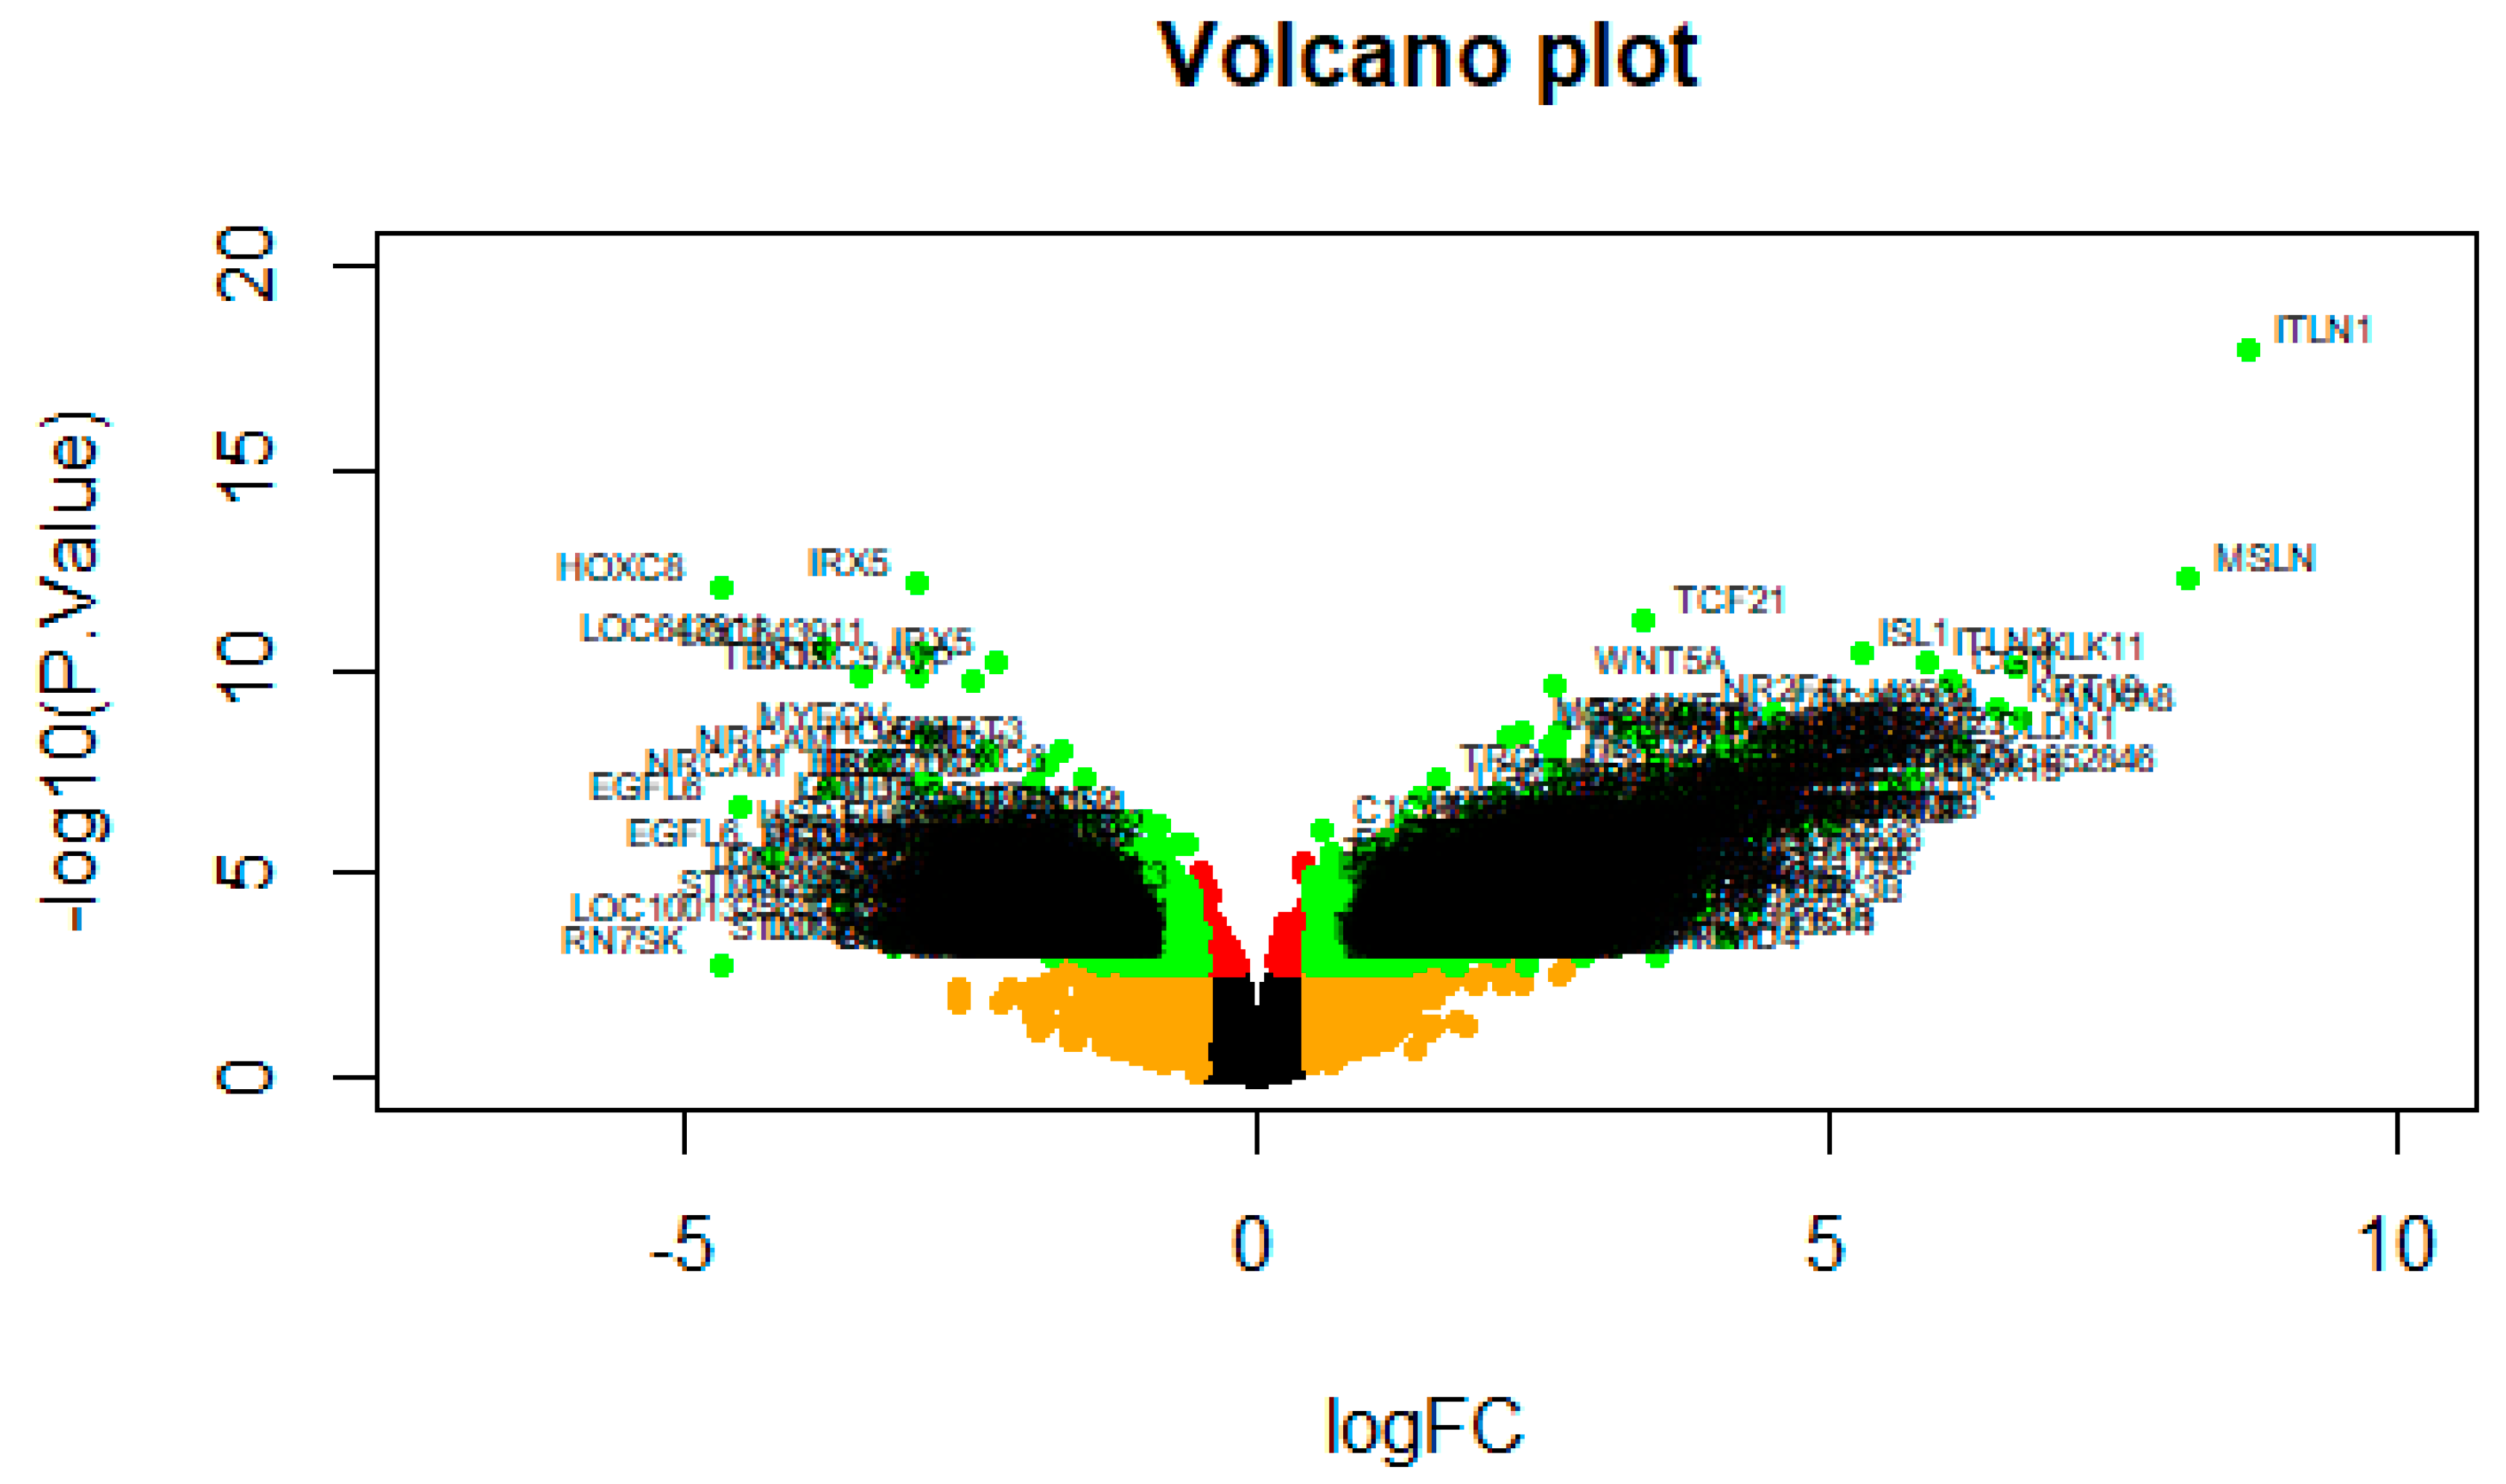
A volcano plot of the DEG screening is shown in Figure 4.
3.2. Pathway Enrichment Analysis of Differentially Expressed Genes
To analyze the biological classification of the DEGs, a pathway enrichment analysis was performed using Enrichr. The pathway analysis results showed that up-regulated DEGs were significantly enriched in complement and coagulation cascades and cell adhesion molecules (CAMs) for KEGG; complement activation and complement and coagulation cascades for WikiPathways; the classical complement pathway and the lectin-induced complement pathway for BioCarta; regulation of the complement cascade and activation of C3 and C5 for Reactome; retinoate biosynthesis I and nicotine degradation IV for HumanCyc; the Wnt signaling network and the non-canonical Wnt signaling pathway for NCI-Nature; and the cadherin signaling pathway and the Alzheimer disease–presenilin pathway for Panther (Table S2). Down-regulated DEGs were significantly enriched in the biosynthesis of amino acids and the Notch signaling pathway for KEGG; the Notch signaling pathway and the Notch signaling pathway for WikiPathways; the segmentation clock and the p53 signaling pathway for BioCarta; metabolism of vitamins and cofactors and diseases of glycosylation for Reactome; glycine betaine degradation and gluconeogenesis for HumanCyc; the Notch signaling pathway and validated targets of C-MYC transcriptional repression for NCI-Nature; and the Notch signaling pathway and the nicotine pharmacodynamics pathway for Panther (Table S3).
3.3. Gene OntologyEnrichment Analyses of Differentially Expressed Genes
The enriched GO terms for DEGs were identified using the online tool Enrichr. The up-regulated genes were significantly enriched in the functions of cardiac muscle cell–cardiac muscle cell adhesion and regulation of transforming growth factor β2 production for BP, microvillus membrane and axonal growth cone for CC, and protein binding involved in heterotypic cell–cell adhesion and coreceptor activity involved in the Wnt signaling pathway and the planar cell polarity pathway for MF (Table S4). Down-regulated genes were significantly enriched in the functions of negative regulation of osteoblast differentiation and negative regulation of cell differentiation for BP, dendrite and intercalated disc for CC, and estradiol 17-β-dehydrogenase activity and steroid dehydrogenase activity acting on the CH–OH group of donors, Nicotinamide adenine dinucleotide (NAD) and Nicotinamide adenine dinucleotide phosphate (NADP)as acceptor for MF (Table S5).
3.4. Construction of the Protein–Protein InteractionNetwork and Topological Analysis
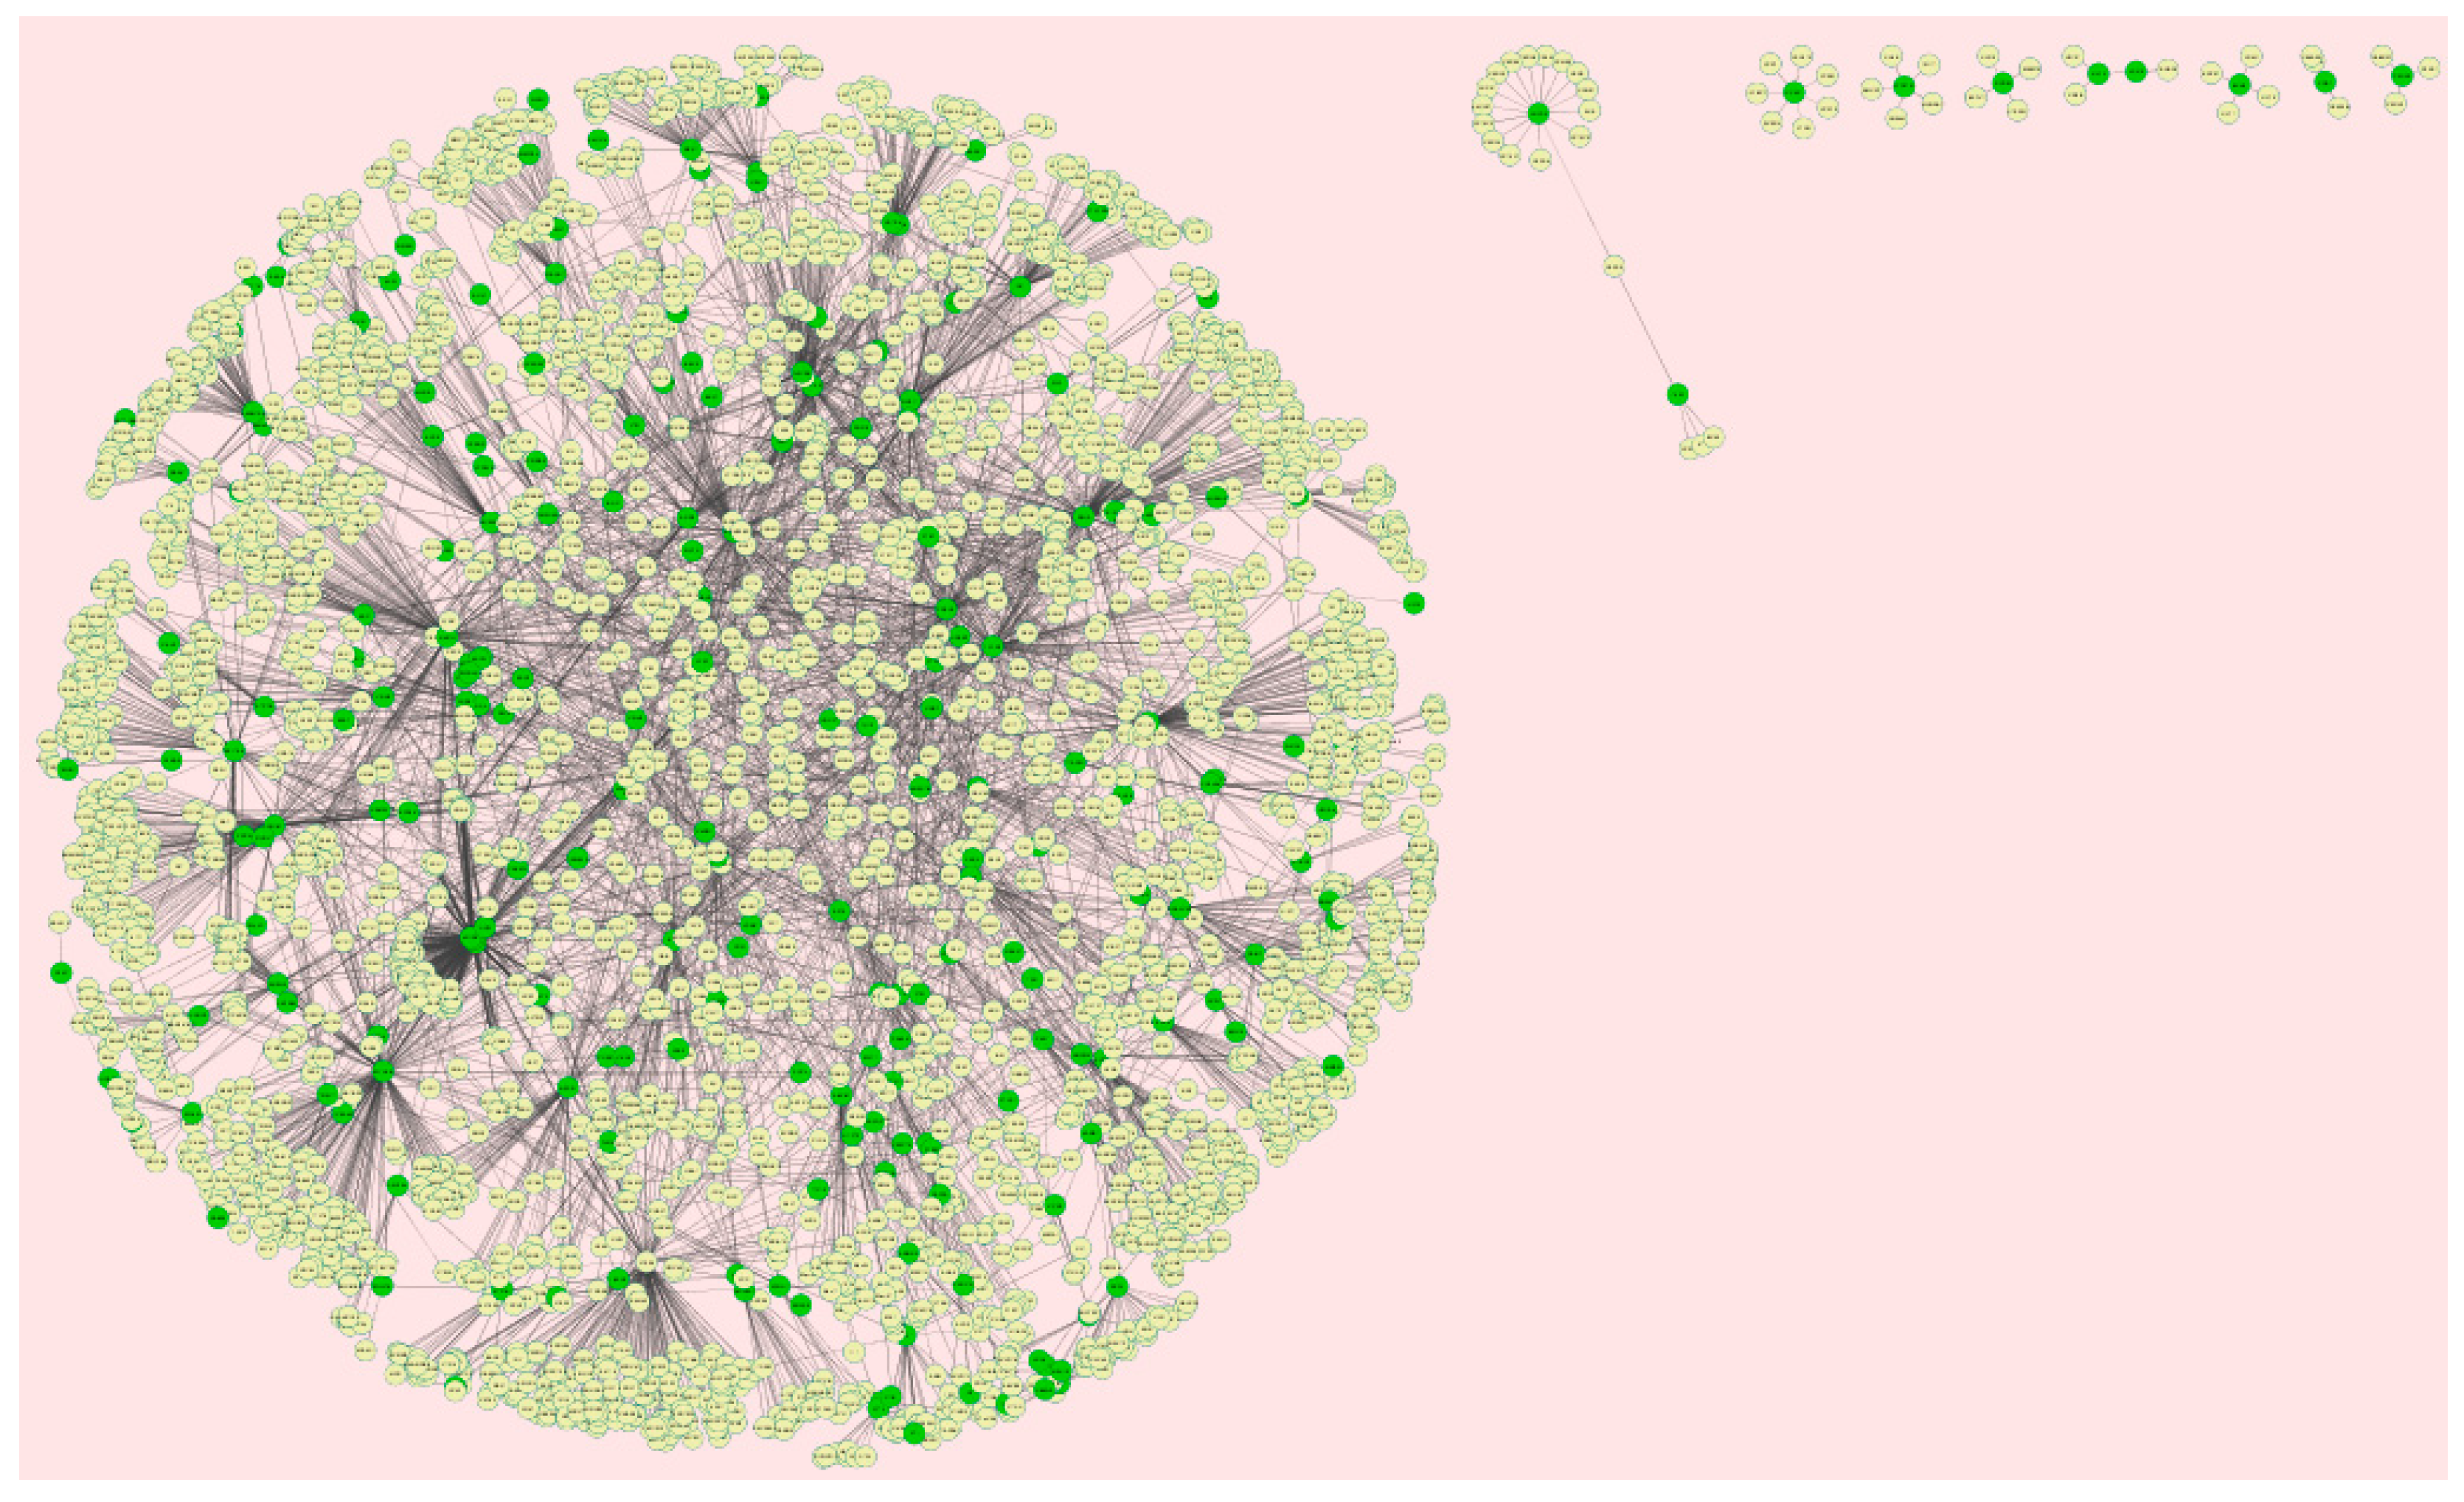
Protein–protein interaction networks were constructed on the basis of STRING database. We analyzed the network properties such as node degree, betweenness centrality, stress centrality, closeness centrality, and cluster coefficient. The PPI network for up-regulated DEGs is shown in Figure 5; it has 3280 nodes and 5633 interactions.
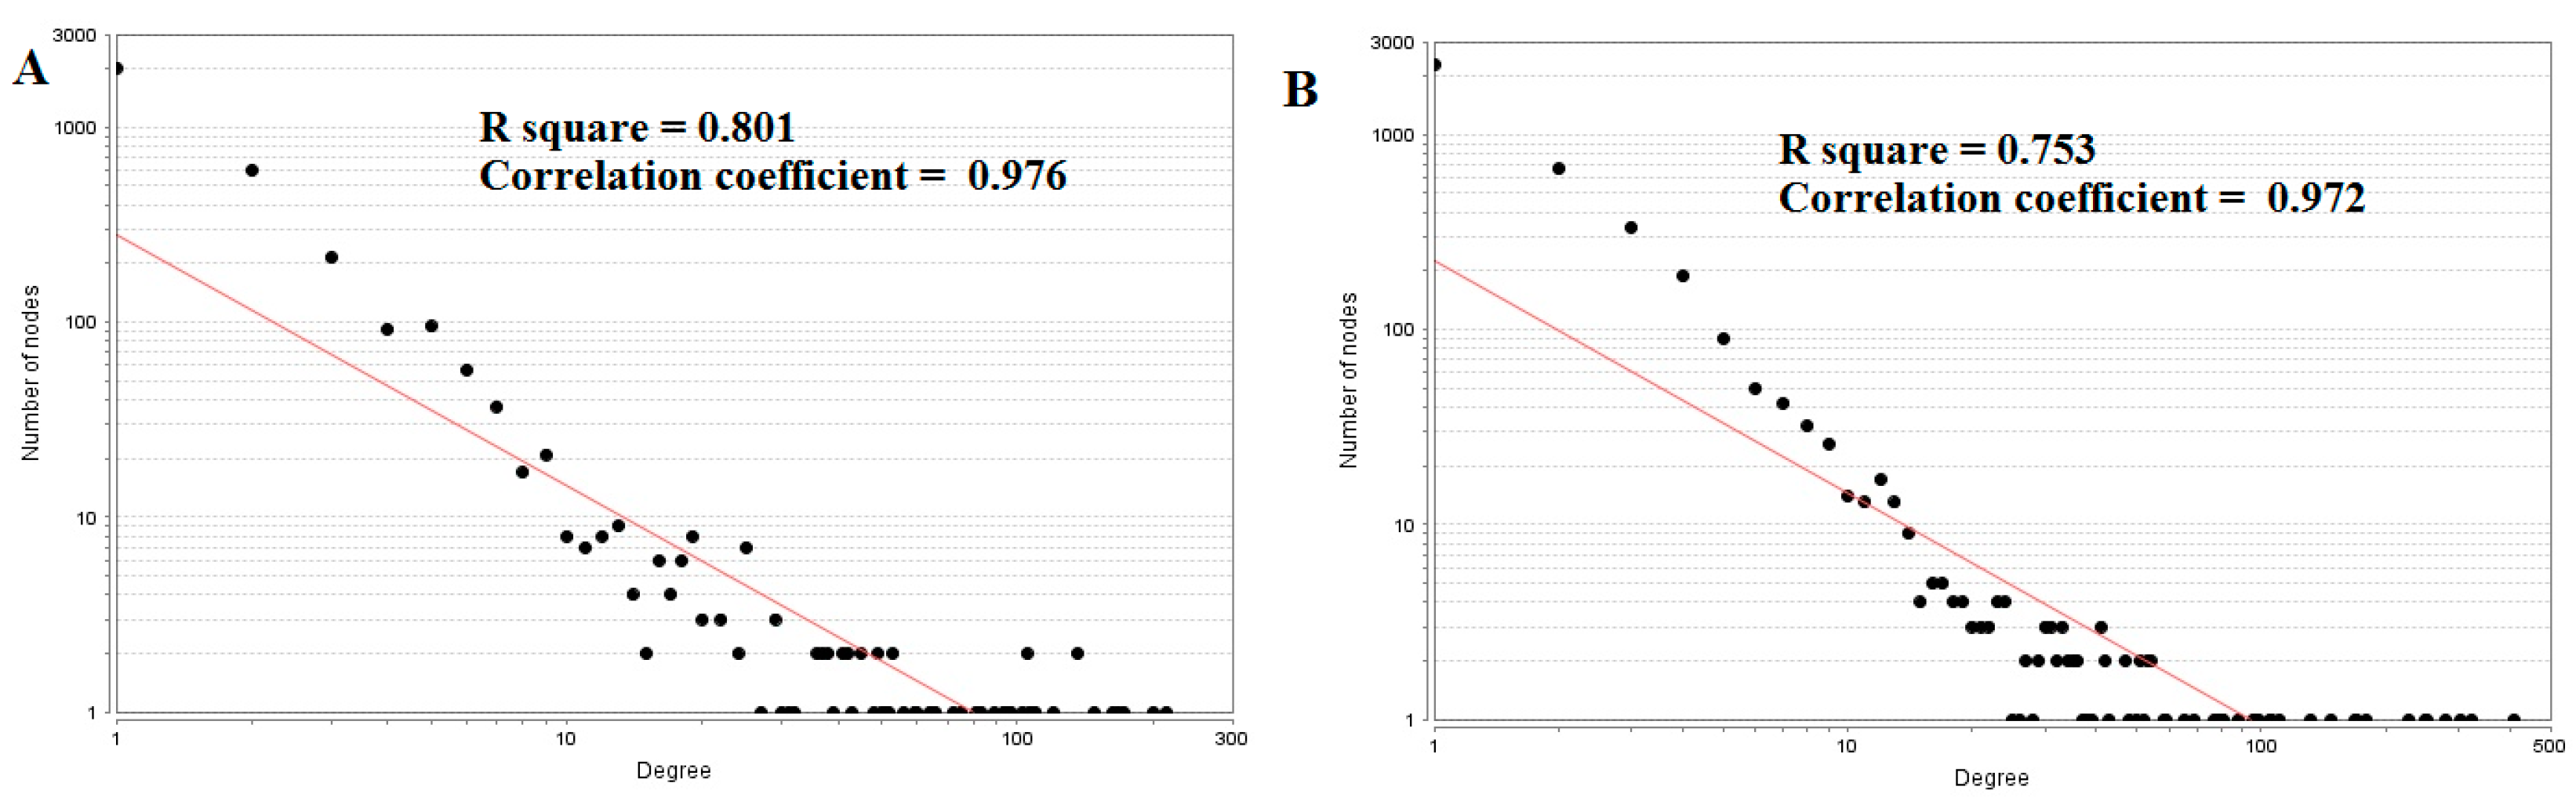
The top five nodes with the greatest degrees are listed in Table S6, including MYO5B (degree = 214), DLG2 (degree = 200), ERBB3 (degree = 167), RHOU (degree = 163), and SNCA (degree = 148). The R-squared value and correlation coefficient were 0.801and 0.976, respectively (Figure 6).
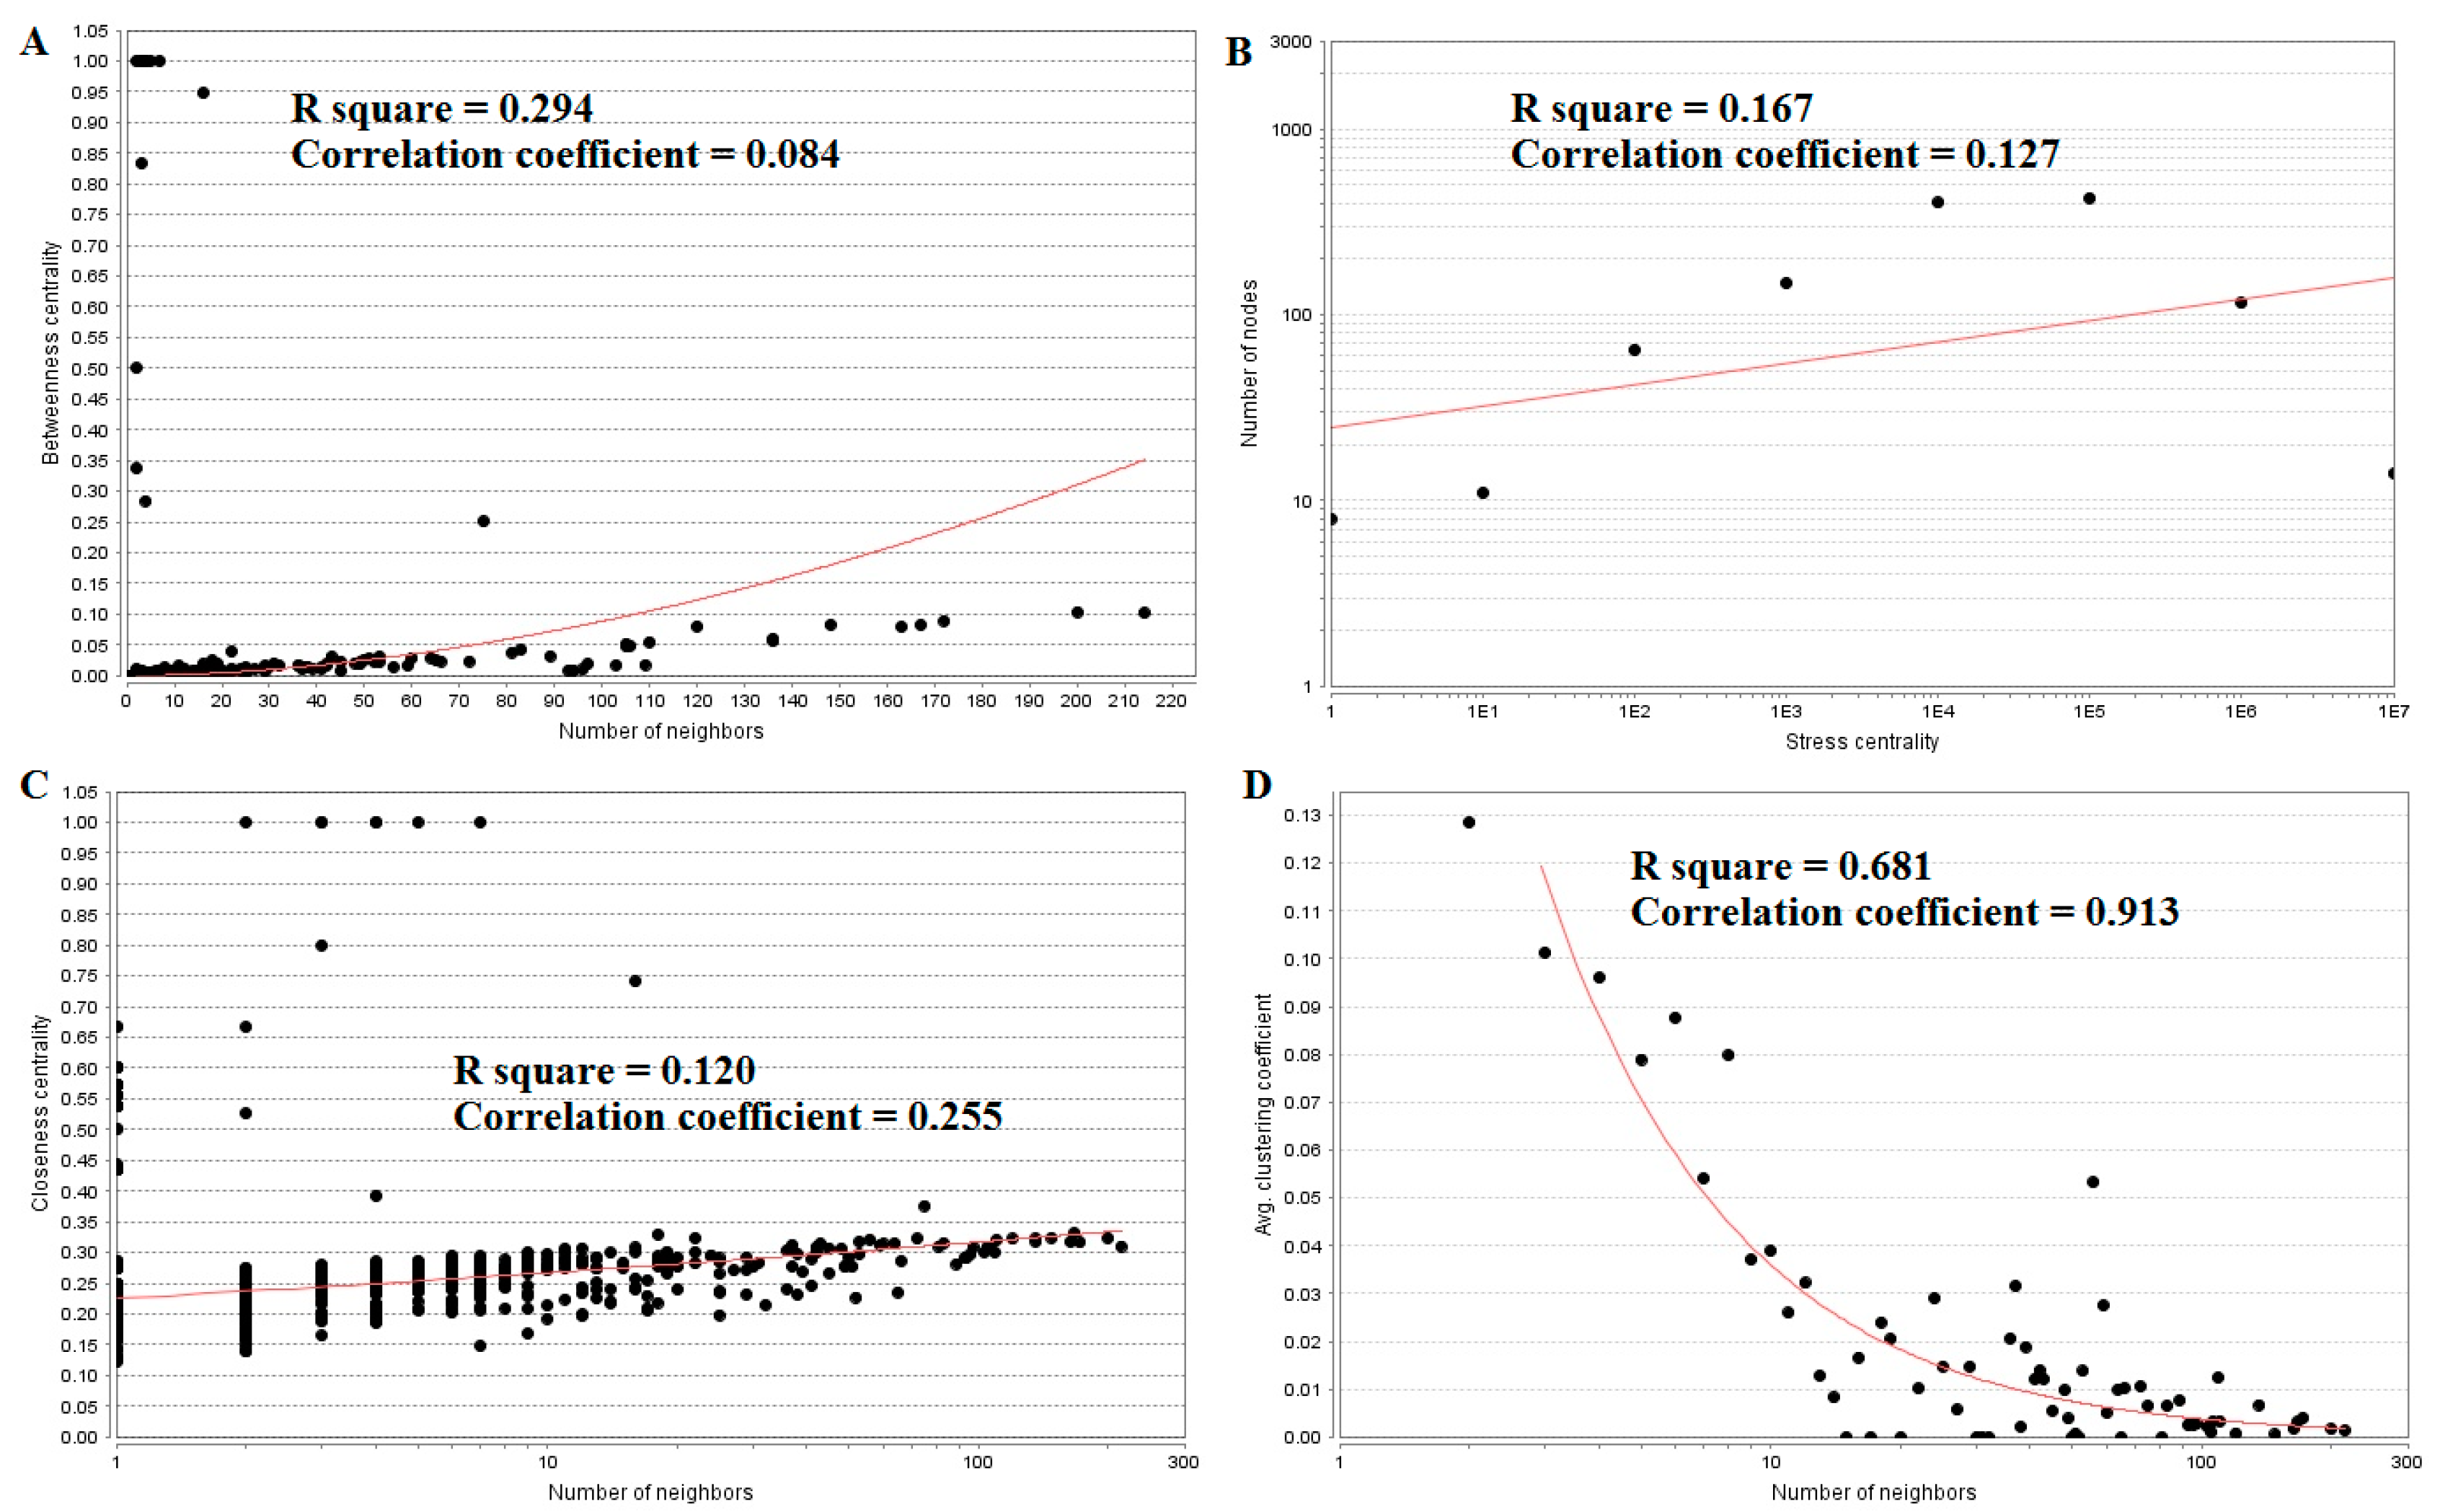
The top five up-regulated genes with high between ness centrality were SGPP2 (betweenness = 0.94736842), IGSF3 (betweenness = 0.83333333), VSIG2 (betweenness = 0.5), ITLN1 (betweenness = 0.28421053), and DLG2 (betweenness = 0.10398507), as shown in Table S6. The R-squared value and correlation coefficient were 0.294 and 0.084, respectively (Figure 7A).
The top five up-regulated high-stress genes were MYO5B (stress = 27380848), RHOU (stress = 20229932), ERBB3 (stress = 19629044), PRKCZ (stress = 18024744), and SNCA (stress = 13967348), as shown in Table S6. The R-squared value and correlation coefficient were 0.167 and 0.127, respectively (Figure 7B). The top five up-regulated genes with high closeness centrality were IGSF3 (closeness = 0.8), SGPP2 (closeness = 0.74074074), VSIG2 (closeness = 0.66666667), ITLN1 (closeness = 0.39215686), and ERBB3 (closeness = 0.33147919), as shown in Table S6. The R-squared value and correlation coefficient were 0.120 and 0.255, respectively (Figure 7C). The top five up-regulated genes with low clustering coefficient were CCL21 (clustering coefficient = 0), CYP27A1 (clustering coefficient = 0), RPRM (clustering coefficient = 0), BCHE (clustering coefficient = 0), and CPB1 (clustering coefficient = 0), as shown in Table S6. The R-squared value and correlation coefficient were 0.681 and 0.913, respectively (Figure 7D).
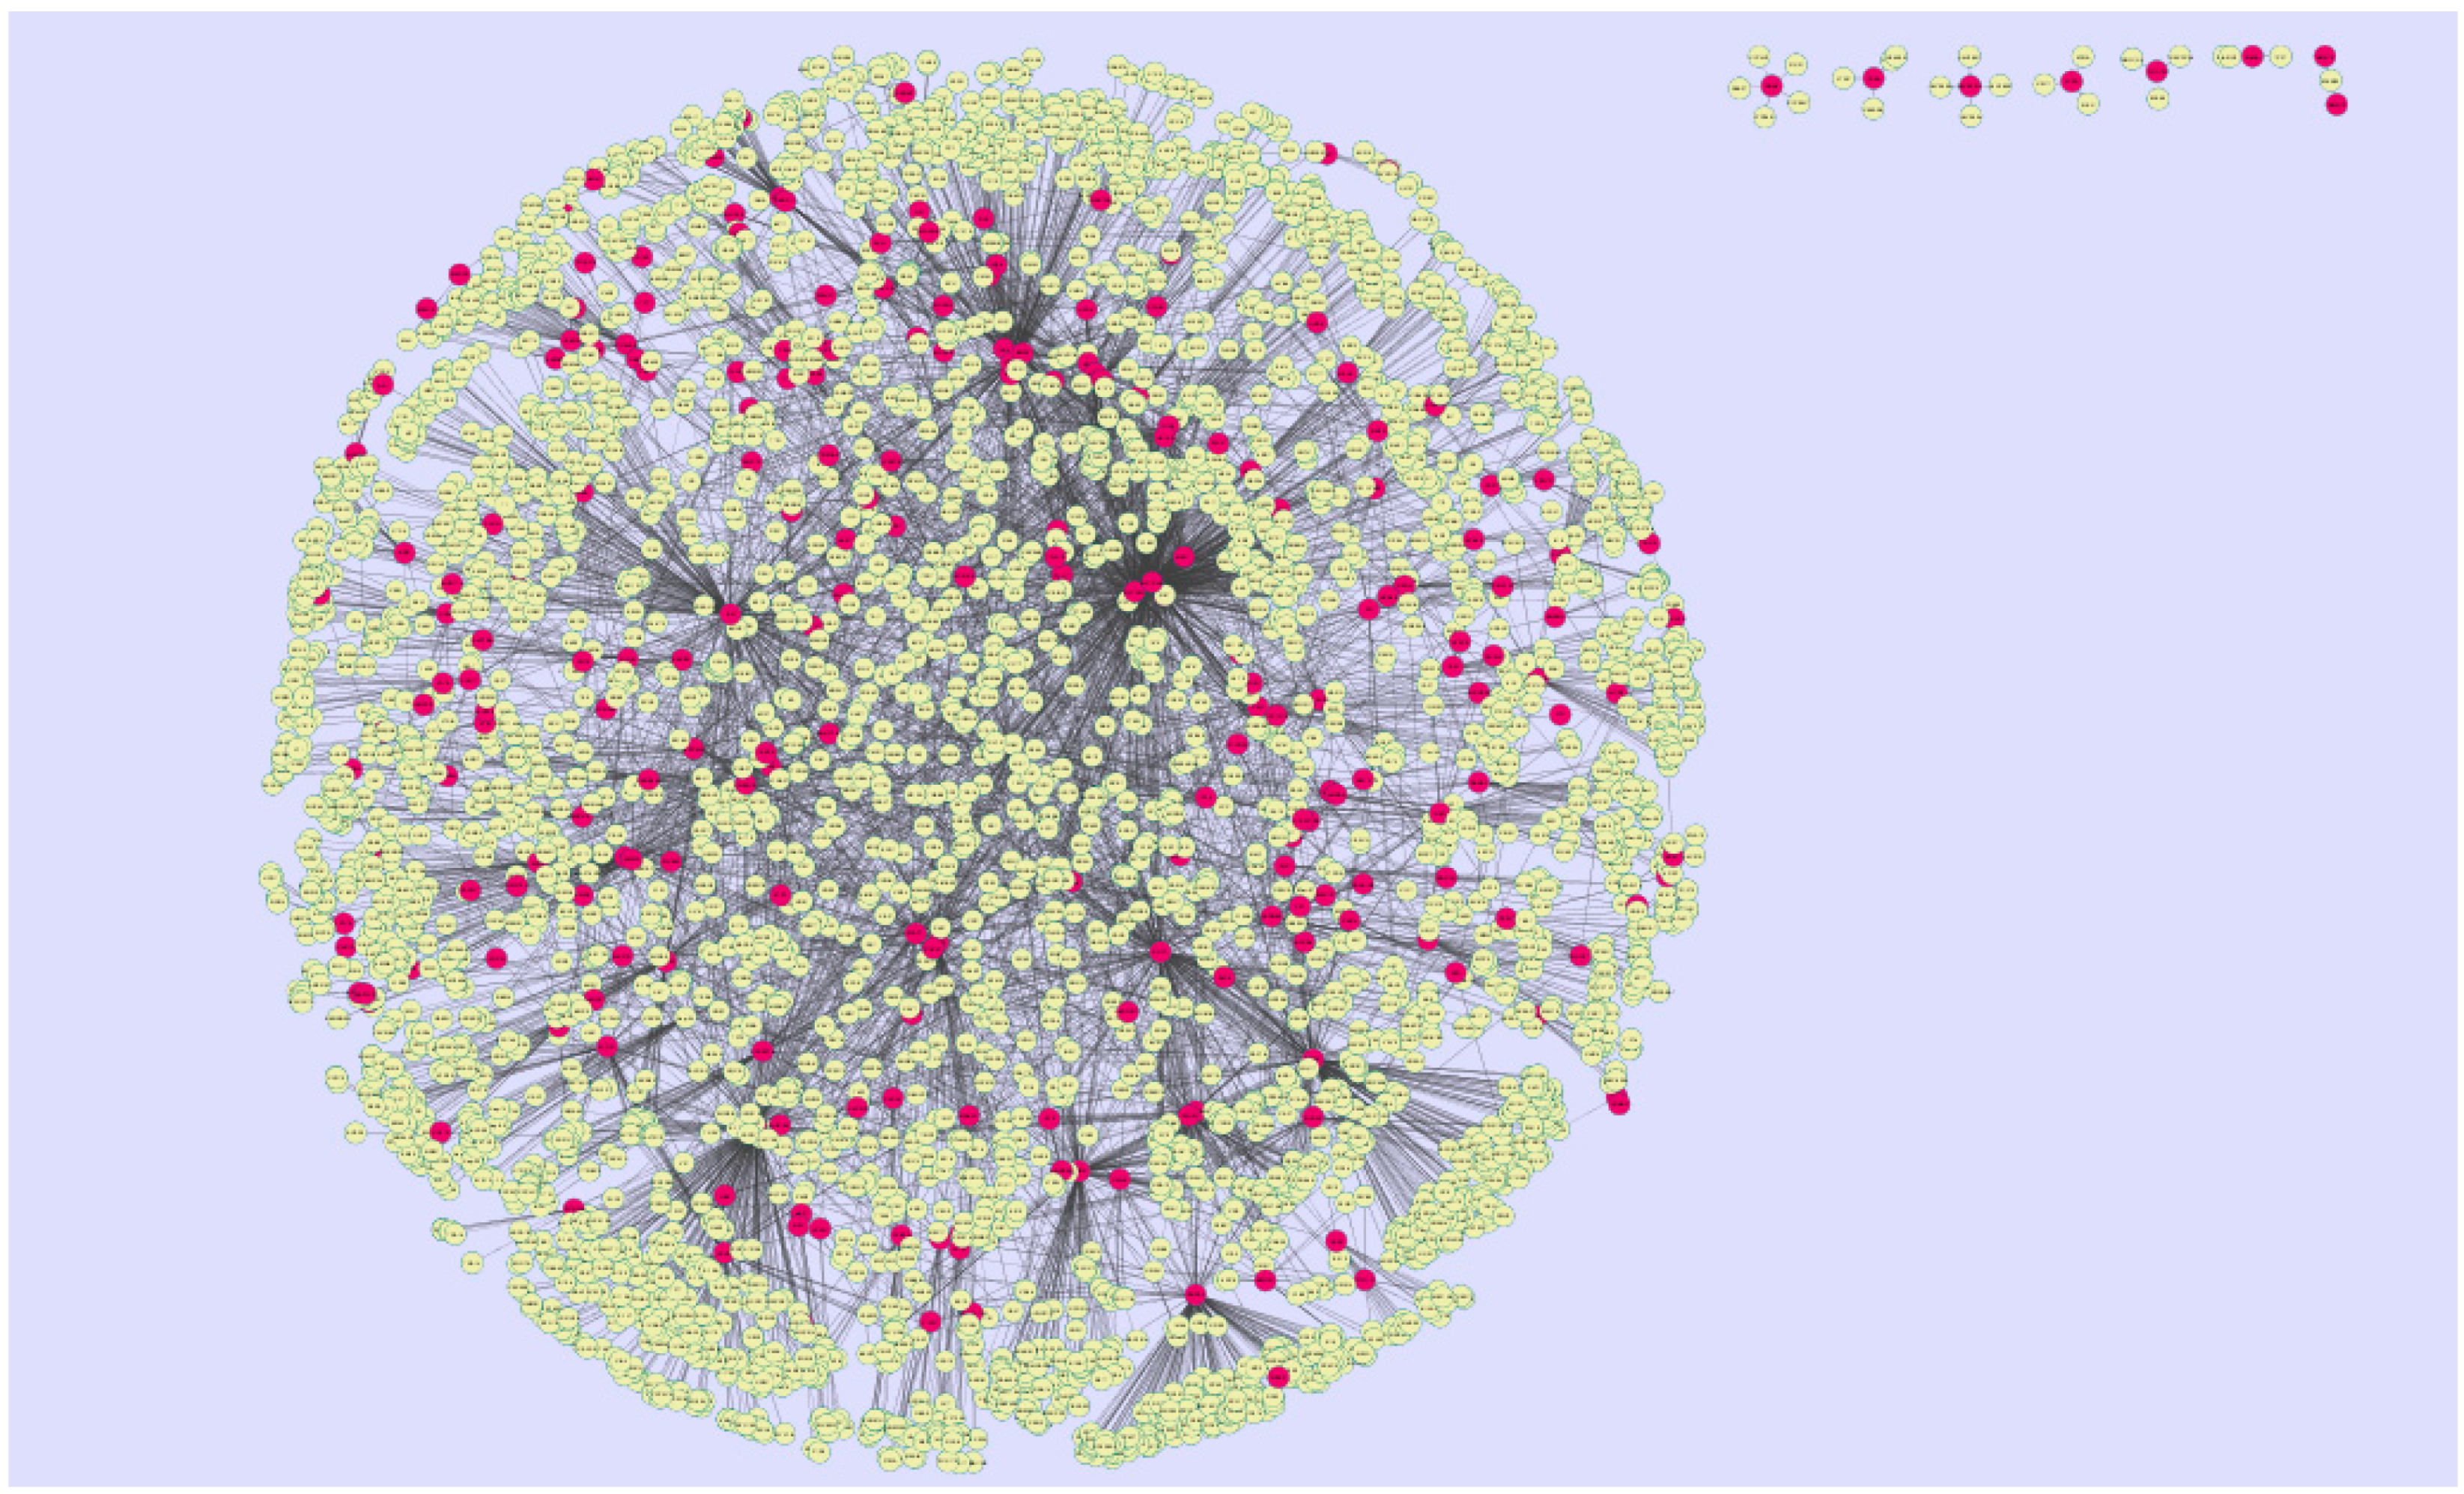
The PPI network for the down-regulated DEGs is shown in Figure 8; it has 3897 nodes and 7114 interactions.
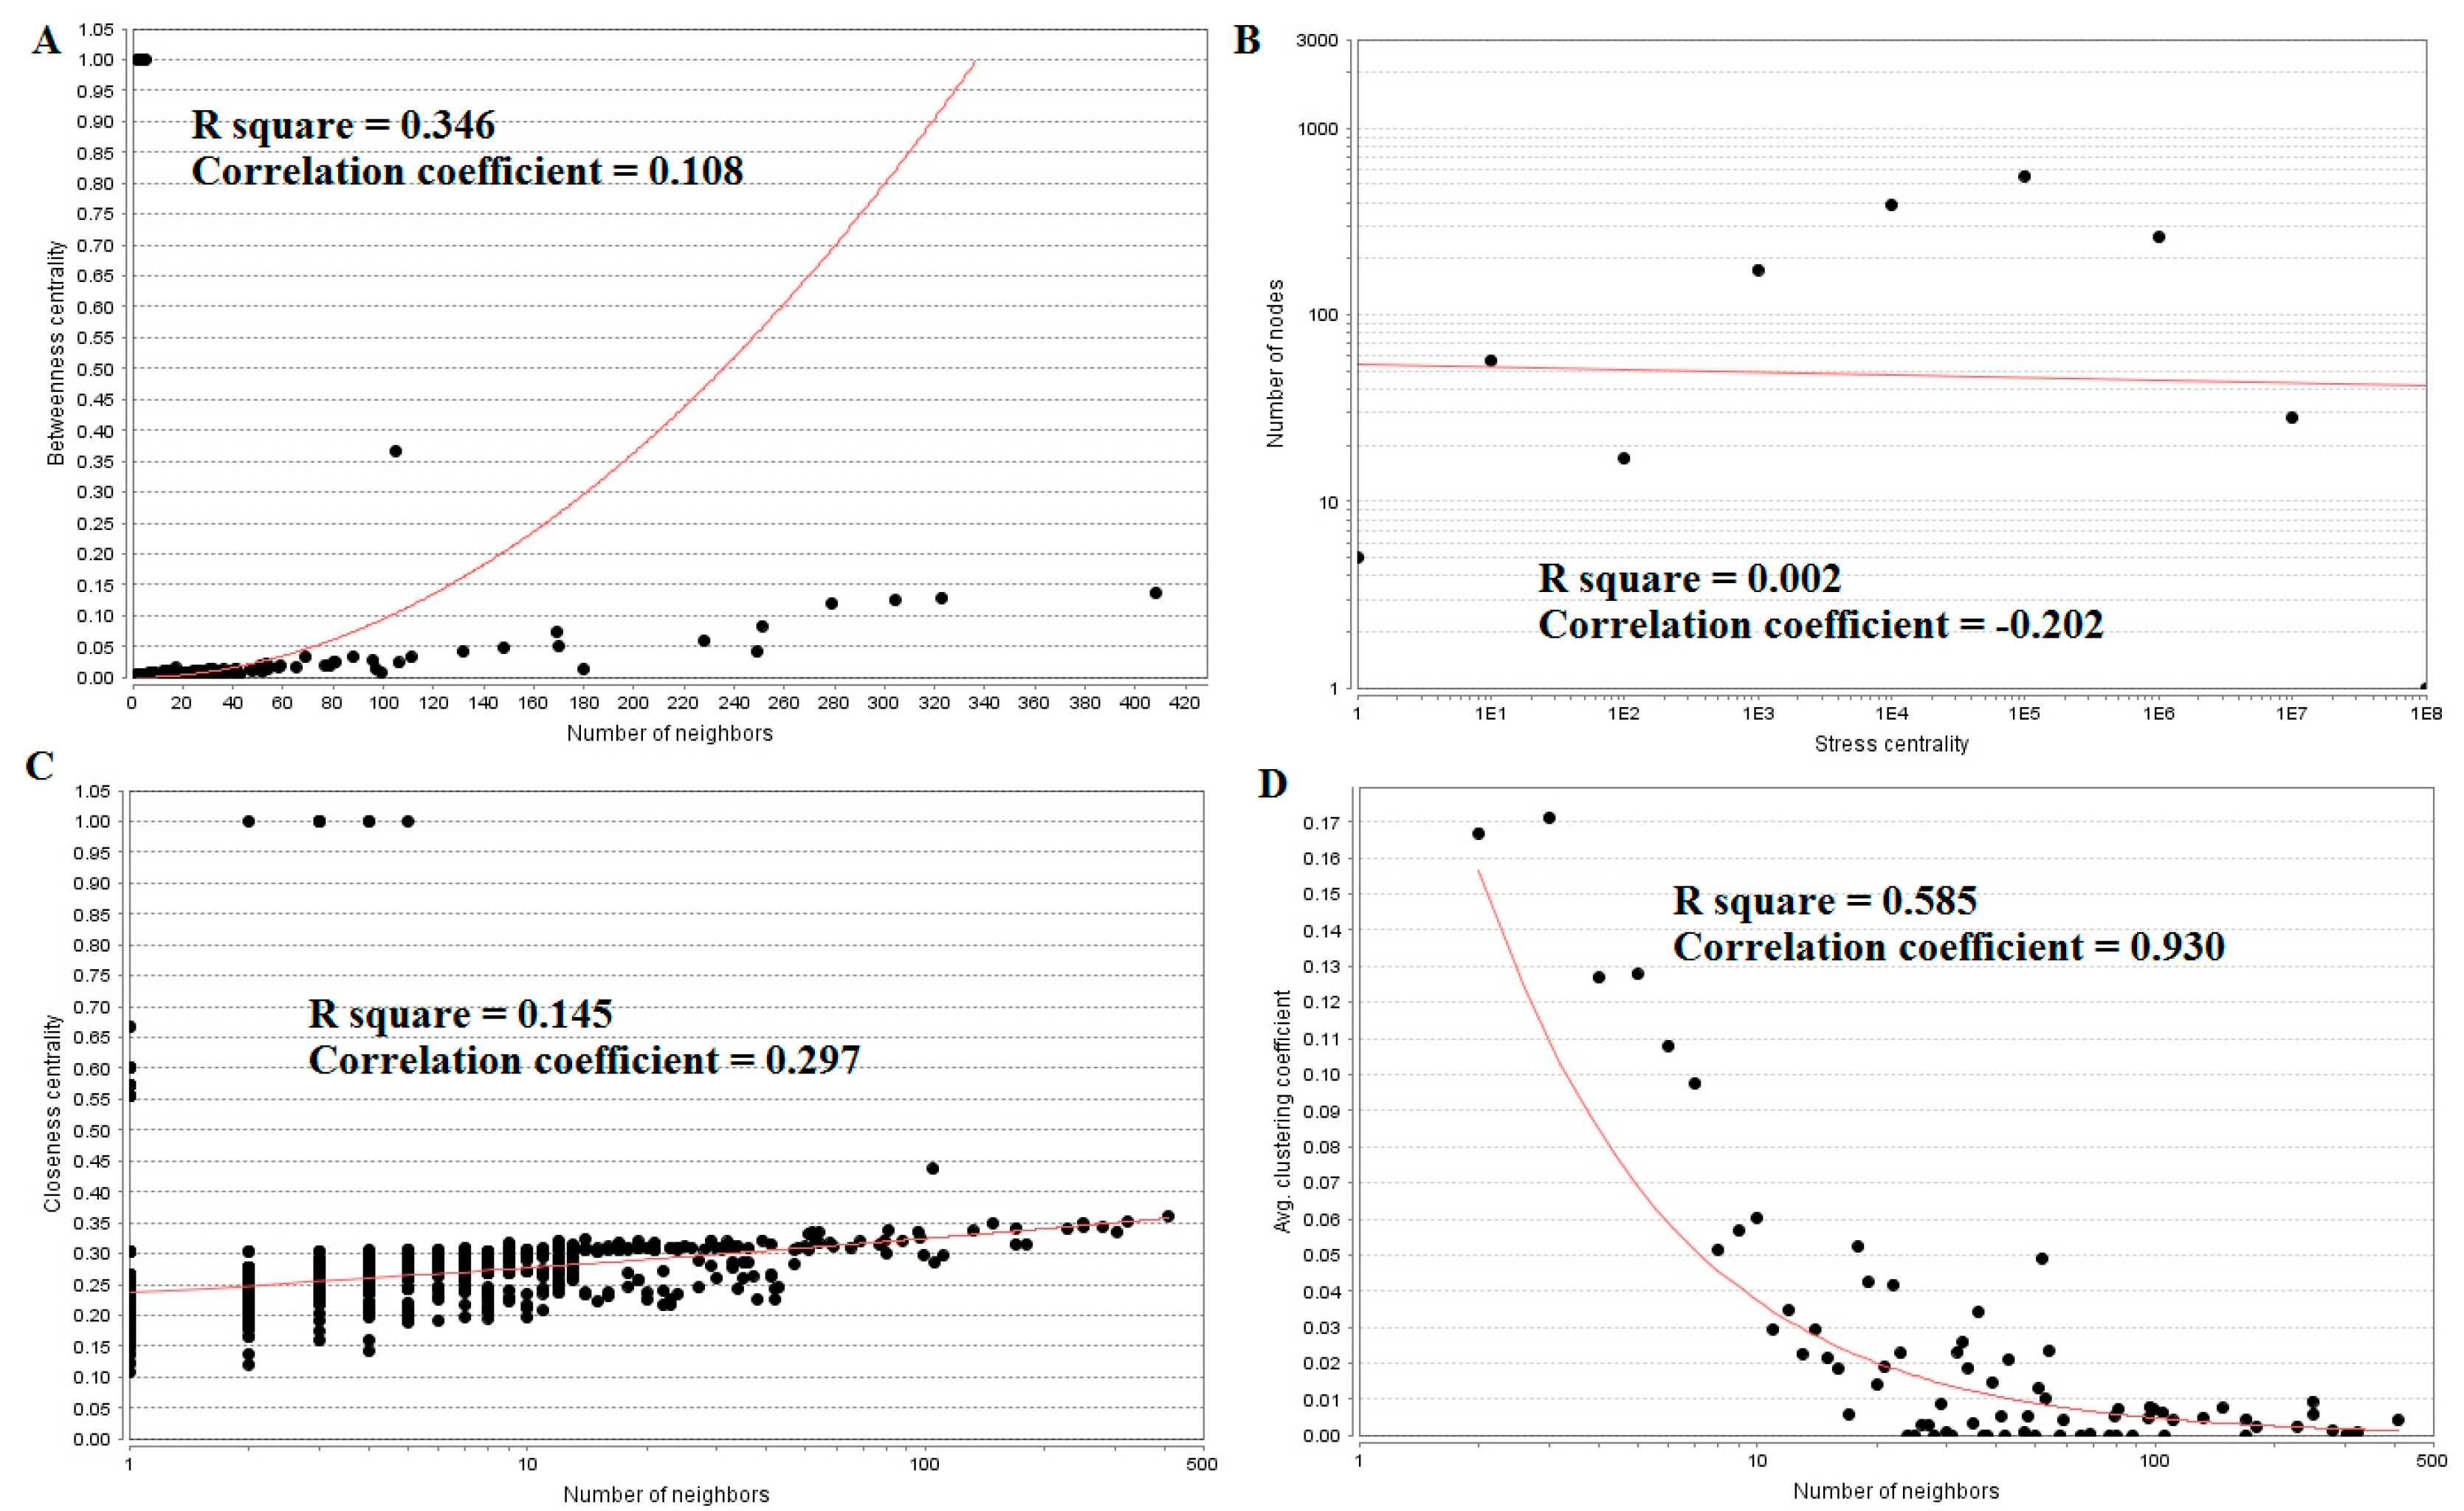
The top five nodes with the greatest degrees are listed in Table S6; they were NOTCH1 (degree = 408), AR (degree = 323), CPS1 (degree = 304), TUBB2A (degree = 279), and MRAS (degree = 251). The R-squared value and correlation coefficient were 0.753 and 0.972, respectively (Figure 6B). The top five down-regulated genes with high betweenness centrality were NOTCH1 (betweenness = 0.13655196), AR (betweenness = 0.1288082), CPS1 (betweenness = 0.125228), TUBB2A (betweenness = 0.12013939), and MRAS (betweenness = 0.08364569), as shown in Table S6. The R-squared value and correlation coefficient were 0.346 and 0.108, respectively (Figure 9A).
The top five down-regulated genes with high-stress genes were NOTCH1 (stress = 173740018), CPS1 (stress = 95361896), AR (stress = 79021038), NOTCH3 (stress = 65886422), and SOS1 (stress = 54135566), as shown in Table S6. The R-squared value and correlation coefficient were 0.002 and −0.202, respectively (Figure 9B). The top five down-regulated genes with high closeness centrality were NOTCH1 (closeness = 0.36067563), AR (closeness = 0.3522282), NOTCH3 (closeness = 0.34961556), CCND1 (closeness = 0.34866937), and MRAS (closeness = 0.34321996), as shown in Table S6. The R-squared value and correlation coefficient were 0.145 and 0.297, respectively (Figure 9C). The top five down-regulated genes with low clustering coefficient were SLC38A10 (clustering coefficient = 0), SYNC (clustering coefficient = 0), NMB (clustering coefficient = 0), POSTN (clustering coefficient = 0), and DMRT3 (clustering coefficient = 0), as shown in Table S6. The R-squared value and correlation coefficient were 0.585 and 0.930, respectively (Figure 9D).
3.5. Module Analysis
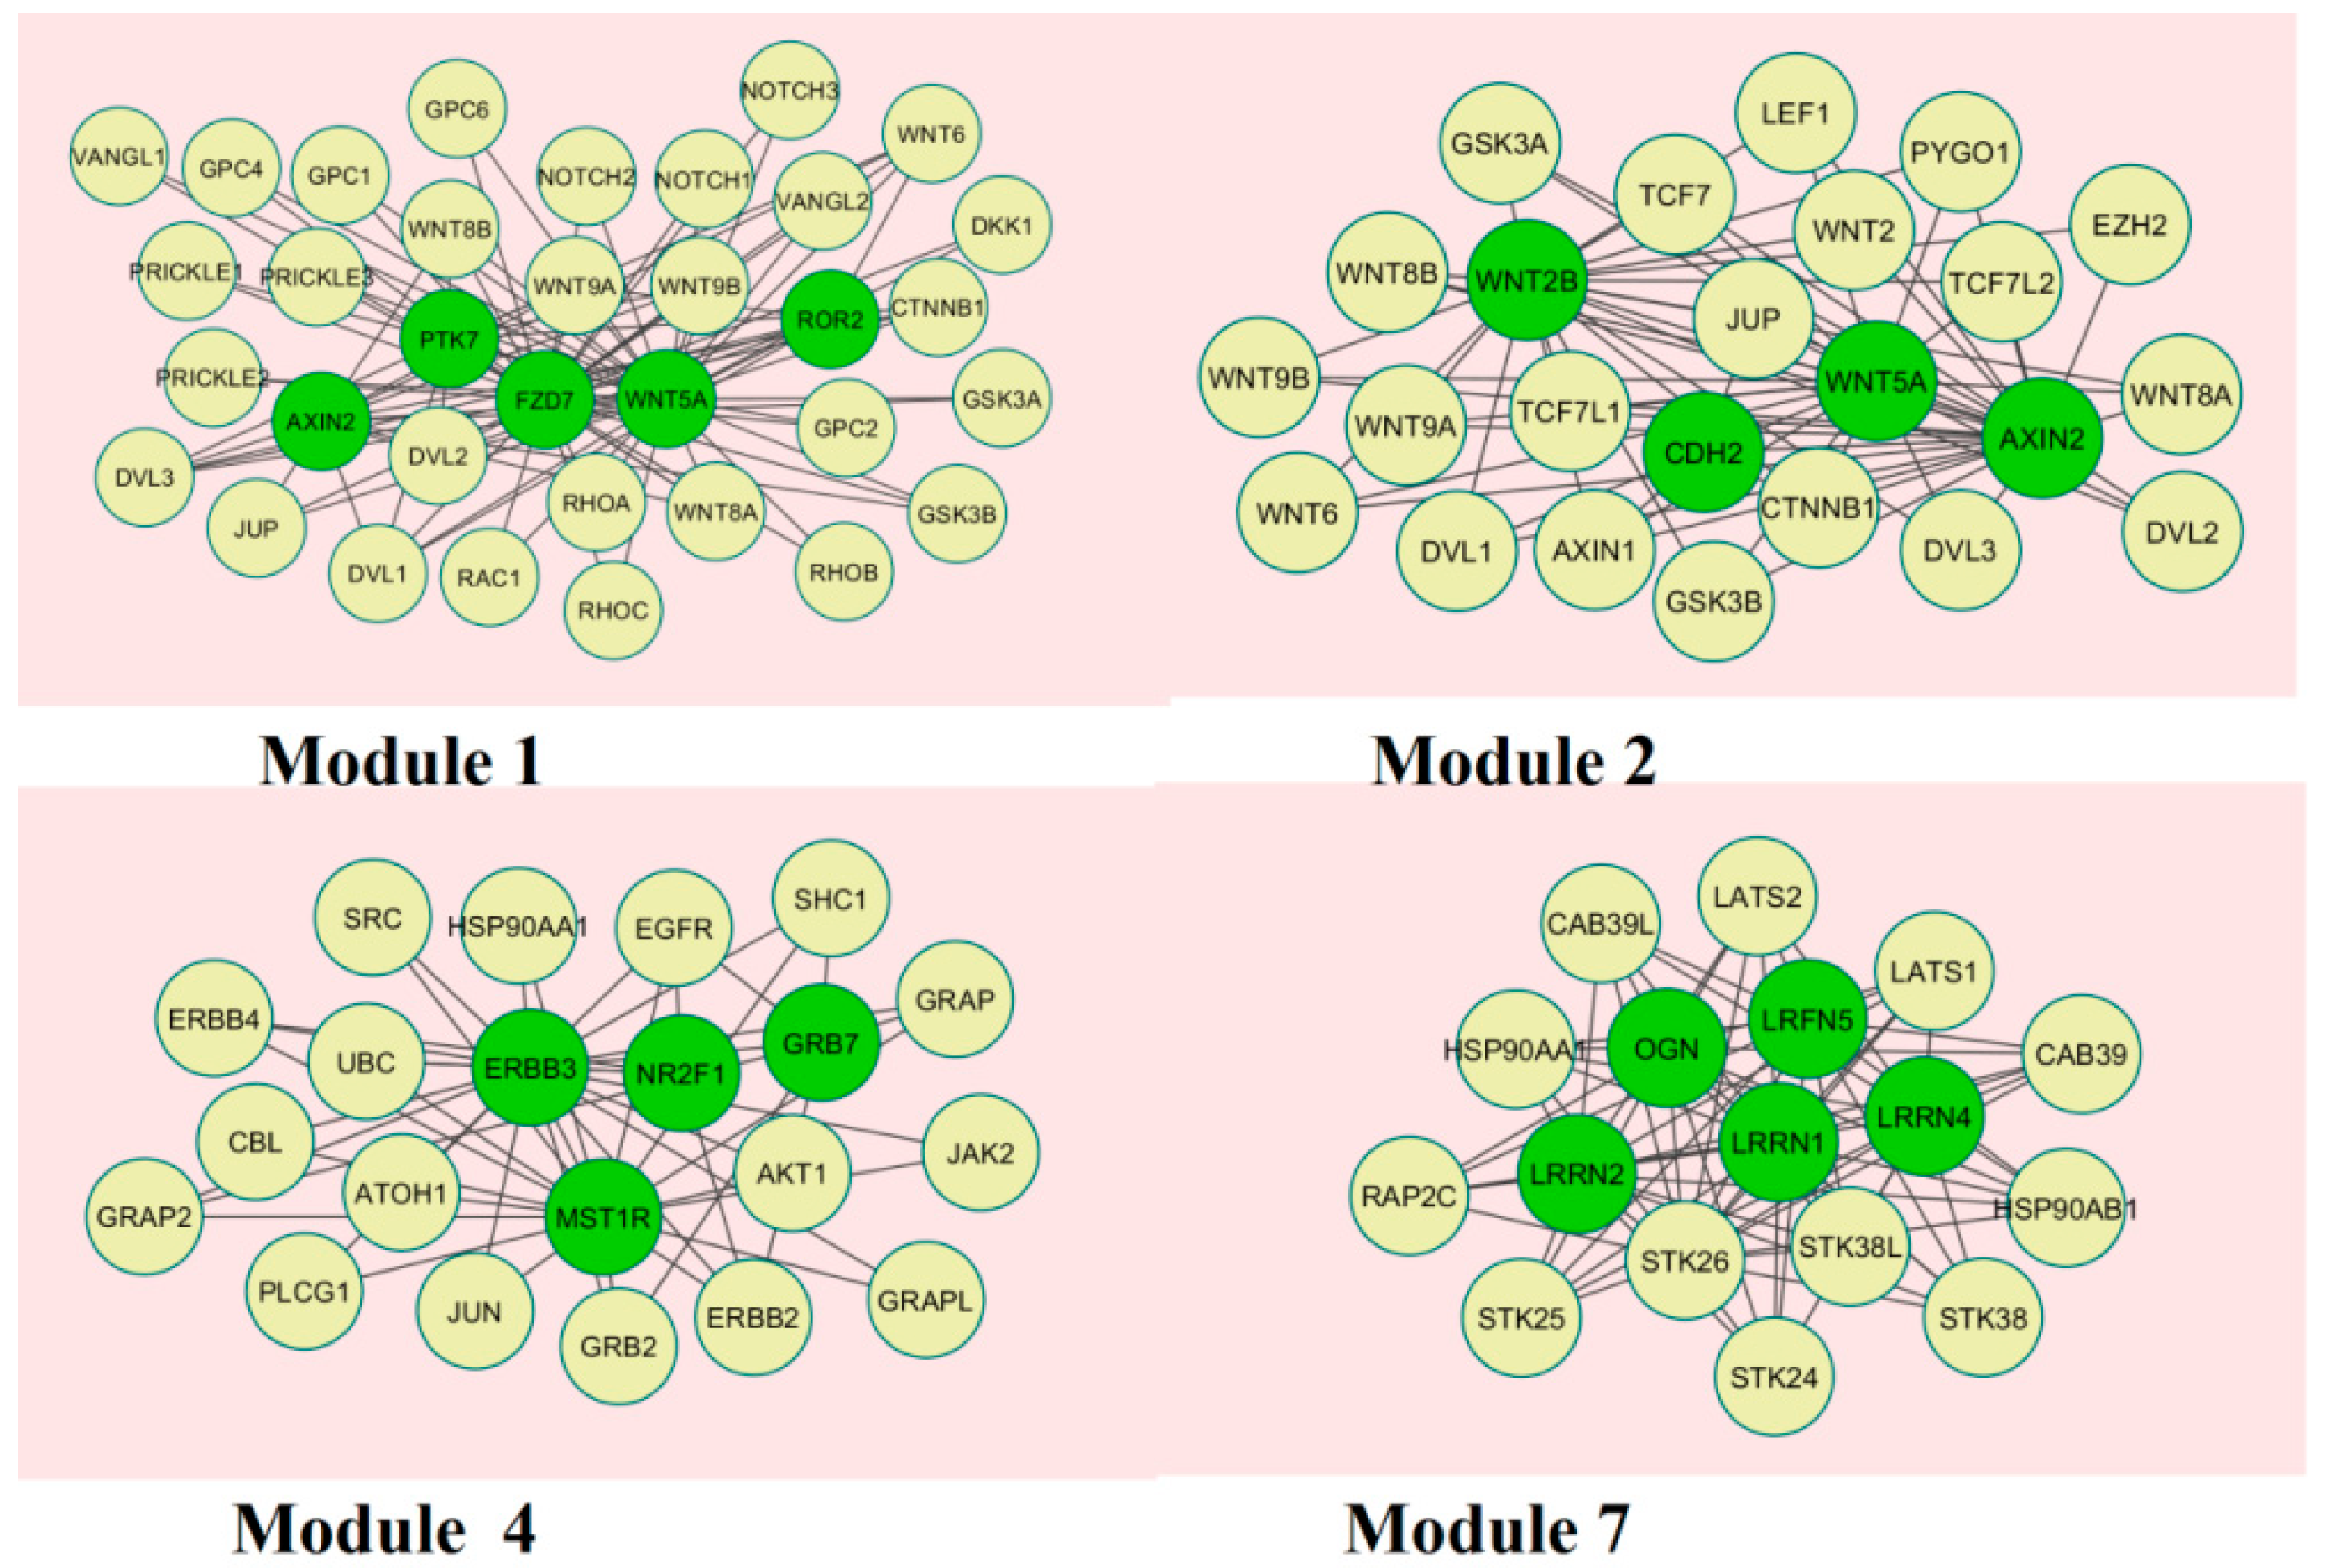
A total of 237 modules were identified in the up-regulated PPI network, among which the best were Module 1, Module 2, Module 4, and Module 7 (Figure 10).
Module 1 was composed of 34 nodes and 89 edges; the hub proteins in this module wereAXIN2 (degree = 59), PTK7 (degree = 72), FZD7 (degree = 56), WNT5A (degree = 136), and ROR2 (degree = 37). Module 2 was composed of 24 nodes and 65 edges; the hub proteins in this module wereWNT2B (degree = 109), CDH2 (degree = 64), WNT5A (degree = 136), and AXIN2 (degree = 59). Module 4 was composed of 21 nodes and 47 edges; the hub proteins in this module wereERBB3 (degree = 167), MST1R (degree = 53), NR2F1 (degree = 43), and GRB7 (degree = 25). Module 7 was composed of 17 nodes and 71 edges; the hub proteins in this module were LRRN2 (degree = 94), OGN (degree = 103), LRFN5 (degree = 93), LRRN1 (degree = 97), and LRRN4 (degree = 96).
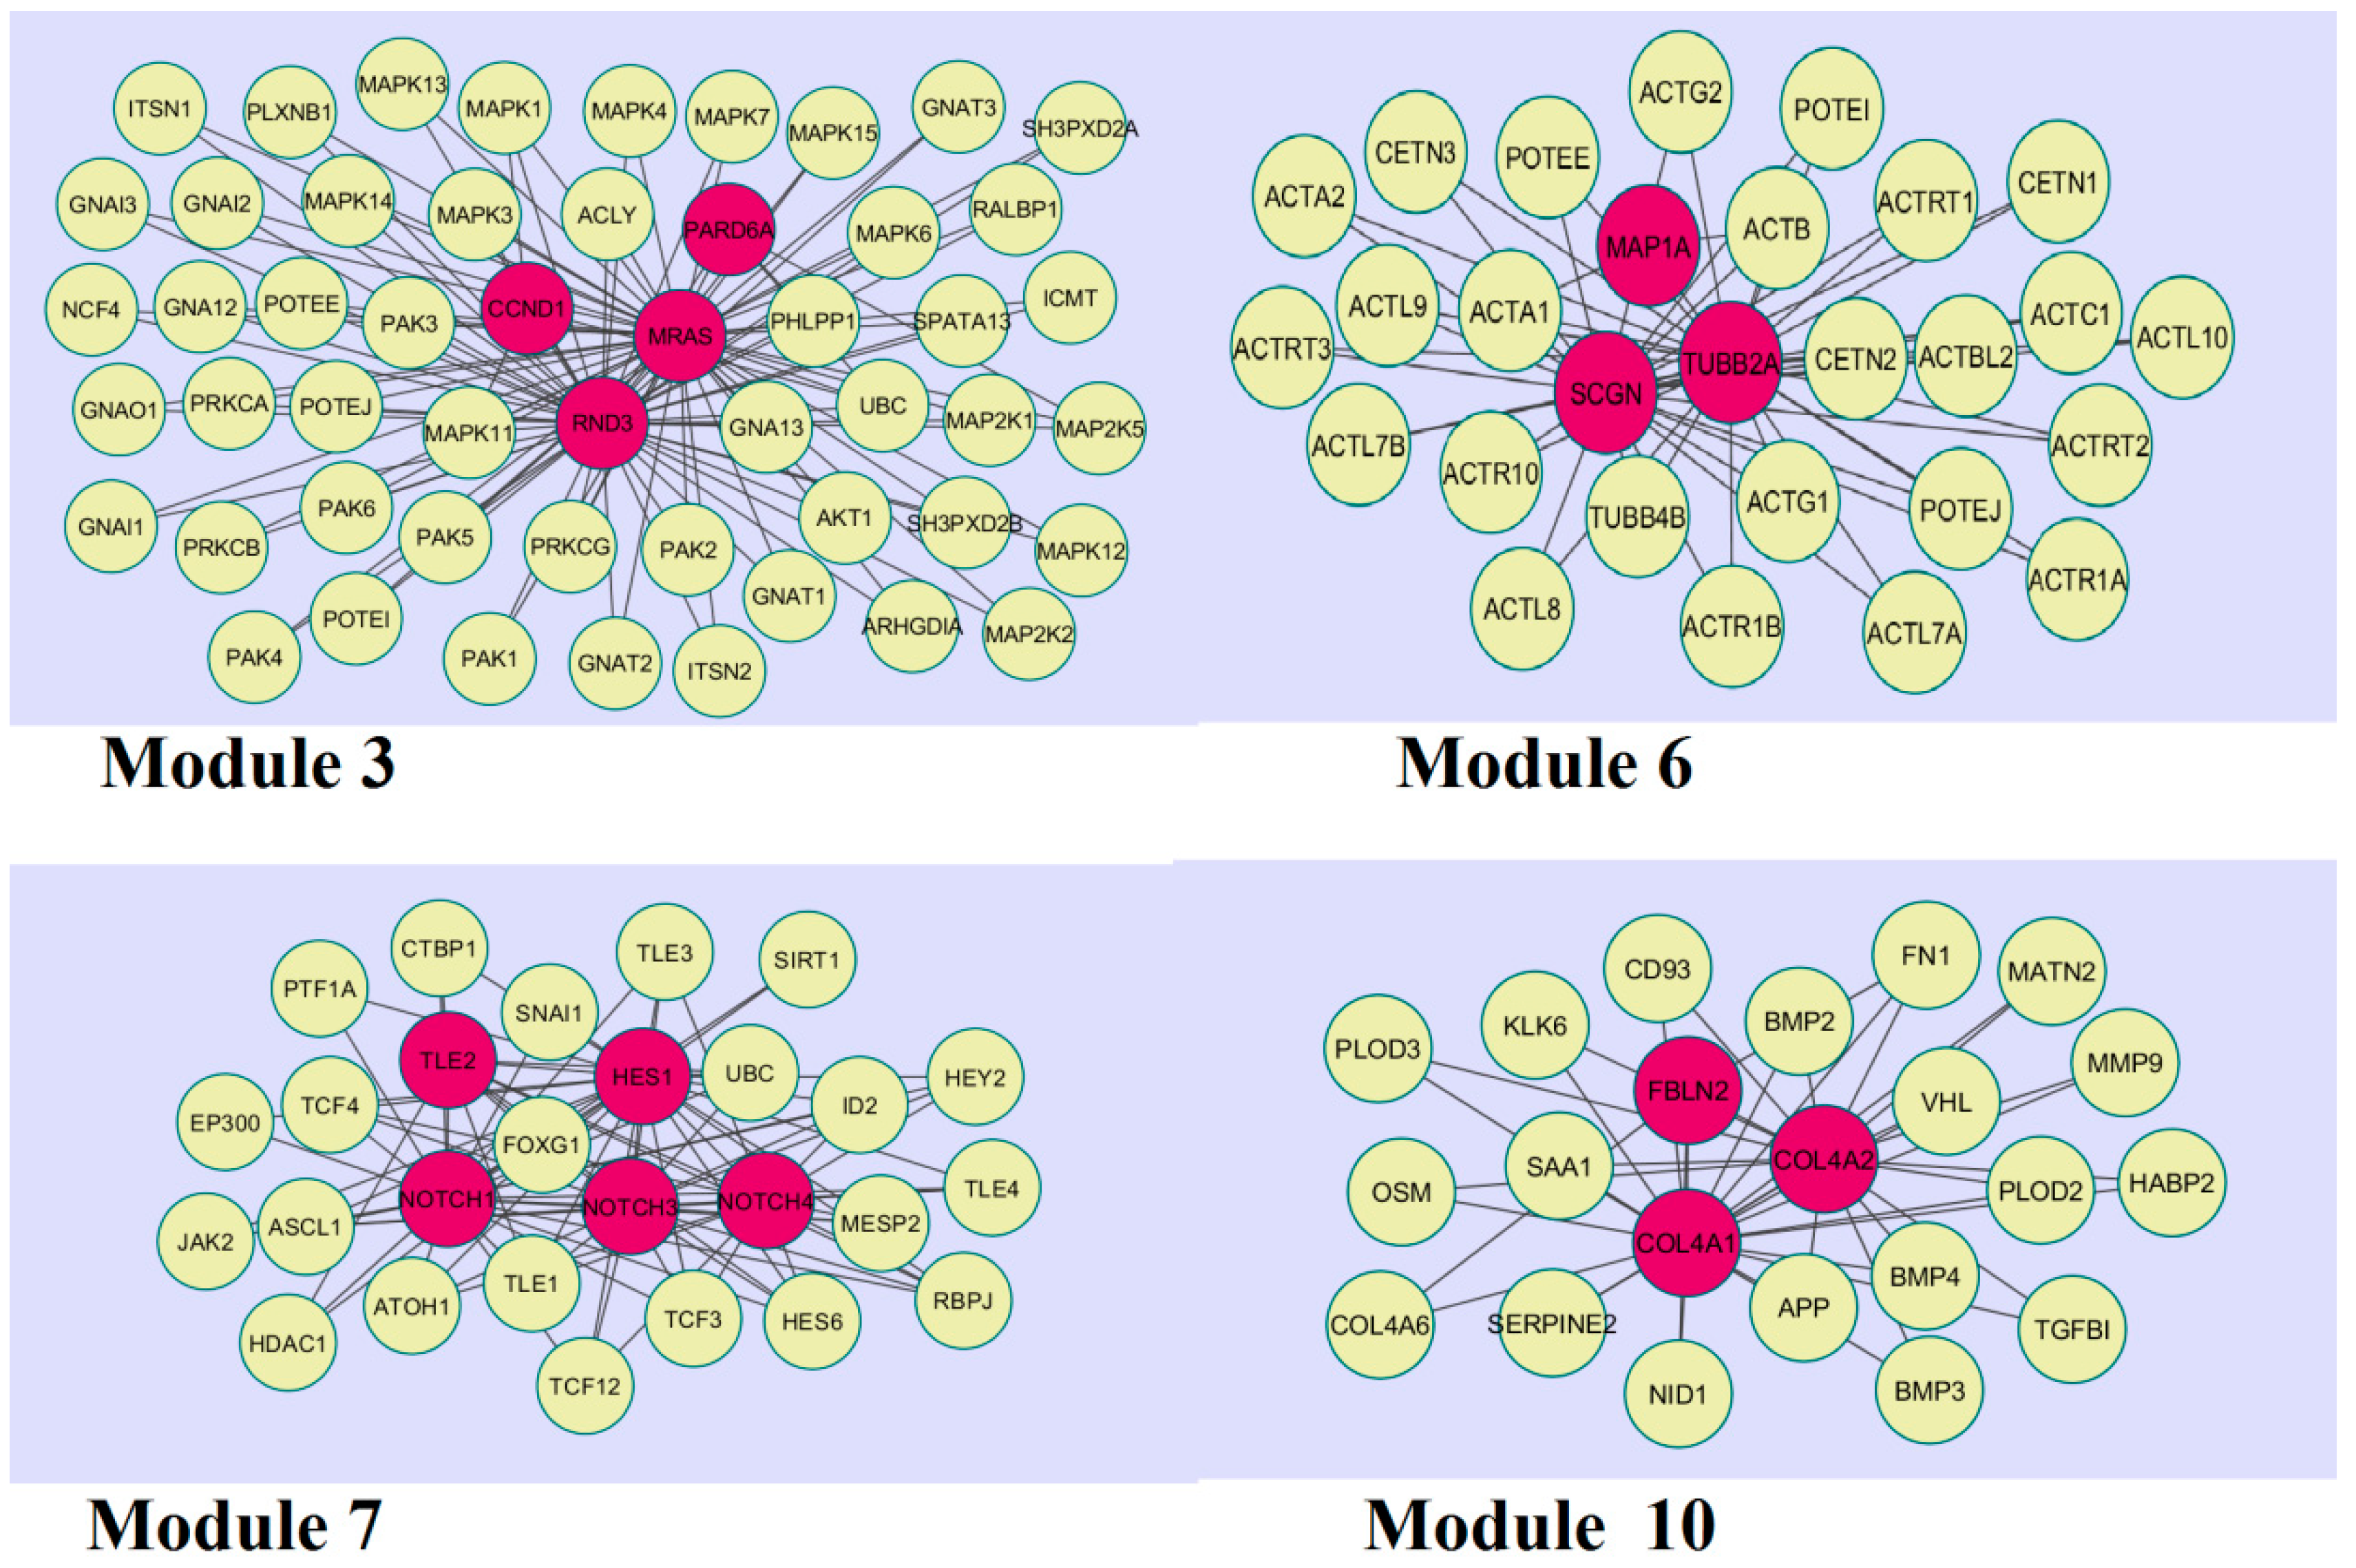
A total of 466 modules are identified in the down-regulated PPI network, among which the best were Module 3, Module 6, Module 7, and Module 10 (Figure 11).
Module 3 was composed of 52 nodes and 106 edges; the hub proteins in this module were CCND1 (degree = 148), RND3 (degree = 170), MRAS (degree = 251), and PARD6A (degree = 81). Module 6 was composed of 28 nodes and 54 edges; the hub proteins in this module wereMAP1A (degree = 29), SCGN (degree = 111), and TUBB2A (degree = 279). Module 7 was composed of 27 nodes and 87 edges; the hub proteins in this module were TLE (degree = 54), NOTCH1 (degree = 408), NOTCH3 (degree = 249), NOTCH4 (degree = 180), and HES1 (degree = 52).Finally, Module 10 was composed of 22 nodes and 42 edges; the hub proteins in this module wereFBLN2 (degree = 20), COL4A1 (degree = 34), and COL4A2 (degree = 22).
3.6. Construction of the Target Gene–MicroRNA Network
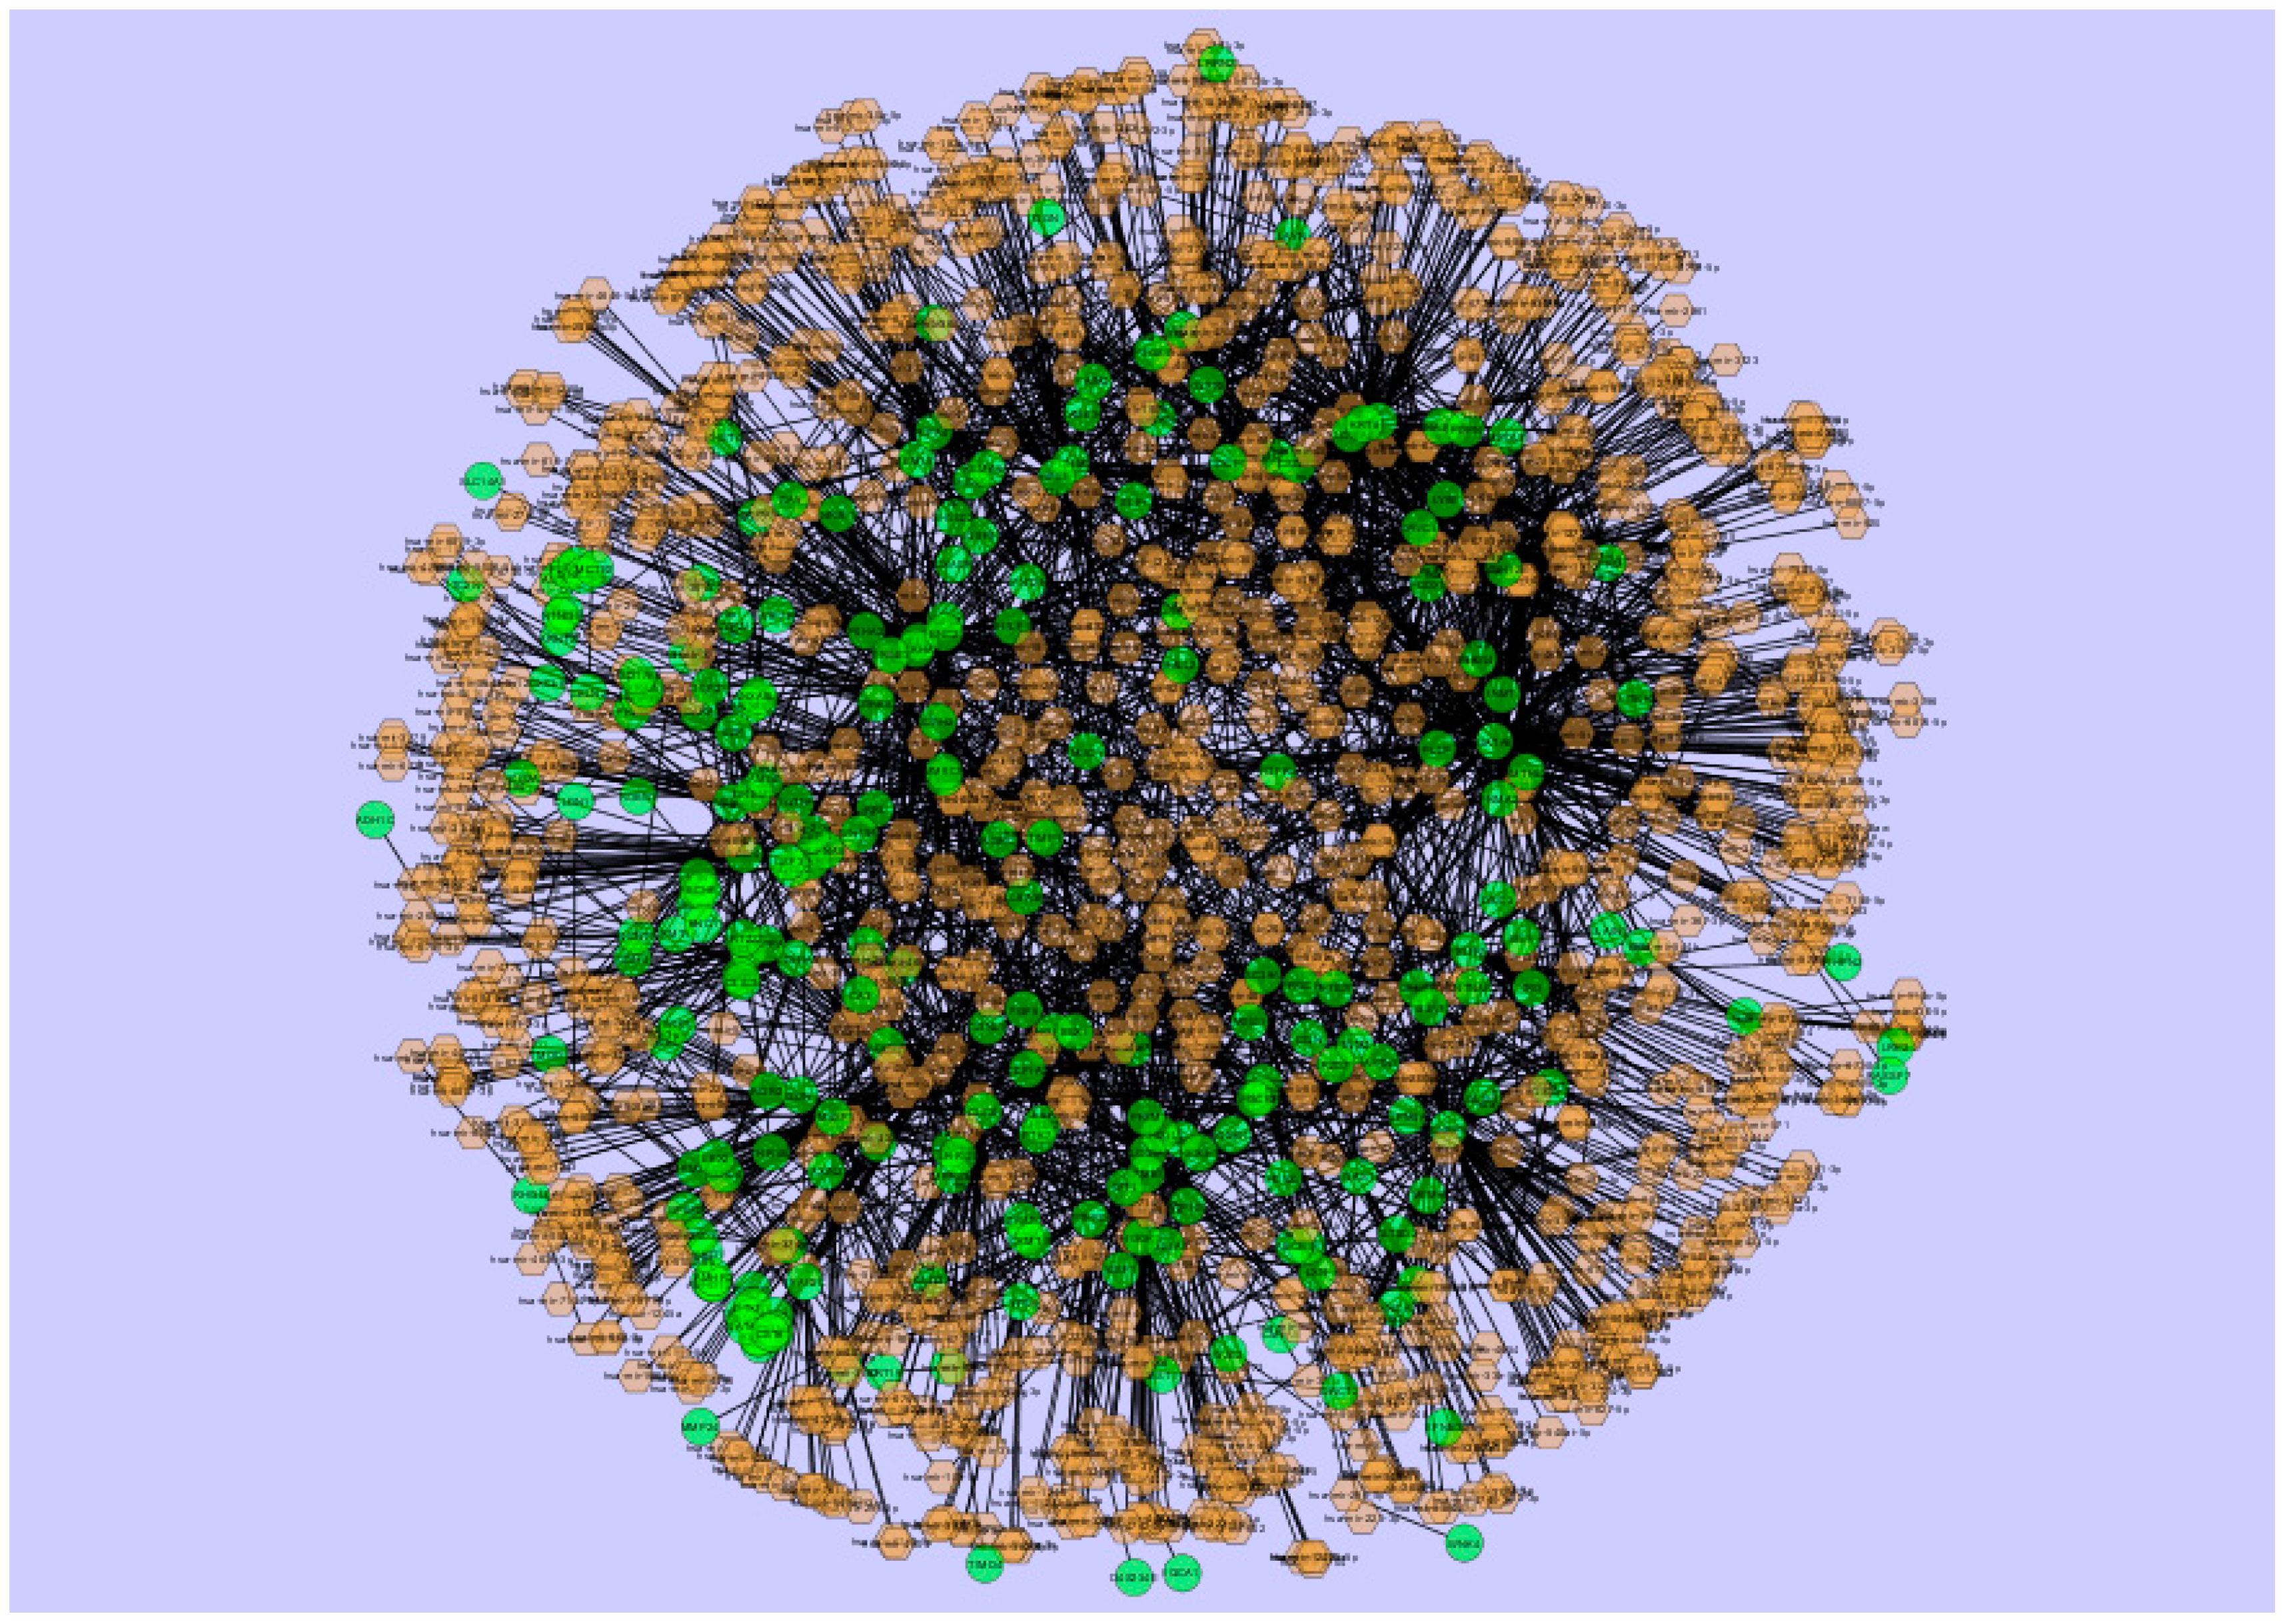
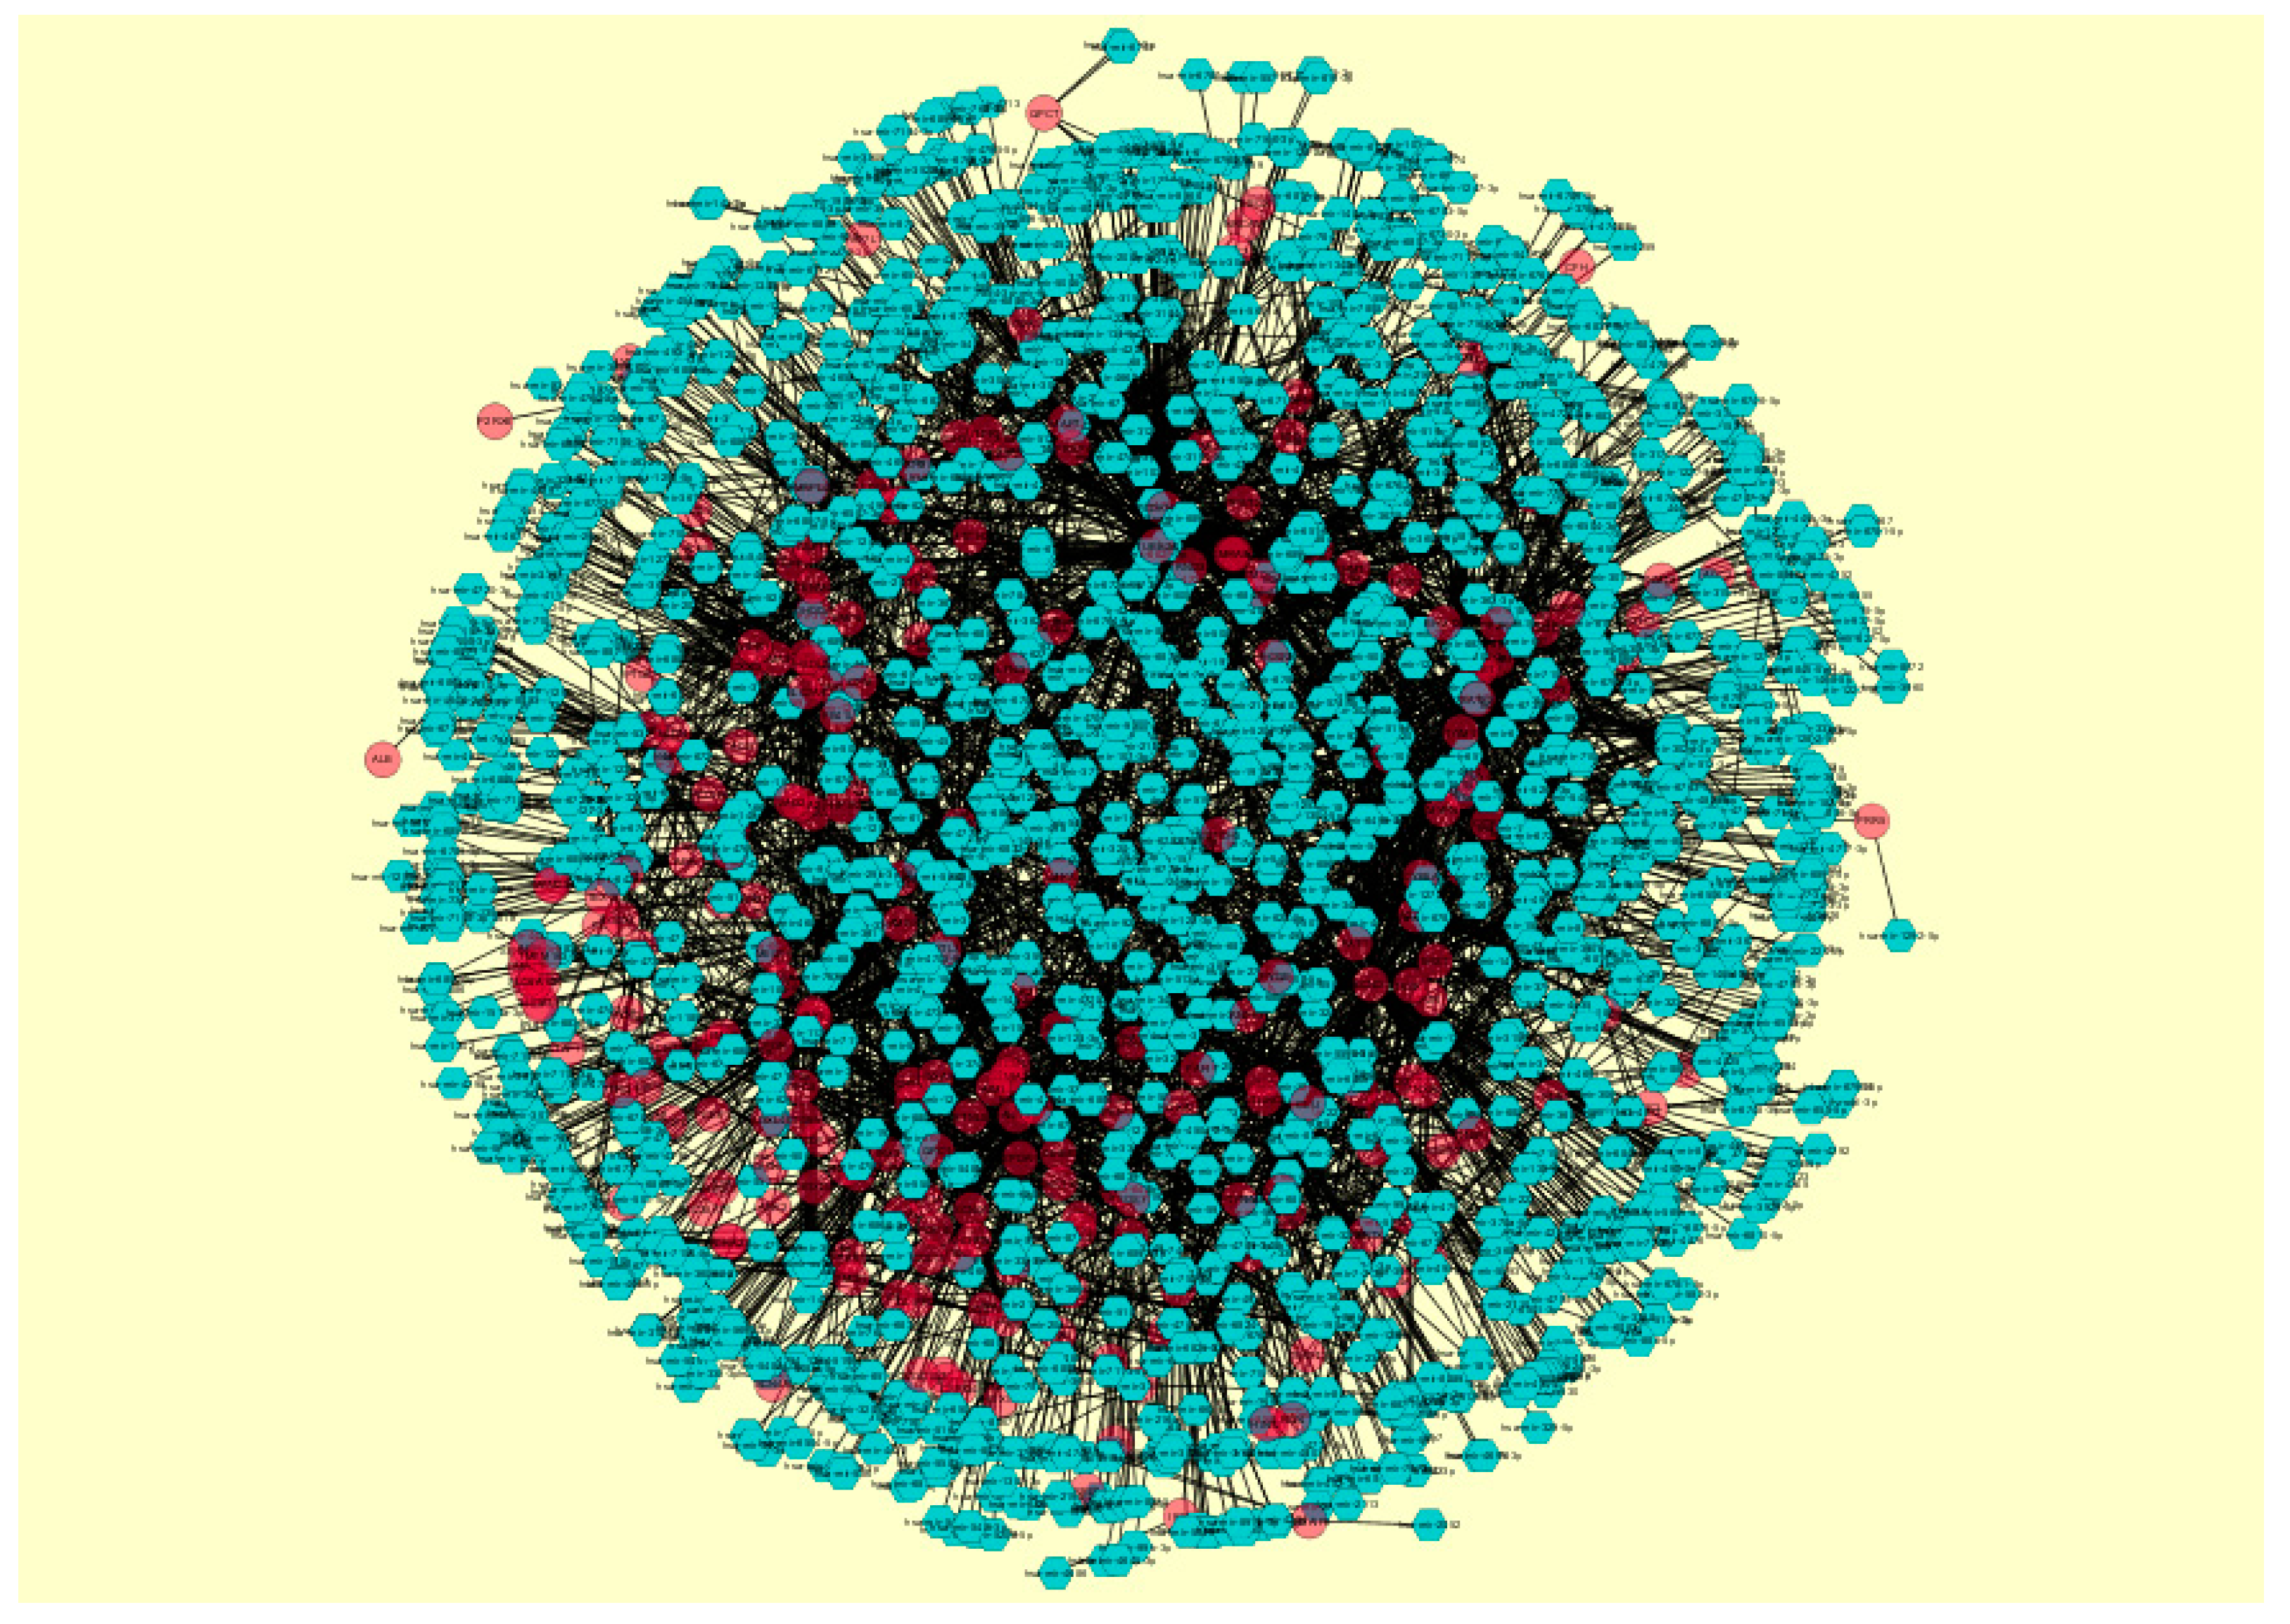
The miRNAs that may control the DEGs were diagnosed based on the up- and down-regulation expressions (Figure 12 and Figure 13).
The top five up-regulated targeted genes wereGATA6 regulated by 202 miRNAs, ENPP5 regulated by 114 miRNAs, C3 regulated by 93 miRNAs, SLC38A1 regulated by 73 miRNAs, and TM4SF1 regulated by 68 miRNAs; these are given in Table S7. The top five down-regulated targeted genes were CCND1 regulated by 197 miRNAs, TUBB2A regulated by 183 miRNAs, CDKN1A regulated by 131 miRNAs, MYPN regulated by 120 miRNAs, and AR regulated by 96 miRNAs; these are given in Table S7.
3.7. Construction of the Target Gene–Transcription FactorNetwork
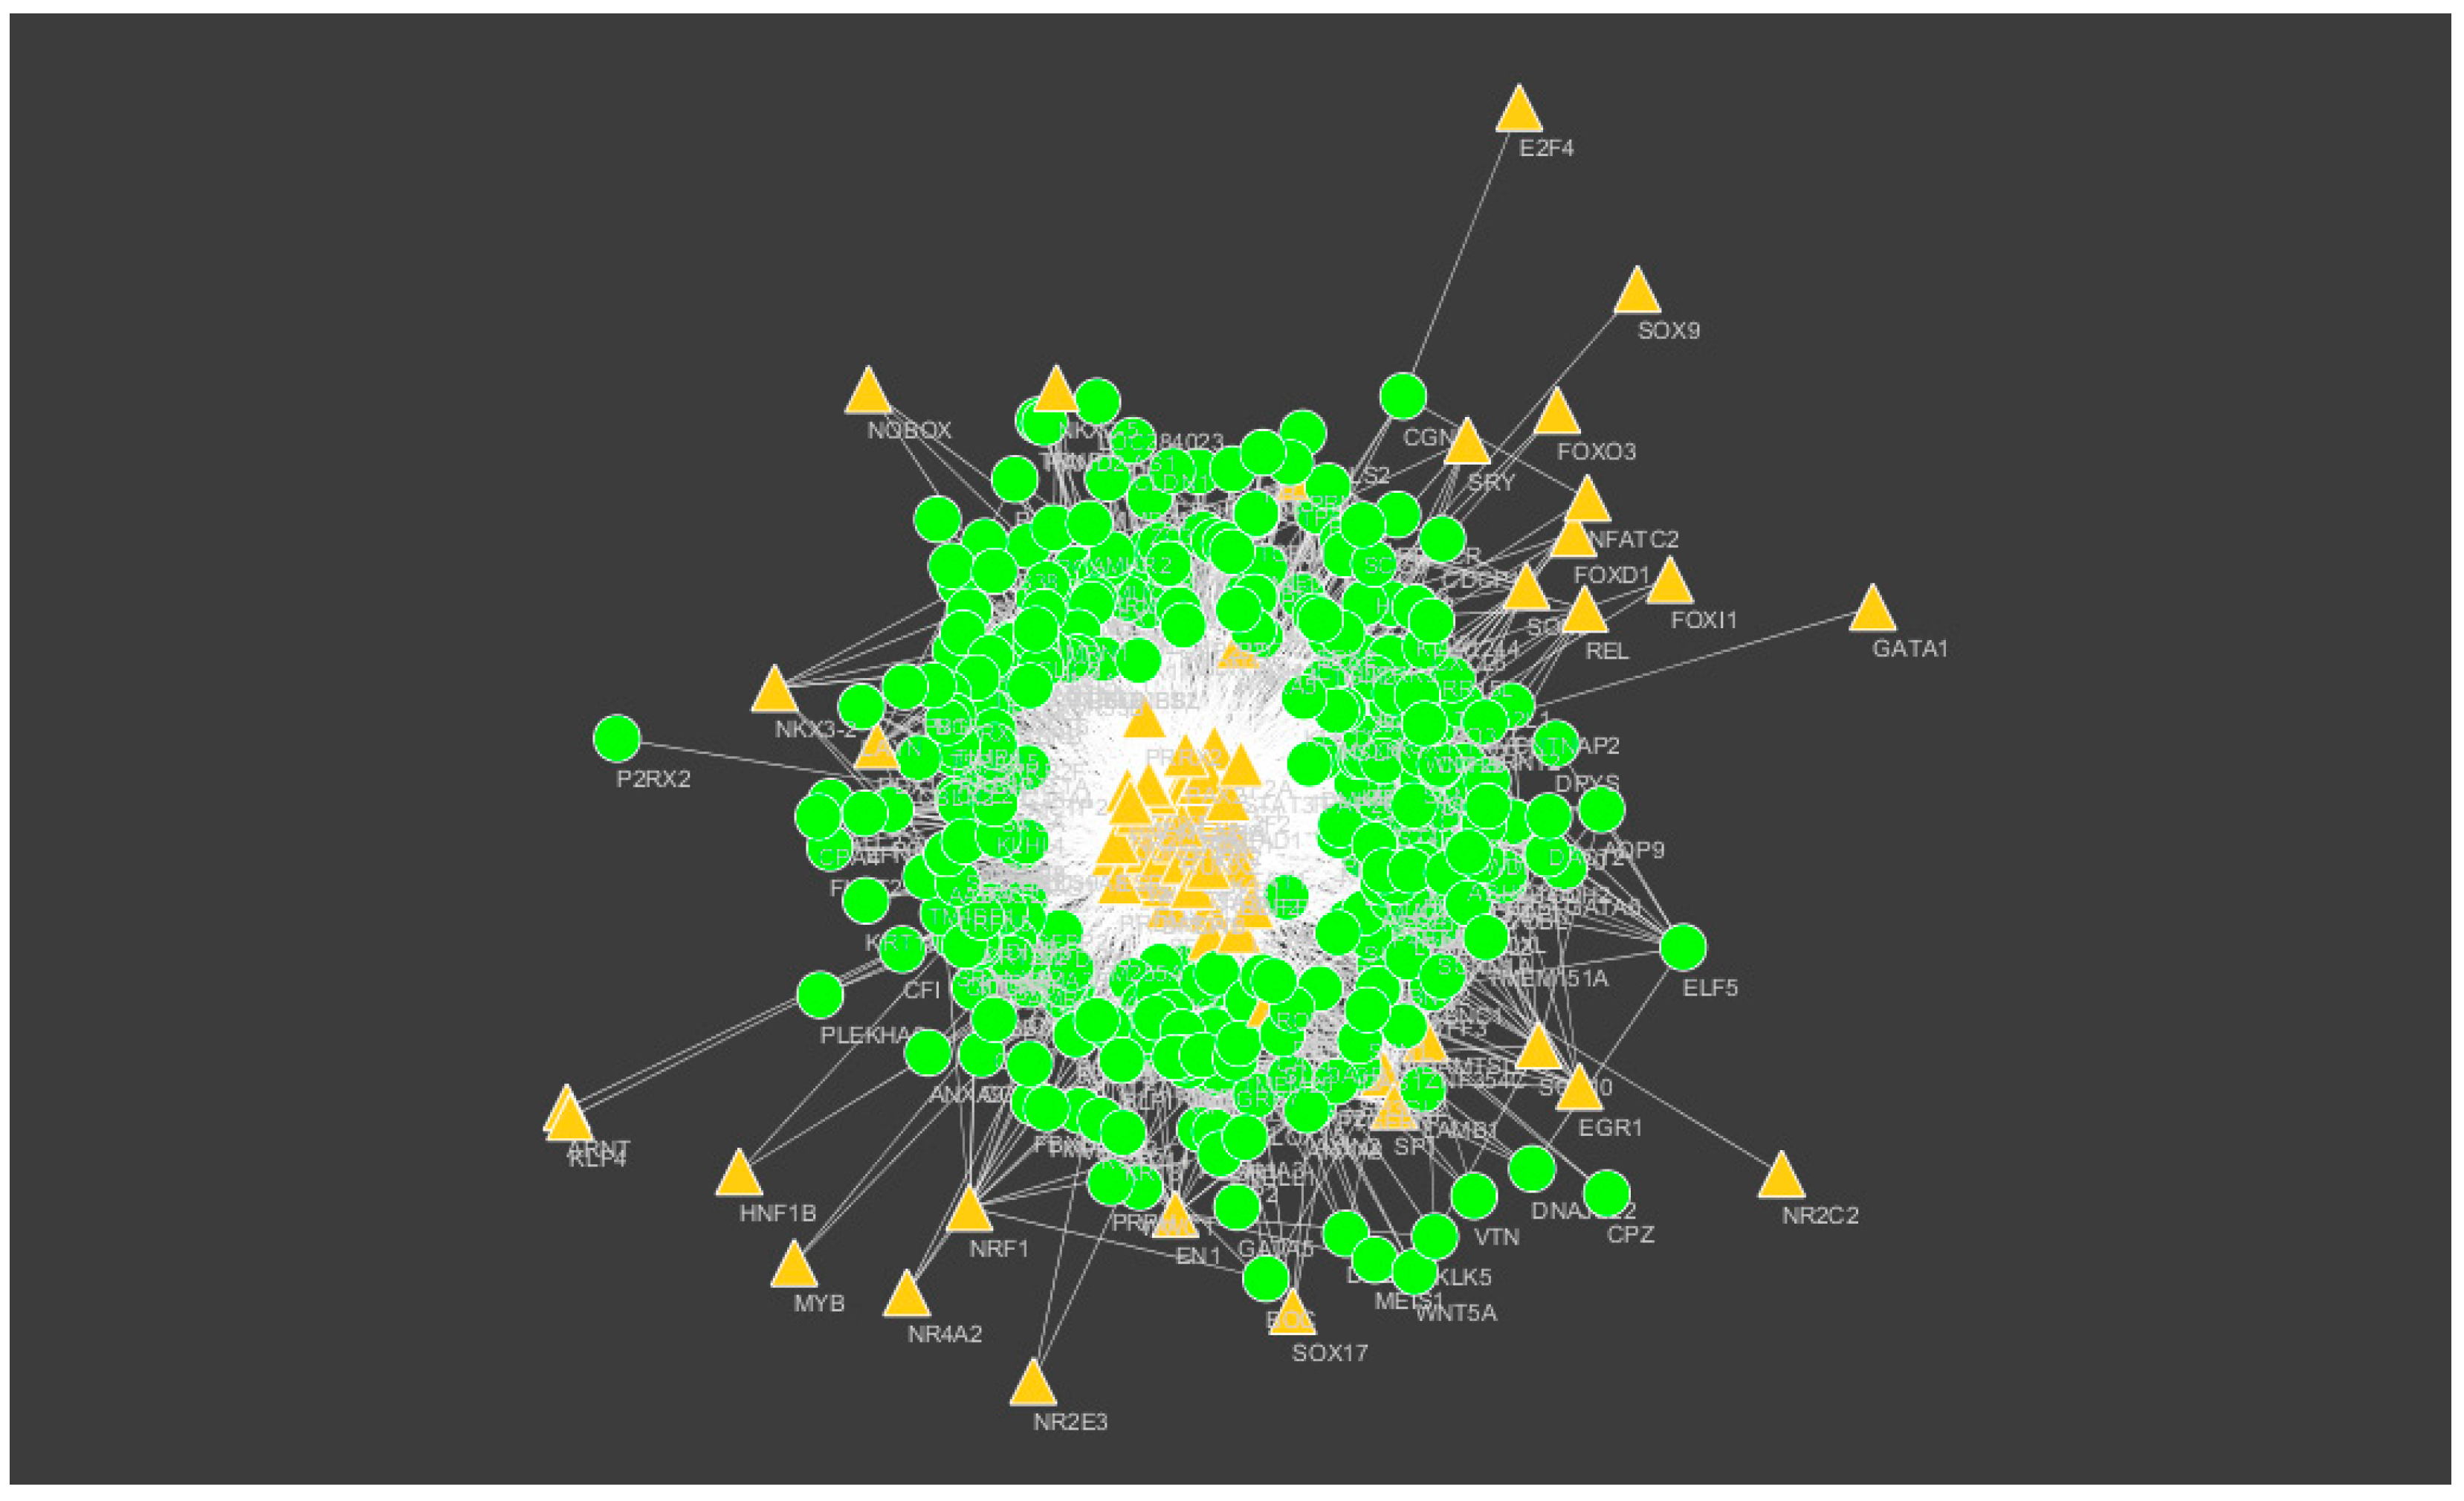
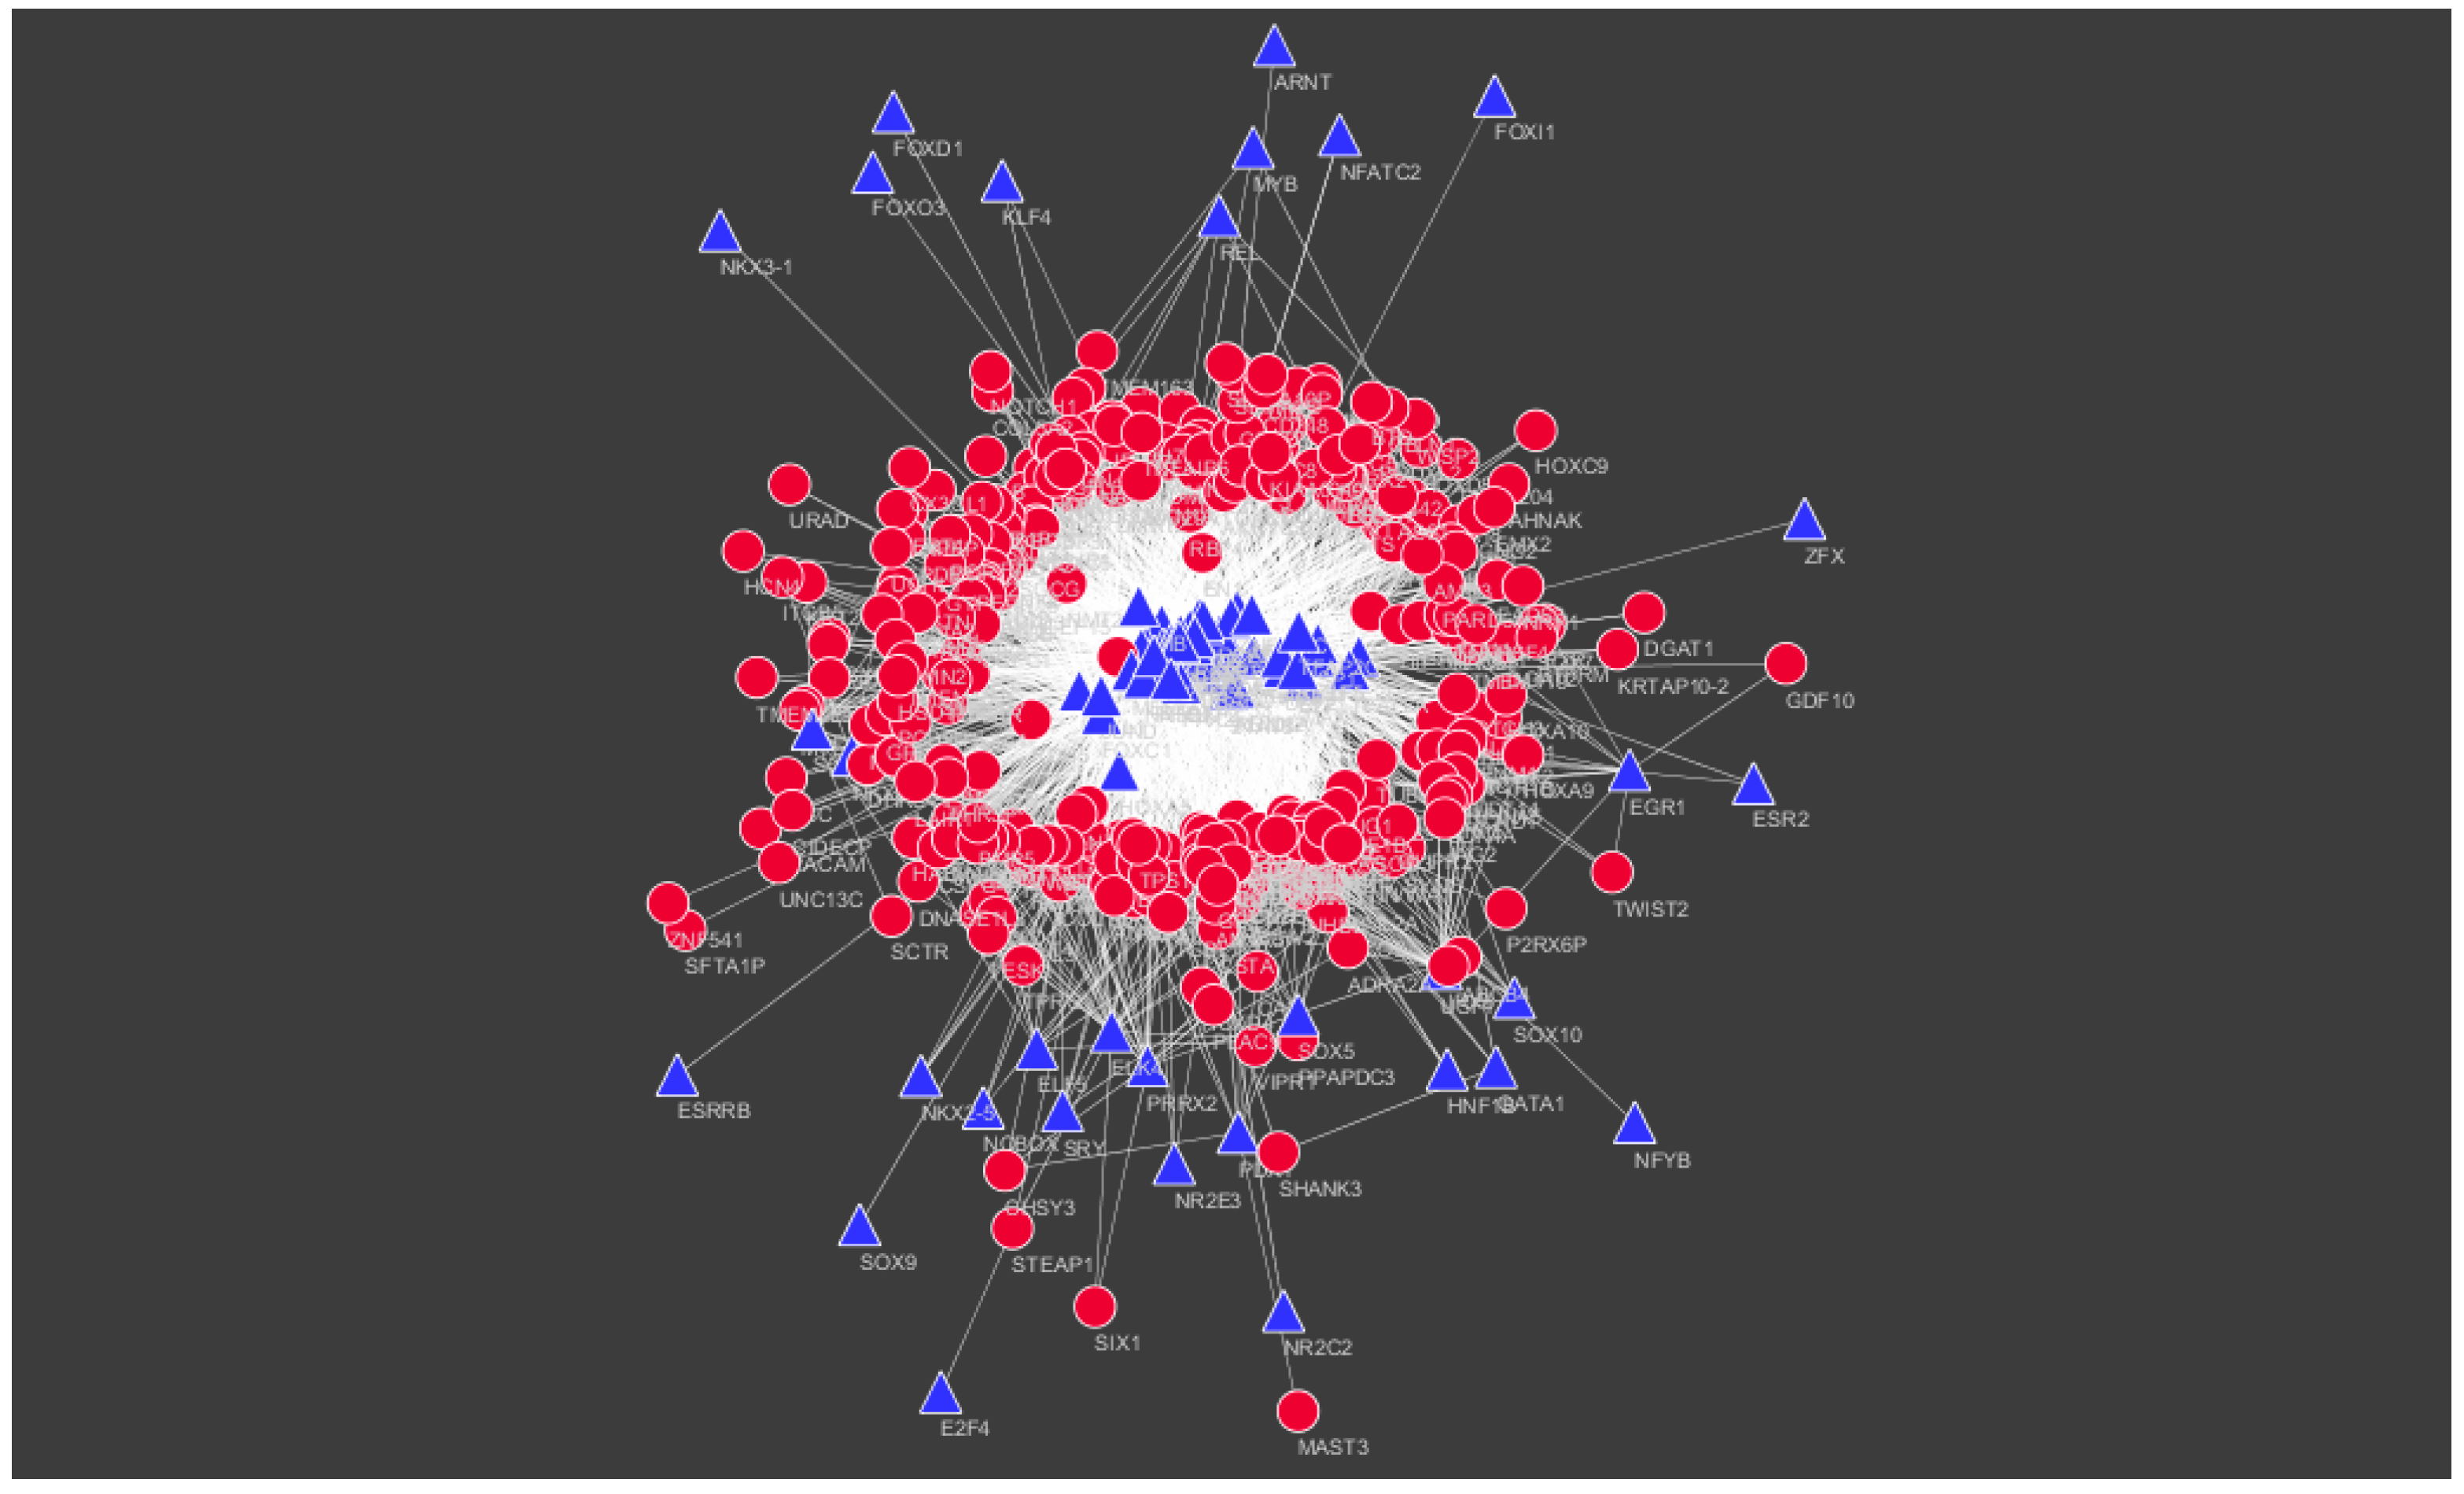
The top five up-regulated targeted genes wereTPD52L1 regulated by 182 TFs, OLFML1 regulated by 150 TFs, HPSE regulated by 90 TFs, CYP27A1 regulated by 79 TFs, and MUC1 regulated by 79 TFs; these are given in Table S8. The top five down-regulated targeted genes werePARM1 regulated by 181 TFs, ALDH4A1 regulated by 89 TFs, VENTX regulated by 79 TFs, KIAA0040 regulated by 75 TFs, and ADRA2A regulated by 74 TFs, and are given in Table S8.
4. Discussion
Obesity and NIDDM are among the highest-occurring universal health complications in the industrialized world. Obesity and NIDDM are metabolic disorders which arise due to an imbalance between caloric intake and energy expenditure and which are responsible for the development of insulin resistance [7,47]. An understanding of the molecular mechanism of insulin resistance is important. In the current study, a dataset (GSE73108) linked with insulin resistance was downloaded from the GEO database and analyzed. A total of 873 DEGs were diagnosed, including 435 up-regulated and 438 down-regulated DEGs. Tabassum et al. [48] stated that adipokine ITLN1 increases insulin-stimulated glucose uptake in adipocytes, and mutation in this gene is responsible for development of insulin resistance in NIDDM. Transcription factor protein ISL1 binds to the enhancer region of the insulin gene and activates the synthesis of insulin [49]. A single-nucleotide polymorphism (SNP) in ISL1 elevates body weight in NIDDM patents with insulin resistance [50]. Stimulation of non-canonical Wnt signaling through the overexpression of WNT5A, which is important for inflammation in adipose tissue, is associated with obesity [51] and NIDDM [52]. This gene may be responsible for the development of insulin resistance. Protease KLK7 degrades vaspinand is important for inflammation in adipose tissue, which is responsible for the development of obesity and insulin resistance [53]. Tong et al. [54] proved that SYT4 is responsible for the pathogenesis of obesity via the control of oxytocin release. This gene may be associated with insulin resistance. IRX5 is important for the advancement of obesity [55], but this gene may also link with insulin resistance. Decreased expression of TBX15 is responsible for increased fat deposition, leading to obesity [56], but this gene may also be involved in insulin resistance. HOXC9 expression is linked with loss of adipose tissue function and visceral fat distribution, resulting in obesity [57], but this gene may be important for the improvement of insulin resistance. arginine vasopressin (AVP) is associated with the development of obesity [58], but may be responsible for the improvement of insulin resistance. SNP in CCND1 is linked with obesity [59], but this polymorphic gene may diagnose insulin resistance.
In the present study, complement and coagulation cascades are the most significant KEGG pathway for up-regulated genes. A high level of C3 is associated with obesity and NIDDM, which are responsible for the development of insulin resistance [60]. A high level of vitronectin (VTN) is responsible for the advancement of NIDDM [61], but this gene may be associated with insulin resistance. Elevated expression of C7 is important for obesity progression [62], but this may also be responsible for the development of insulin resistance. protein C receptor, endothelial (EPCR) (PROCR), C1R, CFI, PLAT, C4BPB, and CFB are novel biomarkers for the development of insulin resistance. Complement activation is the most significant WikiPathways pathway for up-regulated genes. C2 is a novel biomarker for the development of insulin resistance. The classical complement pathway is the most significant BioCarta pathway for up-regulated genes, while regulation of the complement cascade is the most significant Reactome pathway for up-regulated genes. Retinoate biosynthesis I is the most significant HumanCyc pathway for up-regulated genes. A high level of ALDH1A3 is linked to β-cell dysfunction in NIDDM [63], but this gene may be responsible for the advancement of insulin resistance. ALDH1A2 and RBP1 are novel biomarkers for the development of insulin resistance. The Wnt signaling network is the most significant NCI-Nature pathway for up-regulated genes. A high level of RSPO1 is responsible for the development of obesity and insulin resistance [64]. WNT inhibitory factor 1 (WIF1), FZD7, and ROR2 are novel biomarkers for the development of insulin resistance. The cadherin signaling pathway is the most significant Panther pathway for up-regulated genes. WNT2B is a component of the Wnt signaling pathway, and this gene which activates the Wnt signaling pathway is responsible for the development of NIDDM [65] but may be identified with insulin resistance. Stimulation of p38 mitogen-activated protein kinase is important for transactivation of the ERBB3 receptor leading to IRS-1 Ser phosphorylation and insulin resistance [66]. Cadherin 3, type 1, P-cadherin (CDH3), CDH2, PCDH20, and CDH23 are novel biomarkers for the development of insulin resistance. Biosynthesis of amino acids is the most significant KEGG pathway for down-regulated genes. A low level of PC synthesis is responsible for the progression of hepatic insulin resistance and NIDDM [67].An SNP in CPS1 is linked with the development of NIDDM [68], but this polymorphic gene may be responsible for the advancement of insulin resistance. Low expression of PSAT1 contributes to the progression of insulin resistance through the inactivation of insulin signaling [69]. Serine hydroxymethyltransferase 1 (SHMT1), ALDOC, SDSL, ASS1, and IDH3A are novel biomarkers for the development of insulin resistance. The Notch signaling pathway is the most significant WikiPathways, NCI-Nature, and Panther pathway for down-regulated genes. Notch homolog 1 (NOTCH1) and NOTCH4 are components of the Notch signaling pathway, and activation of the Notch signaling pathway is important for the improvement of insulin resistance [70,71]. J 2 (JAG2), NOTCH3, CDKN1A, HES1, and MAPT are novel biomarkers for the development of insulin resistance. The Segmentation Clock is the most significant BioCarta pathway for down-regulated genes. Low expression of the WNT inhibitor DKK2 is responsible for fat accumulation in obesity [72], but this gene may be responsible for the improvement of insulin resistance. LFNG is a novel biomarker for the development of insulin resistance. Metabolism of vitamins and cofactors is the most significant Reactome pathway for down-regulated genes. Modification in CYB5A is associated with weight-regulating pathways in obesity and NIDDM [73], but this gene may diagnose insulin resistance. Aberrant expression of RBP4 is linked with development of obesity [74], NIDDM [75], and insulin resistance [76]. Abnormal expression of AKR1C3 is important for the development of obesity [77], NIDDM [78], and insulin resistance [79]. Vitamin K epoxide reductase complex, subunit 1-like 1 (VKORC1L1), BTD, GPC1, MOCOS, GPC5, AKR1C4, and NMNAT2 are novel biomarkers for the development of insulin resistance. Glycine betaine degradation is the most significant HumanCyc pathway for down-regulated genes, and BHMT is a novel biomarker for the development of insulin resistance.
In the current study, cardiac muscle cell–cardiac muscle cell adhesion is the most significant GO BP term for up-regulated genes. Desmoplakin (DSP), CXADR, and PKP2 are novel biomarkers for the development of insulin resistance. Microvillus membrane is the most significant GO CC term for up-regulated genes. Solute carrier family 9, member 3 regulator 1 (SLC9A3R1), PODXL, and PDPN are novel biomarkers for the development of insulin resistance. Protein binding involved in heterotypic cell–cell adhesion is the most significant GO MF term for up-regulated genes. Negative regulation of osteoblast differentiation is the most significant GO BP term for down-regulated genes. Loss of LRP5 together with Wnt proteins is responsible for the progression of obesity [80], NIDDM [81], and insulin resistance [82]. Low expression of TWIST2 is involved in obesity [83], but this gene may link with insulin resistance. Decreased expression of TWIST1 results in elevated secretion of TNFα, which is responsible for the progression of obesity and insulin resistance [84]. The GDF10 and TNN are novel biomarkers for the development of insulin resistance. Dendrite is the most significant GO CC term for down-regulated genes. Low expression of SCGN is responsible for the progression of insulin resistance. Loss of co-expression of both SCGN and TAU is linked with insulin resistance [85]. Loss of clusterin (CLU) is associated with NIDDM [86] and insulin resistance [87]. Corticotropin releasing hormone binding protein (CRHBP), ARHGEF15, MME, MAP1A, FGF13, and SHANK3 are novel biomarkers for the development of insulin resistance. Estradiol 17-beta-dehydrogenase activity is the most significant GO MF term for down-regulated genes. Dehydrogenase/reductase member 11 (DHRS11) and AKR1B15 are novel biomarkers for the development of insulin resistance.
In the present study, MYO5B, DLG2, ERBB3, RHOU, and SNCA were identified as hub proteins (up-regulated DEGs) in the PPI network. MYO5B, DLG2, RHOU, and SNCA are novel biomarkers for the development of insulin resistance. SGPP2, IGSF3, VSIG2, ITLN1, and DLG2 are the hub proteins (up-regulated DEGs) with the highest betweenness centrality in the PPI network. SGPP2, IGSF3, and VSIG2 are novel biomarkers for the development of insulin resistance. myosin VB (MYO5B), RHOU, ERBB3, PRKCZ, and SNCA are the hub proteins (up-regulated DEGs) with the highest stress centrality in the PPI network. Protein kinase C/zeta (PRKCZ) is a novel biomarker for the development of insulin resistance. IGSF3, SGPP2, VSIG2, ITLN1, and ERBB3 are the hub proteins (up-regulated DEGs) with the highest closeness centrality in the PPI network. Chemokine (C-C motif) ligand 21 (CCL21), CYP27A1, RPRM, BCHE, and CPB1 are the hub proteins (up-regulated DEGs) with the lowest clustering coefficient in the PPI network. A high level of BCHE is responsible for the development of insulin resistance [88]. Chemokine (C-C motif) ligand 21 (CCL21), CYP27A1, RPRM, and CPB1 are novel biomarkers for the development of insulin resistance. Notch homolog 1 (NOTCH1), AR, CPS1, TUBB2A, and MRAS were identified as hub proteins (down-regulated DEGs) in the PPI network. Low expression of AR is linked with elevated insulin resistance on a high-fat diet with decreased β-oxidation of fatty acids [89]. The TUBB2A and MRAS are novel biomarkers for the development of insulin resistance. Notch homolog 1 (NOTCH1), AR, CPS1, TUBB2A, and MRAS are the hub proteins (down-regulated DEGs) with the highest betweenness centrality in the PPI network. The NOTCH1, CPS1, AR, NOTCH3, and SOS1 are the hub proteins (down-regulated DEGs) with the highest stress centrality in the PPI network. Polymorphism in SOS1 is responsible for the progression of gestational diabetes mellitus [90], but this polymorphic gene may link with insulin resistance and NIDDM. The NOTCH1, AR, NOTCH3, CCND1, and MRAS are the hub proteins (down-regulated DEGs) withthe highest closeness centrality in the PPI network. Solute carrier family 38, member 10 (SLC38A10), SYNC, NMB, POSTN, and DMRT3 are the hub proteins (down-regulated DEGs) with the lowest clustering coefficient in the PPI network. Polymorphism in NMB is associated with obesity [91], but this gene may link with insulin resistance. An elevated level of POSTN is important for the improvement of obesity and NIDDM [92], but this gene may be involved in insulin resistance. Solute carrier family 38, member 10 (SLC38A10), SYNC, and DMRT3 are novel biomarkers for the development of insulin resistance.
Modules were extracted from the PPI network for up- and down-regulated DEGs. Axin 2 (AXIN2), PTK7, FZD7, WNT5A, ROR2, WNT2B, CDH2, ERBB3, MST1R, NR2F1, GRB7, LRRN2, OGN, LRFN5, LRRN1, and LRRN4 are the hub proteins (up-regulated DEGs with high degree) in all four modules in the PPI network. Axin 2 (AXIN2), PTK7, MST1R, NR2F1, GRB7, LRRN2, OGN, LRFN5, LRRN1, and LRRN4 are novel biomarkers for the development of insulin resistance. Cyclin D1 (CCND1), RND3, MRAS, PARD6A, MAP1A, SCGN, TUBB2A, TLE2, NOTCH1, NOTCH3, NOTCH4, HES1, FBLN2, COL4A1, and COL4A2 are the hub proteins (down-regulated DEGs with high degree) in all four modules in the PPI network. Rho family GTPase 3 (RND3), PARD6A, TLE2, FBLN2, COL4A1, and COL4A2 are novel biomarkers for the development of insulin resistance.
GATA binding protein 6 (GATA6), ENPP5, C3, SLC38A1, and TM4SF1 were identified as up-regulated target genes (high degree of connectivity with miRNAs) in the miRNA–target gene regulatory network. Alteration in GATA6 is responsible for the development of NIDDM [93], but this gene may be identified with insulin resistance. Ectonucleotide pyrophosphatase/phosphodiesterase 5 (ENPP5), SLC38A1, and TM4SF1 are novel biomarkers for the development of insulin resistance. Cyclin D1 (CCND1), TUBB2A, CDKN1A, MYPN, and AR were identified as down-regulated target genes (high degree of connectivity with miRNAs) in the miRNA–target gene regulatory network. MYPN is novel biomarker for the development of insulin resistance.
Tumor protein D52-like 1 (TPD52L1), OLFML1, HPSE, CYP27A1, and MUC1 were identified as up-regulated target genes (high degree of connectivity with TFs) in the TF–target gene regulatory network. Increased expression of HPSE is responsible for islet β cell autoimmunity in diabetes [94], but this gene may be associated with insulin resistance. Tumor protein D52-like 1 (TPD52L1), OLFML1, and MUC1 are novel biomarkers for the development of insulin resistance. Prostate androgen-regulated mucin-like protein 1 (PARM1), ALDH4A1, VENTX, KIAA0040, and ADRA2A were identified as down-regulated target genes (high degree of connectivity with TFs) in the TF–target gene regulatory network. Polymorphism in ADRA2A is responsible for the development of NIDDM [95] and obesity [96], but this gene may be identified with insulin resistance. Prostate androgen-regulated mucin-like protein 1 (PARM1), ALDH4A1, VENTX, and KIAA0040 are novel biomarkers for the development of insulin resistance.
5. Conclusions
We aimed to diagnose DEGs using bioinformatics analysis to find molecular mechanisms associated with the development of insulin resistance. The study provided four useful DEGs for future research into the molecular mechanisms of insulin resistance development. However, further functional examinations are required to analyze the actions of these DEGs in the development of insulin resistance.
Supplementary Materials
The following are available online at https://www.mdpi.com/2218-273X/9/2/37/s1. Tables file provide in supplementary materials.
Author Contributions
Conceptualization, M.P. and B.V.; Methodology, M.P.; Software, C.V.; Validation, M.P., B.V. and C.V.; Formal Analysis, C.V.; Investigation, B.V.; Resources, M.P.; Data Curation, C.V.; Writing-Original Draft Preparation, B.V.; Writing-Review & Editing, B.V.; Visualization, C.V.; Supervision, M.P.; Project Administration, M.P.”.
Funding
This research received no external funding.
Acknowledgments
We thank Ruijie Liu, Walter and Eliza Hall Institute of Medical Research, Molecular Medicine, Ritchie Lab, 1 Royal pde, Parkville, Victoria, Australia, very much, and the authors who deposited their microarray dataset, GSE73108, into the public GEO database.
Conflicts of Interest
The authors declare that they have no conflict of interest.
Ethical Approval
This article does not contain any studies with human participants or animals performed by any of the authors.
Informed Consent
No informed consent was required because this study does not contain human or animal participants.
References
- Hossain, P.; Kawar, B.; El Nahas, M. Obesity and diabetes in the developing world—A growing challenge. N. Engl. J. Med. 2007, 356, 213–215. [Google Scholar] [CrossRef] [PubMed]
- Myles, S.; Hradetzky, E.; Engelken, J.; Lao, O.; Nürnberg, P.; Trent, R.J.; Wang, X.; Kayser, M.; Stoneking, M. Identification of a candidate genetic variant for the high prevalence of type II diabetes in Polynesians. Eur. J. Hum. Genet. 2007, 15, 584–589. [Google Scholar] [CrossRef] [PubMed] [Green Version]
- Yaribeygi, H.; Farrokhi, F.R.; Butler, A.E.; Sahebkar, A. Insulin resistance: Review of the underlying molecular mechanisms. J. Cell. Physiol. 2018. [Google Scholar] [CrossRef] [PubMed]
- DeFronzo, R.A.; Ferrannini, E. Insulin resistance. A multifaceted syndrome responsible for NIDDM, obesity, hypertension, dyslipidemia, and atherosclerotic cardiovascular disease. Diabetes Care 1991, 14, 173–194. [Google Scholar] [CrossRef]
- Boden, G. Role of fatty acids in the pathogenesis of insulin resistance and NIDDM. Diabetes 1997, 46, 3–10. [Google Scholar] [CrossRef] [PubMed]
- Koves, T.R.; Ussher, J.R.; Noland, R.C.; Slentz, D.; Mosedale, M.; Ilkayeva, O.; Bain, J.; Stevens, R.; Dyck, J.R.; Newgard, C.B.; et al. Mitochondrial overload and incomplete fatty acid oxidation contribute to skeletal muscle insulin resistance. Cell Metab. 2008, 7, 45–56. [Google Scholar] [CrossRef] [PubMed]
- Hotamisligil, G.S.; Shargill, N.S.; Spiegelman, B.M. Adipose expression of tumor necrosis factor-alpha: Direct role in obesity-linked insulin resistance. Science 1993, 259, 87–91. [Google Scholar] [CrossRef] [PubMed]
- Rehman, K.; Akash, M.S.H.; Liaqat, A.; Kamal, S.; Qadir, M.I.; Rasul, A. Role of Interleukin-6 in Development of Insulin Resistance and Type 2 Diabetes Mellitus. Crit. Rev. Eukaryot. Gene Expr. 2017, 27, 229–236. [Google Scholar] [CrossRef]
- Rull, A.; Camps, J.; Alonso-Villaverde, C.; Joven, J. Insulin resistance, inflammation, and obesity: Role of monocyte chemoattractant protein-1 (or CCL2) in the regulation of metabolism. Mediat. Inflamm. 2010, 2010. [Google Scholar] [CrossRef]
- Dai, M.; Wu, L.; Tu, L.; Xu, X.; Wang, D.W. The immune-metabolic regulatory roles of epoxyeicosatrienoic acids on macrophages phenotypic plasticity in obesity-related insulin resistance. Prostaglandins Other Lipid Mediat. 2018, 139, 36–40. [Google Scholar] [CrossRef]
- Evans, J.L.; Goldfine, I.D.; Maddux, B.A.; Grodsky, G.M. Are oxidative stress-activated signaling pathways mediators of insulin resistance and beta-cell dysfunction? Diabetes 2003, 52, 1–8. [Google Scholar] [CrossRef] [PubMed]
- Moller, D.E.; Bjørbaek, C.; Vidal-Puig, A. Candidate genes for insulin resistance. Diabetes Care 1996, 19, 396–400. [Google Scholar] [CrossRef] [PubMed]
- Yang, Q.; Graham, T.E.; Mody, N.; Preitner, F.; Peroni, O.D.; Zabolotny, J.M.; Kotani, K.; Quadro, L.; Kahn, B.B. Serum retinol binding protein 4 contributes to insulin resistance in obesity and type 2 diabetes. Nature 2005, 436, 356–362. [Google Scholar] [CrossRef] [PubMed]
- Pizzuti, A.; Frittitta, L.; Argiolas, A.; Baratta, R.; Goldfine, I.D.; Bozzali, M.; Ercolino, T.; Scarlato, G.; Iacoviello, L.; Vigneri, R.; et al. A polymorphism (K121Q) of the human glycoprotein PC-1 gene coding region is strongly associated with insulin resistance. Diabetes 1999, 48, 1881–1884. [Google Scholar] [CrossRef]
- Collins, S.C.; Luan, J.; Thompson, A.J.; Daly, A.; Semple, R.K.; O’Rahilly, S.; Wareham, N.J.; Barroso, I. Adiponectin receptor genes: Mutation screening in syndromes of insulin resistance and association studies for type 2 diabetes and metabolic traits in UK populations. Diabetologia 2007, 50, 555–562. [Google Scholar] [CrossRef]
- Cederberg, A.; Grønning, L.M.; Ahrén, B.; Taskén, K.; Carlsson, P.; Enerbäck, S. FOXC2 is a winged helix gene that counteracts obesity, hypertriglyceridemia, and diet-induced insulin resistance. Cell 2001, 106, 563–573. [Google Scholar] [CrossRef]
- Cusi, K.; Maezono, K.; Osman, A.; Pendergrass, M.; Patti, M.E.; Pratipanawatr, T.; DeFronzo, R.A.; Kahn, C.R.; Mandarino, L.J. Insulin resistance differentially affects the PI 3-kinase- and MAP kinase-mediated signaling in human muscle. J. Clin. Investig. 2000, 105, 311–320. [Google Scholar] [CrossRef]
- Arkan, M.C.; Hevener, A.L.; Greten, F.R.; Maeda, S.; Li, Z.W.; Long, J.M.; Wynshaw-Boris, A.; Poli, G.; Olefsky, J.; Karin, M. IKK-beta links inflammation to obesity-induced insulin resistance. Nat. Med. 2005, 11, 191–198. [Google Scholar] [CrossRef]
- Shah, O.J.; Wang, Z.; Hunter, T. Inappropriate activation of the TSC/Rheb/mTOR/S6K cassette induces IRS1/2 depletion, insulin resistance, and cell survival deficiencies. Curr. Biol. 2004, 14, 1650–1656. [Google Scholar] [CrossRef]
- Solinas, G.; Becattini, B. JNK at the crossroad of obesity, insulin resistance, and cell stress response. Mol. Metab. 2016, 6, 174–184. [Google Scholar] [CrossRef]
- Barrett, T.; Troup, D.B.; Wilhite, S.E.; Ledoux, P.; Rudnev, D.; Evangelista, C.; Kim, I.F.; Soboleva, A.; Tomashevsky, M.; Marshall, K.A.; et al. NCBI GEO: Archive for high-throughput functional genomic data. Nucleic Acids Res. 2009, 37, D885–D890. [Google Scholar] [CrossRef] [PubMed]
- Wentworth, J.M.; Naselli, G.; Ngui, K.; Smyth, G.K.; Liu, R.; O’Brien, P.E.; Bruce, C.; Weir, J.; Cinel, M.; Meikle, P.J.; et al. GM3 ganglioside and phosphatidylethanolamine-containing lipids are adipose tissue markers of insulin resistance in obese women. Int. J. Obes. (Lond.) 2016, 40, 706–713. [Google Scholar] [CrossRef] [PubMed]
- Ritchie, M.E.; Phipson, B.; Wu, D.; Hu, Y.; Law, C.W.; Shi, W.; Smyth, G.K. limma powers differential expression analyses for RNA-sequencing and microarray studies. Nucleic Acids Res. 2015, 43, e47. [Google Scholar] [CrossRef] [PubMed]
- Kuleshov, M.V.; Jones, M.R.; Rouillard, A.D.; Fernandez, N.F.; Duan, Q.; Wang, Z.; Koplev, S.; Jenkins, S.L.; Jagodnik, K.M.; Lachmann, A.; et al. Enrichr: A comprehensive gene set enrichment analysis web server 2016 update. Nucleic Acids Res. 2016, 44, W90–W97. [Google Scholar] [CrossRef] [PubMed]
- Kanehisa, M.; Sato, Y.; Furumichi, M.; Morishima, K.; Tanabe, M. New approach for understanding genome variations in KEGG. Nucleic Acids Res. 2018. [Google Scholar] [CrossRef] [PubMed]
- Slenter, D.N.; Kutmon, M.; Hanspers, K.; Riutta, A.; Windsor, J.; Nunes, N.; Mélius, J.; Cirillo, E.; Coort, S.L.; Digles, D.; et al. WikiPathways: A multifaceted pathway database bridging metabolomics to other omics research. Nucleic Acids Res. 2018, 46, D661–D667. [Google Scholar] [CrossRef] [PubMed]
- Kao, C.F.; Jia, P.; Zhao, Z.; Kuo, P.H. Enriched pathways for major depressive disorder identified from a genome-wide association study. Int. J. Neuropsychopharmacol. 2012, 15, 1401–1411. [Google Scholar] [CrossRef] [PubMed] [Green Version]
- Romero, P.; Wagg, J.; Green, M.L.; Kaiser, D.; Krummenacker, M.; Karp, P.D. Computational prediction of human metabolic pathways from the complete human genome. Genome Biol. 2005, 6, R2. [Google Scholar] [CrossRef]
- Mi, H.; Thomas, P. PANTHER pathway: An ontology-based pathway database coupled with data analysis tools. Methods Mol. Biol. 2009, 563, 123–140. [Google Scholar] [CrossRef]
- Schaefer, C.F.; Anthony, K.; Krupa, S.; Buchoff, J.; Day, M.; Hannay, T.; Buetow, K.H. PID: The Pathway Interaction Database. Nucleic Acids Res. 2009, 37, D674–D679. [Google Scholar] [CrossRef]
- Bader, G.D.; Cary, M.P.; Sander, C. Pathguide: A pathway resource list. Nucleic Acids Res. 2006, 34, D504–D506. [Google Scholar] [CrossRef] [PubMed]
- Harris, M.A.; Clark, J.; Ireland, A.; Lomax, J.; Ashburner, M.; Foulger, R.; Eilbeck, K.; Lewis, S.; Marshall, B.; Mungall, C.; et al. The Gene Ontology (GO) database and informatics resource. Nucleic Acids Res. 2004, 32, D258–D261. [Google Scholar] [CrossRef] [PubMed]
- Szklarczyk, D.; Morris, J.H.; Cook, H.; Kuhn, M.; Wyder, S.; Simonovic, M.; Santos, A.; Doncheva, N.T.; Roth, A.; Bork, P.; et al. The STRING database in 2017: Quality-controlled protein-protein association networks, made broadly accessible. Nucleic Acids Res. 2017, 45, D362–D368. [Google Scholar] [CrossRef] [PubMed]
- Shannon, P.; Markiel, A.; Ozier, O.; Baliga, N.S.; Wang, J.T.; Ramage, D.; Amin, N.; Schwikowski, B.; Ideker, T. Cytoscape: A software environment for integrated models of biomolecular interaction networks. Genome Res. 2003, 13, 2498–2504. [Google Scholar] [CrossRef] [PubMed]
- Przulj, N. Biological network comparison using graphlet degree distribution. Bioinformatics 2007, 23, e177–e183. [Google Scholar] [CrossRef] [PubMed]
- Yoon, J.; Blumer, A.; Lee, K. An algorithm for modularity analysis of directed and weighted biological networks based on edge-betweenness centrality. Bioinformatics 2006, 22, 3106–3108. [Google Scholar] [CrossRef] [Green Version]
- Doncheva, N.T.; Assenov, Y.; Domingues, F.S.; Albrecht, M. Topological analysis and interactive visualization of biological networks and protein structures. Nat. Protoc. 2012, 7, 670–685. [Google Scholar] [CrossRef]
- Hahn, M.W.; Kern, A.D. Comparative genomics of centrality and essentiality in three eukaryotic protein-interaction networks. Mol. Biol. Evol. 2005, 22, 803–806. [Google Scholar] [CrossRef]
- Barabási, A.L.; Oltvai, Z.N. Network biology: Understanding the cell’s functional organization. Nat. Rev. Genet. 2004, 5, 101–113. [Google Scholar] [CrossRef]
- Zaki, N.; Efimov, D.; Berengueres, J. Protein complex detection using interaction reliability assessment and weighted clustering coefficient. BMC Bioinform. 2013, 14, 163. [Google Scholar] [CrossRef]
- Soifer, H.S.; Rossi, J.J.; Saetrom, P. MicroRNAs in disease and potential therapeutic applications. Mol. Ther. 2007, 15, 2070–2079. [Google Scholar] [CrossRef] [PubMed]
- Xia, J.; Gill, E.E.; Hancock, R.E. NetworkAnalyst for statistical, visual and network-based meta-analysis of gene expression data. Nat. Protoc. 2015, 10, 823–844. [Google Scholar] [CrossRef] [PubMed]
- Vlachos, I.S.; Paraskevopoulou, M.D.; Karagkouni, D.; Georgakilas, G.; Vergoulis, T.; Kanellos, I.; Anastasopoulos, I.L.; Maniou, S.; Karathanou, K.; Kalfakakou, D.; et al. DIANA-TarBase v7.0: Indexing more than half a million experimentally supported miRNA:mRNA interactions. Nucleic Acids Res. 2015, 43, D153–D159. [Google Scholar] [CrossRef] [PubMed]
- Chou, C.H.; Shrestha, S.; Yang, C.D.; Chang, N.W.; Lin, Y.L.; Liao, K.W.; Huang, W.C.; Sun, T.H.; Tu, S.J.; Lee, W.H.; et al. miRTarBase update 2018: A resource for experimentally validated microRNA-target interactions. Nucleic Acids Res. 2018, 46, D296–D302. [Google Scholar] [CrossRef] [PubMed]
- Baldwin, A.S. Series introduction: The transcription factor NF-kappaB and human disease. J. Clin. Investig. 2001, 107, 3–6. [Google Scholar] [CrossRef]
- Khan, A.; Fornes, O.; Stigliani, A.; Gheorghe, M.; Castro-Mondragon, J.A.; Lee, R.; Bessy, A.; Chèneby, J.; Kulkarni, S.R.; Tan, G.; et al. JASPAR 2018: Update of the open-access database of transcription factor binding profiles and its web framework. Nucleic Acids Res. 2018, 46, D1284. [Google Scholar] [CrossRef]
- Buettner, R.; Schölmerich, J.; Bollheimer, L.C. High-fat diets: Modeling the metabolic disorders of human obesity in rodents. Obesity 2007, 15, 798–808. [Google Scholar] [CrossRef]
- Tabassum, R.; Mahajan, A.; Dwivedi, O.P.; Chauhan, G.; Spurgeon, C.J.; Kumar, M.V.; Ghosh, S.; Madhu, S.V.; Mathur, S.K.; Chandak, G.R.; et al. Common variants of SLAMF1 and ITLN1 on 1q21 are associated with type 2 diabetes in Indian population. J. Hum. Genet. 2012, 57, 184–190. [Google Scholar] [CrossRef] [Green Version]
- Zhang, H.; Wang, W.P.; Guo, T.; Yang, J.C.; Chen, P.; Ma, K.T.; Guan, Y.F.; Zhou, C.Y. The LIM-homeodomain protein ISL1 activates insulin gene promoter directly through synergy with BETA2. J. Mol. Biol. 2009, 392, 566–577. [Google Scholar] [CrossRef]
- Riggs, A.C.; Tanizawa, Y.; Aoki, M.; Wasson, J.; Ferrer, J.; Rabin, D.U.; Vaxillaire, M.; Froguel, P.; Permutt, M.A. Characterization of the LIM/homeodomain gene islet-1 and single nucleotide screening in NIDDM. Diabetes 1995, 44, 689–694. [Google Scholar] [CrossRef]
- Catalán, V.; Gómez-Ambrosi, J.; Rodríguez, A.; Pérez-Hernández, A.I.; Gurbindo, J.; Ramírez, B.; Méndez-Giménez, L.; Rotellar, F.; Valentí, V.; Moncada, R.; et al. Activation of noncanonical Wnt signaling through WNT5A in visceral adipose tissue of obese subjects is related to inflammation. J. Clin. Endocrinol. Metab. 2014, 99, E1407–E1417. [Google Scholar] [CrossRef] [PubMed]
- Lu, Y.C.; Wang, C.P.; Hsu, C.C.; Chiu, C.A.; Yu, T.H.; Hung, W.C.; Lu, L.F.; Chung, F.M.; Tsai, I.T.; Lin, H.C.; et al. Circulating secreted frizzled-related protein 5 (Sfrp5) and wingless-type MMTV integration site family member 5a (Wnt5a) levels in patients with type 2 diabetes mellitus. Diabetes Metab. Res. Rev. 2013, 29, 551–556. [Google Scholar] [CrossRef] [PubMed]
- Zieger, K.; Weiner, J.; Kunath, A.; Gericke, M.; Krause, K.; Kern, M.; Stumvoll, M.; Klöting, N.; Blüher, M.; Heiker, J.T. Ablation of kallikrein 7 (KLK7) in adipose tissue ameliorates metabolic consequences of high fat diet-induced obesity by counteracting adipose tissue inflammation in vivo. Cell. Mol. Life Sci. 2018, 75, 727–742. [Google Scholar] [CrossRef] [PubMed]
- Tong, Q. Synaptotagmin 4: A new antiobesity target? Neuron 2011, 69, 401–403. [Google Scholar] [CrossRef] [PubMed]
- Hunt, L.E.; Noyvert, B.; Bhaw-Rosun, L.; Sesay, A.K.; Paternoster, L.; Nohr, E.A.; Davey Smith, G.; Tommerup, N.; Sørensen, T.I.; Elgar, G. Complete re-sequencing of a 2Mb topological domain encompassing the FTO/IRXB genes identifies a novel obesity-associated region upstream of IRX5. Genome Med. 2015, 7, 126. [Google Scholar] [CrossRef] [Green Version]
- Lee, K.Y.; Sharma, R.; Gase, G.; Ussar, S.; Li, Y.; Welch, L.; Berryman, D.E.; Kispert, A.; Bluher, M.; Kahn, C.R. Tbx15 Defines a Glycolytic Subpopulation and White Adipocyte Heterogeneity. Diabetes 2017, 66, 2822–2829. [Google Scholar] [CrossRef]
- Brune, J.E.; Kern, M.; Kunath, A.; Flehmig, G.; Schön, M.R.; Lohmann, T.; Dressler, M.; Dietrich, A.; Fasshauer, M.; Kovacs, P.; et al. Fat depot-specific expression of HOXC9 and HOXC10 may contribute to adverse fat distribution and related metabolic traits. Obesity 2016, 24, 51–59. [Google Scholar] [CrossRef]
- Coiro, V.; Chiodera, P. Effect of obesity and weight loss on the arginine vasopressin response to insulin-induced hypoglycaemia. Clin. Endocrinol. 1987, 27, 253–258. [Google Scholar] [CrossRef]
- Thun, G.A.; Imboden, M.; Berger, W.; Rochat, T.; Probst-Hensch, N.M. The association of a variant in the cell cycle control gene CCND1 and obesity on the development of asthma in the Swiss SAPALDIA study. J. Asthma 2013, 50, 147–154. [Google Scholar] [CrossRef]
- Hernández-Mijares, A.; Jarabo-Bueno, M.M.; López-Ruiz, A.; Solá-Izquierdo, E.; Morillas-Ariño, C.; Martínez-Triguero, M.L. Levels of C3 in patients with severe, morbid and extreme obesity: Its relationship to insulin resistance and different cardiovascular risk factors. Int. J. Obes. 2007, 31, 927–932. [Google Scholar] [CrossRef]
- Alessi, M.C.; Nicaud, V.; Scroyen, I.; Lange, C.; Saut, N.; Fumeron, F.; Marre, M.; Lantieri, O.; Fontaine-Bisson, B.; Juhan-Vague, I. Association of vitronectin and plasminogen activator inhibitor-1 levels with the risk of metabolic syndrome and type 2 diabetes mellitus. Results from the D.E.S.I.R. prospective cohort. Thromb. Haemost. 2011, 106, 416–422. [Google Scholar] [CrossRef] [PubMed]
- Gabrielsson, B.G.; Johansson, J.M.; Lönn, M.; Jernås, M.; Olbers, T.; Peltonen, M.; Larsson, I.; Lönn, L.; Sjöström, L.; Carlsson, B.; et al. High expression of complement components in omental adipose tissue in obese men. Obes. Res. 2003, 11, 699–708. [Google Scholar] [CrossRef] [PubMed]
- Kim-Muller, J.Y.; Fan, J.; Kim, Y.J.; Lee, S.A.; Ishida, E.; Blaner, W.S.; Accili, D. Aldehyde dehydrogenase 1a3 defines a subset of failing pancreatic β cells in diabetic mice. Nat. Commun. 2016, 7, 12631. [Google Scholar] [CrossRef] [PubMed] [Green Version]
- Kang, Y.E.; Kim, J.M.; Yi, H.S.; Joung, K.H.; Lee, J.H.; Kim, H.J.; Ku, B.J. Serum R-Spondin 1 Is a New Surrogate Marker for Obesity and Insulin Resistance. Diabetes Metab. J. 2018. [Google Scholar] [CrossRef] [PubMed]
- Lee, S.H.; Demeterco, C.; Geron, I.; Abrahamsson, A.; Levine, F.; Itkin-Ansari, P. Islet specific Wnt activation in human type II diabetes. Exp. Diabetes Res. 2008, 2008, 728763. [Google Scholar] [CrossRef]
- Hemi, R.; Yochananov, Y.; Barhod, E.; Kasher-Meron, M.; Karasik, A.; Tirosh, A.; Kanety, H. p38 mitogen-activated protein kinase-dependent transactivation of ErbB receptor family: A novel common mechanism for stress-induced IRS-1 serine phosphorylation and insulin resistance. Diabetes 2011, 60, 1134–1145. [Google Scholar] [CrossRef] [PubMed]
- Kumashiro, N.; Beddow, S.A.; Vatner, D.F.; Majumdar, S.K.; Cantley, J.L.; Guebre-Egziabher, F.; Fat, I.; Guigni, B.; Jurczak, M.J.; Birkenfeld, A.L.; et al. Targeting pyruvate carboxylase reduces gluconeogenesis and adiposity and improves insulin resistance. Diabetes 2013, 62, 2183–2194. [Google Scholar] [CrossRef]
- Griffin, J.W.D.; Liu, Y.; Bradshaw, P.C.; Wang, K. In Silico Preliminary Association of Ammonia Metabolism Genes GLS, CPS1, and GLUL with Risk of Alzheimer’s Disease, Major Depressive Disorder, and Type 2 Diabetes. J. Mol. Neurosci. 2018, 64, 385–396. [Google Scholar] [CrossRef]
- Yu, J.; Xiao, F.; Guo, Y.; Deng, J.; Liu, B.; Zhang, Q.; Li, K.; Wang, C.; Chen, S.; Guo, F. Hepatic Phosphoserine Aminotransferase 1 Regulates Insulin Sensitivity in Mice via Tribbles Homolog 3. Diabetes 2015, 64, 1591–1602. [Google Scholar] [CrossRef]
- Li, H.; Lee, J.; He, C.; Zou, M.H.; Xie, Z. Suppression of the mTORC1/STAT3/Notch1 pathway by activated AMPK prevents hepatic insulin resistance induced by excess amino acids. Am. J. Physiol. Endocrinol. Metab. 2014, 306, E197–E209. [Google Scholar] [CrossRef] [Green Version]
- Pajvani, U.B.; Shawber, C.J.; Samuel, V.T.; Birkenfeld, A.L.; Shulman, G.I.; Kitajewski, J.; Accili, D. Inhibition of Notch signaling ameliorates insulin resistance in a FoxO1-dependent manner. Nat. Med. 2011, 17, 961–967. [Google Scholar] [CrossRef] [PubMed] [Green Version]
- Strakovsky, R.S.; Pan, Y.X. A decrease in DKK1, a WNT inhibitor, contributes to placental lipid accumulation in an obesity-prone rat model. Biol. Reprod. 2012, 86, 81. [Google Scholar] [CrossRef] [PubMed]
- Huang, K.; Nair, A.K.; Muller, Y.L.; Piaggi, P.; Bian, L.; Del Rosario, M.; Knowler, W.C.; Kobes, S.; Hanson, R.L.; Bogardus, C.; et al. Whole exome sequencing identifies variation in CYB5A and RNF10 associated with adiposity and type 2 diabetes. Obesity 2014, 22, 984–988. [Google Scholar] [CrossRef] [PubMed]
- Bajzová, M.; Kováciková, M.; Vítková, M.; Klimcáková, E.; Polák, J.; Kovácová, Z.; Viguerie, N.; Vedral, T.; Mikulásek, L.; Srámková, P.; et al. Retinol-binding protein 4 expression in visceral and subcutaneous fat in human obesity. Physiol. Res. 2008, 57, 927–934. [Google Scholar] [PubMed]
- Cho, Y.M.; Youn, B.S.; Lee, H.; Lee, N.; Min, S.S.; Kwak, S.H.; Lee, H.K.; Park, K.S. Plasma retinol-binding protein-4 concentrations are elevated in human subjects with impaired glucose tolerance and type 2 diabetes. Diabetes Care 2006, 29, 2457–2461. [Google Scholar] [CrossRef]
- Kovacs, P.; Geyer, M.; Berndt, J.; Klöting, N.; Graham, T.E.; Böttcher, Y.; Enigk, B.; Tönjes, A.; Schleinitz, D.; Schön, M.R.; et al. Effects of genetic variation in the human retinol binding protein-4 gene (RBP4) on insulin resistance and fat depot-specific mRNA expression. Diabetes 2007, 56, 3095–3100. [Google Scholar] [CrossRef] [PubMed]
- Svensson, P.A.; Gabrielsson, B.G.; Jernås, M.; Gummesson, A.; Sjöholm, K. Regulation of human aldoketoreductase 1C3 (AKR1C3) gene expression in the adipose tissue. Cell. Mol. Biol. Lett. 2008, 13, 599–613. [Google Scholar] [CrossRef] [Green Version]
- Cho, M.K. Decreased Expression of Type 5 17β-Hydroxysteroid Dehydrogenase (AKR1C3) Protein Identified in Human Diabetic Skin Tissue. Ann. Dermatol. 2013, 25, 423–427. [Google Scholar] [CrossRef]
- O’Reilly, M.; Gathercole, L.; Capper, F.; Arlt, W.; Tomlinson, J. Effect of insulin on AKR1C3 expression in female adipose tissue: In-vivo and in-vitro study of adipose androgen generation in polycystic ovary syndrome. Lancet 2015, 385, S0140–S6736. [Google Scholar] [CrossRef]
- Fujino, T.; Asaba, H.; Kang, M.J.; Ikeda, Y.; Sone, H.; Takada, S.; Kim, D.H.; Ioka, R.X.; Ono, M.; Tomoyori, H.; et al. Low-density lipoprotein receptor-related protein 5 (LRP5) is essential for normal cholesterol metabolism and glucose-induced insulin secretion. Proc. Natl. Acad. Sci. USA 2003, 100, 229–234. [Google Scholar] [CrossRef]
- Zenibayashi, M.; Miyake, K.; Horikawa, Y.; Hirota, Y.; Teranishi, T.; Kouyama, K.; Sakaguchi, K.; Takeda, J.; Kasuga, M. Lack of association of LRP5 and LRP6 polymorphisms with type 2 diabetes mellitus in the Japanese population. Endocr. J. 2008, 55, 699–707. [Google Scholar] [CrossRef] [PubMed]
- Guo, Y.F.; Xiong, D.H.; Shen, H.; Zhao, L.J.; Xiao, P.; Guo, Y.; Wang, W.; Yang, T.L.; Recker, R.R.; Deng, H.W. Polymorphisms of the low-density lipoprotein receptor-related protein 5 (LRP5) gene are associated with obesity phenotypes in a large family-based association study. J. Med. Genet. 2006, 43, 798–803. [Google Scholar] [CrossRef] [PubMed]
- Yang, X.F.; Ma, G.; Feng, N.H.; Yu, D.; Wu, Y.; Li, C. Twist2 and CD24 expression alters renal microenvironment in obesity associated kidney cancer. Eur. Rev. Med. Pharmacol. Sci. 2018, 22, 358–364. [Google Scholar] [CrossRef] [PubMed]
- Pettersson, A.T.; Mejhert, N.; Jernås, M.; Carlsson, L.M.; Dahlman, I.; Laurencikiene, J.; Arner, P.; Rydén, M. Twist1 in human white adipose tissue and obesity. J. Clin. Endocrinol. Metab. 2011, 96, 133–141. [Google Scholar] [CrossRef] [PubMed]
- Maj, M.; Gartner, W.; Ilhan, A.; Neziri, D.; Attems, J.; Wagner, L. Expression of TAU in insulin-secreting cells and its interaction with the calcium-binding protein secretagogin. J. Endocrinol. 2010, 205, 25–36. [Google Scholar] [CrossRef] [Green Version]
- Daimon, M.; Oizumi, T.; Karasawa, S.; Kaino, W.; Takase, K.; Tada, K.; Jimbu, Y.; Wada, K.; Kameda, W.; Susa, S.; et al. Association of the clusterin gene polymorphisms with type 2 diabetes mellitus. Metabolism 2011, 60, 815–822. [Google Scholar] [CrossRef] [PubMed]
- Kwon, M.J.; Ju, T.J.; Heo, J.Y.; Kim, Y.W.; Kim, J.Y.; Won, K.C.; Kim, J.R.; Bae, Y.K.; Park, I.S.; Min, B.H.; et al. Deficiency of clusterin exacerbates high-fat diet-induced insulin resistance in male mice. Endocrinology 2014, 155, 2089–2101. [Google Scholar] [CrossRef]
- Iwasaki, T.; Yoneda, M.; Nakajima, A.; Terauchi, Y. Serum butyrylcholinesterase is strongly associated with adiposity, the serum lipid profile and insulin resistance. Intern. Med. 2007, 46, 1633–1639. [Google Scholar] [CrossRef]
- Lin, H.Y.; Yu, I.C.; Wang, R.S.; Chen, Y.T.; Liu, N.C.; Altuwaijri, S.; Hsu, C.L.; Ma, W.L.; Jokinen, J.; Sparks, J.D.; et al. Increased hepatic steatosis and insulin resistance in mice lacking hepatic androgen receptor. Hepatology 2008, 47, 1924–1935. [Google Scholar] [CrossRef] [Green Version]
- Chen, Q.; Yang, H.; Feng, Y.; Zhang, P.; Wu, W.; Li, S.; Thompson, B.; Wang, X.; Peng, T.; Wang, F.; et al. SOS1 gene polymorphisms are associated with gestational diabetes mellitus in a Chinese population: Results from a nested case-control study in Taiyuan, China. Diab. Vasc. Dis. Res. 2018, 15, 158–161. [Google Scholar] [CrossRef]
- Spálová, J.; Zamrazilová, H.; Vcelák, J.; Vanková, M.; Lukásová, P.; Hill, M.; Hlavatá, K.; Srámková, P.; Fried, M.; Aldhoon, B.; et al. Neuromedin beta: P73T polymorphism in overweight and obese subjects. Physiol. Res. 2008, 57 (Suppl. 1), S39–S48. [Google Scholar]
- Luo, Y.; Qu, H.; Wang, H.; Wu, J.; Duan, Y.; Liu, D.; Deng, H. Plasma Periostin Levels Are Increased in Chinese Subjects with Obesity and Type 2 Diabetes and Are Positively Correlated with Glucose and Lipid Parameters. Mediat. Inflamm. 2016, 2016, 6423637. [Google Scholar] [CrossRef]
- De Franco, E.; Shaw-Smith, C.; Flanagan, S.E.; Shepherd, M.H.; Hattersley, A.T.; Ellard, S. GATA6 mutations cause a broad phenotypic spectrum of diabetes from pancreatic agenesis to adult-onset diabetes without exocrine insufficiency. Diabetes 2013, 62, 993–997. [Google Scholar] [CrossRef] [PubMed]
- Ziolkowski, A.F.; Popp, S.K.; Freeman, C.; Parish, C.R.; Simeonovic, C.J. Heparan sulfate and heparanase play key roles in mouse β cell survival and autoimmune diabetes. J. Clin. Investig. 2012, 122, 132–141. [Google Scholar] [CrossRef] [PubMed] [Green Version]
- Talmud, P.J.; Cooper, J.A.; Gaunt, T.; Holmes, M.V.; Shah, S.; Palmen, J.; Drenos, F.; Shah, T.; Kumari, M.; Kivimaki, M.; et al. Variants of ADRA2A are associated with fasting glucose, blood pressure, body mass index and type 2 diabetes risk: Meta-analysisof four prospective studies. Diabetologia 2011, 54, 1710–1719. [Google Scholar] [CrossRef] [PubMed]
- Shunmugam, V.; Say, Y.H. Evaluation of Association of ADRA2A rs553668 and ACE I/D Gene Polymorphisms with Obesity Traits in the Setapak Population, Malaysia. Iran. Red. Crescent Med. J. 2016, 18, e22452. [Google Scholar] [CrossRef] [PubMed]
Figure 1.
Box plots of the gene expression data before and after normalization. The horizontal axis represents the sample symbol and the vertical axis represents the gene expression values. The black line in the box plot represents the median value of gene expression. (A1, A2, A3, A4, A5, A6 = omental adipose tissue samples; B1, B2, B3, B4, B5, B6 = subcutaneous adipose tissue samples.)

Figure 2.
Heat map of up-regulated differentially expressed genes. The legend on the top left indicates the log fold change of genes. (A1, A2, A3, A4, A5, A6 = omental adipose tissue samples; B1, B2, B3, B4, B5, B6 = subcutaneous adipose tissue samples.)
Figure 2.
Heat map of up-regulated differentially expressed genes. The legend on the top left indicates the log fold change of genes. (A1, A2, A3, A4, A5, A6 = omental adipose tissue samples; B1, B2, B3, B4, B5, B6 = subcutaneous adipose tissue samples.)

Figure 3.
Heat map of down-regulated differentially expressed genes. The legend on the top left indicates the log fold change of genes. (A1, A2, A3, A4, A5, A6 = omental adipose tissue samples; B1, B2, B3, B4, B5, B6 = subcutaneous adipose tissue samples.)
Figure 3.
Heat map of down-regulated differentially expressed genes. The legend on the top left indicates the log fold change of genes. (A1, A2, A3, A4, A5, A6 = omental adipose tissue samples; B1, B2, B3, B4, B5, B6 = subcutaneous adipose tissue samples.)

Figure 4.
A volcano plot of differentially expressed genes. Genes with a significant change of more than 2-fold were selected.
Figure 4.
A volcano plot of differentially expressed genes. Genes with a significant change of more than 2-fold were selected.

Figure 5.
Protein–protein interaction network of differentially expressed genes (DEGs). Green nodes denote up-regulated genes.
Figure 5.
Protein–protein interaction network of differentially expressed genes (DEGs). Green nodes denote up-regulated genes.

Figure 6.
Node degree distribution: (A) Up-regulated genes; (B) Down-regulated genes.

Figure 7.
Regression diagrams for up-regulated genes: (A) Betweenness centrality; (B) Stress centrality; (C) Closeness centrality; (D) Clustering coefficient.
Figure 7.
Regression diagrams for up-regulated genes: (A) Betweenness centrality; (B) Stress centrality; (C) Closeness centrality; (D) Clustering coefficient.

Figure 8.
Protein–protein interaction network of DEGs. Red nodes denote down-regulated genes.

Figure 9.
Regression diagrams for down-regulated genes: (A) Betweenness centrality; (B) Stress centrality; (C) Closeness centrality; (D) Clustering coefficient.
Figure 9.
Regression diagrams for down-regulated genes: (A) Betweenness centrality; (B) Stress centrality; (C) Closeness centrality; (D) Clustering coefficient.

Figure 10.
Modules in theprotein–protein interaction (PPI)network. The green nodes denote the up-regulated genes.
Figure 10.
Modules in theprotein–protein interaction (PPI)network. The green nodes denote the up-regulated genes.

Figure 11.
Modules in the PPI network. The red nodes denote the down-regulated genes.

Figure 12.
The network of up-regulated DEGs and their related miRNAs. The green circle nodes are the up-regulated DEGs and brown diamond nodes are the miRNAs.
Figure 12.
The network of up-regulated DEGs and their related miRNAs. The green circle nodes are the up-regulated DEGs and brown diamond nodes are the miRNAs.

Figure 13.
The network of down-regulated DEGs and their related miRNAs. The red circle nodes are the down-regulated DEGs and blue diamond nodes are the miRNAs.
Figure 13.
The network of down-regulated DEGs and their related miRNAs. The red circle nodes are the down-regulated DEGs and blue diamond nodes are the miRNAs.

Figure 14.
Transcription factors (TF)–target gene network of predicted target up-regulated genes. (Yellow triangles signify TFs and green circles signify target up-regulated genes).
Figure 14.
Transcription factors (TF)–target gene network of predicted target up-regulated genes. (Yellow triangles signify TFs and green circles signify target up-regulated genes).

Figure 15.
TF–target gene network of predicted target down-regulated genes. (Blue triangles signify TFs and red circles signify target down-regulated genes).
Figure 15.
TF–target gene network of predicted target down-regulated genes. (Blue triangles signify TFs and red circles signify target down-regulated genes).

© 2019 by the authors. Licensee MDPI, Basel, Switzerland. This article is an open access article distributed under the terms and conditions of the Creative Commons Attribution (CC BY) license (http://creativecommons.org/licenses/by/4.0/).
Share and Cite
MDPI and ACS Style
Pujar, M.K.; Vastrad, B.; Vastrad, C. Integrative Analyses of Genes Associated with Subcutaneous Insulin Resistance. Biomolecules 2019, 9, 37. https://doi.org/10.3390/biom9020037
AMA Style
Pujar MK, Vastrad B, Vastrad C. Integrative Analyses of Genes Associated with Subcutaneous Insulin Resistance. Biomolecules. 2019; 9(2):37. https://doi.org/10.3390/biom9020037
Chicago/Turabian StylePujar, Manoj Kumar, Basavaraj Vastrad, and Chanabasayya Vastrad. 2019. "Integrative Analyses of Genes Associated with Subcutaneous Insulin Resistance" Biomolecules 9, no. 2: 37. https://doi.org/10.3390/biom9020037
Note that from the first issue of 2016, this journal uses article numbers instead of page numbers. See further details here.