1. Introduction
Using cameras as rich sensors, with data coming from vision systems, is a particularly important part of many real world robotic applications, be it by assisting people in their daily tasks [
1] or in vision perception related to mobile platforms [
2]. One very relevant area of application is autonomous vehicles, representing a major innovation for the automotive industry that, in turn, results in a great economic impact world-wide. In such a dynamic context, work and research in this area has grown greatly over the last years.
This topic has even raised interest within the robotics community and was the target focus of many robotic competitions around the world [
3], such as the Audi Autonomous Driving Cup [
4] or the Portuguese Robotics Open [
5].
An autonomous intelligent vehicle has to perform a number of tasks, sometimes in a limited amount of time [
6]. This involves being able to identify and track road lanes, being able to process traffic lights and road signs, and being consistent at identifying and avoiding obstacles [
7,
8,
9].
“Robot vision is not just computer vision. While robotics poses several challenges for visual processing, for example, three-dimensional (3-D) operation and performance requirements, there is an aspect in particular that makes robot vision special and distinguishes it from mainstream computer vision.” [
10]. Although many solutions exist, one of the most common approaches to tackle these problems is the use of one or more cameras on the robot’s body.
Usually, when extracting information from an image, one holds some prior knowledge on the state of the system (that is, some notion on the state of the surrounding environment) and, therefore, more detailed measurements can be obtained. Often, however, in autonomous driving, little information is known about the environment because no previous or overall structure is present [
11]. Therefore, it is not only important to get accurate results, but also to do it in an adequate timing—real-time. Real-time is often defined as the sufficient time the robot needs to process external data and actuate without causing any harm to himself or to others. The presented ideas lead to a set of processing deadlines per task, as defined in the soft real time literature [
12]. Furthermore, using several cameras involves specific challenges that must be addressed to reduce the global amount of computing power needed for processing—this is especially relevant for battery operating processing platforms that are common in mobile robotics.
Robotic vision naturally inherits the characteristics from real-time vision, considered as having soft real-time constraints, and encompasses two kinds of applications: applications where 3D information is relevant and perception of flat scenes. A known real-time vision motto is “zero copy, one pass” technique as proposed by Sousa et al. [
13] and used by Costa et al. [
14]. Using this technique, the input image should be read only once, taking all the necessary information (which is organized into smaller data structures). This approach guarantees that the objective is reached without creating copies of the input image thus saving processing time.
The presented research uses a multi-camera vision system to tackle two classes of challenges in mobile robotics: recognition of a “flat” signal while tolerating distortions, and white lines detection and tracking that need 3D reconstruction, using the “zero copy one pass” motto [
15]. The proposed algorithms optimizations and the tests performed in four hardware platforms culminate in generic design principles for robotic vision tasks where real time requirements are demanded.
The remainder of this paper is organized as follows. In
Section 2, a literature review is performed, leading to the identification of the research issues, proposal, and research goals. In
Section 3, all the steps and methods followed in designing the algorithm are presented.
Section 4 presents the real time results obtained from the algorithm. Finally,
Section 5 draws conclusions from the obtained data.
2. Literature Review
To assess the problems associated with Real-Time programming and computer vision, a literature review is performed, focusing in two important classes of tasks for autonomous robots, here exemplified as: (i) lane detection/tracking algorithms; and (ii) semaphore/sign recognition.
2.1. Lane Tracking
Road perception is a major task in an autonomous driving robot. Several strategies can be employed, resulting in different trade-offs between accuracy and computational cost. Ros et al. have proposed offline-online strategies with a well defined trade-off between accuracy and computational cost to the perception of the real world [
16]. A real time approach to lane marker detection in urban streets, proposed by Aly [
17] and capable of running at 50 Hz, is the generation of the top view of the road, filtering it with selective oriented Gaussian filters, and using RANSAC line fitting to give initial guesses to a new and fast RANSAC algorithm, for fitting Bezier Splines. Other authors like Sotelo et al. centred their detection algorithm is the HSI colour segmentation, with the key difference of defining a lane “skeleton”: a curve representing the middle line of the road. This “skeleton” is estimated using a 2nd-order polynomial parabolic function, and subsequent estimations are then calculated with the help of a Kalman filter [
18]. A real-time lane detection invariant to illumination for lane departure warning system, based on vanishing point calculation, running at 33 ms, was proposed by Son et al. [
19].
Another algorithm, proposed by Thorpe et al. [
20], is SCARF: after a step of preprocessing with sub-sampling and applying a mean filter, the pixels of the image are separated into sets of similar colours using mean clustering, using on-road and off-road sample sets to compute multiple Gaussian colour models. Then, with the application of a matched filter, a road or intersection is selected from a list of candidates. Some problems with this approach include difficulties in the classification step if there aren’t distinguishable colours between on-road and off-road samples and control instabilities as the robot speed increases.
Another technique useful to obtain relevant features for road estimation algorithms is the Inverse Perspective Mapping (IPM), as proposed by Muad et al. and Miguel et al. [
21,
22]. IPM will be further explained in this work, with more detail, in
Section 3.1.1. IPM is a geometrical transformation technique that projects each pixel of the 2D camera perspective view of a 3D object and re-maps it to a new position, constructing a rectified image on a new 2D plane. Mathematically, IPM can be described as a projection from a 3D manifold,
(real life input space) onto a 2D plane,
. The result is the desired bird’s eye view of the image, thus removing the perspective effect.
This is achieved using information from the camera’s position and orientation in relation to the road.
2.2. Semaphore/Traffic Light Recognition
Usually, the semaphore/traffic signs recognition algorithms comprise two tasks: (i) detection; and (ii) classification.
One well known technique is colour segmentation. A transformation to enhance red, blue, and yellow colours in the RGB colour space was presented by Ruta et al. in [
23]. Additionally, they have proposed a variant of the Distance Transform (DT) called Colour Distance Transform (CDT). The main idea of CDT is the definition of a smooth distance metric to be used on the comparisons between the previously stored template and raw input image. For the traffic sign detection task, Dalal et al. in [
24] have presented seven colour representations: the plain channels
R,
G,
B, the normalized channels
,
,
, and the greyscale channel
, where
. For the classification stage, the authors used a Linear Discriminant Analysis (LDA), and unimodal Gaussian probability densities. For the detection phase, Maldonado-Bascon et al. in [
25] have used a threshold in the HSI colour space (Hue Saturation Intensity) for the chromatic signs and, at the same time, the white signs are detected using achromatic decomposition. Then, the recognition phase uses linear Support Vector Machines (SVM) for shape recognition and SVMs with Gaussian kernels for recognition.
The main drawback of using HSI for colour segmentation is the high computational cost due to its non-linear formula, as demonstrated by Escalera et al. in [
26]. To improve the time performance and accuracy, Zaklouta and Stanciulescu [
27] have proposed an adaptation to the colour enhancement stage and improved the classification stage using a HOG-based SVM detector (Histogram of Oriented Gradients).
Other computational expensive solution to recognize signs is the use of the Fast Fourier Transform (FFT) as used by Gil-Jiménez et al. in [
28]. The classification phase involves the usage of the FFT transform to generate signatures and the matching is performed by comparing the signatures of the template and detected blob. The use of FFT makes the matching method very robust to rotation and deformation.
2.3. Research Issues
From the literature review, it is possible to identify some issues:
Little information on results about robotic vision systems under real time constraints is presented.
The trade-off results relating accuracy and characterization of global execution times are not commonly found.
There is a lack of information about the hardware/software platforms used to obtain results, mainly their specifications.
2.4. Proposal and Research Goals
The presented work aims to minimize the issues listed above, mainly the addition of information about results to the area of real time robotic vision, identification on trade-offs and comparisons between real computing platforms.
Using as motivation the PRO Autonomous Driving competition, the goal of the current research is the search of Real-Time Artificial Vision approaches that are applicable to real robotics problems, such as:
Understanding the Robotic Real-Time Vision design principles;
Understanding the Robotic Real-Time Vision paradigm as a trade-off—time versus accuracy;
Identifying design strategies for the development of an algorithm capable of running on low computational power, battery operated hardware to tackle the autonomous driving tasks with adequate accuracy;
Demonstration of the importance of the reduction of data to process (as in “zero copy one pass” principle);
Identifying the information of the Signalling Panel as an example of perception of a flat scene;
Finding, tracking and measuring angles and distances to track lane;
Characterization of execution times in different processes; and
Discussion of platform choices.
3. Materials and Methods
The methodology is based in an analysis of the PRO Autonomous Driving competition, with the test robot being used in the before-mentioned competition and in four tested hardware platforms.
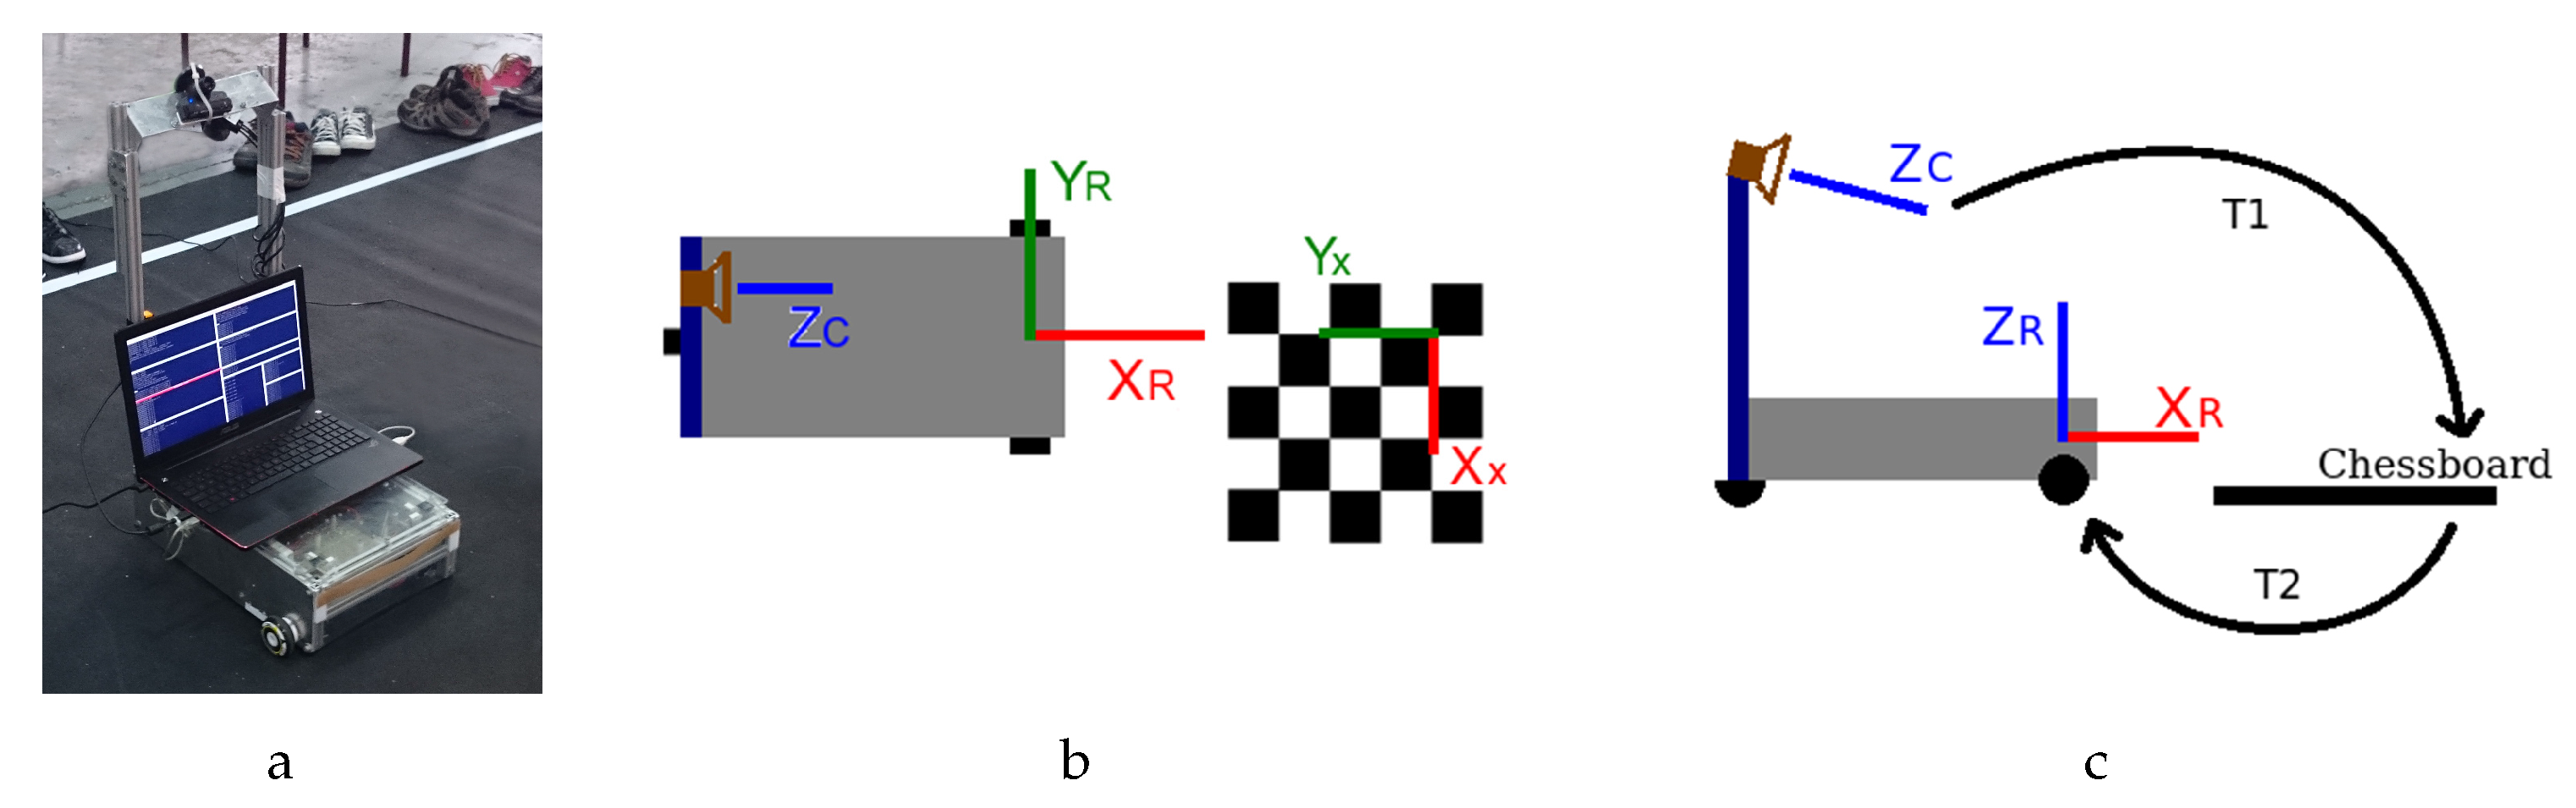
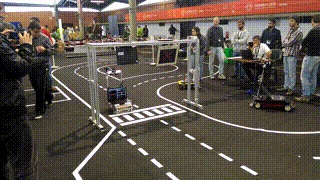
The test robot, Figure 3a, uses a differential steering and no mechanical modifications on the robot platform were made throughout all tests.
The sensory system is vision-based and is made up of two PLAYSTATION Eye™(“PSEye”) running with a resolution of 320×240 @ 30Hz (wide lens mode), kept constant. For testing purposes, video footage was recorded to create a relevant dataset to be used in all platforms under test (using the same data allows meaningful comparisons of issues). The recording of this dataset was made to ensure that most pertinent tests are performed.
The on-board high level computing platform is changeable, communicating with motor driver via USB connection. Two vision tasks are presented as examples: (i) “flat” scene interpretation; and (ii) 3D scene perception (
Figure 1).
Task (i)—track following—3D recognition and tracking of the several white lines of the road (dashed or continuous) on black background;
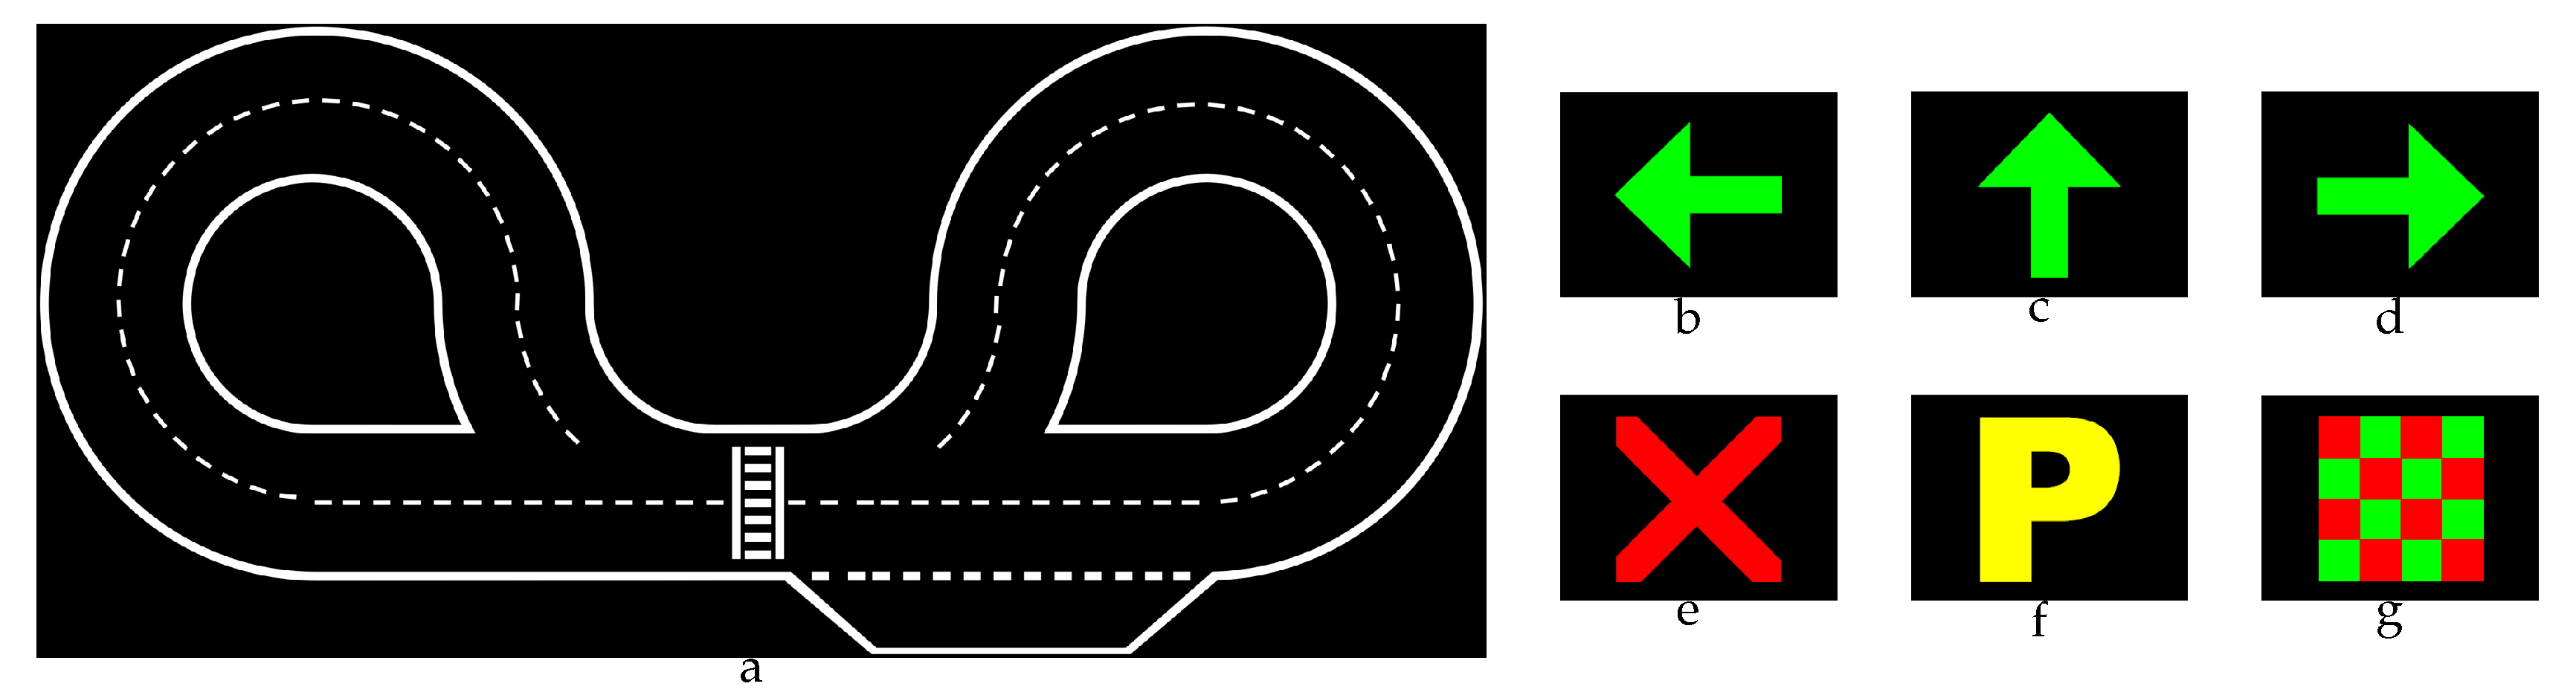
Task (ii)—signalling panel recognition—identification of one signal from a set of 6, with characteristic colours and shapes, occupying a large portion of the image. The region of interest occupies about about 30% of the total image area.
Firstly, the algorithms in their original form for both vision tasks are briefly presented and their improvement is discussed.
Results include comparative results of execution times for both algorithms for several computing platforms.
The conclusions include a systematization of the design guidelines for algorithm adaptation and discussion of other relevant results.
3.1. Lane Tracking Algorithm
The tracking algorithm used, represented in a flowchart diagram, is exhibited in
Figure 2. The first step is to capture a RGB frame from the camera. Then, a point selection is performed in the greyscale space, extracting only the points that most likely form a line. The third step is the removal of the distortion due to the lens used (which raises the field of view of the camera). Next, for each of these points the Inverse Perspective Mapping (explained in the following subsection) is applied, and, after this step, the Probabilistic Hough Transform is employed to detect the lines. From the detected lines returned by the transform, only the “best” one is retained (the line that has the minimum distance between the actual line and the one before).
3.1.1. Inverse Perspective Mapping (IPM)
IPM is a geometrical transform that projects each pixel from the 2D view of 3D objects with perspective and maps them to a new position, building a new image on a new inverse 2D plane (this perspective is normally called bird’s eye view). In this case, the strategy used was the calculation of the transform from the camera referential to the chessboard referential (T1), then calculating the transform from the chessboard to the robot referential (T2), as seen in
Figure 3c.
Figure 3b shows the setup used to calculate T1 and T2.
T1 was obtained using the camera extrinsic parameters and T2 was calculated measuring the distances between the chessboard/robot references and the rotation matrix between them. To apply the IPM transform, it is necessary to perform the transformation described in Equation (
1). The remaining equations, Equations (
2)–(
4), are intermediate steps leading to IPM transform:
in which
and
are the focal length in pixels along x and y, respectively,
and
the principal point coordinates in pixels and
the skew factor in matrix K.
and
are the rotation matrices from the transformations
and
.
x and
y are the coordinates from the input image pixel.
is the vector of translation resulting of the
and
multiplication.
define a geometric plane for the application of the IPM ( Equation (
5)).
X,
Y and
Z are metrical coordinates on the robot’s referential.
After we obtain
X and
Y (the
Z coordinate is irrelevant to this case and can be discarded), to achieve a visual representation of the IPM, the last step is to map these points into an image (Equations (
6) and (
7)):
where
H and
W are the height and width in pixels of the window used to map the points.
,
,
,
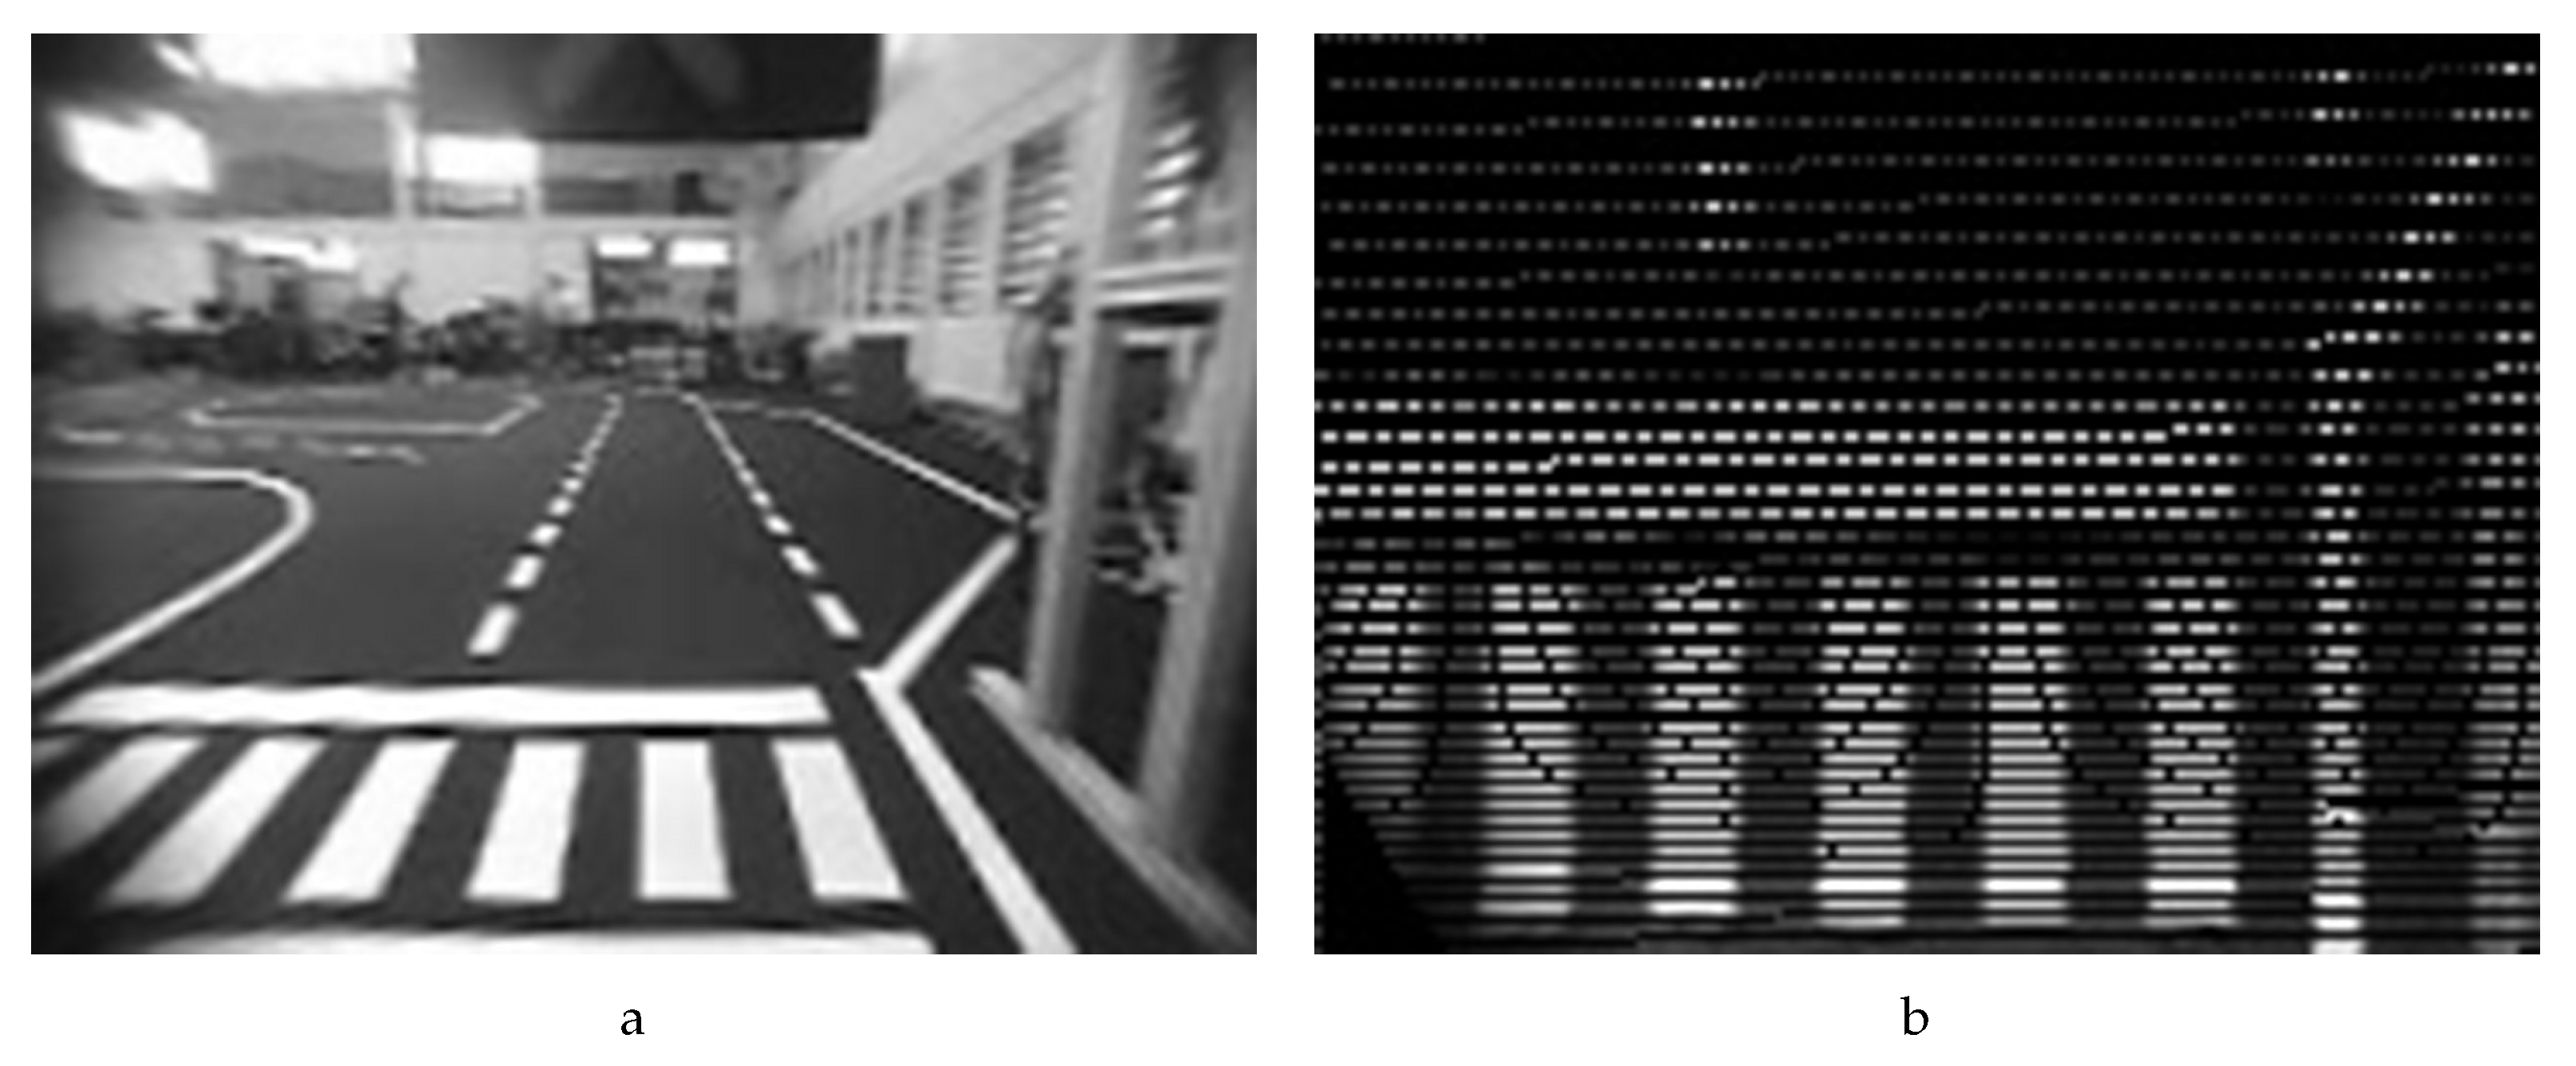
define a box in meters on the robot’s referential. An example of the application of the IPM can be seen in
Figure 4.
This algorithm has the advantage of allowing, from the input image, the direct calculation of the position (x,y) in meters on the robot’s referential. Another advantage is the possibility to delimit a window of interest on the robot’s referential, allowing an optimized processing of the relevant information.
3.1.2. Tracking Lines Algorithm
After the IPM transform, the next step is the detection of the lines present on the IPM transformed image. The strategy employed is the application of the Hough Transform variant for line detection. This transform is available in OpenCV in two alternatives: HoughLines() and HoughLinesP(). The major difference between them is on the choice of the pixels used in the calculation of the Hough space. The first one resorts to every pixel on the image, while the second uses a set number of random pixels to calculate the transform, making it more faster than the previous one mentioned.
The Hough Transform function returns a vector of lines detected. After that, the algorithm chooses the “best” line from the received vector, which is the line nearest to the previous one detected (inside a limited range). If no line fulfils this condition, the previous one is maintained. The last step is to calculate the distance from the robot’s referential to the point chosen. Because the IPM strategy was used, this step is simplified, making its computation direct.
The algorithm represented in
Figure 2 (from now on denominated as “Fast version”), was designed under the real-time image motto: “zero copy one pass”—meaning that, in a single pass, all relevant information is extracted, with no need for creating kernels or auxiliary images. However, a previous attempt (“Slow version”) was tested, and is as follows: after receiving a RGB frame and converting it to a greyscale representation, a Gaussian filter is applied to remove noise. With the image preprocessed, the lens distortion is corrected with IPM. Finally, the Hough line transform is used, enabling the retrieval of the distance and angle needed for the tracking. A full time-performance comparison between these two approaches is performed in
Section 4.
3.2. Signalling Panel Recognition
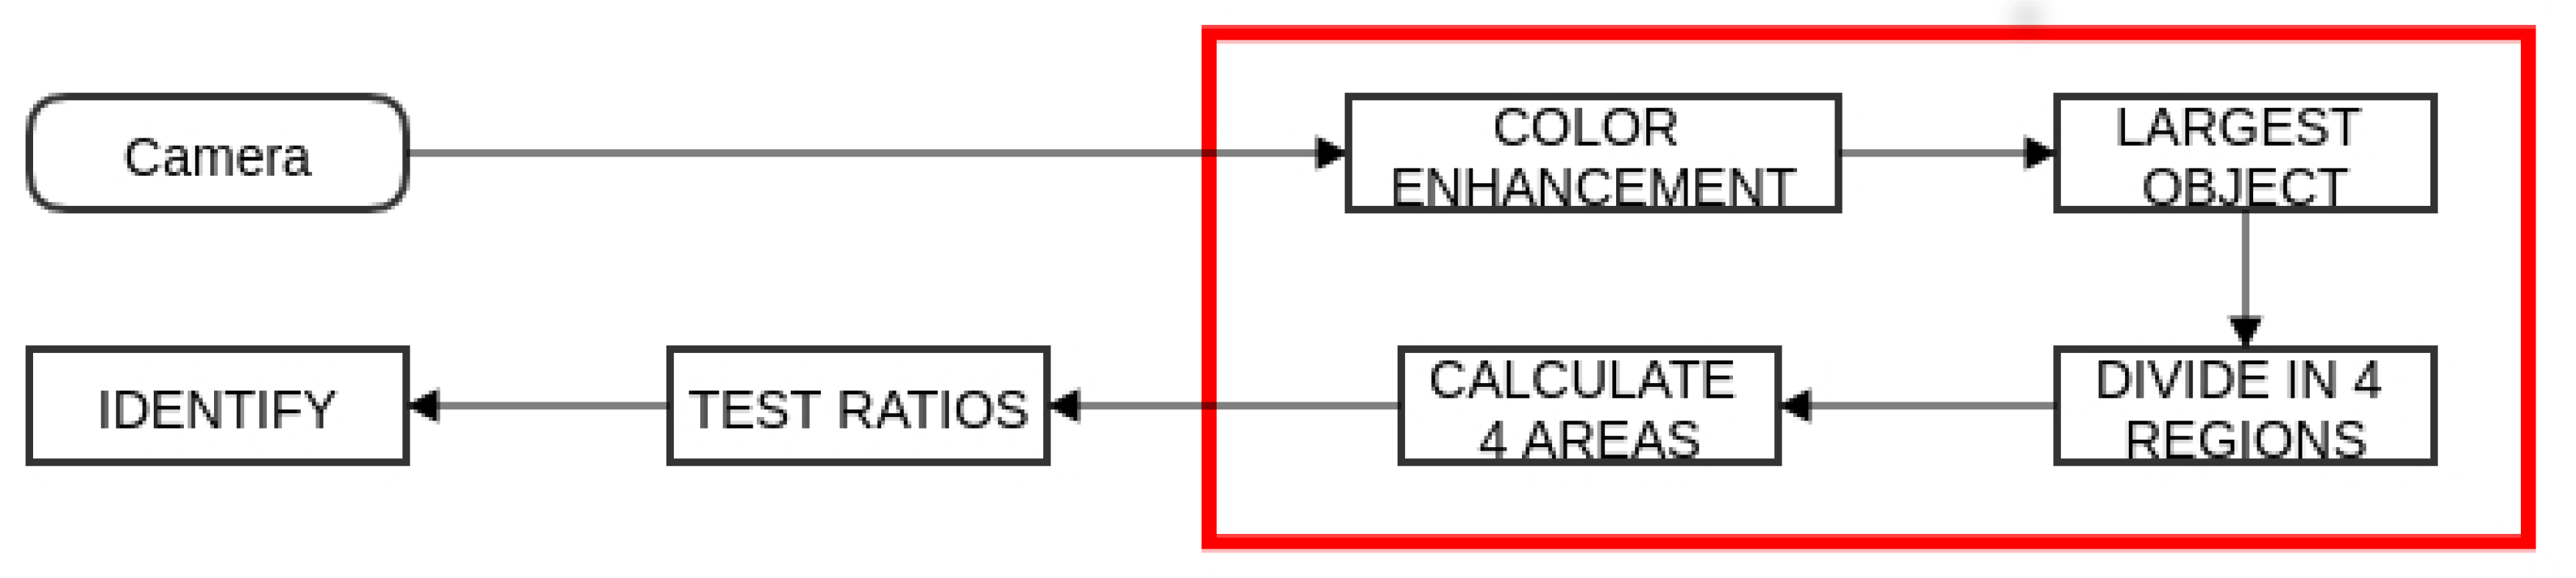
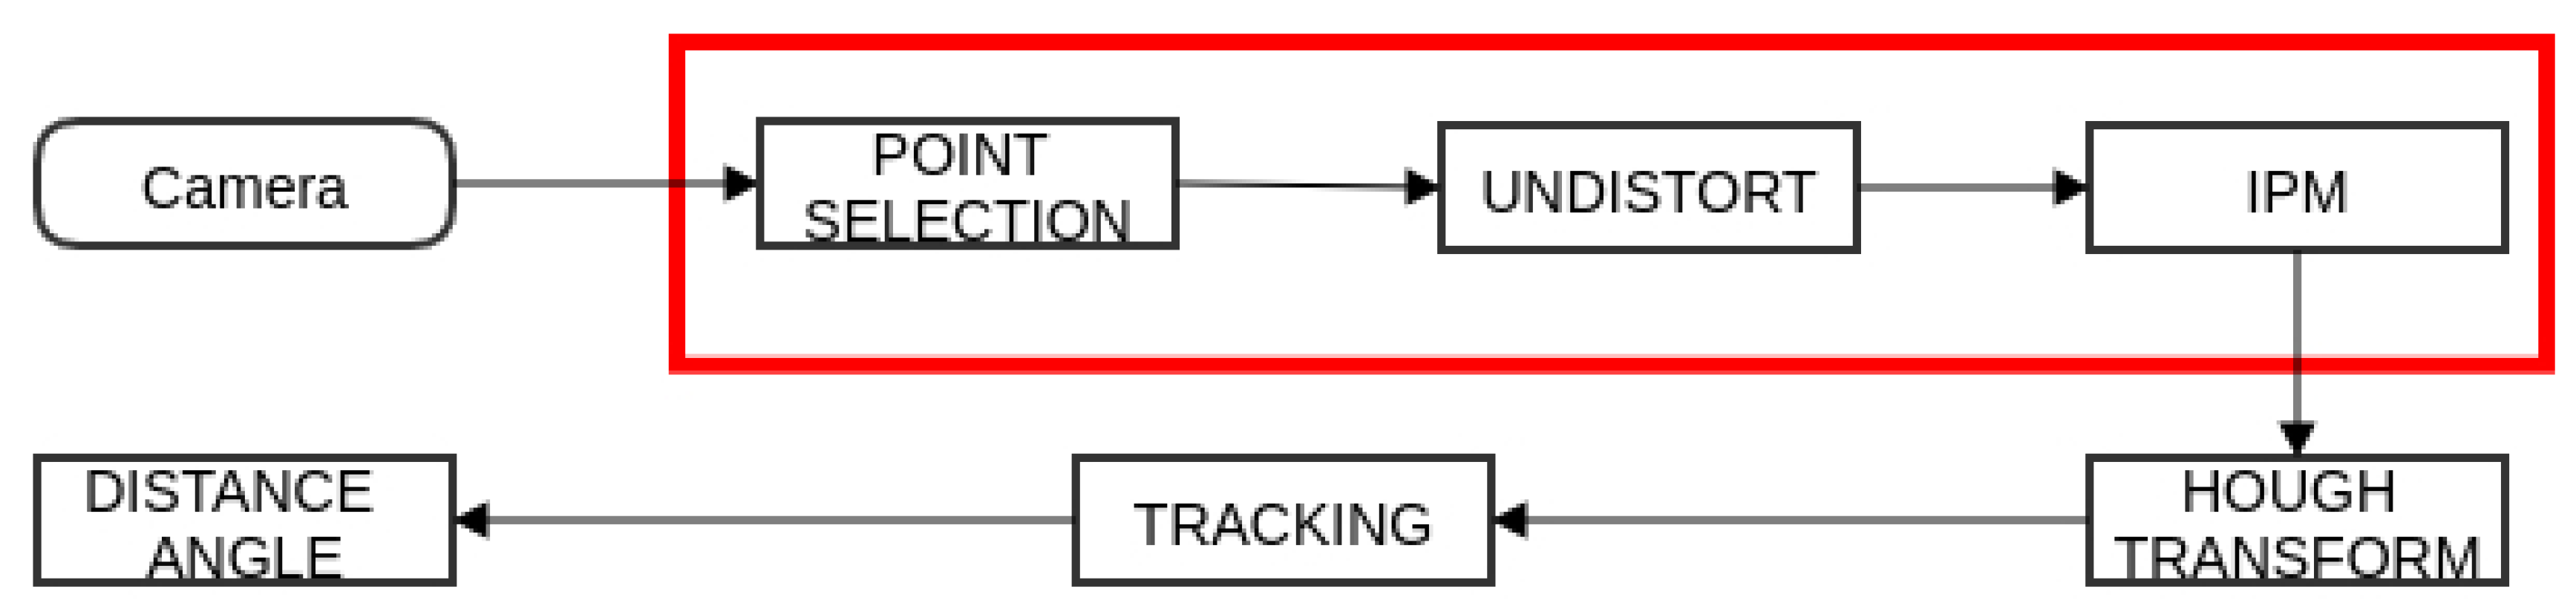
The detection of the panel is achieved via another camera installed on the robot (pointed up). The algorithm was also designed under the “zero copy one pass” principle (the tasks inside the red bounding box in
Figure 5 are computed in a single pass), and this version of the program is also labelled “Fast version”. The competition ruling [
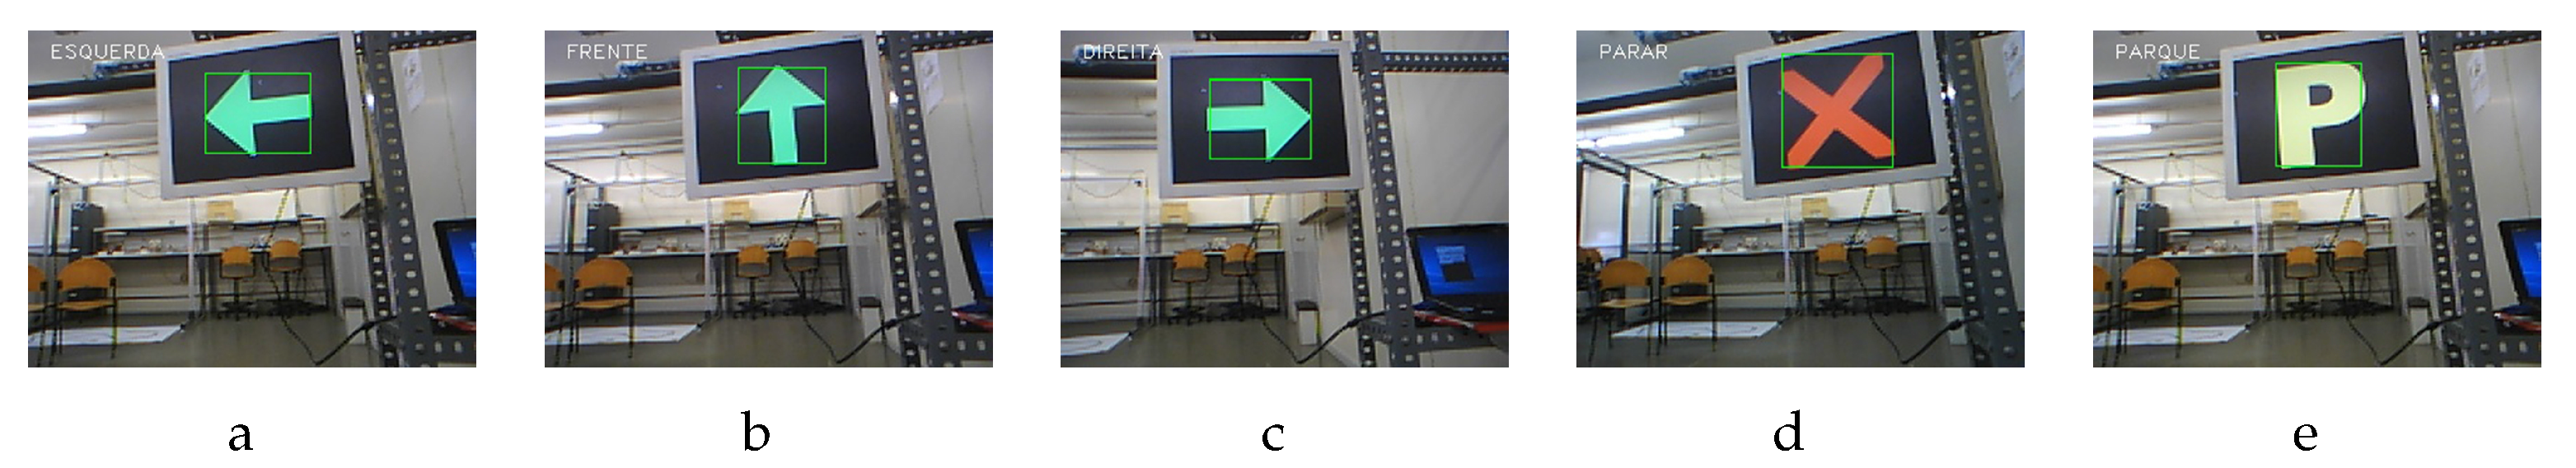
29] defines a specific dataset of panels used, shown in
Figure 1.
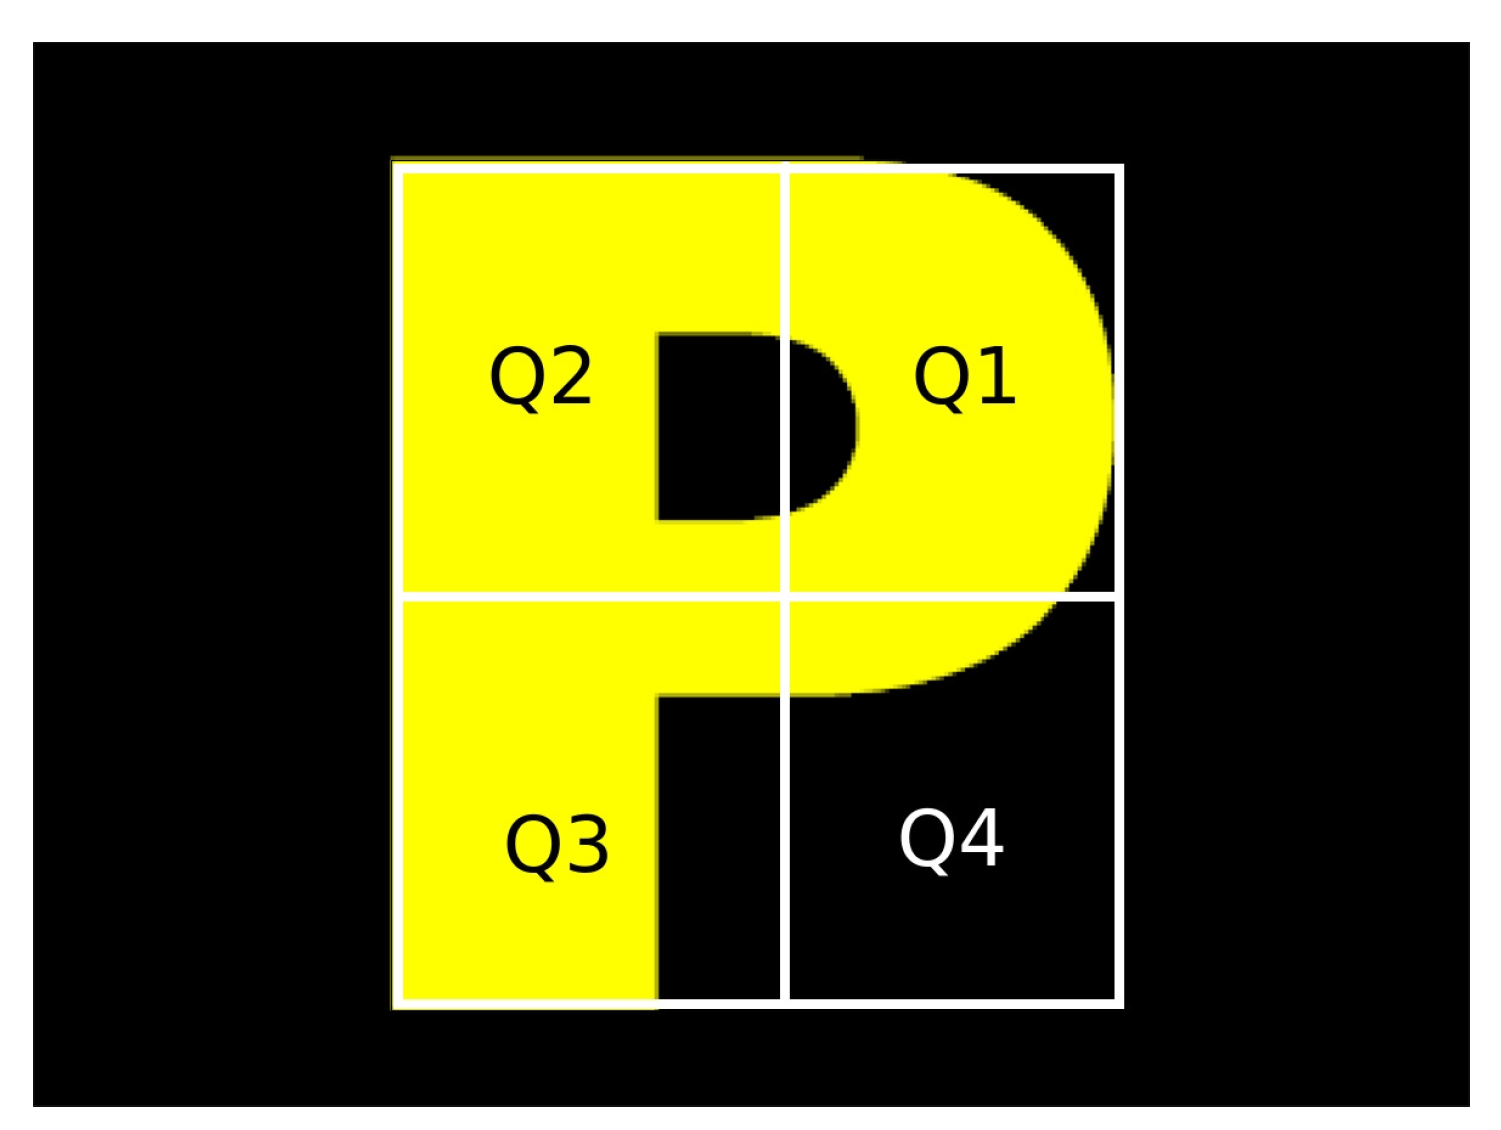
The signalling panels are characterized by three main different shapes (arrow, cross and the letter “P”) and colours (red, yellow and green). A block diagram representing the main stages of the semaphore recognition algorithm can be seen in
Figure 5. Based on that information, for each RGB pixel
x, the algorithm uses a colour segmentation strategy to enhance red (Equation (
8), green (Equation (
9)), and yellow ( Equation (
10)) colours where
. Then, the object that possess the maximum area is selected. Next, the object is divided in four quarters (Q1, Q2, Q3 and Q4; see
Figure 6), and the area for each one is calculated. Finally, a decision tree is used to recognize each panel by testing ratios between the quarters. In the same way as in the lane tracking algorithm, the first version of the signalling panel recognition algorithm (“Slow version”) was tested and all of the tasks were applied to the full size images with no reduction of information between tasks. The “Fast version” takes advantage of design principle “zero copy one pass” and a full comparison between the two versions is presented in
Section 4.
The decision tree used to recognize each signalling panel is described in Algorithm 1.
| Algorithm 1 Signalling Panel Recognition Algorithm |
| procedure RecognizePanel |
| //Input: RGBImage |
| //Output: PanelString |
| using acceptable RGBRegion |
| |
| if then |
| return “No Semaphore” |
| else |
| |
| |
| |
| |
| if then |
| return “Stop” |
| else |
| if then |
| return “Go Forward” |
| else |
| if then |
| return “Turn Left” |
| else |
| if then |
| return “Turn Right” |
| else |
| if then |
| return “Park” |
| |
| return “No Panel” |
4. Results and Discussion
This section presents the results obtained from the application of real time vision guidelines.
Table 1 and
Table 2 show a comparison between the same tracking algorithm, one version using the real-time vision premise “zero copy, one pass” (Fast) and another version without (Slow).
Table 3 presents the real time results for the signalling panel recognition algorithm. Additionally, two histograms that juxtapose the four platforms time results for the tracking and panel recognition algorithms are presented. The accuracy of the distance and angle measures obtained from the tracking system is displayed in Figure 8, and some image results for the tracking lines algorithm are also presented. Regarding to the signalling panel recognition algorithm, some results taken in a laboratory environment are presented in Figure 9.
Looking at
Table 1 and
Table 2, it is clear that there is significant time reduction between the different platforms on the IPM and tracking algorithm. In the case of the Asus ROG, the execution time became 59 times faster and on the EeePC and in the Raspberry was 70 times faster. The results in the signalling panel recognition shown in
Table 3 also present a satisfactory real-time vision performance in this context. The measured time does not take into account the camera data transfer time on the USB port.
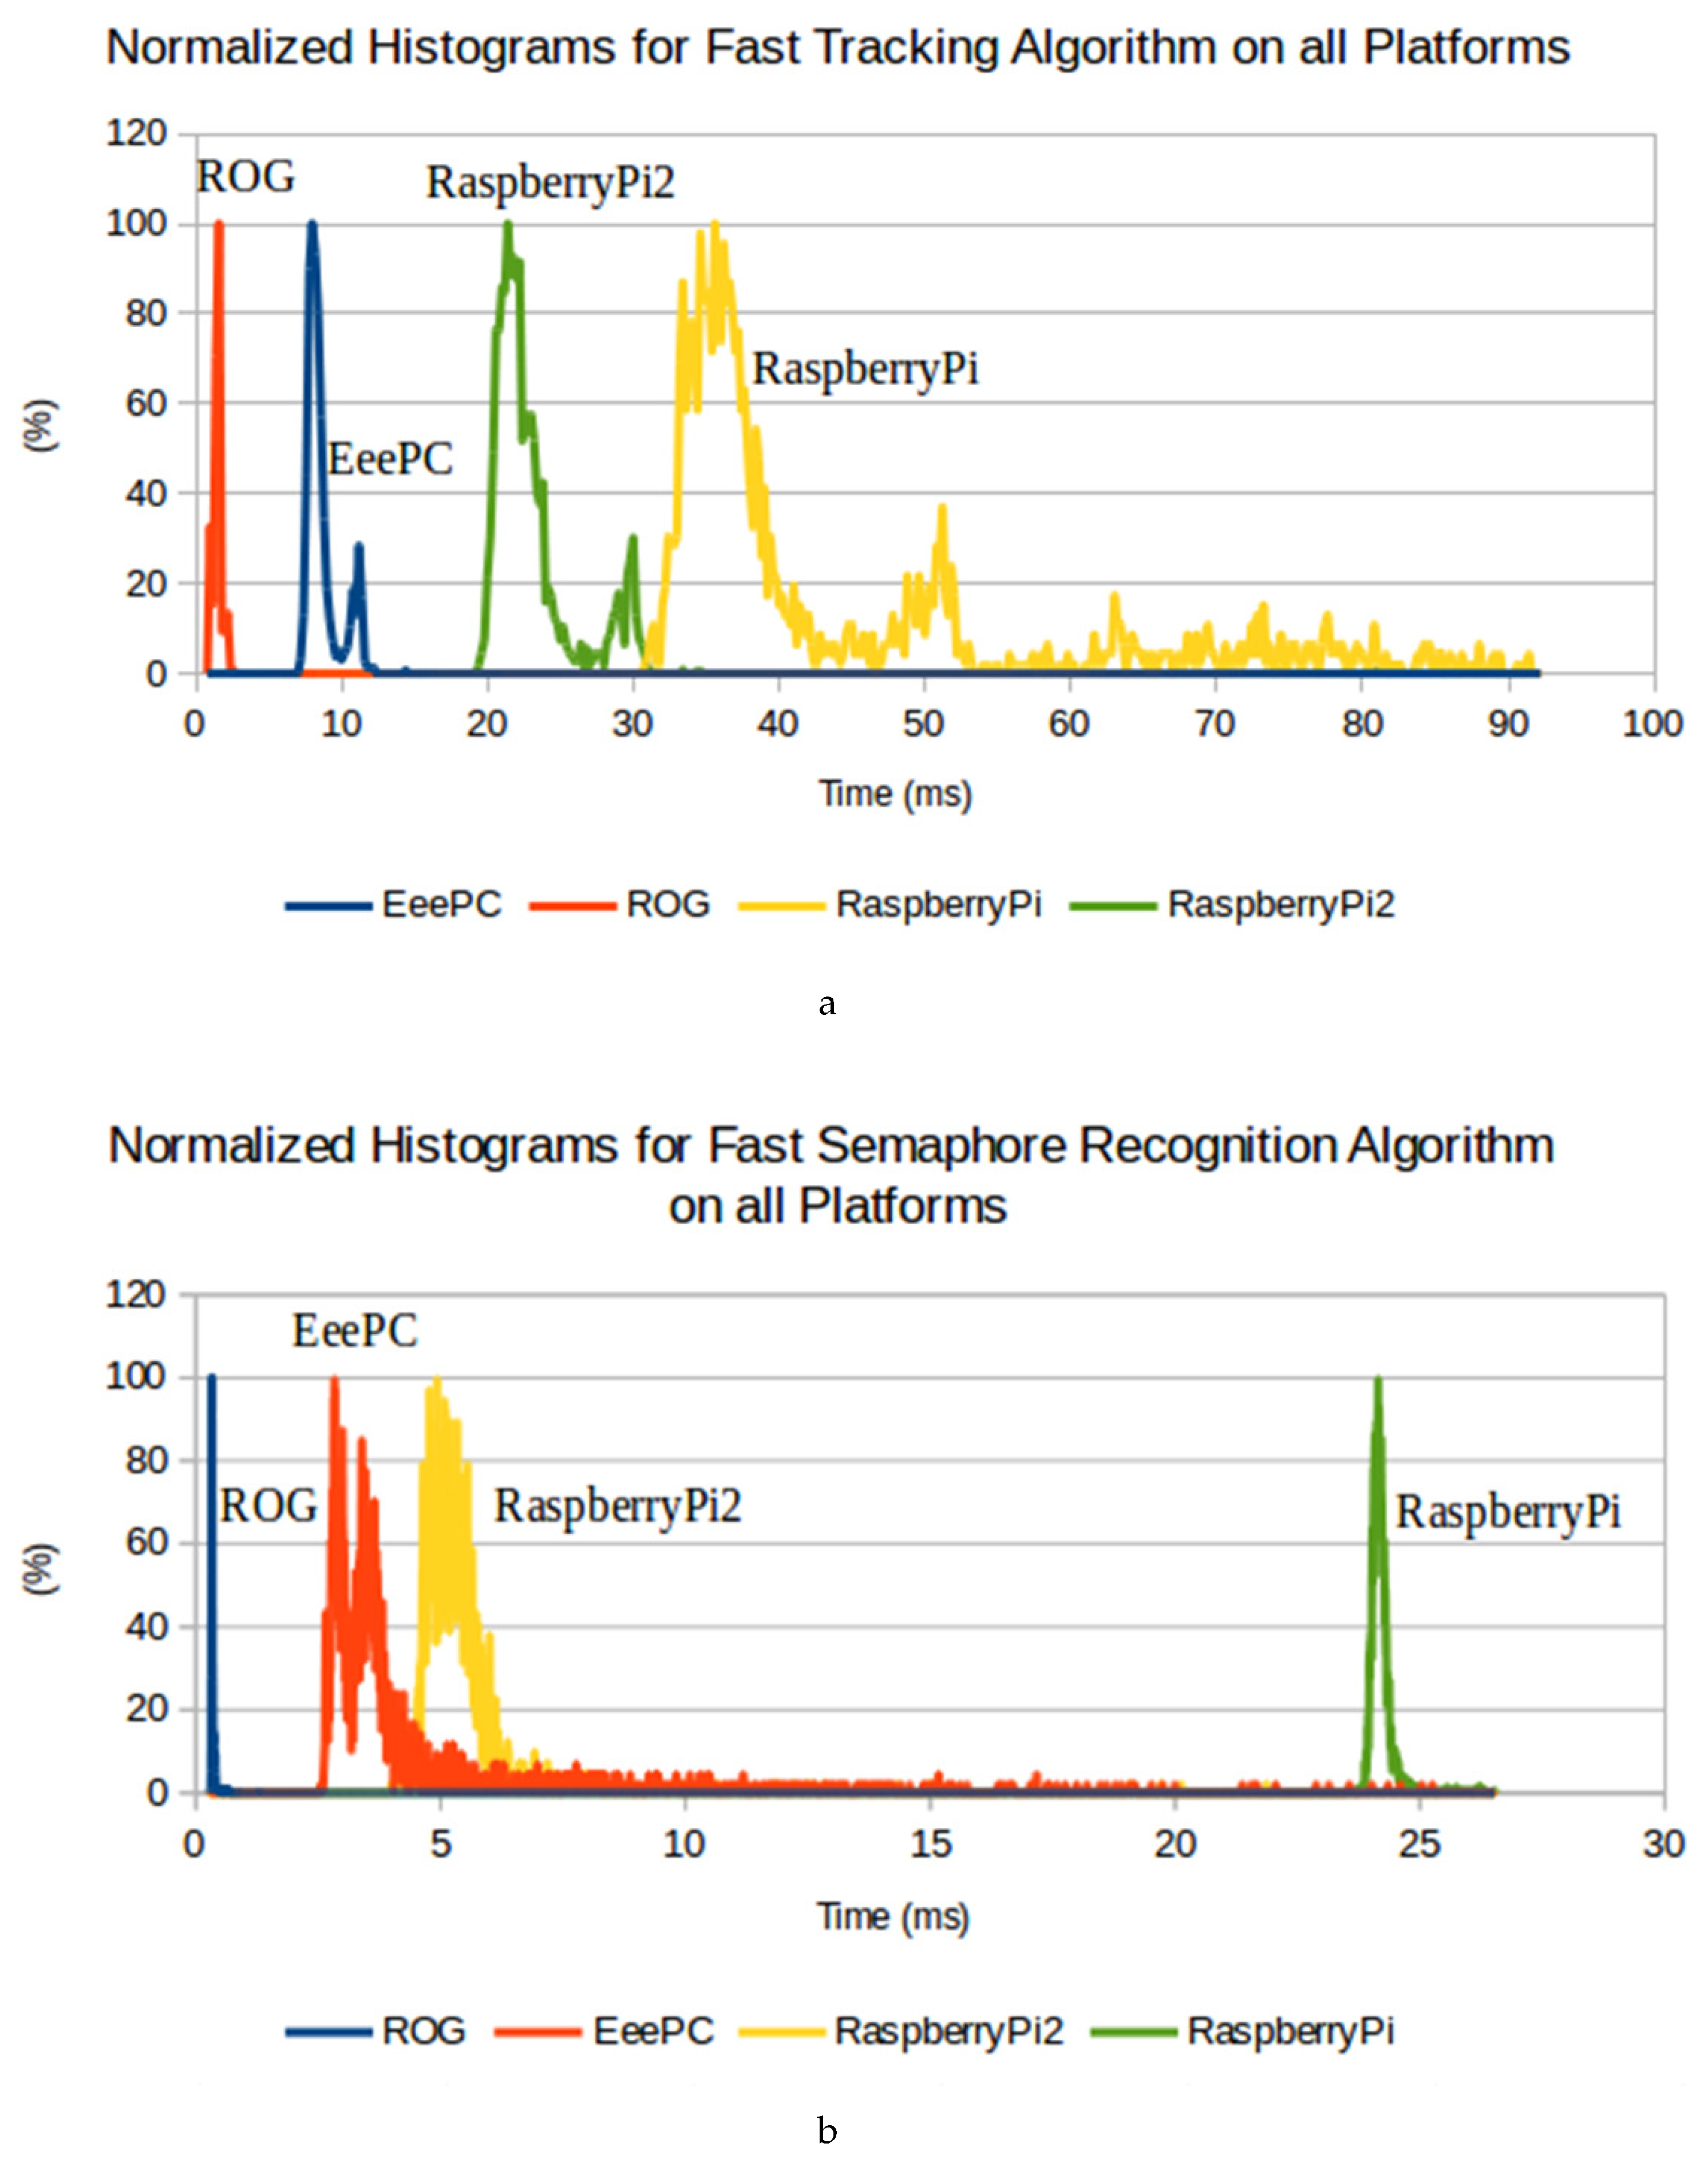
The histograms presented in
Figure 7 are relative to the measured time obtained, both in the fast version, for the tracking algorithm,
Figure 7a; and for the measured times for the signalling panel recognition algorithm,
Figure 7b. To test the tracking and panel recognition algorithms, two representative real case scenario datasets from the 2016/2017 PRO autonomous driving competition were used, which were recorded and replayed similarly on all machines. The number of samples used to draw the histograms was 5000 in both algorithms (in all platforms), and the same implementation of the algorithms was used. Furthermore, the histograms are individually normalized.
From the histograms in
Figure 7a,b, it is possible to see that the peak in each platform appears around its mean. However, in
Figure 7a, another peak appears in all platforms. This can be explained by the presence of a cross-walk (zebra crossing, as in
Figure 4a) on the dataset used (real case scenario regarding the 2016/2017 PRO autonomous driving competition) to test the tracking algorithm. In this region of the track more lines appear, therefore more information needs to be processed.
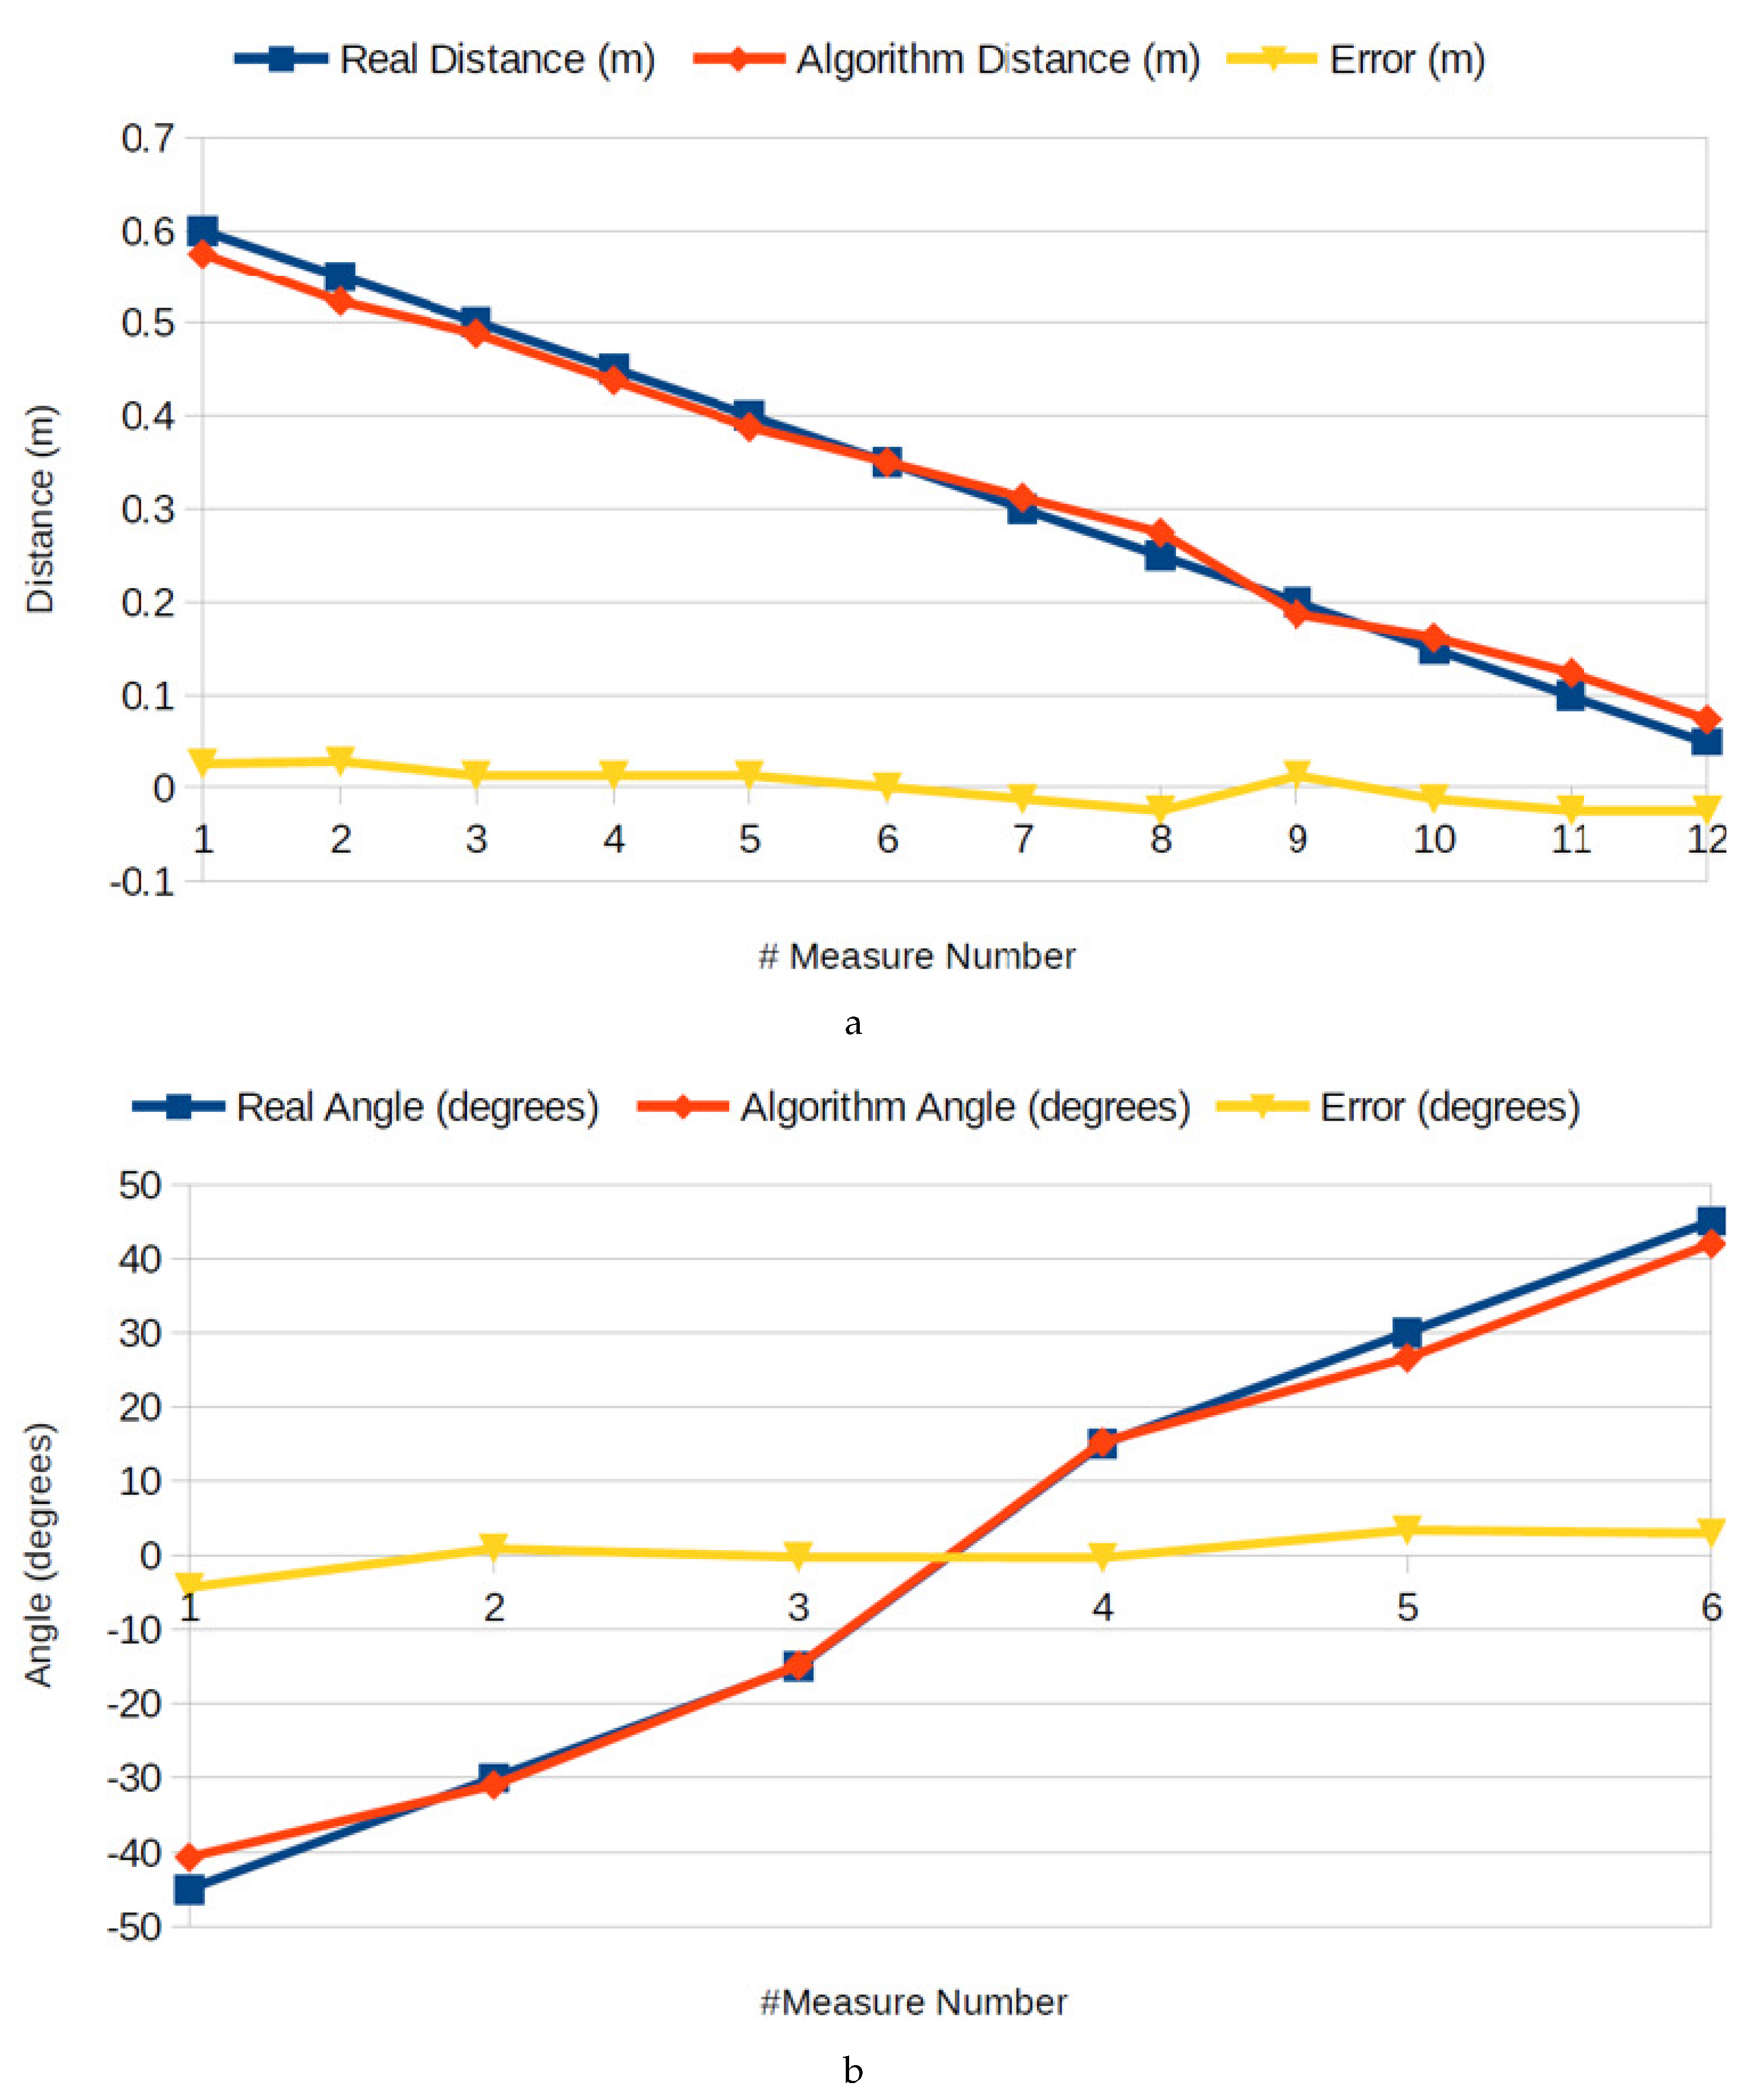
Another important result is the accuracy of the distance and angle returned by the tracking algorithm. The accuracy results were obtained by placing the robot in different known positions on the track, measuring the real distance and angle between the robot’s referential and the intersection point to the right line.
Figure 8a,b show a comparison between the real-life measurements and the ones obtained from the algorithm. The blue represents the real-life measurements, assumed to be the “ground truth” (ignoring errors in the manual measurement). By examining
Figure 8a,b, it is noticeable that the obtained distance and angle are precise enough for the application at hand, showing a distance error below 0.03 m, and an angle error below five degrees.
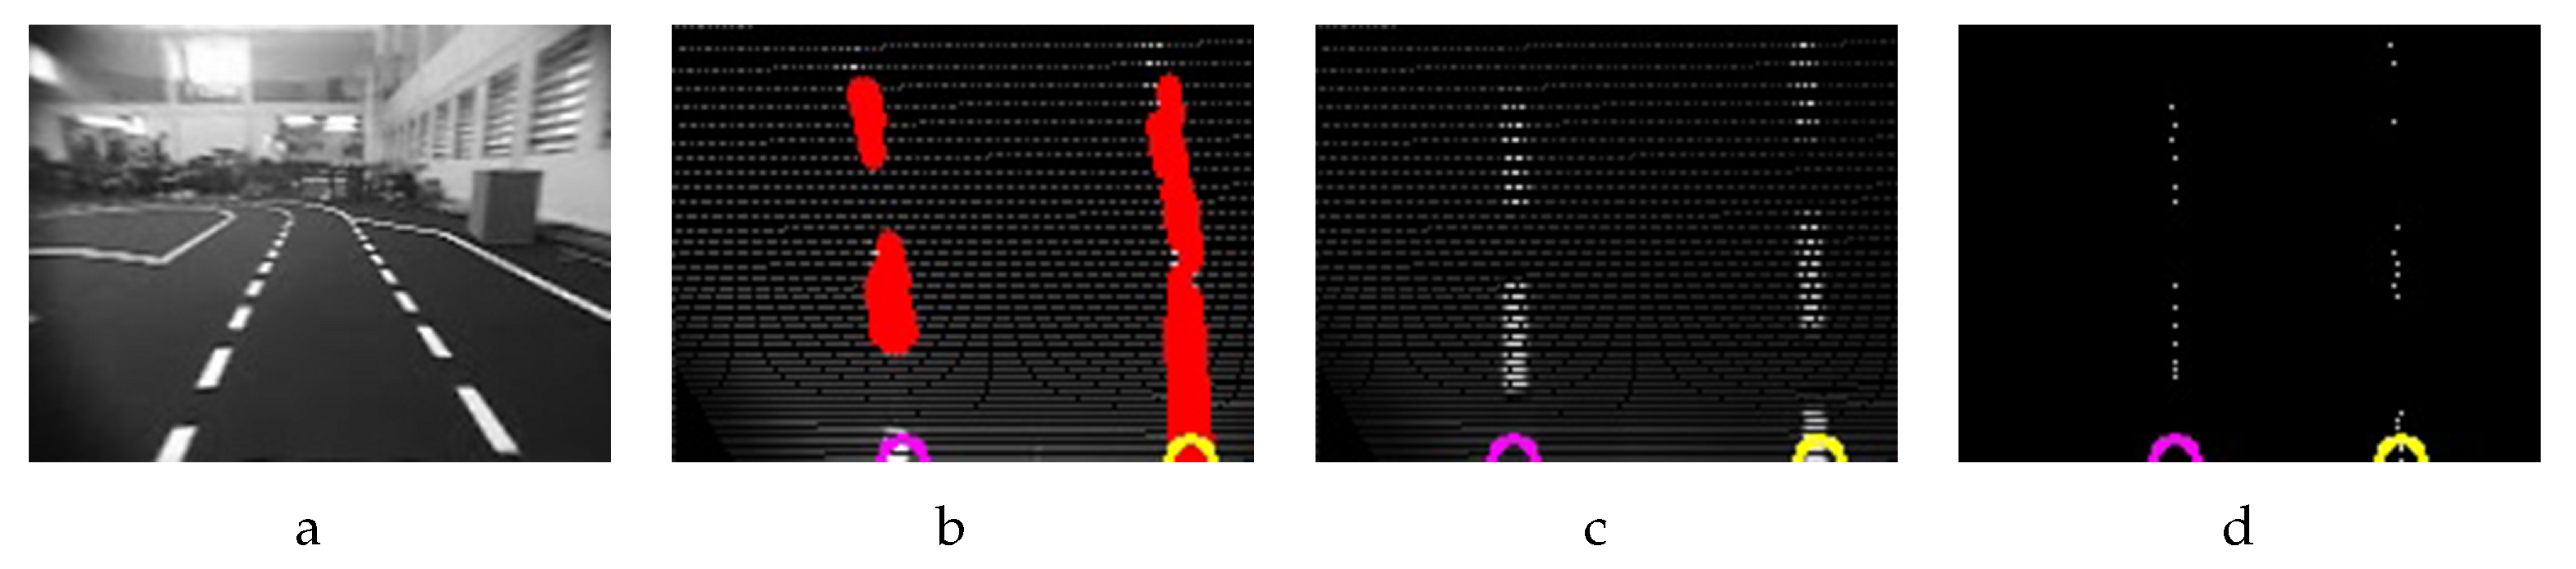
In
Figure 9b, detected lines returned by the Probabilistic Hough Lines Transform function drawn on top of the IPM image (
Figure 9c) in the slow version, and fast version
Figure 9d are shown.
The yellow and purple circles are the result of the tracking lines system (A video showing the results of the proposed tracking system can be found in
Supplementay Material). The distance and angle measures needed are calculated from the yellow/purple circle near bottom part of
Figure 9d.
The signalling panel recognition algorithm was also tested into the 2016 and 2017 PRO. In the context of the competition, this technique is precise enough, ensuring zero false positives and zero false negatives in both tests made at the competition (A video showing the results of the proposed signalling panel recognition system can be found in
Supplementay Material).
In
Figure 10, a laboratory test is shown for each panel used in the competition.
The characteristics of the PCs used on the tests are detailed in
Table 4.
5. Conclusions and General Design Guidelines
This article presents and debates design principles for Robotic Vision Systems targeting real world autonomous mobile robotics running software under soft real time constraints. A common application example is autonomous driving and this article presents a scaled down car, in this case, a robotic platform for the autonomous driving competition of the Portuguese Robotics Open. In many applications, and particularly in the presented robot, the perception is solely vision based and typical robotic vision tasks include interpretation of both flat and 3D scenes coming from several cameras. Considering the presented case study, the recognition of a “flat” scene corresponds to identifying a Signalling Device and the perception of a 3D “scene” relates to lane tracking. The utilized robot has two cameras and runs perception and high level control software in a changeable platform of PC class. The tests were run using several distributions of the Linux operating system. The two mentioned vision tasks (signalling recognition and track following) are presented and then adapted/improved to follow interesting robotic real time vision guidelines.
The proposed general guidelines are:
- (1)
Use the structure of the problem to define the working limits of the algorithms (the algorithm does not have to work outside of the “rules” of the problem).
- (2)
Try to recognize Real Time limits for your problem by finding lowest safe working frequency (for both the perception and the control loops); additionally, try to minimize latency of the closed loop information travel inside the system from perception to control (including decision)—the perception, decision and control loop.
- (3)
Plan debug and visualization features to run at a lower rate than other tasks, preferably in a separate task; if this is complex, preferably run debug and visualization after the perception, decision and control loop.
- (4)
Robotic vision is information intensive: try to use as low resolution as possible in the initial image (naturally without loosing relevant data).
- (5)
Design algorithms so that information is reduced as quickly as possible, particularly do not visit same data structure more than once and do not copy raw data; if possible, calculate all results with a single pass on the data structure (in short, the motto of “zero copy, one pass”).
- (6)
Presently, real world robotic vision tasks mostly deal with semi-structured environment and practitioners recognize that there is a trade-off between accuracy and low computing power.
- (7)
Use high level programming languages and Consumer Of The Shelf (COTS) hardware to allow choosing from many different hardware platforms that are currently available from the results of the profiling (execution times of the application).
- (8)
The practitioner should acutely be aware that running hardware more powerful than necessary or an algorithm doing excessive processing above what is strictly necessary will drain valuable energy from the batteries; separate and run tasks only as needed; use profiling tools to optimize relevant algorithms.
- (9)
Plan and run tests for the safety, security and Real-Time compliance that need to be addressed.
From the presented guidelines, the signalling panels are recognized without any perspective correction and the decision tree algorithm is run from data coming from half of the pixels of the image. All the images on the dataset with 5000 frames were recognized correctly (no missing values, no wrong recognitions). Naturally, this result arises from the definition (“easiness”) of the problem and if tested elsewhere the presented algorithm will inevitably fail (more perspective, further away).
Under the same guidelines, the 3D perception used only the IPM algorithm for meaningful pixels, such as starting edges (left to right) of the lines of the track. The accuracy of the proposed method yields about 3 cm in distance tracking and five degrees in angle measurement, for the dataset of 3 min of video coming from a real driving situation, containing frequent purposeful oscillations on the track.
The improved “fast” algorithms are comparable to previous “slow” ones and prove to be better than most of the state of art for this application, such as Ribeiro et al. in [
30]. Execution time improvements range from almost 200 times to 1.6 times (time_slow_algorithm/time_fast_algorithm) for the same hardware, with the same input videos. For the shown platforms, improvements seem to be even more relevant in low processing power hardware platforms than for hi-end computing platforms. Tests on the well known Raspberry Pi 1 displayed the largest improvements for the presented algorithms—this makes sense because resource economy is more relevant when they are scarcer.
The guidelines above are thought to be of general application and they demonstrate dramatic improvements that are enough to determine the viability of the project as a whole or at least help choose an adequate hardware processing platform that, in turn, will allow to optimize the overall cost of the project (example: reduce battery size). With the optimized algorithms and for the shown vision tasks, the second most inexpensive platform (Raspberry Pi 2) can be chosen, with associated energy savings, even more relevant for battery-based systems. The mentioned platform was successfully tested in autonomous driving competition of the Portuguese Robotics Open.
Regarding the case study, future work includes better profiling inside the perception, decision and control loop, even better separation of debug tools and measuring latency times. Another study of interest would be multi-core distribution of tasks on several platforms.


