
Hydrological Modeling of Green Infrastructure to Quantify Its Effect on Flood Mitigation and Water Availability in the High School Watershed in Tucson, AZ

Abstract
:1. Introduction
2. Materials and Methods
2.1. Study Area
2.2. KINEROS2 Model
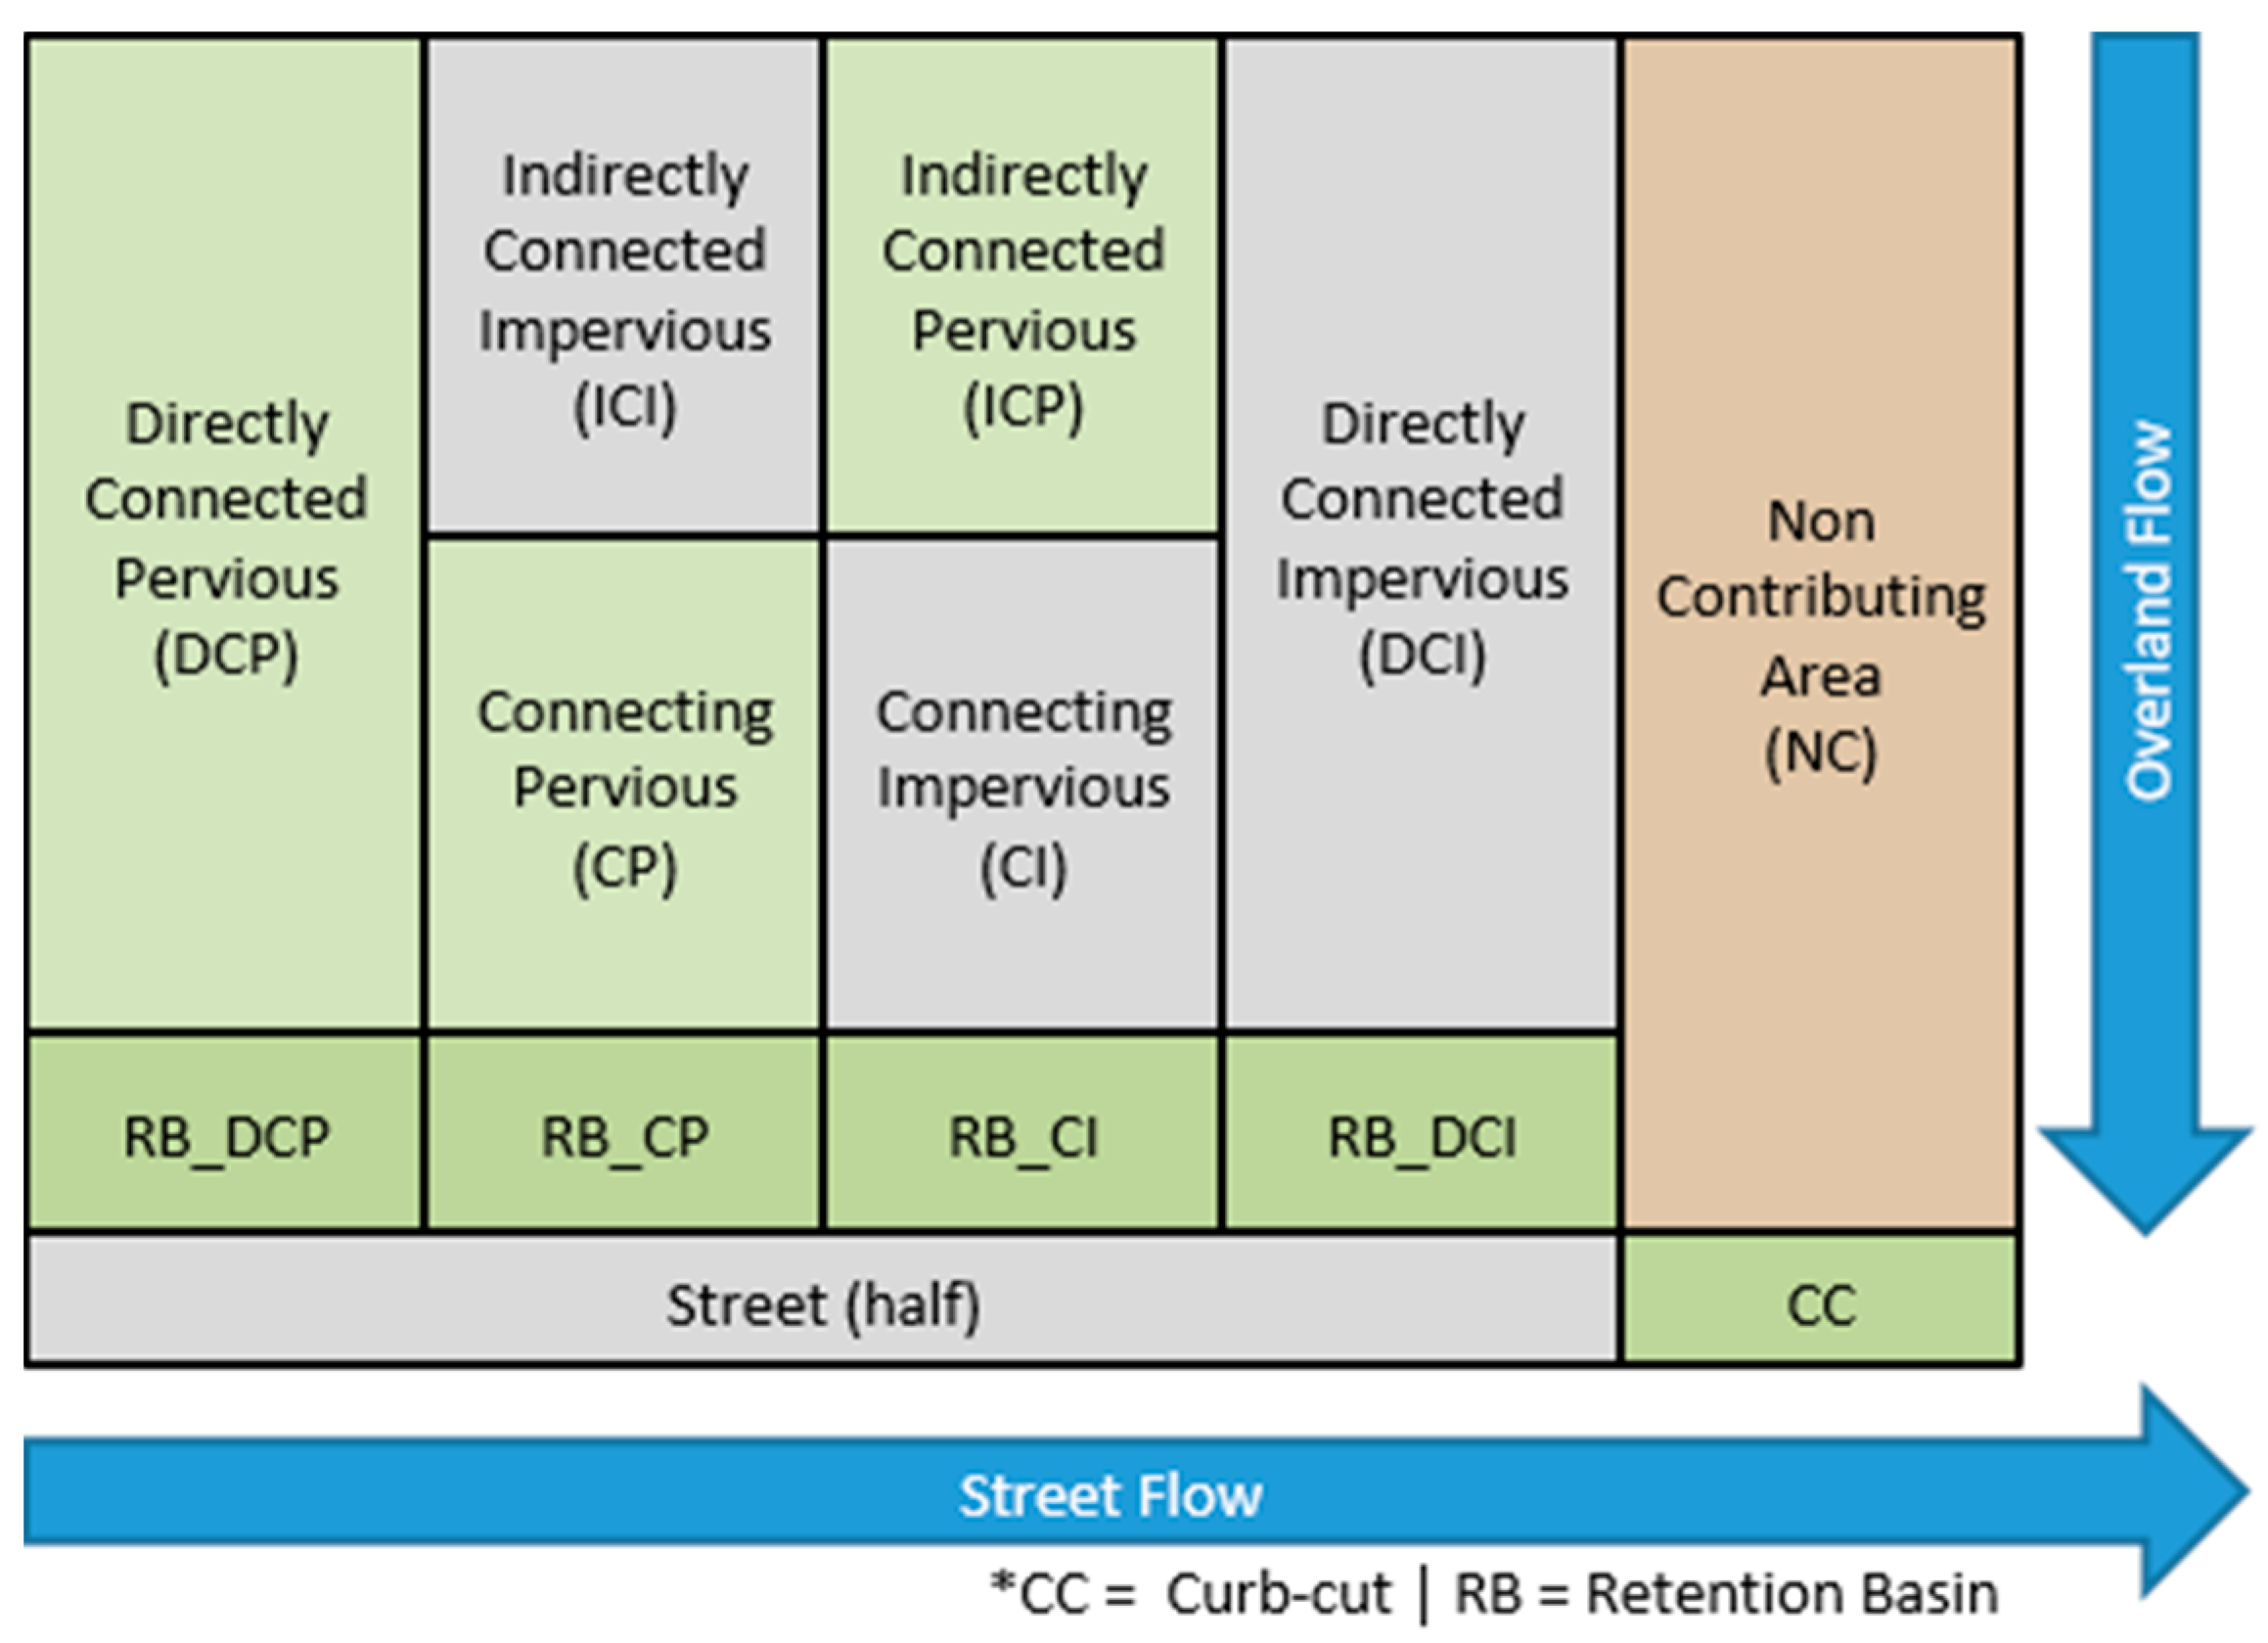
2.3. Model Configurations
3. Results & Discussion
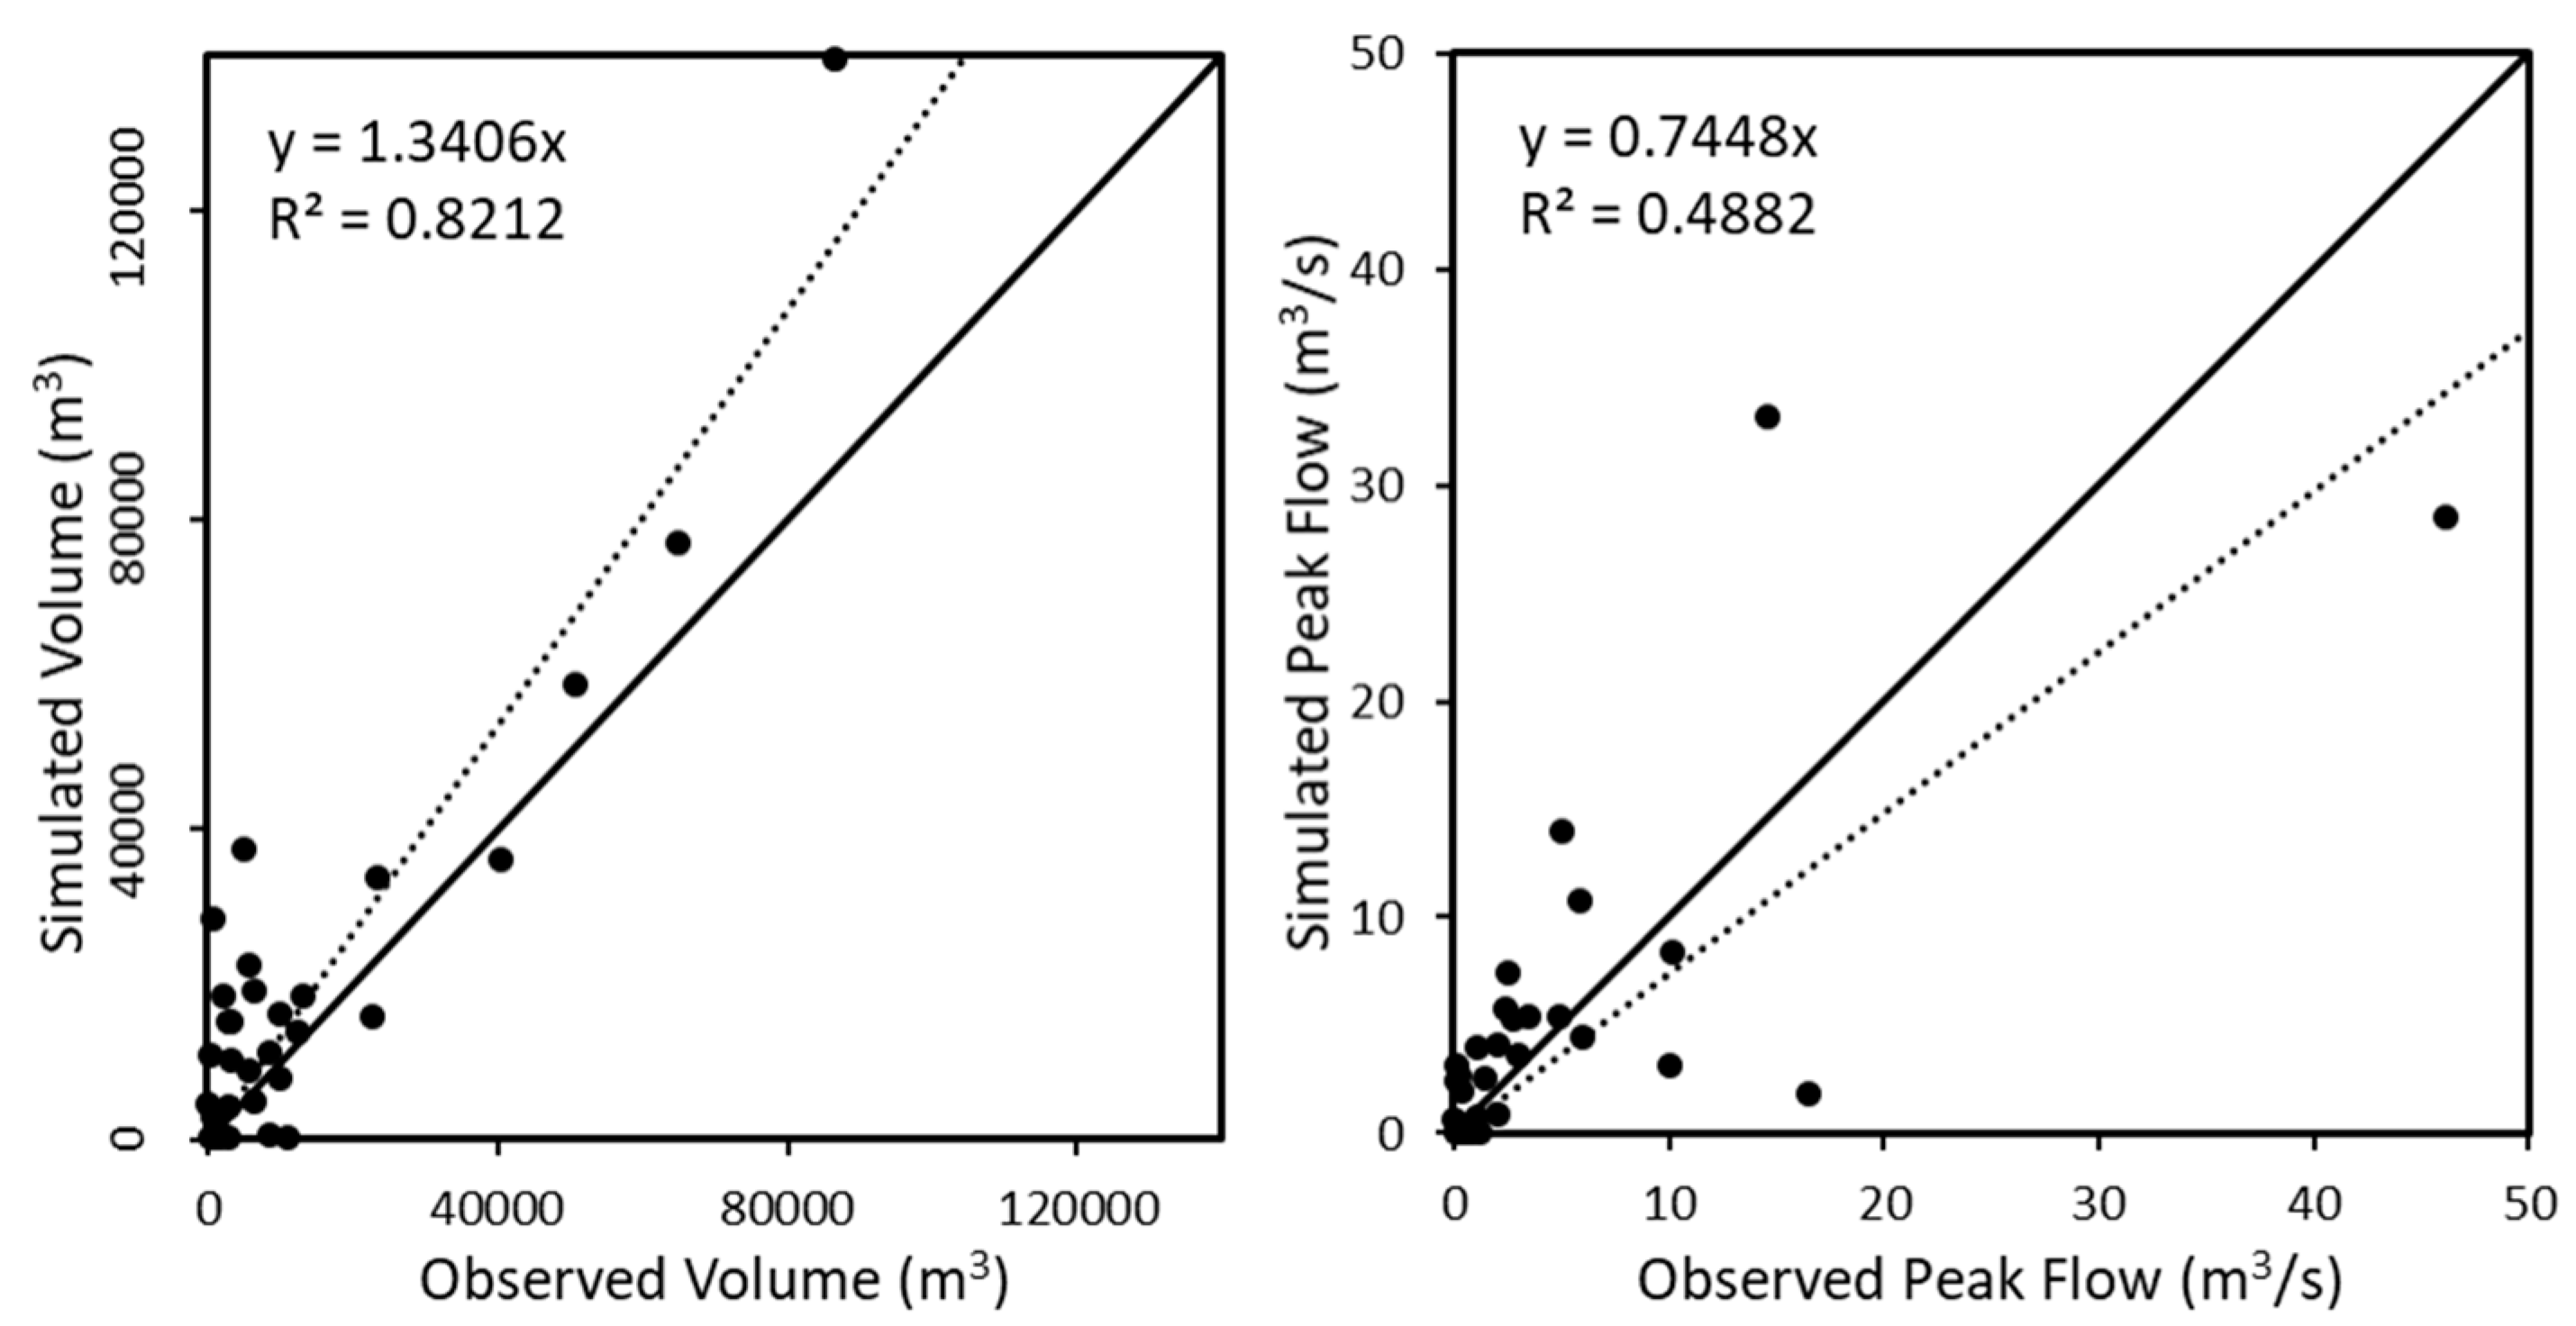
3.1. Model Validation
3.2. Design Storm Analysis
3.3. 20-Year Analysis
4. Conclusions
- 1.
- In the High School watershed, the current level of implementation of GI practices (175 on-street basins and 37 roof runoff harvesting cisterns) does not significantly impact peak flow and runoff volumes at the watershed outlet. However, on-street basins do have an impact at the street and neighborhood scale in reducing nuisance flooding and increasing infiltration, thereby enabling the growth of xeric vegetation. Similarly, roof runoff harvesting cisterns have an impact at the parcel scale by storing and providing water for landscaping purposes.
- 2.
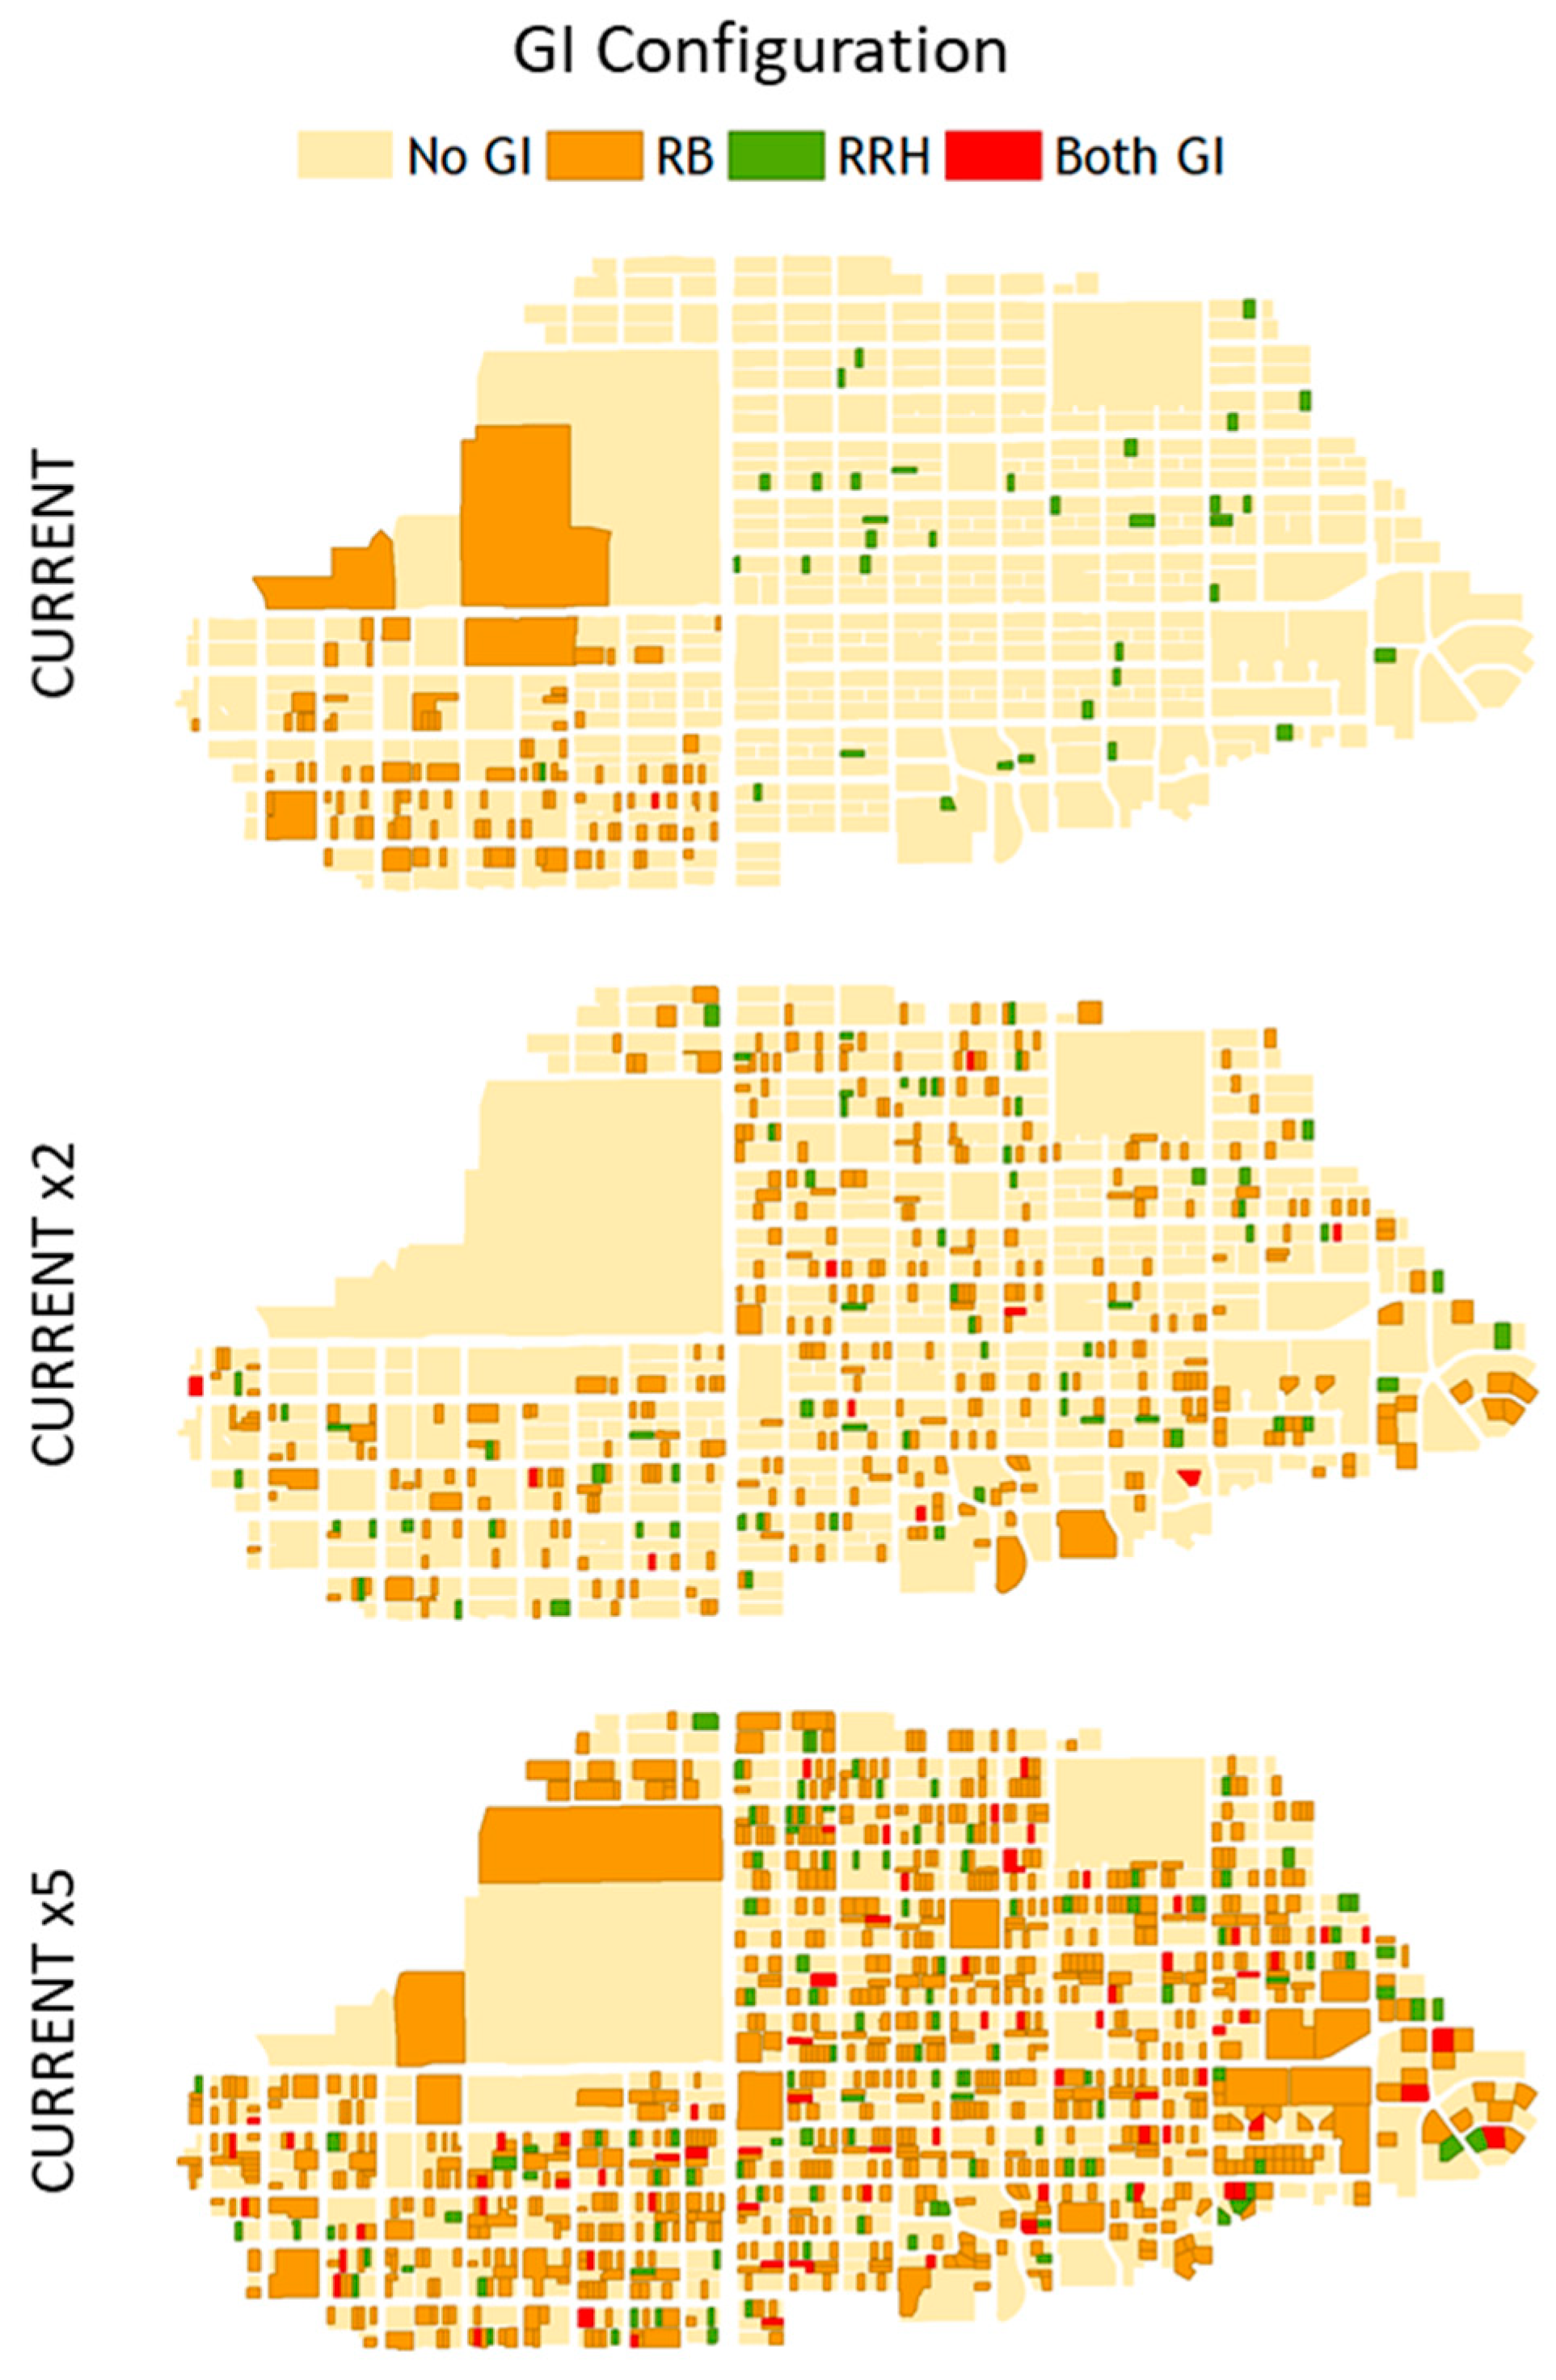
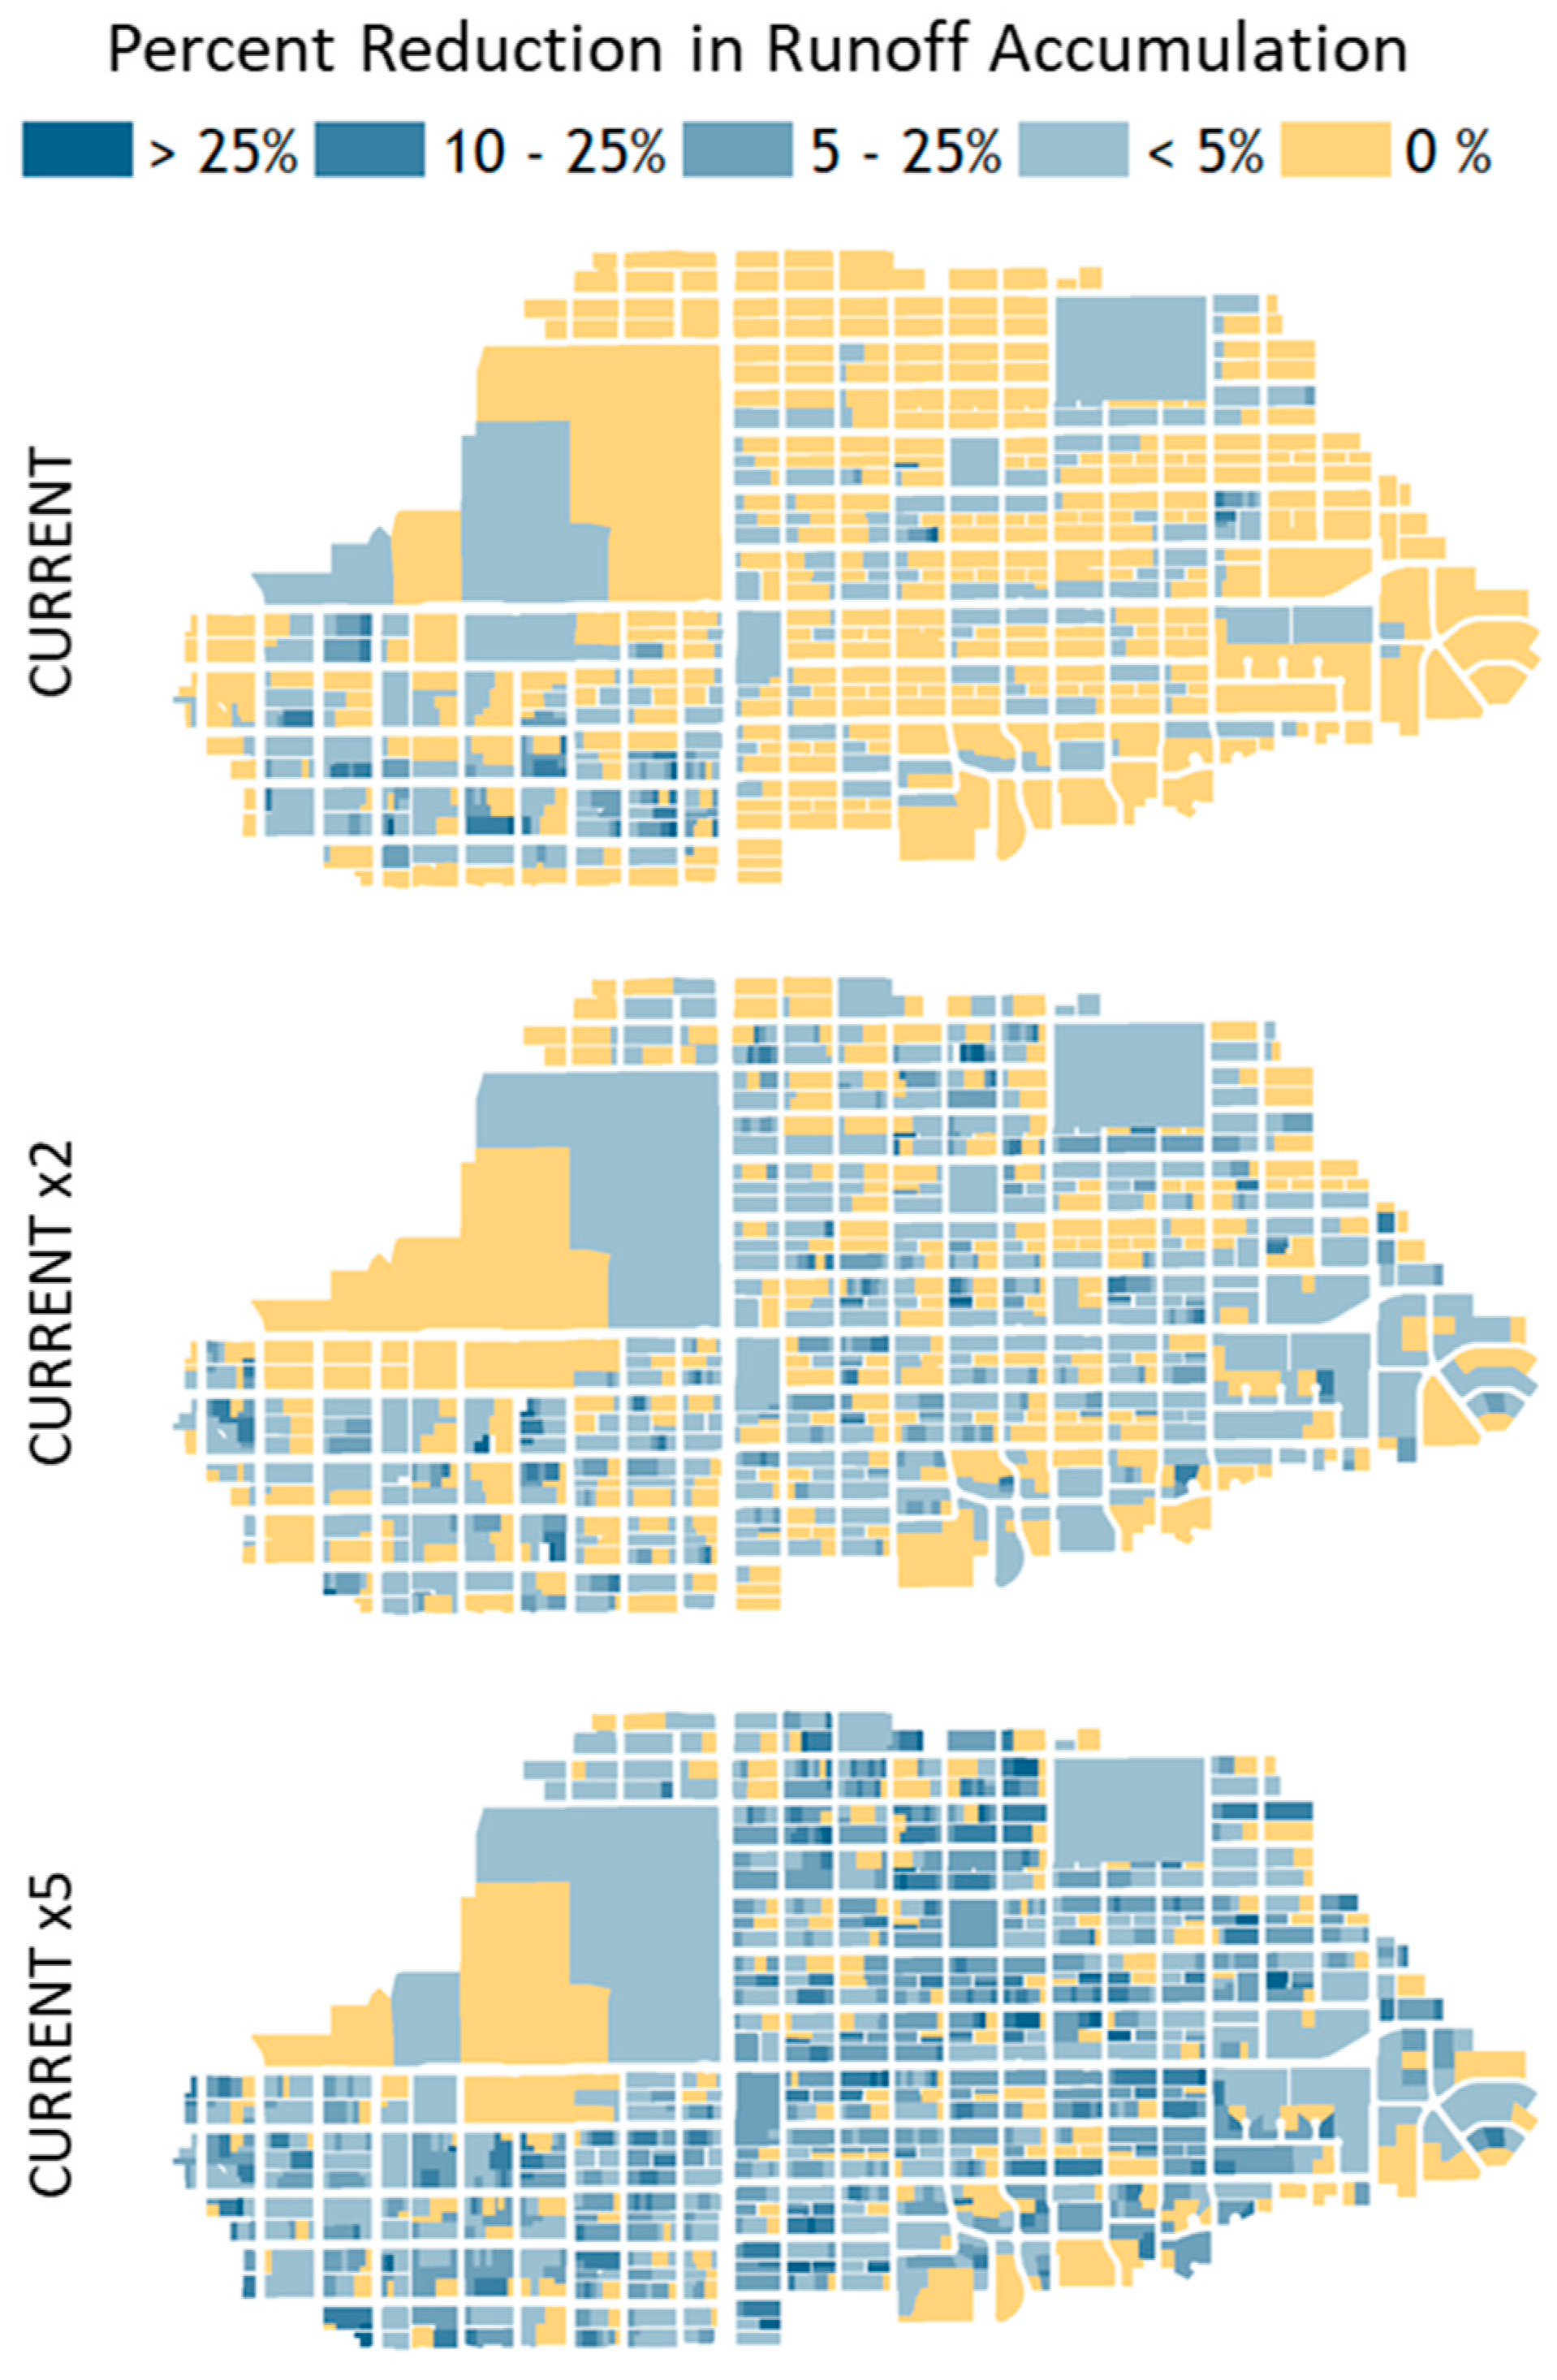
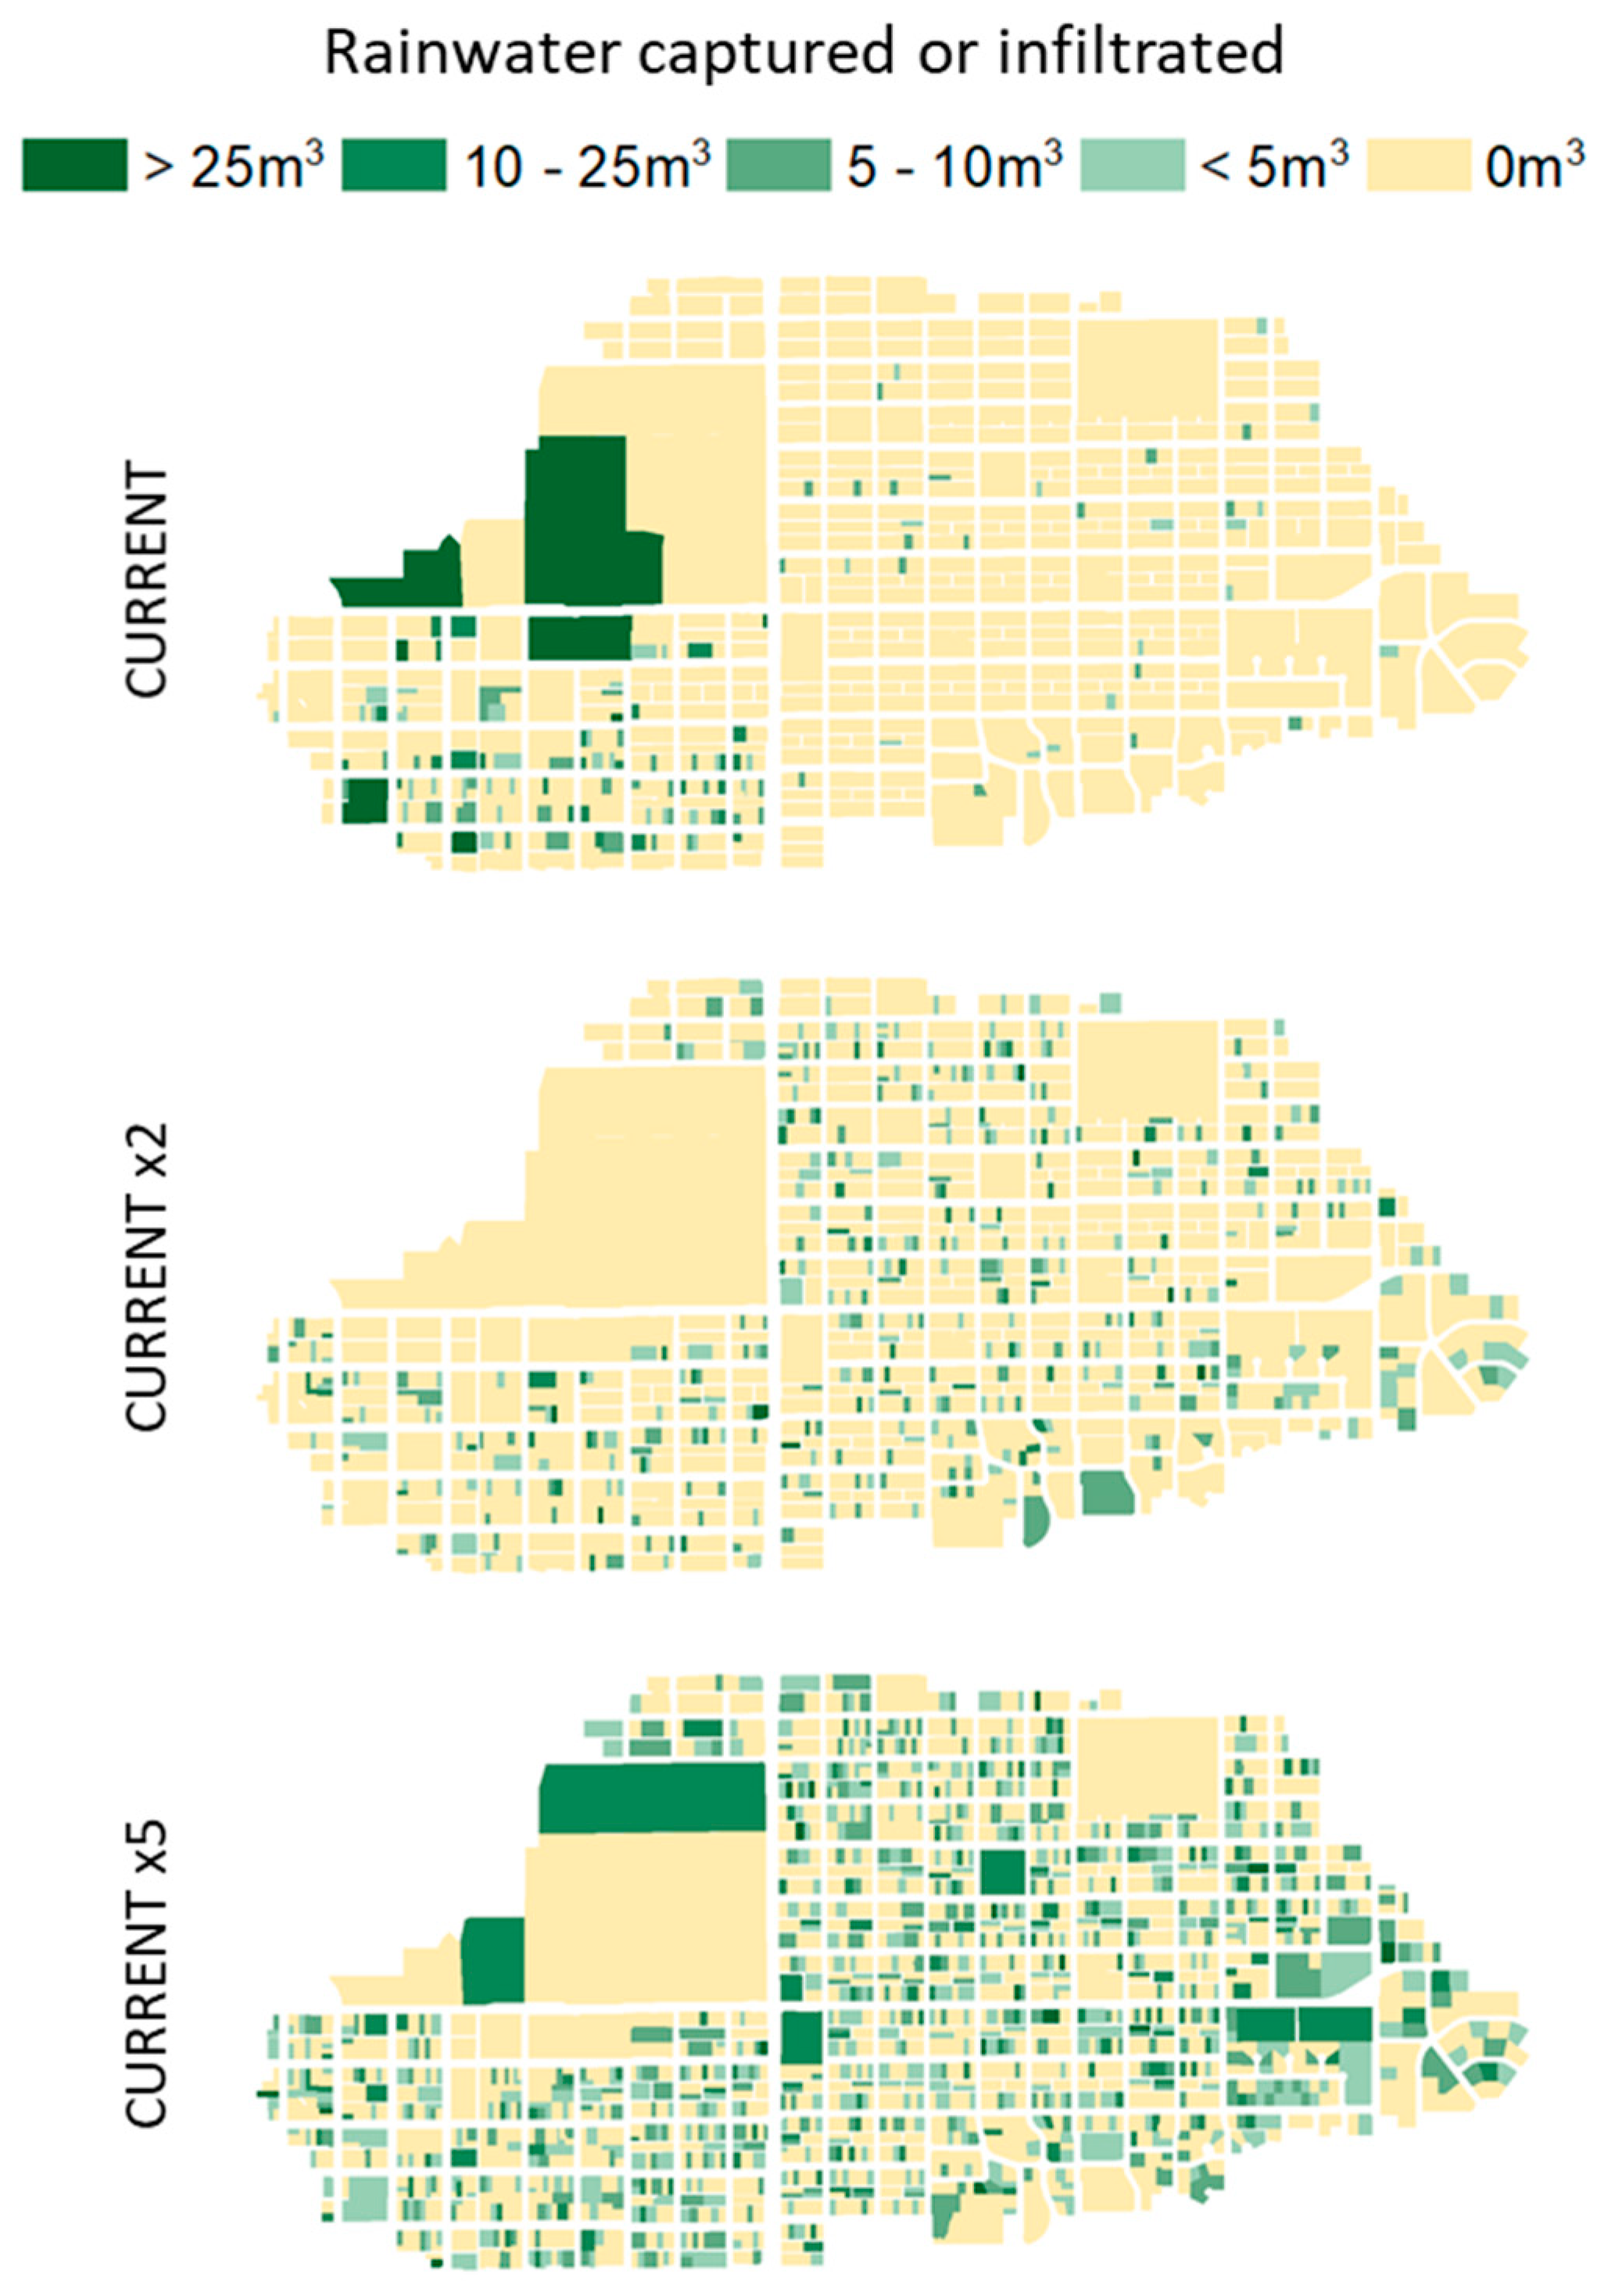
- This study highlights the need for greater GI implementation to achieve large-scale benefits, and the opportunity for improvement does exist in this watershed. Only 37 parcels out of 2177 in the watershed have roof runoff harvesting cisterns. Similarly, only the lower part of the watershed has on-street basins implemented. Increasing GI implementation by a factor of two has the potential to reduce peak flow and runoff volume at the watershed outlet by up to 7% and 3%, respectively. Similarly, a five-fold increase in GI implementation has the potential of reducing peak flow up to 22% and runoff volume up to 7%. To meet pre-development levels of volume and peak flow in the watershed, GI implementation must exceed more than the five-fold the current implementation. However, it is important to consider whether pre-development numbers are desirable and the impact they might have on water availability for use throughout the watershed. Impervious area due to streets is 25% of the total area in the High School watershed. It would be prudent to target the capture of stormwater generated from this highly connected network of impervious area as discussed by studies for other locations [37,38].
- 3.
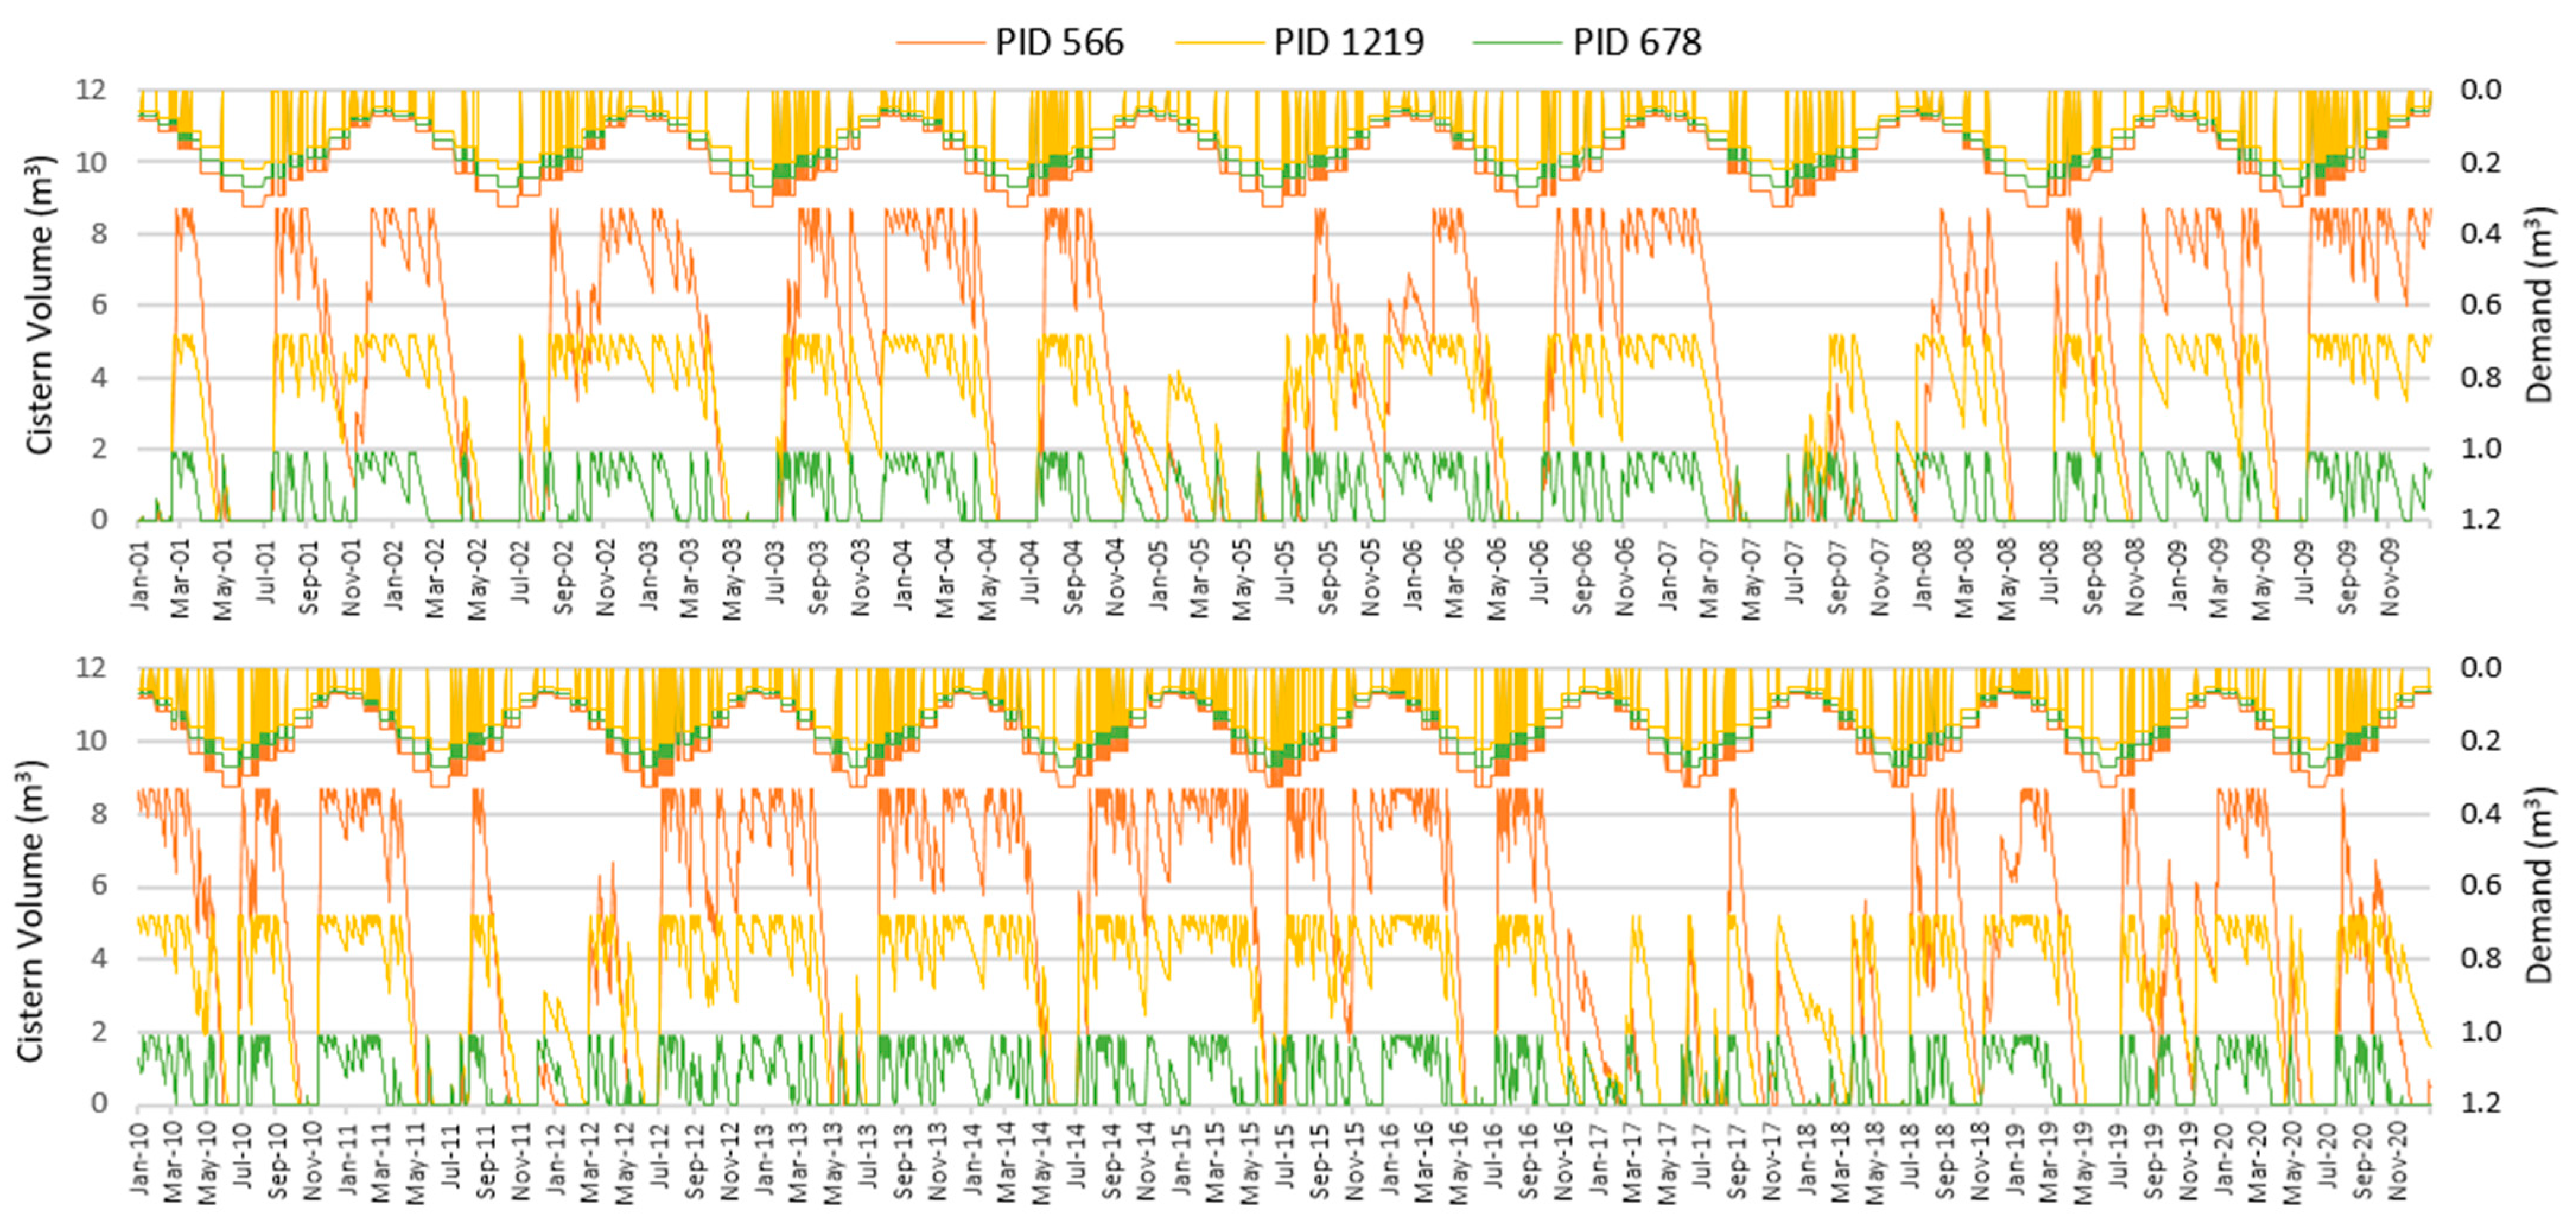
- Based on the 20-year simulation, the volume of water infiltrated in on-street basins can support vegetation for most of the year, except for the month of June, when vegetation may need to rely on active irrigation to meet water needs. Similarly, parcels with roof runoff harvesting cisterns can meet their landscape irrigation demands throughout the year, except for the dry months of May and June. Thus, xeriscape water requirements can be substantially augmented by capturing roof runoff in this region. Additionally, cisterns must be sized appropriately to optimize capture, storage, and water use on any parcel.
Author Contributions
Funding
Data Availability Statement
Acknowledgments
Conflicts of Interest
References
- Gober, P. Desert urbanization and the challenges of water sustainability. Curr. Opin. Environ. Sustain. 2010, 2, 144–150. [Google Scholar] [CrossRef]
- County, P.G.S.; June, M.D. Low-Impact Development Design Strategies: An Integrated Design Approach; Department of Environmental Resources, Programs and Planning Division: Prince George’s County, MD, USA, 1999. Available online: http://water.epa.gov/polwaste/green/upload/lidnatl.pdf (accessed on 28 June 2021).
- Dietz, M.E. Low impact development practices: A review of current research and recommendations for future directions. Water Air Soil Poll. 2007, 186, 351–363. [Google Scholar] [CrossRef]
- Eckart, K.; McPhee, Z.; Bolisetti, T. Performance and implementation of low impact development—A review. Sci. Total Environ. 2017, 607, 413–432. [Google Scholar] [CrossRef]
- Fletcher, T.D.; Shuster, W.; Hunt, W.F.; Ashley, R.; Butler, D.; Arthur, S.; Mikkelsen, P.S. SUDS, LID, BMPs, WSUD and more–The evolution and application of terminology surrounding urban drainage. Urban Water J. 2015, 12, 525–542. [Google Scholar] [CrossRef]
- Liu, Y.; Engel, B.A.; Flanagan, D.C.; Gitau, M.W.; McMillan, S.K.; Chaubey, I. A review on effectiveness of best management practices in improving hydrology and water quality: Needs and opportunities. Sci. Total Environ. 2017, 601, 580–593. [Google Scholar] [CrossRef]
- Li, D.; Bou-Zeid, E.; Oppenheimer, M. The effectiveness of cool and green roofs as urban heat island mitigation strategies. Environ. Res. Lett. 2014, 9, 055002. [Google Scholar] [CrossRef]
- Norton, B.A.; Coutts, A.M.; Livesley, S.J.; Harris, R.J.; Hunter, A.M.; Williams, N.S. Planning for cooler cities: A framework to prioritise green infrastructure to mitigate high temperatures in urban landscapes. Landsc. Urban Plan. 2015, 134, 127–138. [Google Scholar] [CrossRef]
- Santamouris, M. Cooling the cities—A review of reflective and green roof mitigation technologies to fight heat island and improve comfort in urban environments. Sol. Energy 2014, 103, 682–703. [Google Scholar] [CrossRef]
- Yang, J.; Bou-Zeid, E. Scale dependence of the benefits and efficiency of green and cool roofs. Landsc. Urban Plan. 2019, 185, 127–140. [Google Scholar] [CrossRef]
- Abhijith, K.V.; Kumar, P.; Gallagher, J.; McNabola, A.; Baldauf, R.; Pilla, F.; Pulvirenti, B. Air pollution abatement performances of green infrastructure in open road and built-up street canyon environments—A review. Atmos. Environ. 2017, 162, 71–86. [Google Scholar] [CrossRef]
- Bottalico, F.; Chirici, G.; Giannetti, F.; De Marco, A.; Nocentini, S.; Paoletti, E.; Travaglini, D. Air pollution removal by green infrastructures and urban forests in the city of Florence. Agric. Agric. Sci. Proc. 2016, 8, 243–251. [Google Scholar] [CrossRef] [Green Version]
- Jayasooriya, V.M.; Ng, A.W.M.; Muthukumaran, S.; Perera, B.J.C. Green infrastructure practices for improvement of urban air quality. Urban For. Urban Green. 2017, 21, 34–47. [Google Scholar] [CrossRef]
- Ortolani, C.; Vitale, M. The importance of local scale for assessing, monitoring and predicting of air quality in urban areas. Sustain. Cities Soc. 2016, 26, 150–160. [Google Scholar] [CrossRef]
- Coutts, C.; Hahn, M. Green infrastructure, ecosystem services, and human health. Int. J. Environ. Res. Publ. Health 2015, 12, 9768–9798. [Google Scholar] [CrossRef] [Green Version]
- Douglas, O.; Lennon, M.; Scott, M. Green space benefits for health and well-being: A life-course approach for urban planning, design and management. Cities 2017, 66, 53–62. [Google Scholar] [CrossRef] [Green Version]
- Suppakittpaisarn, P.; Jiang, X.; Sullivan, W.C. Green Infrastructure, green stormwater infrastructure, and human health: A review. Curr. Landsc. Ecol. Rep. 2017, 2, 96–110. [Google Scholar] [CrossRef] [Green Version]
- Tzoulas, K.; Korpela, K.; Venn, S.; Yli-Pelkonen, V.; Kaźmierczak, A.; Niemela, J.; James, P. Promoting ecosystem and human health in urban areas using Green Infrastructure: A literature review. Landsc. Urban Plan. 2007, 81, 167–178. [Google Scholar] [CrossRef] [Green Version]
- Hopton, M.; Simon, M.; Borst, M.; Garmestani, A.; Jacobs, S.; Lye, D. Green Infrastructure for Stormwater Control: Gauging its Effectiveness with Community Partners. 2015; EPA/600/R-15/219. Available online: https://nepis.epa.gov/Exe/ZyPURL.cgi?Dockey=P100NE3S.txt (accessed on 28 June 2021).
- Smith, R.E.; Goodrich, D.C.; Woolhiser, D.A.; Unkrich, C.L. KINEROS-A kinematic runoff and erosion model. Comput. Models Watershed Hydrol. 1995, 20, 627–668. [Google Scholar]
- Goodrich, D.C.; Burns, I.S.; Unkrich, C.L.; Semmens, D.J.; Guertin, D.P.; Hernandez, M.; Levick, L.R. KINERSO2/AGWA: Model use, calibration, and validation. Trans. Am. Soc. Agric. Biol. Eng. 2012, 55, 1561–1574. [Google Scholar] [CrossRef]
- Parlange, J.Y.; Lisle, I.; Braddock, R.D.; Smith, R.E. The three-parameter infiltration equation. Soil Sci. 1982, 133, 337–341. [Google Scholar] [CrossRef]
- Kennedy, J.R.; Goodrich, D.C.; Unkrich, C.L. Using the KINEROS2 modeling framework to evaluate the increase in storm runoff from residential development in a semiarid environment. J. Hydrol. Eng. 2013, 18, 698–706. [Google Scholar] [CrossRef] [Green Version]
- Korgaonkar, Y.; Guertin, D.P.; Goodrich, D.C.; Unkrich, C.; Kepner, W.; Burns, I.S. Modeling Urban Hydrology and Green Infrastructure using the AGWA Urban Tool and the KINEROS2 Model. Front. Built Environ. 2018, 4, 58. [Google Scholar] [CrossRef] [Green Version]
- Korgaonkar, Y.; Meles, M.B.; Guertin, D.P.; Goodrich, D.C.; Unkrich, C. Global sensitivity analysis of KINEROS2 hydrologic model parameters representing green infrastructure using the STAR-VARS framework. Environ. Modell. Software 2020, 132, 104814. [Google Scholar] [CrossRef]
- Miller, S.N.; Semmens, D.J.; Goodrich, D.C.; Hernandez, M.; Miller, R.C.; Kepner, W.G.; Guertin, D.P. The automated geospatial watershed assessment tool. Environ. Modell. Softw. 2007, 22, 365–377. [Google Scholar] [CrossRef]
- Arnold, J.G.; Srinivasan, R.; Muttiah, R.S.; Williams, J.R. Large-area hydrologic modeling and assessment: Part, I. Model Development. J. Am. Water Resour. Assoc. 1998, 34, 73–89. [Google Scholar] [CrossRef]
- Nearing, M.A.; Wei, H.; Stone, J.J.; Pierson, F.B.; Spaeth, K.E.; Weltz, M.A.; Hernandez, M. A rangeland hydrology and erosion model. Trans. Am. Soc. Agric. Biol. Eng. 2011, 54, 901–908. [Google Scholar] [CrossRef]
- Chow, V.T. Open-channel hydraulics. In Open-Channel Hydraulics; McGraw-Hill: New York, NY, USA, 1959. [Google Scholar]
- Anderson, J.; Ferre, T.; Whitaker, M.; Winter, L. Analysis and Classification of Semi-Arid Bioswales in an Urban Setting. Ph.D. Thesis, The University of Arizona, Tucson, AZ, USA, 2018. [Google Scholar]
- Nicks, A.D.; Gander, G.A. CLIGEN: A weather generator for climate inputs to water resource and other models. Proc. Fifth Int. Conf. Comput. Agric. 1994, 4, 903–909. [Google Scholar]
- Rawls, W.J.; Brakensiek, D.L.; Saxtonn, K.E. Estimation of soil water properties. Trans. ASAE 1982, 25, 1316–1320. [Google Scholar] [CrossRef]
- Waterfall, Patricia. Harvesting Rainwater for Landscape Use; The University of Arizona: Tucson, AZ, USA, 2011; Available online: http://hdl.handle.net/10150/144825 (accessed on 28 June 2021).
- Cable, D.R. Seasonal use of soil water by mature velvet mesquite. Rangel. Ecol. Manag. J. Range Manag. Arch. 1977, 30, 4–11. [Google Scholar] [CrossRef]
- Stabler, L.B.; Martin, C.A. Irrigation regimens differentially affect growth and water use efficiency of two southwest landscape plants. J. Environ. Hortic. 2000, 18, 66–70. [Google Scholar] [CrossRef]
- Martin, C.A. Landscape Water Use in Phoenix, Arizona; CALS Publications Archive: New York, NY, USA, 2015; Available online: http://hdl.handle.net/10150/554334 (accessed on 28 June 2021).
- Yang, Y.; Endreny, T.A.; Nowak, D.J. Simulating the effect of flow path roughness to examine how green infrastructure restores urban runoff timing and magnitude. Urban For. Urban Green. 2015, 14, 361–367. [Google Scholar] [CrossRef]
- Zellner, M.; Massey, D.; Minor, E.; Gonzalez-Meler, M. Exploring the effects of green infrastructure placement on neighborhood-level flooding via spatially explicit simulations. Comput. Environ. Urban Syst. 2016, 59, 116–128. [Google Scholar] [CrossRef] [Green Version]
- Braden, J.B.; Johnston, D.M. Downstream economic benefits from storm-water management. J. Water Resour. Plann. Manag. 2004, 130, 498–505. [Google Scholar] [CrossRef]
- Alves, A.; Gersonius, B.; Kapelan, Z.; Vojinovic, Z.; Sanchez, A. Assessing the Co-Benefits of green-blue-grey infrastructure for sustainable urban flood risk management. J. Environ. Manag. 2019, 239, 244–254. [Google Scholar] [CrossRef]
- Meerow, S.; Newell, J.P. Spatial planning for multifunctional green infrastructure: Growing resilience in Detroit. Landsc. Urban Plann. 2017, 159, 62–75. [Google Scholar] [CrossRef]
- Calderón-Contreras, R.; Quiroz-Rosas, L.E. Analysing scale, quality and diversity of green infrastructure and the provision of Urban Ecosystem Services: A case from Mexico City. Ecosyst. Serv. 2017, 23, 127–137. [Google Scholar] [CrossRef]
- Elmqvist, T.; Setälä, H.; Handel, S.N.; Van Der Ploeg, S.; Aronson, J.; Blignaut, J.N.; De Groot, R. Benefits of restoring ecosystem services in urban areas. Curr. Opin. Environ. Sustain. 2015, 14, 101–108. [Google Scholar] [CrossRef] [Green Version]
- Nickel, D.; Schoenfelder, W.; Medearis, D.; Dolowitz, D.P.; Keeley, M.; Shuster, W. German experience in managing stormwater with green infrastructure. J. Environ. Plan. Manag. 2014, 57, 403–423. [Google Scholar] [CrossRef]
- Pima County. Low Impact Development and Green Infrastrcuture Guidance Manual. 2015. Available online: https://webcms.pima.gov/UserFiles/Servers/Server_6/File/Government/Flood%20Control/Floodplain%20Management/Low%20Impact%20Development/li-gi-manual-20150311.pdf (accessed on 28 June 2021).


| Model Inputs | Parameters |
| Parcels via Geospatial Data | Dimensions, slope, fractional areas of urban overland flow areas |
| Streets via Geospatial Data | Width, grade, and cross slope |
| Land Cover | Hydraulic roughness, interception depths, and canopy cover fractions |
| Soils via SSURGO soils data | Hydraulic conductivity, coefficient of variance of Ks, mean capillary drive, porosity, pore distribution index, and volumetric rock fraction |
| GI Practices | Location, size, depth and hydraulic conductivity of basins, and volume of cistern |
| Model Outputs | Parameters |
| Parcel Scale | Runoff volume, infiltration volume, peak flow, and GI storage volumes |
| Watershed Scale | Total runoff volume, total infiltration volume, and peak flow at outlet |
| Configuration | Description |
|---|---|
| NO GI | No GI implementation |
| CURRENT | Current GI Implementation: 175 On-street basins 1 and 37 roof runoff harvesting cisterns 2 |
| CURRENT ×2 | 350 On-street basins 1 and 84 roof runoff harvesting cisterns 2 |
| CURRENT ×5 | 840 On-street basins 1 and 185 roof runoff harvesting cisterns 2 |
| PRE-DEV | Pre-development: No impervious area (i.e., houses, driveways, or streets) |
| MAX GI | 99% of front yard and side yard, and 10% of driveway area converted to a retention basin, 0.3 m deep with hydraulic conductivity of 210 mm/h; 3.78 m3 cistern to capture roof runoff; and on-street basin based on City of Tucson guidelines, adhering to minimum right of way |
| Configuration | Percent Change as Compared to NO GI | |||||
|---|---|---|---|---|---|---|
| 5 YR 1 HR | 25 YR 1 HR | 100 YR 1 HR | ||||
| Qp | V | Qp | V | Qp | V | |
| CURRENT | 0.23 | −1.47 | 0.57 | −0.98 | 0.75 | −0.75 |
| CURRENT × 2 | −7.23 | −2.97 | −6.76 | −2.01 | −6.51 | −1.53 |
| CURRENT × 5 | −21.10 | −7.24 | −19.57 | −4.92 | −18.81 | −3.76 |
| PRE-DEV | −38.63 | −32.99 | −28.52 | −24.01 | −22.78 | −19.08 |
| MAX GI | −100.00 | −100.00 | −99.05 | −99.72 | −96.50 | −97.29 |
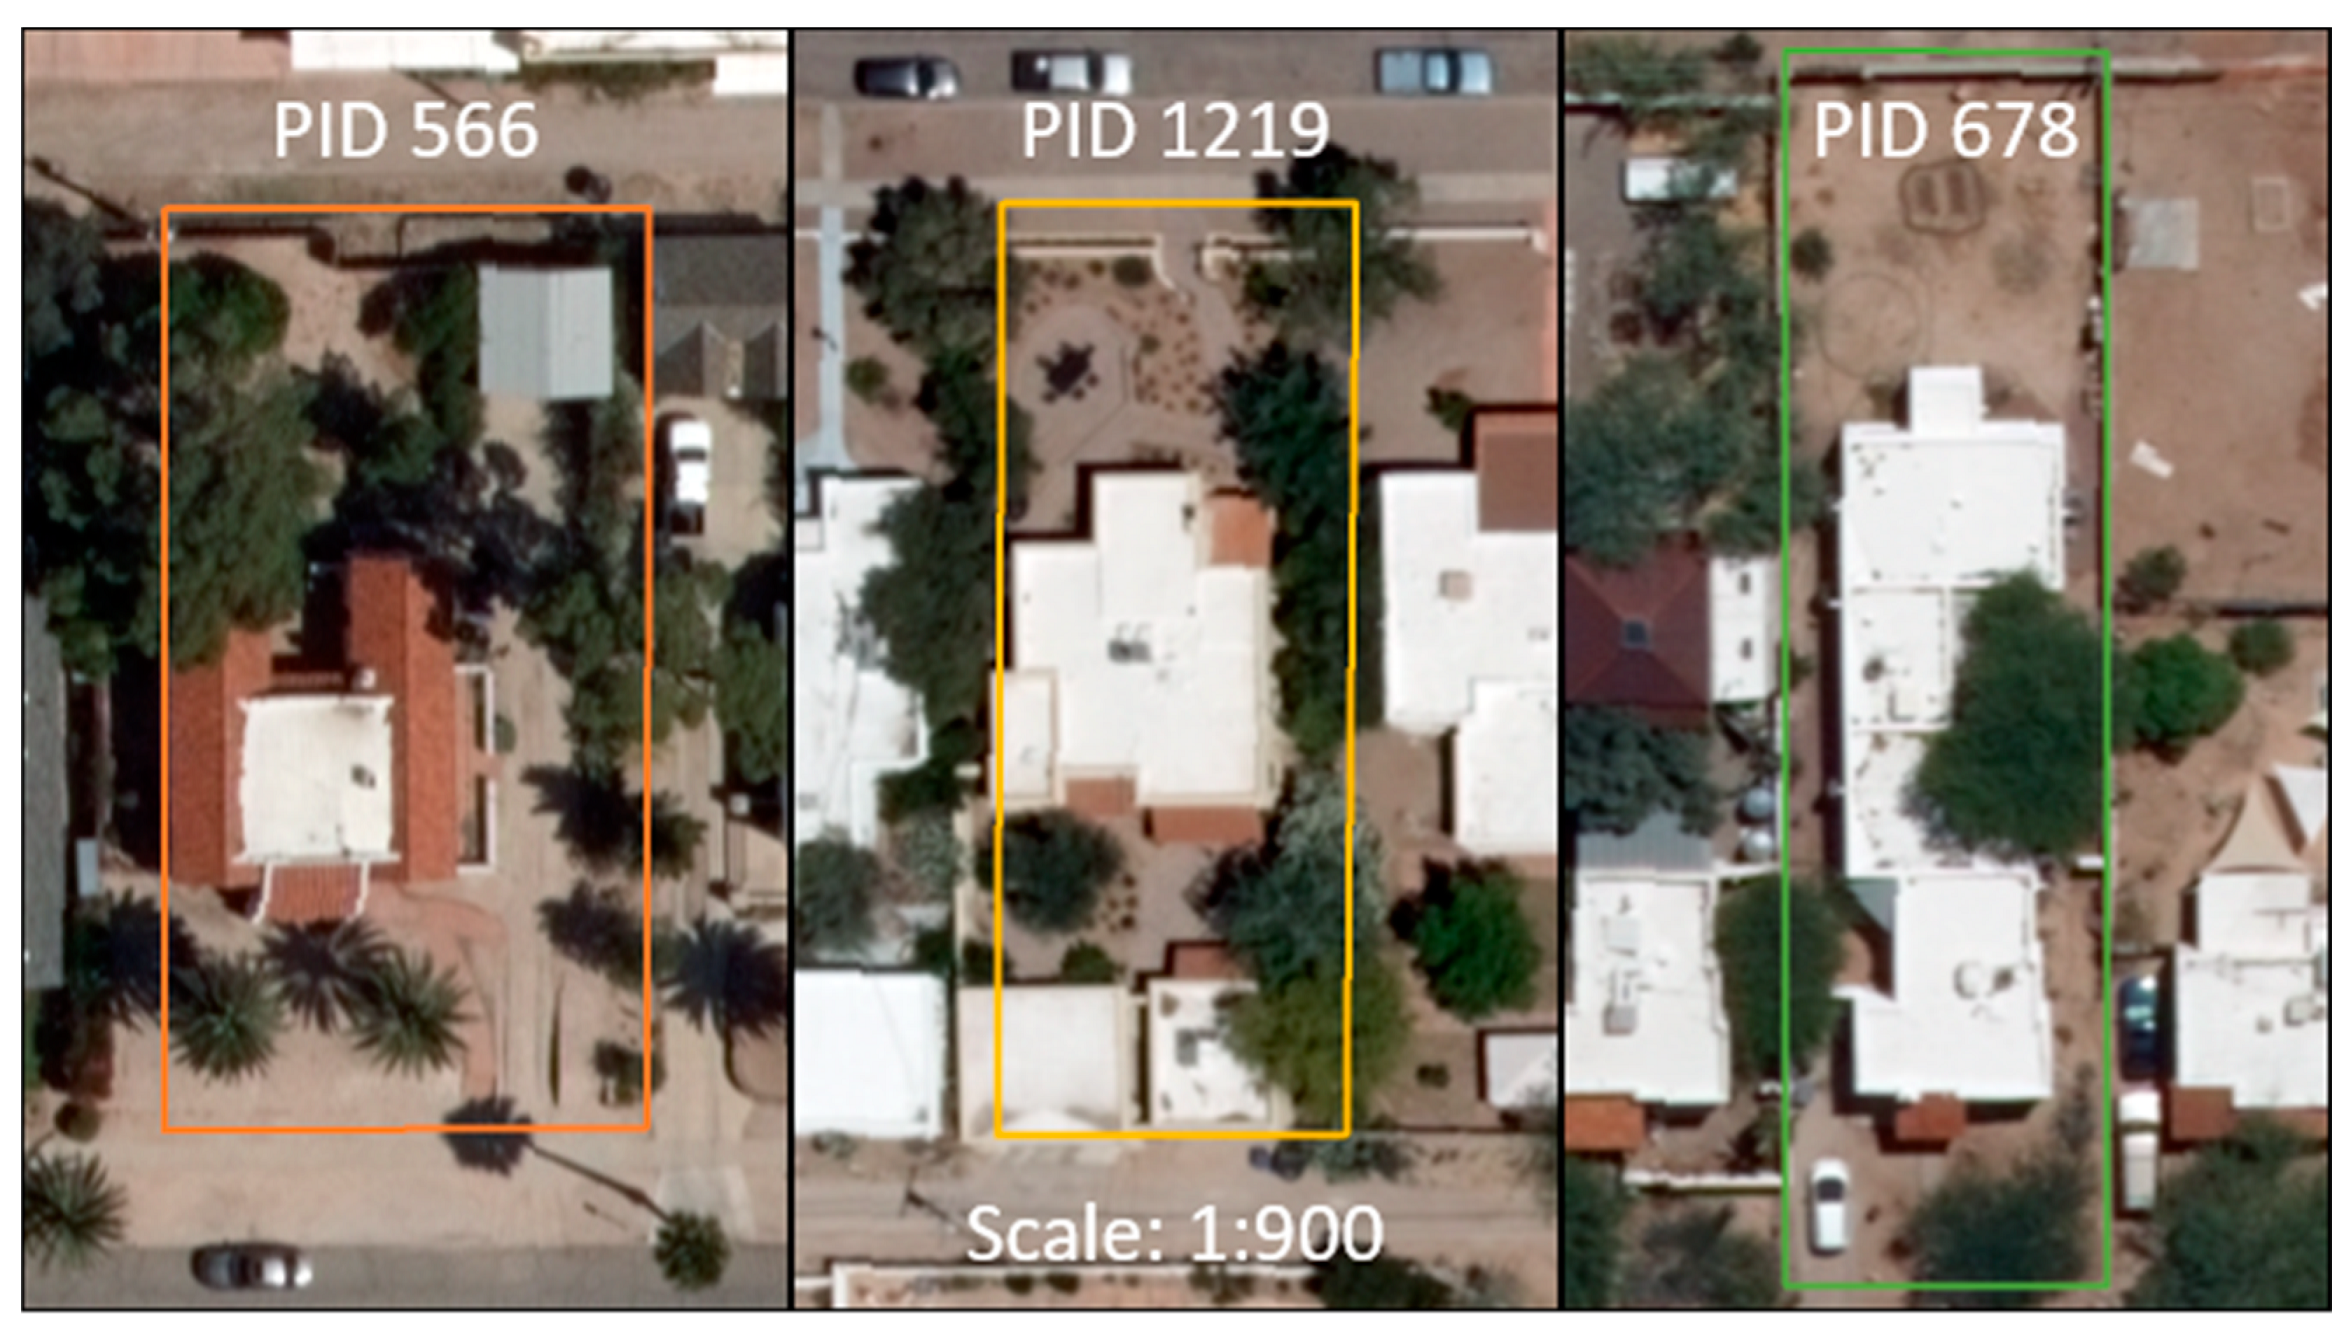
| PID | Parcel Area (m2) | Roof Area (m2) | Irrigated Area (m2) | Cistern Capacity (m3) | # of Days 1 Cistern Was | |
|---|---|---|---|---|---|---|
| Full | Empty | |||||
| 566 | 879.89 | 148.27 | 113.68 | 8.71 | 2301 | 521 |
| 1219 | 650.41 | 223.34 | 77.79 | 5.19 | 1371 | 735 |
| 678 | 785.52 | 226.31 | 95.05 | 1.91 | 505 | 605 |
Publisher’s Note: MDPI stays neutral with regard to jurisdictional claims in published maps and institutional affiliations. |
© 2021 by the authors. Licensee MDPI, Basel, Switzerland. This article is an open access article distributed under the terms and conditions of the Creative Commons Attribution (CC BY) license (https://creativecommons.org/licenses/by/4.0/).
Share and Cite
Korgaonkar, Y.; Guertin, D.P.; Meixner, T.; Goodrich, D.C. Hydrological Modeling of Green Infrastructure to Quantify Its Effect on Flood Mitigation and Water Availability in the High School Watershed in Tucson, AZ. ISPRS Int. J. Geo-Inf. 2021, 10, 443. https://doi.org/10.3390/ijgi10070443
Korgaonkar Y, Guertin DP, Meixner T, Goodrich DC. Hydrological Modeling of Green Infrastructure to Quantify Its Effect on Flood Mitigation and Water Availability in the High School Watershed in Tucson, AZ. ISPRS International Journal of Geo-Information. 2021; 10(7):443. https://doi.org/10.3390/ijgi10070443
Chicago/Turabian StyleKorgaonkar, Yoganand, David Phillip Guertin, Thomas Meixner, and David C Goodrich. 2021. "Hydrological Modeling of Green Infrastructure to Quantify Its Effect on Flood Mitigation and Water Availability in the High School Watershed in Tucson, AZ" ISPRS International Journal of Geo-Information 10, no. 7: 443. https://doi.org/10.3390/ijgi10070443