Article

Multidimensional Urban Vitality on Streets: Spatial Patterns and Influence Factor Identification Using Multisource Urban Data

1
Key Laboratory of Geospatial Technology for the Middle and Lower Yellow River Regions, Ministry of Education, Kaifeng 457004, China
2
College of Geography and Environmental Science, Henan University, Kaifeng 457004, China
3
Urban Big Data Institute, Henan University, Kaifeng 475004, China
4
Centre for Regional Development and Regional Planning, Henan University, Kaifeng 475004, China
5
Henan Industrial Technology Academy of Spatiotemporal Big Data, Henan University, Zhengzhou 450046, China
*
Author to whom correspondence should be addressed.
ISPRS Int. J. Geo-Inf. 2022, 11(1), 2; https://doi.org/10.3390/ijgi11010002
Submission received: 2 October 2021 / Revised: 22 December 2021 / Accepted: 26 December 2021 / Published: 28 December 2021

Abstract

:
Urban vitality is a key indicator for measuring urban development. This topic has been trending in urban planning and sustainable development, and significant progress has been made in measuring single indicators of urban vitality based on parcel or block units. With the continuous development of smart sensing technology, multisource urban data are becoming increasingly abundant. The application of such data to measure the multidimensional urban vitality of street space, reflecting multiple functions of an urban space, can significantly improve the accuracy of urban vitality analyses and promote the construction of people-oriented healthy cities. In this study, streets were taken as the analysis unit, and multisource data such as the trajectories of taxies and shared bicycles, user reviews and cultural facility points of interest (POIs) in Chengdu, a city in southwestern China, were used to identify spatial patterns of urban vitality on streets across social, economic and cultural dimensions. The correlation between the built environment factors and the multidimensional urban vitality on the street was analyzed using a multiple regression model. The spatial distribution of the different dimensions of urban vitality of the street space in Chengdu varies to a certain extent. It is common for areas with high social vitality to have production and life centers nearby. High economic vitality centers are typically found along busy streets with a high concentration of businesses. Areas with high cultural vitality centers tend to be concentrated on the city’s central streets. Land use, transportation, external environment, population and employment are all closely linked to urban vitality on streets. The crowd counting and POI density have the greatest impact on multidimensional urban vitality. The crowd and the level of service facilities profoundly affect social interaction, trade activities and cultural communication. The goodness of fit (R2) of the regression models for social, economic and cultural vitality are 0.590, 0.423 and 0.409, respectively. Using multisource urban data, our findings can help stakeholders better understand the spatial patterns and influencing factors of multidimensional urban vitality on streets and provide sustainable urban planning and development strategies for the future.

1. Introduction

Urban vitality is an indicator that measures a city’s level of development and provides a comprehensive expression of the quality of development of the city [1,2,3]. This indicator is widely used in sociology, architecture, urban planning and design and environmental psychology to represent various understandings of vitality [4,5]. Jacobs [6] defined vitality through the interactions between individuals on the streets and argued that vitality is the product of interactions between people or between people and space. Lynch [7] defines vitality as the degree to which the individual can acquire his/her nutrition, safety and ergonomic needs from the environment, above all his/her survival. Gehl [8] noted that spatial vitality is derived from places, people and their activities, which are the basic elements of urban vitality. Urban vitality describes the attractiveness, functional diversity and mobility of urban space as a result of human activities and interactions [9]. Vibrant urban spaces support diverse human activities, promote social communication and interaction and enhance the sense of security and belonging to urban spaces among residents, thereby contributing to the well-being of residents and promote sustainable urban development [10,11]. These diverse activities include residents’ economic, social and cultural activities, and can be characterized as different dimensions of urban vitality [12]. Although the connotation of urban vitality is constantly evolving, human activities and interactions represent the core focus of this indicator. Urban planners and managers are increasingly interested in quantifying and understanding the characteristics of urban vitality [13] and these characteristics have become a key factor in national strategies for developing healthy cities and improving quality of life [4,14].
Quantitative measurements of urban vitality have attracted attention from many disciplines, such as urban planning, geographic information science and social science. In early studies, urban vitality was mainly characterized through field surveys of human activities, interactions and life experiences, but this approach is limited by costs and small sample sizes [15,16]. With the continuous development of information and communication technology, urban sensing has gradually developed from industry-isolated online sensing to integrated multinetwork sensing [17]. Smart sensing devices can be used to acquire multisource urban data with multiple spatiotemporal resolutions and record the distribution of a large number of human activities [18,19], becoming an essential resource for urban research and urban governance [20,21], and thereby providing a new approach for measuring urban vitality [22,23]. In many studies, the characteristics of social sensing data from different sources [24], including mobile phone data [25,26], social media data [13,22], population heatmap [27], traffic trajectory data [28,29], night light data [30], street view data [31] and WiFi hotspot data [32] have been used as effective proxies for measuring urban vitality. With the increasing abundance of various types of urban data, the characterization of urban vitality has gradually shifted from a single dimension to multiple dimensions, the factors influencing urban vitality have been considered more comprehensively and more researchers have begun to focus on the relationships between urban vitality, land use, the urban landscape and urban growth patterns. Nevertheless, the measurement of urban vitality still poses challenges. The diversity of social, economic and cultural activities in urban spaces makes data from a single source insufficient to comprehensively capture the multidimensional vitality of an urban space. In contrast, multisource urban data can describe multiple dimensions of urban vitality. Thus, it is crucial to integrate multiple data sources to comprehensively understand the distribution pattern of urban vitality and its influencing factors [22,33].
In urban vitality analysis, blocks or land parcels are usually used as the basic unit of analysis [34,35,36]. However, in urban planning and design, the street space is one of the essential complexes of plan elements in addition to the block [4,37]. Streets are part of the urban transportation network, and more attention has been given to their access characteristics. However, as streets form the skeleton of the urban physical form, a variety of economic activities in a city occur on the main streets, and these activities are not merely related to passage but also involve trading, peddling and selling activities. Jacobs [6] argued that streets are the lifeblood of cities rather than mere traffic channels. As a public space with multiple functions such as transportation and economic activities in a city, streets connect urban functions physically and cognitively, and shape the movement and quality of life of people [38,39], with a high level of street accessibility contributing to population concentration and increases in urban vitality [6]. In addition to their transportation functions, streets are the site of many of the daily activities of residents, and play an important role in connecting and strengthening social relations [11]. The use of streets as the analysis unit can enable a more accurate measurement of urban vitality and address potential statistical issues induced by the classic modifiable areal unit problem (MAUP) with block or parcel units, which refers to the effect that both the analysis scale (i.e., the smallest unit under observation) and the study scope considerably affect the statistical outcome [40]. Jalaladdini and Oktay [41] conducted a literature survey and questionnaire survey to analyze the street vitality of Salamis Street in Famagusta and Ziya Rızkı Street in Kyrenia, Cyprus and its influencing factors. A study of street vitality in the Zhoujiadu Community in Shanghai showed that the density and mixing degree of social functions are the main factors influencing street vitality [42]. Guo et al. used mobile phone data and point of interest (POI) data to examine the dynamics of street vitality and the diversity of land uses in the main urban area of Xining, China and to identify street vitality types [43]. Using mobile phone data as a proxy for street vitality, Wu et al. tested the correlation between street vitality and high-density urban built environments using West Nanjing Road in Shanghai as a case study [44]. Using Seoul as a case study, Sung and Lee [16] used walking activity as the dependent variable and constructed a multilevel regression model for street vitality. In these studies, the street was taken as the analysis unit to more accurately describe the distribution characteristics and influencing factors of urban vitality. However, studies on the comprehensive measurement of the multidimensional vitality of streets using multisource data remains limited.
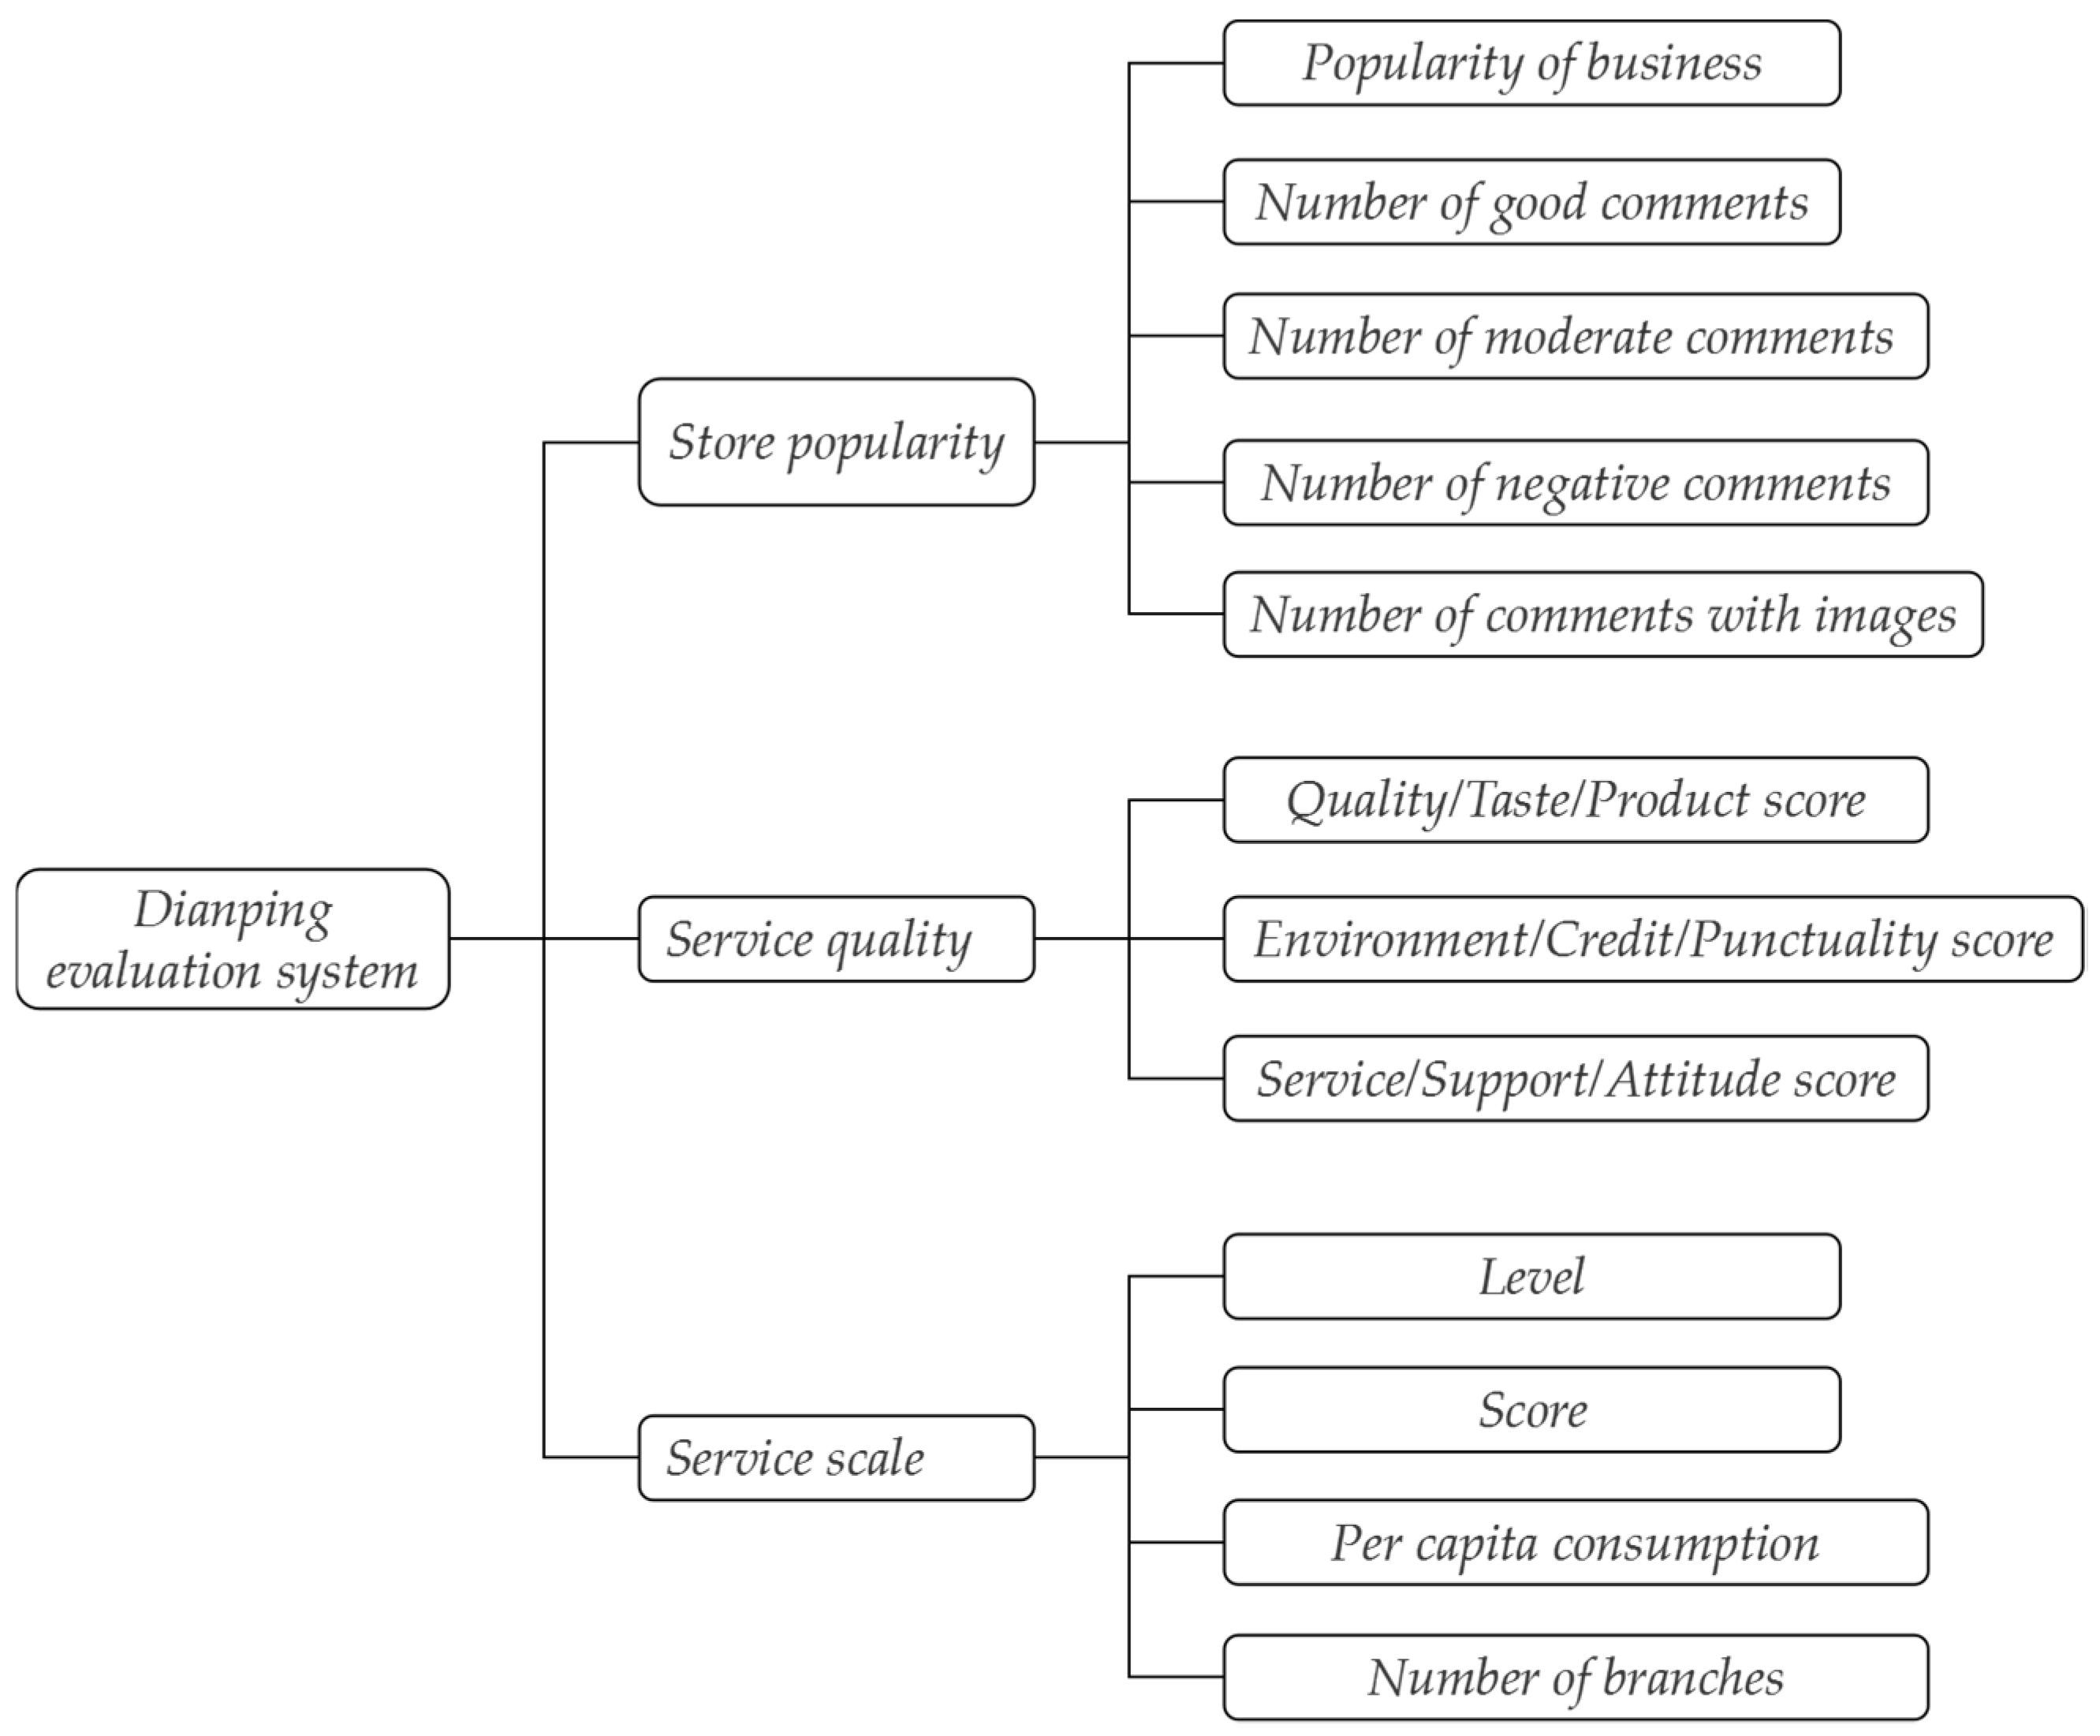
Urban vitality research currently uses multisource urban data widely, but the analysis unit is based on blocks or parcels of land. In contrast, residents’ economic, social and cultural activities are concentrated on the streets and their surroundings. By evaluating urban vitality on streets, we can improve the quality of urban streets, enhance liveable cities with more street vitality and promote organic urban renewal and sustainable development [42]. In this study, streets were used as the analysis unit to uncover the spatial distribution of the street’s urban vitality across social, economic and cultural dimensions. Using the multisource dataset from DiDi Chuxing, Dianping, Amap and the Tecent Easygo platform, we investigate the correlation between a street’s urban vitality and built environment indicators. To measure the social vitality of a street, the map matching method was used to extract the origin-destination (OD) data of taxis and shared bicycle trajectories. Based on user reviews, we construct user word-of-mouth weights to measure the economic vitality of a street. The cultural vitality of a street can be measured using cultural POI data. The street’s urban vitality was taken as the dependent variable in a multiple regression analysis model, and 11 indicators were selected to investigate the determinants of that street’s urban vitality. By using streets as an analysis unit, this study aimed to reveal the finer spatial pattern of the multiple dimensions of urban vitality on the street and to identify the correlation between urban vitality and built environment factors. Thus, the proposed method can be used to enhance urban vitality on streets and promote the healthy and sustainable development of people-oriented cities.
The remainder of this paper is organized as follows. 
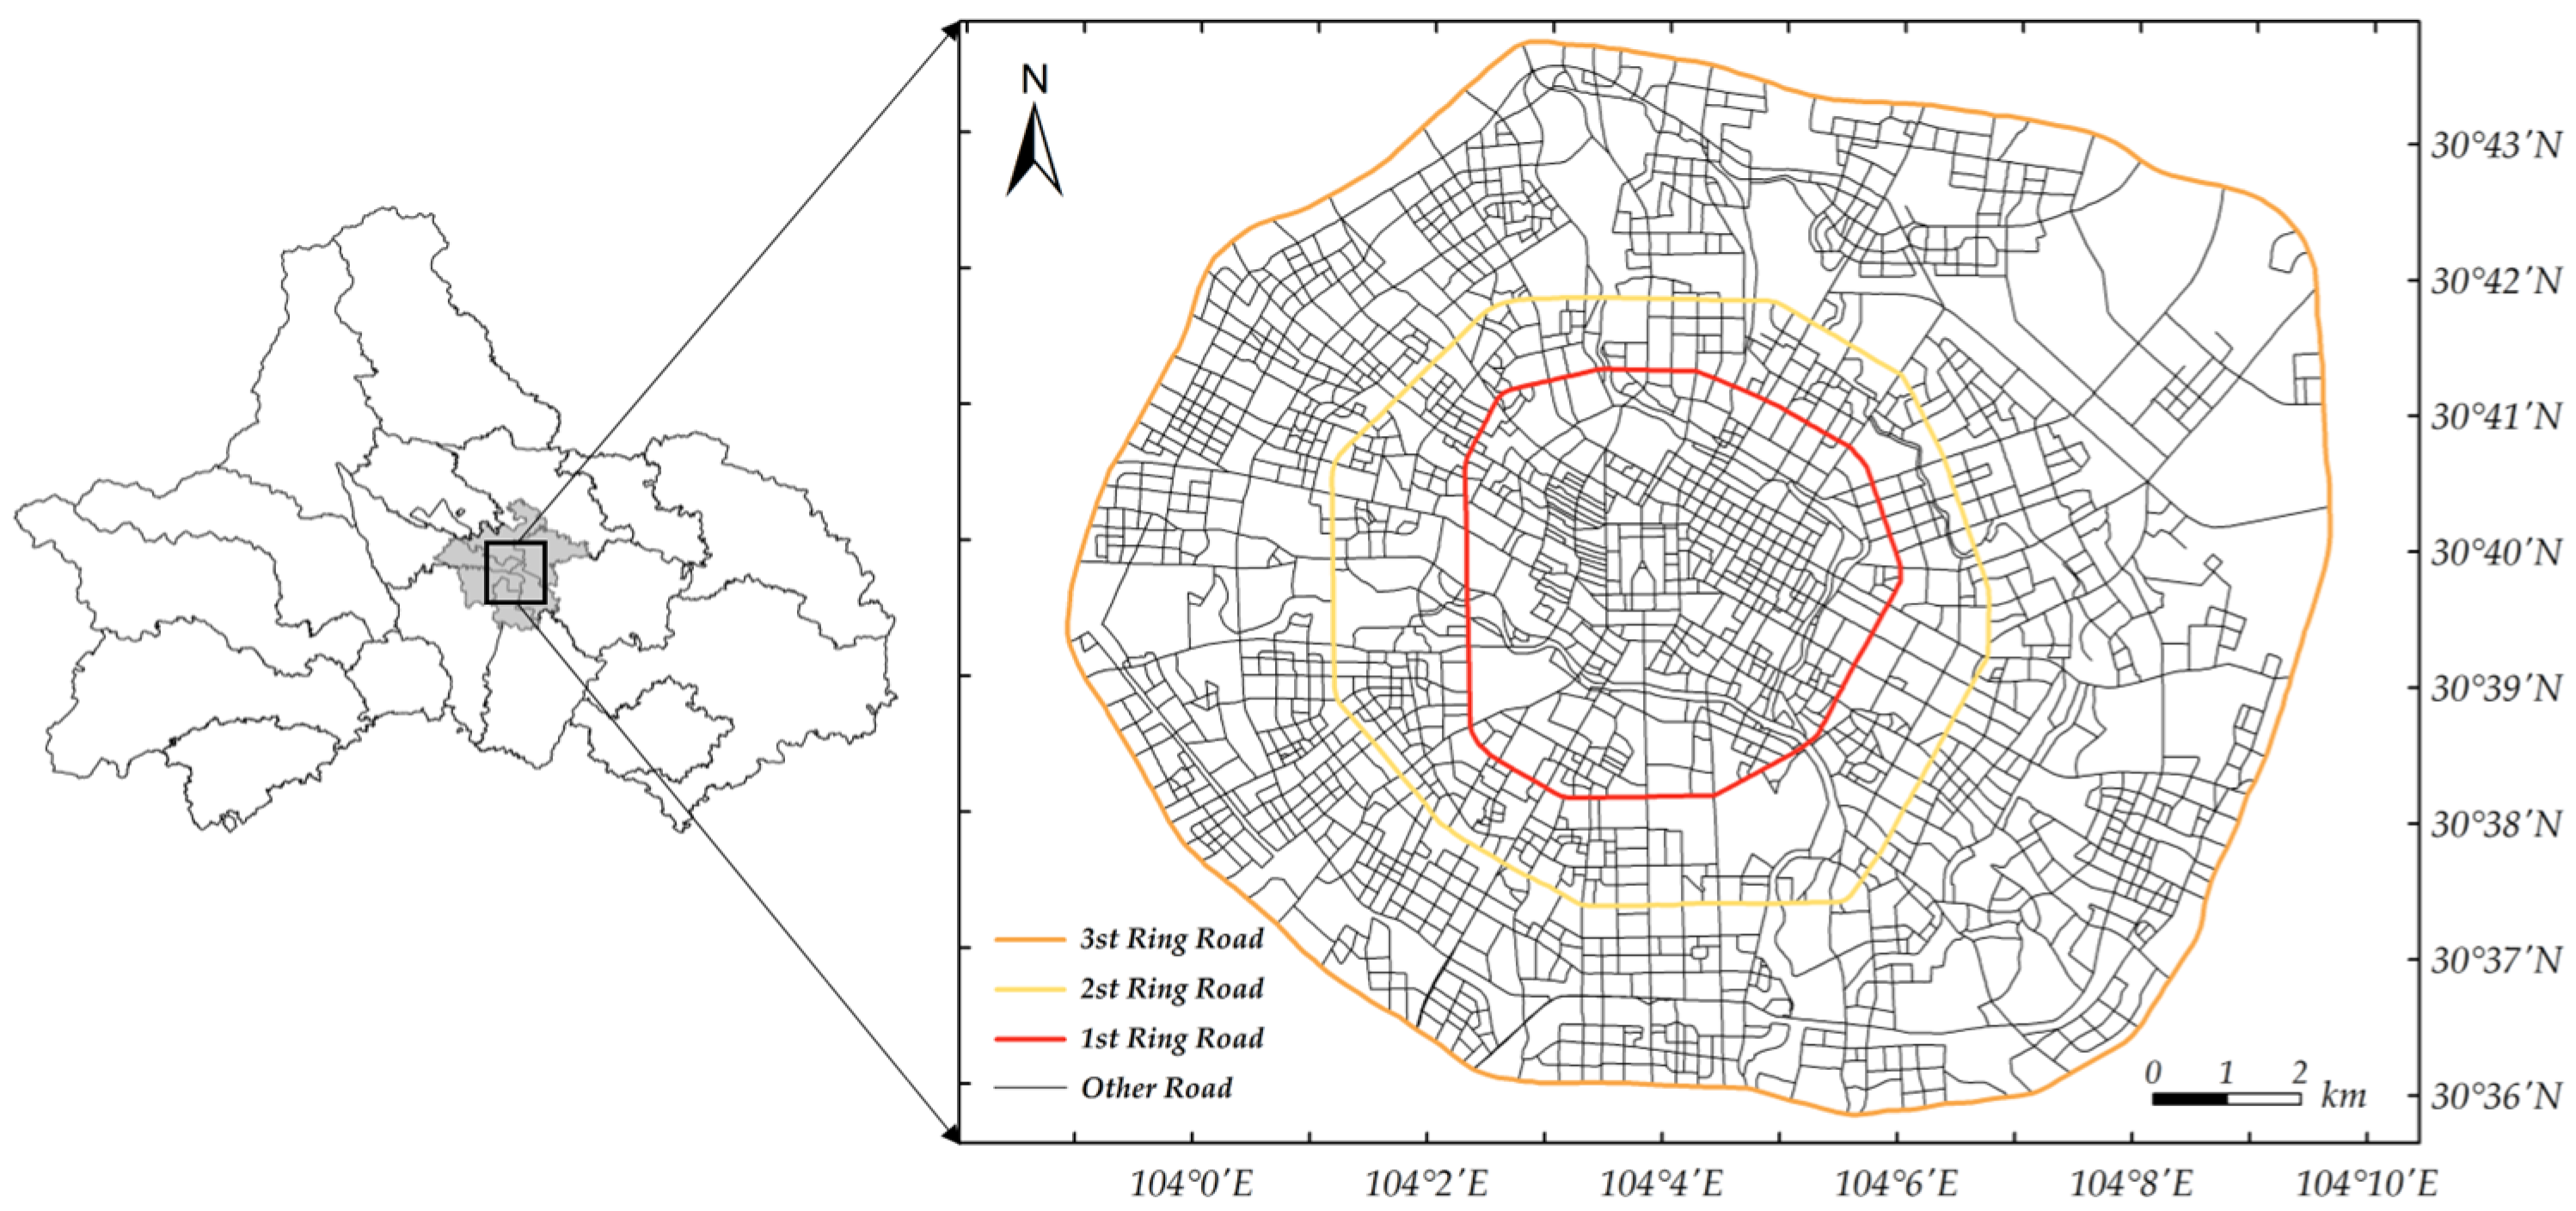
Section 2 describes our study area and data. Section 3 introduces the metrics for assessing the urban vitality and built environment factors on the streets, as well as multiple regression models. Section 4 examines the spatial patterns and relationships between urban vitality and the built environment on the street. Section 5 discusses the paper’s findings. Section 6 provides a concise summary of the paper.

2. Study Area and Data

2.1. Study Area

Chengdu is located in the Sichuan Basin of China, geographically located between 102°54′–104°53′ E and 30°05′–31°26′ N. As the capital of Sichuan Province, Chengdu is the political and economic center of Sichuan Province, and the only subprovincial city in Southwest China, with 12 municipal districts, five county-level cities and three counties. The city has a total area of 14,335 km2, with an urban area of 3639.81 km2 and a built-up area of 1421.6 km2 in the central city. The Chengdu National Economic and Social Development Statistical Bulletin shows that Chengdu had a resident population of 20,937,800 people and an annual gross regional product of 177.17 billion yuan in 2020. It was named “China’s Happiest City” in 2017, and ranked 10th in the 2020 list of China’s top 100 cities.
Our study area is the contiguously urbanized built-up area of Chengdu. The area is situated in central Chengdu, bounded on the north, east, west and south of the 3rd ring road of the city, as shown in Figure 1. The study area mainly involves the administrative districts of Jinniu District, Wuhou District, Qingyang District and Chenghua District, which is the main scope of urban residents’ activities in Chengdu, with developed transportation, high demand for residents to choose cabs and shared bicycles for travel and more prosperous economy and culture.

2.2. Data Sources and Preprocessing

The data sources of this study include road data, the data for street vitality calculation and influencing factor data. The road data mainly consisted of OpenStreetMap (OSM) data and were supplemented by the Baidu Map; the road network dataset was constructed by extracting road centerlines and using road connectivity and its topological rules. In this paper, the street unit is defined as a segment interrupted by two consecutive intersections. As a public space that carries traffic, economic activities and other events, street units have the same use function across time with similar demographic and socioeconomic characteristics [6,13] and street units have been applied to urban vitality studies [42,43], so we assume that streets provide homogeneous spaces for urban activities. We selected streets with at least two lanes and widths greater than 10 m on major roads within the 3rd Ring Road of Chengdu. The final set of streets included 4434 streets, and the average maximum and minimum lengths of the street units are 256.88 m, 2757.29 m and 6.26 m, respectively.
The POI data for cultural facilities, user review data from stores and taxi and bicycle trajectory data were used to measure the vitality of Chengdu city. The DiDi Chuxing platform, a Chinese ride-hailing service similar to Uber, provided the Chendu trajectory open datasets and web crawlers gathered user reviews and POI data from the Dianping platform and the AMap platform, which are among China’s largest online or offline life service companies and online map service providers, respectively. In addition, the influencing factor data included population, building, housing price, employment and street view data. Tencent ‘Easygo’ Open Big Data Platform is a location-based service product that provides information about the crowdedness of an area, and its data has a high spatial and temporal resolution, which can further reflect the gathering level of people around the street [45]. We implemented the web crawler that uses an Easygo API (https://heat.qq.com/heatmap.php (accessed on 7 December 2018)) to collect the data, which indicates user activity hot spots in the area and corresponding the real-time crowdedness. The building data were obtained from the AMap, and the housing price data and employment data were downloaded from Lianjia.com (one of the largest real estate agency service providers in China (accessed on 1 December 2018)) and Zhaopin.com (an online talent recruitment platform in China that provides users with real and comprehensive enterprise recruitment information (accessed on 1 December 2018)), respectively. In order to identify street information as comprehensively as possible, sampling points are set at equal distances on the road network, and street view data are obtained from Baidu Map according to the coordinates of the sampling points. Considering the actual situation of different travelers in the study, street view images with a vertical viewing angle of 10°, a 120° field of view consistent with that of the human eye and a forward-looking direction were selected as the experimental data [46]. After acquiring the above data, a Python script was used to eliminate duplicate values and outliers from the corresponding data, classify the review data and POI data and geocode the address information contained in the housing price and employment data to determine their spatial locations. Various types of multisource data were obtained for the 2018–2021 period, in addition to the taxi trajectory dataset in 2016. The source, content, number of records and time of acquisition of the data are shown in Table 1.
We acknowledge that the datasets in the paper cover different periods. Previous studies using cell phone datasets show, on the other hand, the stability of human activity in short time intervals [47]. It is reasonable to infer that human activities in Chengdu did not change much from 2018 to 2021. On the other hand, Chengdu experienced rapid urban expansion from 1978 to 2010, similar to most Chinese cities; after 2010, the urbanization in Chengdu entered a relative stable stage [48,49]. Thus, in the short interval from 2018 to 2021, the urban vitality derived from multisource data are also stable. Owing to the availability of open data in Chendu, the taxi trajectory data from 2016 are used to approximately uncover the state of the city’s vitality.

3. Methodology

By taking streets as the analysis unit and combining multisource urban data, we measured social, economic and cultural indicators of urban vitality on the street. Then, based on constructing the factor system of the built environment of streets, we calculate the indicator values by using machine learning and spatial analysis techniques and uncover the correlation between the spatial distribution of urban vitality and the built environment of streets by using the multiple regression model. The framework of the research method is shown in Figure 2.

3.1. Social Vitality

Social vitality is closely related to the social activities of residents. From the perspective of transportation, vehicle trajectories can be used to gauge the travel activities of residents. The number of departures and arrivals, as well as the point of departure and destination of a trip, can indicate the primary locations where social activities take place [50,51]. We use OD data extracted from taxi and bike-sharing trajectory data to reflect the main locations and gathering points of social activities through the total number of ODs, avoiding the problem of inconsistent sampling frequency caused by the direct adoption of trajectory data. In addition, taxies can operate with high coverage in all weather and with limited restrictions, while shared bicycles are highly mobile and cost-effective. The combination of the two modes of transport can expand the range of people with different needs for travel and more accurately characterize social vitality. DiDi Chuxing occupies the main share of the online ride-hailing market, and Mobike is a leading company in the bicycle-sharing market. High-quality data from DiDi online ride-hailing vehicles and Mobike shared bicycles were selected and preprocessed and OD points of the corresponding trajectories were extracted. Combined with the road network data for map matching, the OD points were matched to the corresponding streets. Then, the taxi and shared bicycle OD journeys were counted and the average number of OD points on weekdays and holidays were used as measures of social vitality in the study area.

3.2. Economic Vitality

Commercial facilities such as retail stores or restaurants, which are distributed mostly around streets, nurture a variety of urban economic activities [52]. Hence, these locations are key facilities for economic activities in the urban space. Previous studies have relied mostly on the number of stores to reflect economic vitality. However, the number of stores does not fully reflect consumption activities. In contrast, user review data from online information platforms can more accurately reflect consumption behaviors. In China, Dianping Platform provides relatively objective and detailed user reviews for commercial facilities and it can offer a picture of various indicators of services provided by these businesses (Figure 3). The results of user reviews can significantly impact online consumer behavior and reflect consumption activities at commercial facilities [5,53,54,55]. In this study, user review data were introduced to calculate the weight of economic vitality contributed by commercial facilities. We chose store popularity, service quality and service scale as the first-level indicators of the Dianping evaluation system based on the indicators and evaluation methods used in previous studies [55,56] and data availability. After classifying and cleaning the data from Dianping, the physical stores that provide offline services such as food shopping, leisure and entertainment and life services were selected. Then, the Keiser-Meyer-Olkin (KMO) test and Bartlett’s test of sphericity were performed according to the indicators of different types of stores. Using KMO, correlation coefficients between variables can be compared to determine which correlation coefficients are most appropriate to use in factor analysis. Generally, KMO value above 0.7 is suitable for principal component analysis. To test the distribution and independence of the data, Bartlett’s test is most commonly used. The KMO value was 0.77 and a p-value of Bartlett’s test was less than 0.001, which shows that the evaluation data were suitable for principal component analysis [57]. The initial factor loading matrix was rotated using variance maximization and the obtained eigenvalues of the three principal components were all greater than 1, with a cumulative variance contribution rate of 83.126%. According to the principle of principal component eigenvalue greater than 1 or cumulative contribution rate greater than 75% [58], the rotated principal components can well explain the user ratings of the various types of stores on the streets of Chengdu. The composite score of the user ratings was calculated by defining the user rating model as Equation (1)
F = A 1 F 1 + A 2 F 2 + A 3 F 3
where A i is the coefficient of each principal component (variance contribution ratio), and F 1 , F 2 , F 3 are used to represent the store popularity, service quality and service scale, respectively. Some of the user review data has a low number of store reviews but high scores, the above method can effectively avoid this shortcoming and reflect the contribution of different stores objectively. A street’s economic vitality was calculated by matching stores to the corresponding street unit and then performing the weighted sum of the number of stores in the street unit, with F as the weight of the economic contribution of the stores.

3.3. Cultural Vitality

Cultural centers in the street are an architectural expression of the materialized needs of residents amid the rapid development of social culture. These centers have certain spatial characteristics that can attract cultural enthusiasts, and they are associated with diverse behavioral activities to provide residents with a venue for cultural communication [45,59]. To cover the cultural communication needs of residents of all ages, five types of cultural facilities—i.e., movie and conference; visual display; inquiry and reading; culture, sports and recreation; and complex center facilities—were extracted from the POI data [29]. Specifically, the “movie and conference” facilities included movie theaters, concert halls and multifunctional conference halls; the “visual display” facilities included exhibition halls, museums, art galleries, science and technology museums and planetariums; the “inquiry and reading” facilities included libraries, archives, information centers and training centers; the “culture, sports and recreation” facilities included sports venues, training centers and some recreation venues; and the “complex center” facilities included diverse and complex cultural venues such as community centers, senior centers and cultural and sports centers. Cultural facilities overlapped with a 300 m buffer zone around the street line feature to calculate the total number of cultural facilities on each street, which is a measure of that street’s cultural vitality.

3.4. Built Environment Factors on the Street

In the field of urban design, Bernick and Cervero defined a “3D” (density, diversity and design) indicator system for the influencing factors of the urban built environment [60] and Belzer and Autler further expanded this system to a “5D” indicator system by adding distance to transit and destination accessibility [61]. Drawing on the characteristics of multisource urban data and the 5D indicator system, this study defined a total of 11 indicators covering four categories of factors—i.e., external street environment; land use; transportation and travel; and population and employment—to characterize the built environment of the street space quantitatively and to analyze the relationship between the urban vitality and the built environment of streets with multiple regression models. Specifically, the external street environment factors included three indicators—i.e., street green view index; sky view factor; and building density—which were used to reflect the external physical environment of the street space, with their values directly affecting the environmental comfort of the street space. The green view index is the proportion of vegetation in the street landscape observed by pedestrians, and the sky view factor is the proportion of the sky area that pedestrians can see from the street. Both proportions are determined through semantic segmentation of street view images, and are calculated in Equation (2)
s g r = k = 1 n p k / n
where s g r is the sky or green rate index, n is the the number of sampling points on the street, p k is the proportion of the sky or vegetation elements in the street view image, which is determined using the DeepLabV3 model for image semantic segmentation in the machine learning area by accessing the GluonCV API in Python [62].
Land use factors included three indicators—i.e., mixture of POIs; POI density; and housing price level—which were used to characterize the diversity and intensity of street land use, and in combination with the housing price of the nearest residential area, reflect the location characteristics and consumption power around the street space. We measure the land use factors from POI dataset used in previous studies [13,56]. The mixture of POIs was calculated using an entropy formula derived from the Shannon index as Equation (3)
h j = i = 1 n A i j l n ( A i j )  
where h is the mixture index, A i j is the percent of the ith type POI in the buffer zone of street j and n is the total number of POI types. We categorized POIs into 14 types, namely restaurants, shopping, scenic spots, public facilities, companies, financial and insurance services, scientific, educational and cultural services, transportation facilities, business housing, living services, sports and leisure services, accommodation services, health care services and government agencies or social organizations. As urban blocks with a concentrated distribution of POIs have a higher pedestrian flow and a relatively concentrated cultural service infrastructure, we retained POI density as an influential factor in the analysis of cultural vitality. The transportation and travel factors included three indicators—i.e., road sparsity; bus convenience; and subway convenience—which were used to describe the convenience of transportation in the street space. The population and employment factors included two indicators—i.e., crowd counting and employment density—which characterize the distribution of population and enterprises in the street unit. For employment density, recruitment data were used to reflect the distribution characteristics of enterprises around the street unit. Python scripts written with the Pandas library were used in the above data processing and index calculations, whereas ArcPy in ArcGIS 10.5 was used for spatial analysis. The minimum, maximum, mean, standard deviation and calculation method of each indicator are described in Table 2.

3.5. Multiple Regression Analysis

To analyze the influencing factors of multidimensional urban vitality of the street space, a multiple regression model was constructed using the regression equation shown in Equation (4)
y i = β i 0 + j = 1 11 β i j x j + ε i ,     i = 1 , 2 , 3  
where the three-vitality values of the street were taken as the dependent variable and 11 indicator values were selected as independent variables. Using the three regression models of the social, economic and cultural vitalities on the streets, we try to reveal the mechanism by which the built environment factors of streets influences urban vitality. Multicollinearity may occur when there is a moderate or high correlation between two or more independent variables, leading to misinterpretation of the regression analysis. The variance inflation factor (VIF) is a commonly used test to assess the level of multicollinearity. Any variable with a VIF value greater than 5 or 10 should be removed from the model [63]. Finally, independent variables with low cross-correlation were selected for model regression analysis.

4. Results

4.1. Spatial Pattern of Multidimensional Urban Vitality on the Street

The spatial distribution of urban vitality on the streets in Chengdu is shown in Figure 4. To compare with other vitality metrics, we normalized the vitality value into the range [0, 1] with Min-Max normalization. In general, vitality was mainly related to function, and had different distribution characteristics. The vitality value was higher in the urban center than in peripheral urban areas, and decreased significantly in the vicinity of the Second Ring Road. Social and cultural vitality values were slightly higher in the east than in the west, and the commercial district represented by the streets near Chunxi Road had high social and economic vitality values. The spatial distribution of the cultural vitality value was not significantly correlated with those of the social and economic vitality values.
The spatial distribution of social vitality is shown in Figure 4a, with high-value areas mainly distributed in the streets near the First Ring Road to the Second Ring Road, especially in the eastern and southern areas of this range. Locally, social vitality was high in commercial districts represented by the streets near Chunxi Road (①) and Wanda Plaza on Jinhua Road (②), in colleges and universities represented by the streets near Sichuan University (③), in medical centers represented by the streets near the West China Hospital (④), in cultural and sports centers represented by the streets near the Qingyang Sports Center (⑤), in industrial parks represented by Keyun Road (⑥), in transportation centers represented by the streets near Chengdu North Railway Station (⑦) and South Railway Station (⑧), in living and residential complex centers represented by the streets near Shuangqiao Road (⑨) and the second section of the Second Ring Road (⑩), and in tourist attractions represented by the streets near Kuanzhai Alley (⑪).
The economic vitality of the street units showed a scattered distribution (Figure 4b) and was distributed mainly in the streets near major commercial districts. The highest street vitality value was distributed mainly in the streets near the commercial district on Chunxi Road (①), followed by Jinhua Road near Wanda Plaza (②), streets near the MixC (③), Ningxia Street near New City Plaza (④) and Renmin North Road near the Wanda Plaza in the Jinniu district (⑤). In addition, streets such as Kehua North Road (⑥), which is close to Sichuan University, Wuhouci Street (⑦), which is next to the famous scenic spot of Wuhou Shrine, and Kuixinglou Street, which is representative of Chengdu’s food culture (⑧), showed high economic vitality due to the clustered distribution of businesses in various industries.
As shown in Figure 4c, cultural vitality showed a pronounced concentration trend, with high vitality values for streets inside the Second Ring Road and relatively low vitality values for streets outside the Second Ring Road. In particular, there are several local high-value districts such as the streets near Tianfu Square and Chengdu Museum (①), streets near Chengdu Sports Center (②), streets near Western Cultural Industry Park (⑤), streets near Chengdu Yongling Museum (④), streets near the MixC (⑤) and streets near Zizhu Community (⑥).

4.2. The Indices of Built Environment Factors on the Street

The results of each indicator of the built environment of the street are shown in Figure 5. The distribution of the street external environment indicators is obvious: the main urban area has a low green rate and sky rate due to the tall buildings and limited land resources, and the outer urban area has a high green rate and sky rate due to the open view of the streets, as well as a low green view rate and a high sky rate due to the wider roads and views on the main traffic circle. As expected, the sparseness, POI density and mix in the core urban areas are higher than those in the peripheral urban areas. There are several areas of higher house prices in the southern part of the study area, and generally lower house prices in the north. The central and southern areas have a greater advantage in terms of ease of access to employment. Bus convenience is more evenly distributed than subway convenience.

4.3. The Relationship between Urban Vitality and the Built Environment on the Street

Between the three types of urban vitality and 11 indicators, a correlation analysis was performed. Except for social vitality and sky rate, which were not correlated (Table 3), there were correlation relationships between all variables to varying degrees. For example, there are highly significant moderate correlations between social vitality, economic vitality and POI density, as well as social vitality and crowd counting, with correlation coefficients having exceeded 0.6. Because sky rate can affect urban vitality, it is retained in modeling and analyzing the influencing factors for completeness. The variance inflation factor (VIF) was used to test for multicollinearity among the 11 indicators of built environment factors (Table 4) and their VIF values were all less than 10, with a maximum VIF of 2.01, corresponding to a tolerance of 0.50, indicating that there was no significant multicollinearity among the variables. The model DW test yielded values of 1.84, 1.82 and 1.38, all close to 2, indicating that the model residuals were free of autocorrelation and that the model satisfied the basic assumption of residual independence.
By applying the model in Equation (4), the SPSS software was implemented to import data for multiple linear regression analysis. The final results are presented in Table 5, Table 6, Table 7 and Table 8. It can be seen that the regression model fits social vitality slightly better than economic and cultural vitality. The adjusted R2 suggests that 58.9%, 42.21% and 40.8% of the variations in social, economic and cultural vitality, respectively, can be explained by the associated factors (Table 5). An F-test was used to discern whether the independent variables of the overall built environment had a significant effect on the dependent variable of urban vitality on the whole. According to the test results, the values of F for the three types of vitality were 582.41, 296.14 and 280.32, respectively, and their Sig. values were all less than 0.05, indicating that each indicator had a significant effect on all three types of urban vitality overall, as shown in Table 5. The t-tests were used to determine whether or not each independent variable in the multiple linear regression model had a significant effect on the dependent variable (Table 6, Table 7 and Table 8). The regression coefficients pass the significance test if the significance level is less than 0.05. The social vitality regression model did not pass the house price and greening rate test. Subway accessibility, road sparsity and work accessibility all failed the economic vitality regression model. All factors were significant in the cultural vitality regression model (passed the t-test).
All of these factors are strongly correlated with urban vitality, including the external street environment, land use, transportation and travel and population and employment. Crowd counting and POI density have standardized coefficients of 0.38 and 0.36, respectively, which indicate that pedestrian flow and land use have the most significant impact on the social vitality of streets (Table 6). The higher the indices of the land use factor, the more living services are available and to an extent, the more vibrant the street is. The more convenient the travel is and the higher the crowd counting and the number of jobs available are, the more people gather and communicate. People who live in areas with a clear view of the sky are more likely have travel activities in city. Thus, the social vitality of the street is influenced by all of these factors.
The results from the regression analysis of the economic vitality on the streets reveal the importance of land use. As shown in Table 7, the impact of POI density and crowd counting on the economic vitality of streets is greater, with standardized coefficients of 0.53 and 0.14, respectively. To an extent, high-crowd areas can promote economic activities similar to storefronts and the richness and concentration of their associated industries and convenient transportation also contribute to the area’s economic vitality. On the other hand, factors such as a lower sky view factor and green view index positively impact a neighborhood’s economic vitality. Because of the high concentration of people and commerce in downtown areas, streets with high levels of economic activity tend to be congested and shaded, reducing the amount of green space.
All factors related to cultural vitality on streets were highly significant, and the abundance of pedestrian traffic and excellent transportation, residential and living conditions made the streets even more culturally vibrant. The standardized coefficients for POI density and work convenience were 0.27 and 0.26, respectively, and their effects on cultural vitality were more significant (Table 8). Building density had a significant negative correlation with cultural vitality, indicating that concentrated clusters of buildings can negatively impact cultural vitality. An increase in the street’s cultural vitality can be linked to a decrease in its sky-view factor and green-view index values. An increase in the street’s cultural vitality can be linked to a decrease in its sky-view factor and green-view index values. According to Figure 4c, cultural vitality was found mainly on streets within the Second Ring Road, with a high building blockage rate.

5. Discussion

Multisource urban data lay a foundation for the detailed and multidimensional urban vitality on the street. Differences in the distribution of urban vitality are related mainly to the functions associated with the street space and the functional characteristics of an individual street and the resident activities conducted their influence the distribution patterns of urban vitality across different dimensions. On the street of Chengdu, high levels of social vitality are scattered mainly across various agglomeration centers associated with production and life activities. Economic vitality is related to the areas where dense pedestrian flows and commercial clusters are located, while areas with high values of cultural vitality are relatively concentrated in central urban streets. A comparison of various urban vitality values reveals that streets with high economic vitality values generally have high social vitality values, whereas the streets with high social vitality values have both high and low economic vitality values, indicating that places where residents engage in various consumption activities are more widely distributed on the street, and these places attract a large number of residents, thus generating high social vitality values. On the other hand, for streets with high social vitality values, despite the presence of high pedestrian flows, there are still “depressions of economic vitality,” which require optimizing the functional diversity of the streets to further enhance economic vitality. Streets with high cultural vitality values do not have prominent social and economic vitality values, mainly due to their unique human environment, and most of these quiet places, such as green parks in cities, are located far from shopping centers [64]. By measuring multiple dimensions of urban vitality, we can more comprehensively analyze the complex economic and cultural phenomena and social processes in urban space, which is conducive to optimizing urban planning and design and improving urban vitality across different dimensions.
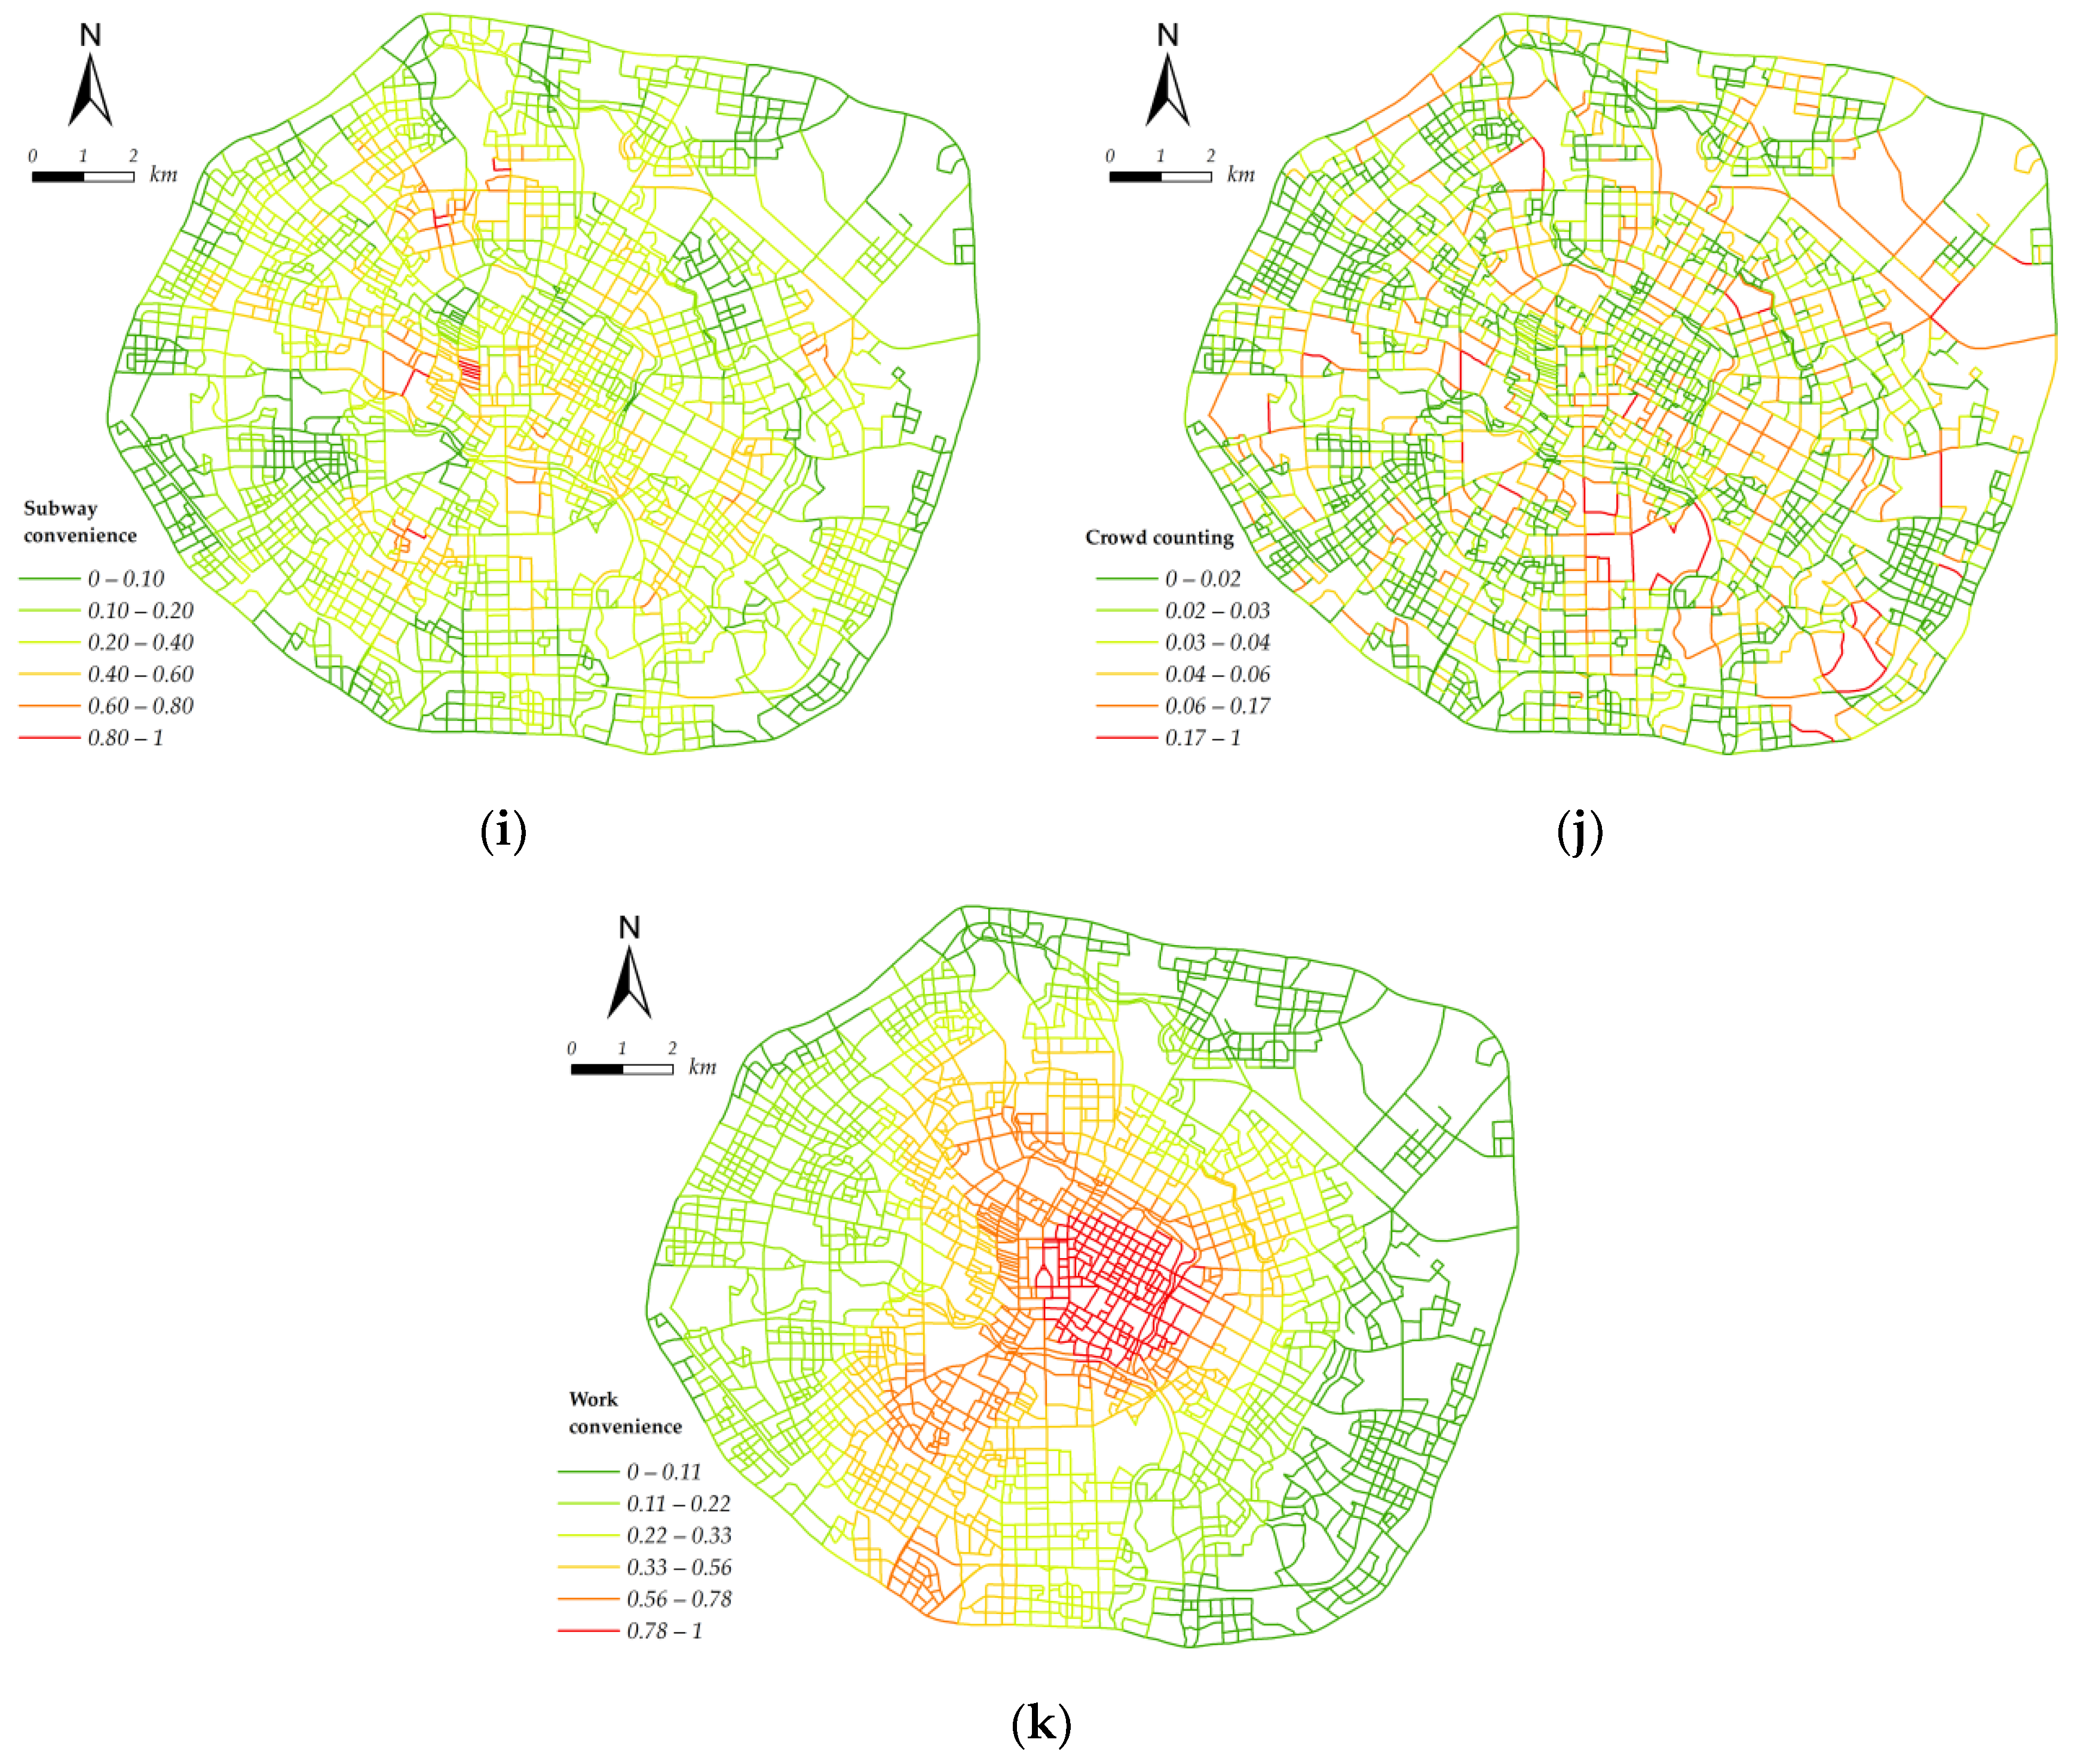
The built environmental indicators are closely linked to the urban vitality of the street. In general, land use, traffic trips, population and employment around the streets are closely linked to street vitality, which confirms that the vitality of the city comes from its living people and various activities [6]. In regard to social and economic vitality, crowd counting and POI density have a significant impact on social communication and trade. This finding is in line with previous research [2], which found that higher land use levels lead to the construction of living service facilities that house residents’ activities and create conditions where crowds can gather. Urban vitality is enhanced by residents’ activities and the ensuing development of clusters of related industries. On the other hand, the degree of influence of crowd counting on cultural vitality is less than that of POI density, mixture of POIs and work convenience, which shows its unique cultural attributes. However, bus convenience and green rates also have a significant impact, and cultural activities benefit from convenient transportation and a unique environment. Transportation systems provide flexible travel services, thereby increasing opportunities for human activities and interactions [65]. Green spaces in cities can promote positive emotions and facilitate physical activity [66]. Importantly, not all factors impact these three vitalities, such as the road sparsity factor, which affects only social vitality and cultural vitality, and has an opposing effect on both. This result suggests that the enhancement of urban vitality should be considered comprehensively and multidimensionally.
The street space carries multiple urban activities, and targeted measures should be taken to enhance multidimensional urban vitality based on the characteristics of different streets. From the perspective of social vitality, the urban vitality distribution is influenced by the functions of streets. Along with the development process of real estate and other developments, delayed renewal of amenities occurs, and it is necessary to make full use of land that is lagging behind in development [24]. In addition, a reasonable classification of mixed land use will provide many benefits to planning practice, bringing clear and unique planning solutions [67]. Therefore, for streets with mainly residential functions, public service supporting places can be appropriately added to improve diversified living services; for streets with mainly industrial functions, the employment environment can be appropriately improved by adding functional facilities such as residential and catering to attract more enterprises to settle in the exchange and further improve the level of human mobility. From the perspective of economic vitality, it is necessary to assess the capacity of a street to support large-scale commercial activities and sustainable pedestrian flow. Urban carrying capacity is an important barometer of sustainable urban development, and considering the carrying capacity of the street environment and facilities can help maintain sustainable regional economic growth [68]. On this basis, economic vitality can be continuously increased by improving the capacity and quality of diversified services and enhancing the transportation conditions around the street space. From the perspective of cultural vitality, the streets in peripheral areas can be appropriately upgraded from the viewpoint of the balanced overall development of the city. For example, the unique background of panda culture in Chengdu can be used as an entry point to plan and build more cultural and tourism facilities to improve the level of public cultural services. Recently, policies related to the creation of the “World City of Cultural and Creative Industries” and “World Famous Tourist City” in Chengdu have created a continuous exchange of people and accordingly, social, economic and cultural vitalities have been mutually promoted and enhanced through various exchange activities. Generally, improving urban vitality requires fine-scale planning and optimization strategies in the street space, as well as coordinated and sustainable development across social, economic and cultural dimensions.

6. Conclusions

Urban vitality is a comprehensive abstract concept that arises from various influencing factors that complement one another [69]. It is an external manifestation of the overall function of the city. People and the built environment are the most critical factors in urban vitality, and social, economic and cultural activities emerge as a result of people gathering and pursuing basic life goals, environmental requirements and spiritual culture [8]. Urban vitality is increasingly being decomposed into various aspects, such as economic, social, environmental and even cultural aspects, and researchers are conducting urban vitality analyses using neighborhoods, parcels, grid cells or traffic analysis zones as the unit of analysis. Meanwhile, urban streets are public open spaces in cities that traditionally serve the social function of transportation, and are also the spatial carriers of urban socio-economic and cultural activities [5]. In this study, multisource urban data were used to measure the multidimensional urban vitality using streets as the analysis units, and the correlation between different dimensions of urban vitality such as social, economic and cultural vitality and built environment factors of the street was analyzed. The distribution of multidimensional urban vitality on the street can be more accurately determined by measuring social vitality based on the trajectories of taxis and shared bicycles, measuring economic vitality using the user rating data and measuring cultural vitality based on POI data. Multisource urban data such as street views, buildings, housing prices and recruitment data can be used to quantify urban built environment factors and analyze their correlation with the urban vitality of streets.
Overall, the spatial distribution characteristics of Chengdu’s streets’ social, economic and cultural vitality differ slightly. Streets with high social vitality cluster obviously between the first and second ring roads, and are distributed around residential areas, industrial parks, schools and other major production and living centers, which are primarily influenced positively by factors such as street external environment, land use, population and employment. Economic vitality is concentrated near major shopping districts with superior services and pedestrian flow, such as shopping and dining, with Chunxi Road shopping district as a typical representative. Cultural vitality shows a decreasing trend from the central city to the periphery, which is closely related to the external environment and land use on the street.
Based on the street unit, the social, economic, cultural vitality has been measured more realistically and objectively, the quantitative analysis of street space has been enriched, and the urban vitality studies based on multi-source city data has been expanded. Relevant vitality analysis and influence mechanisms can be used as a reference to enhance urban vitality in multiple dimensions. In the future, time-series data will be used to analyze the temporal characteristics of urban vitality, and multisource data from multiple cities will be analyzed to compare urban vitality for different cities.

Author Contributions

Conceptualization, Caihui Cui and Qian Li; methodology, Qian Li and Zhigang Han; software, Qian Li and Feng Liu; validation, Caihui Cui and Zhigang Han; formal analysis, Caihui Cui; investigation, Qian Li and Yadi Run; resources, Feng Liu and Yadi Run; data curation, Yadi Run and Qirui Wu; writing—original draft preparation, Qian Li; writing—review and editing, Caihui Cui and Zhigang Han; visualization, Yadi Run and Qirui Wu; supervision, Caihui Cui; project administration, Zhigang Han; and funding acquisition, Zhigang Han. All authors have read and agreed to the published version of the manuscript.

Funding

This research was funded by National Natural Science Foundation of China, grant number 41871316; the Key Project of Humanities and Social Sciences Key Research Base of the Ministry of Education, China, grant number 16JJD770019; Science and Technology Foundation of Henan Province, grant number 212102310421; Natural Resources Science and Technology Innovation Project of Henan Province, China, grant number 202016511; and National Key Research and Development Program of China, grant number 2021YFE0106700.

Institutional Review Board Statement

Not applicable.

Informed Consent Statement

Not applicable.

Data Availability Statement

Data available on request in order to protect research participant privacy.

Acknowledgments

Special thanks go to the editor and anonymous reviewers of this paper for their constructive comments, especially during the COVID-19 pandemic.

Conflicts of Interest

The authors declare no conflict of interest.

References

  1. Yue, W.; Chen, Y.; Thy, T.M.; Fan, P.; Zhang, W. Identifying urban vitality in metropolitan areas of developing countries from a comparative perspective: Ho Chi Minh City versus Shanghai. Sust. Cities Soc. 2020, 65, 102609. [Google Scholar] [CrossRef]
  2. Lan, F.; Gong, X.; Da, H.; Wen, H. How do population inflow and social infrastructure affect urban vitality? Evidence from 35 large- and medium-sized cities in China. Cities 2020, 100, 102454. [Google Scholar] [CrossRef]
  3. Delclòs-Alió, X.; Gutiérrez, A.; Miralles-Guasch, C. The urban vitality conditions of Jane Jacobs in Barcelona: Residential and smartphone-based tracking measurements of the built environment in a Mediterranean metropolis. Cities 2019, 86, 220–228. [Google Scholar] [CrossRef]
  4. Xia, C.; Zhang, A.; Yeh, A.G. The Varying Relationships between Multidimensional Urban Form and Urban Vitality in Chinese Megacities: Insights from a Comparative Analysis. Ann. Am. Assoc. Geogr. 2021, 112, 1–26. [Google Scholar] [CrossRef]
  5. Long, Y.; Huang, C. Does block size matter? The impact of urban design on economic vitality for Chinese cities. Environ. Plan. B Urban Anal. City Sci. 2019, 46, 406–422. [Google Scholar] [CrossRef] [Green Version]
  6. Jacobs, J. The Death and Life of Great American Cities; Vintage Books: New York, NY, USA, 1961. [Google Scholar]
  7. Lynch, K.A. The Image of the City; MIT Press: Cambridge, MA, USA, 1971. [Google Scholar]
  8. Gehl, J. Life between Buildings; Van Nostrand Reinhold: New York, NY, USA, 1987. [Google Scholar]
  9. Chhetri, P.; Stimson, R.J.; Western, J. Modelling the factors of neighbourhood attractiveness reflected in residential location decision choices. Stud. Reg. Sci. 2006, 36, 393–417. [Google Scholar] [CrossRef] [Green Version]
  10. Sulis, P.; Manley, E.; Zhong, C.; Batty, M. Using mobility data as proxy for measuring urban vitality. J. Spat. Int. Sci. 2018, 16, 137–162. [Google Scholar] [CrossRef]
  11. Xu, Y.; Belyi, A.; Bojic, I.; Ratti, C. How friends share urban space: An exploratory spatiotemporal analysis using mobile phone data. Trans. GIS 2017, 21, 468–487. [Google Scholar] [CrossRef]
  12. Jiang, D. On the Vitality of Urban Form; Southeast University Press: Nanjing, China, 2007. [Google Scholar]
  13. Tu, W.; Zhu, T.; Xia, J.; Zhou, Y.; Lai, Y.; Jiang, J.; Li, Q. Portraying the spatial dynamics of urban vibrancy using multisource urban big data. Comput. Environ. Urban Syst. 2020, 80, 101428. [Google Scholar] [CrossRef]
  14. Council, S. Healthy China 2030. Available online: http://www.gov.cn/xinwen/2016-10/25/content_5124174.htm (accessed on 12 September 2021).
  15. Azmi, D.I.; Karim, H.A. Implications of walkability towards promoting sustainable urban neighbourhood. Procedia-Soc. Behav. Sci. 2012, 50, 204–213. [Google Scholar] [CrossRef]
  16. Sung, H.; Lee, S. Residential built environment and walking activity: Empirical evidence of Jane Jacobs’ urban vitality. Transp. Res. Part D Transp. Environ. 2015, 41, 318–329. [Google Scholar] [CrossRef]
  17. Gong, J.; Zhang, X.; Xiang, L.; Chen, N. Advances and applications of integrated sensing and intelligent decision making in smart cities. Acta Geodaetica et Cartographica Sinica 2019, 48, 1482–1497. [Google Scholar]
  18. Tu, w.; Cao, J.; Gao, Q.; Cao, R.; Fang, Z.; Yue, Y.; Li, Q. Sensing city dynamics by fusing multi-source spatio-temporal big data. Geomat. Inf. Sci. Wuhan Univ. 2020, 45, 50–58. [Google Scholar]
  19. Liu, Y.; Liu, X.; Gao, S.; Gong, L.; Kang, C.; Zhi, Y.; Chi, G.; Shi, L. Social sensing: A new approach to understanding our socioeconomic environments. Ann. Assoc. Am. Geogr. 2015, 105, 512–530. [Google Scholar] [CrossRef]
  20. Li, Q. From Geomatics to Urban Informatics. Geomat. Inf. Sci. Wuhan Univ. 2017, 42, 1–6. [Google Scholar]
  21. He, Q.; He, W.; Song, Y.; Wu, J.; Yin, C.; Mou, Y. The impact of urban growth patterns on urban vitality in newly built-up areas based on an association rules analysis using geographical ‘big data’. Land Use Pol. 2018, 78, 726–738. [Google Scholar] [CrossRef]
  22. Huang, B.; Zhou, Y.; Li, Z.; Song, Y.; Cai, J.; Tu, W. Evaluating and characterizing urban vibrancy using spatial big data: Shanghai as a case study. Environ. Plan. B Urban Anal. City Sci. 2020, 47, 1543–1559. [Google Scholar] [CrossRef]
  23. Ye, Y.; Li, D.; Liu, X. How block density and typology affect urban vitality: An exploratory analysis in Shenzhen, China. Urban Geogr. 2018, 39, 631–652. [Google Scholar] [CrossRef]
  24. Xia, C.; Yeh, A.G.-O.; Zhang, A. Analyzing spatial relationships between urban land use intensity and urban vitality at street block level: A case study of five Chinese megacities. Landsc. Urban Plan. 2020, 193, 103669. [Google Scholar] [CrossRef]
  25. Yue, W.; Chen, Y.; Zhang, Q.; Liu, Y. Spatial Explicit Assessment of Urban Vitality Using Multi-Source Data: A Case of Shanghai, China. Sustainability 2019, 11, 638. [Google Scholar] [CrossRef] [Green Version]
  26. Liu, S.; Zhang, L.; Long, Y.; Long, Y.; Xu, M. A New Urban Vitality Analysis and Evaluation Framework Based on Human Activity Modeling Using Multi-Source Big Data. ISPRS Int. Geo-Inf. 2020, 9, 617. [Google Scholar] [CrossRef]
  27. Zikirya, B.; He, X.; Li, M.; Zhou, C. Urban Food Takeaway Vitality: A New Technique to Assess Urban Vitality. Int. J. Environ. Res. Public Health 2021, 18, 3578. [Google Scholar] [CrossRef]
  28. Zeng, P.; Wei, M.; Liu, X. Investigating the Spatiotemporal Dynamics of Urban Vitality Using Bicycle-Sharing Data. Sustainability 2020, 12, 1714. [Google Scholar] [CrossRef] [Green Version]
  29. Ta, N.; Zeng, Y.; Zhu, Q.; Wu, J. Analysis of the relationship between built environment and urban vitality in central Shanghai based on big data. Sci. Geogr. Sin. 2020, 40, 60–68. [Google Scholar]
  30. Kim, Y.-L. Data-driven approach to characterize urban vitality: How spatiotemporal context dynamically defines Seoul’s nighttime. Int. J. Geogr. Inf. Sci. 2020, 34, 1235–1256. [Google Scholar] [CrossRef]
  31. Wang, M.; Vermeulen, F. Life between buildings from a street view image: What do big data analytics reveal about neighbourhood organisational vitality? Urban Stud. 2020, 58, 3118–3139. [Google Scholar] [CrossRef]
  32. Kim, Y.L. Seoul’s Wi-Fi hotspots: Wi-Fi access points as an indicator of urban vitality. Comput. Environ. Urban Syst. 2018, 72, 13–24. [Google Scholar] [CrossRef]
  33. Kang, C.; Fan, D.; Jiao, H. Validating activity, time and space diversity as essential components of urban vitality. Environ. Plan. B Urban Anal. City Sci. 2021, 48, 1180–1197. [Google Scholar] [CrossRef]
  34. Zhang, A.; Li, W.; Wu, J.; Lin, J.; Chu, J.; Xia, C. How can the urban landscape affect urban vitality at the street block level? A case study of 15 metropolises in China. Environ. Plan. B Urban Anal. City Sci. 2020, 48, 1245–1262. [Google Scholar] [CrossRef]
  35. Fang, C.; He, S.; Wang, L. Spatial Characterization of Urban Vitality and the Association with Various Street Network Metrics from the Multi-Scalar Perspective. Front. Public Health 2021, 9, 677910. [Google Scholar] [CrossRef]
  36. Gan, X.; Huang, L.; Wang, H.; Mou, Y.; Wang, D.; Hu, A. Optimal Block Size for Improving Urban Vitality: An Exploratory Analysis with Multiple Vitality Indicators. J. Urban Plan. Dev 2021, 147, 04021027. [Google Scholar] [CrossRef]
  37. Marshall, S. Streets and Patterns; Routledge: New York, NY, USA, 2005. [Google Scholar]
  38. Shen, Y.; Karimi, K. Urban function connectivity: Characterisation of functional urban streets with social media check-in data. Cities 2016, 55, 9–21. [Google Scholar] [CrossRef] [Green Version]
  39. Lynch, K. A Theory of Good City Form; MIT Press: Boston, MA, USA, 1981; pp. 193–222. [Google Scholar]
  40. Zhu, D.; Wang, N.; Wu, L.; Liu, Y. Street as a big geo-data assembly and analysis unit in urban studies: A case study using Beijing taxi data. Appl. Geogr. 2017, 86, 152–164. [Google Scholar] [CrossRef]
  41. Jalaladdini, S.; Oktay, D. Urban public spaces and vitality: A socio-spatial analysis in the streets of Cypriot towns. Procedia-Soc. Behav. Sci. 2012, 35, 664–674. [Google Scholar] [CrossRef] [Green Version]
  42. Liu, M.; Jiang, Y.; He, J.J.S. Quantitative Evaluation on Street Vitality: A Case Study of Zhoujiadu Community in Shanghai. Sustainability 2021, 13, 3027. [Google Scholar] [CrossRef]
  43. Guo, X.; Chen, H.; Yang, X. An Evaluation of Street Dynamic Vitality and Its Influential Factors Based on Multi-Source Big Data. Int. J. Geogr. Inf. Sci. 2021, 10, 143. [Google Scholar] [CrossRef]
  44. Wu, W.; Niu, X.; Li, M. Influence of Built Environment on Street Vitality: A Case Study of West Nanjing Road in Shanghai Based on Mobile Location Data. Sustainability 2021, 13, 1840. [Google Scholar] [CrossRef]
  45. Chen, Y.; Liu, X.; Li, X.; Liu, X.; Yao, Y. Delineating urban functional areas with building-level social media data: A dynamic time warping (DTW) distance based k-medoids method. Landsc. Urban Plan. 2017, 160, 48–60. [Google Scholar] [CrossRef]
  46. Long, Y.; Liu, L. How green are the streets? An analysis for central areas of Chinese cities using Tencent Street View. PLoS ONE 2017, 12, e0171110. [Google Scholar] [CrossRef] [Green Version]
  47. Song, C.; Qu, Z.; Blumm, N.; Barabási, A.L. Limits of predictability in human mobility. Science 2010, 327, 1018–1021. [Google Scholar] [CrossRef] [Green Version]
  48. Miao, J.T. Planning particularities: Reinterpreting urban planning in China with the case of Chengdu. Plan. Theory Pract. 2019, 20, 512–536. [Google Scholar] [CrossRef]
  49. Fei, W.; Zhao, S. Urban land expansion in China’s six megacities from 1978 to 2015. Sci. Total Environ. 2019, 664, 60–71. [Google Scholar] [CrossRef] [PubMed]
  50. Liu, X.; Tian, Y.; Zhang, X.; Wan, Z. Identification of Urban Functional Regions in Chengdu Based on Taxi Trajectory Time Series Data. ISPRS Int. J. Geo-Inf. 2020, 9, 158. [Google Scholar] [CrossRef] [Green Version]
  51. Sun, M.; Fan, H. Detecting and Analyzing Urban Centers Based on the Localized Contour Tree Method Using Taxi Trajectory Data: A Case Study of Shanghai. ISPRS Int. J. Geo-Inf. 2021, 10, 220. [Google Scholar] [CrossRef]
  52. Han, Z.; Cui, C.; Miao, C.; Wang, H.; Chen, X. Identifying spatial patterns of retail stores in road network structure. Sustainability 2019, 11, 4539. [Google Scholar] [CrossRef] [Green Version]
  53. Xu, F.; Feng, Z.; Qin, X.; Wang, X.; Wang, F. From central place to central flow theory: An exploration of urban catering. Tour. Geogr. 2018, 21, 121–142. [Google Scholar] [CrossRef]
  54. Senecal, S.; Nantel, J. The influence of online product recommendations on consumers’ online choices. J. Retail. 2004, 80, 159–169. [Google Scholar] [CrossRef]
  55. Zhu, F.; Zhang, X. Impact of Online Consumer Reviews on Sales: The Moderating Role of Product and Consumer Characteristics. J. Mark. 2010, 74, 133–148. [Google Scholar] [CrossRef]
  56. Yue, Y.; Zhuang, Y.; Yeh, A.G.; Xie, J.Y.; Ma, C.L.; Li, Q. Measurements of POI-based mixed use and their relationships with neighbourhood vibrancy. Int. J. Geogr. Inf. Sci. 2017, 31, 658–675. [Google Scholar] [CrossRef] [Green Version]
  57. Qin, X.; Zhen, F.; Gong, Y. Combination of Big and Small Data: Empirical Study on the Distribution and Factors of Catering Space Popularity in Nanjing, China. J. Urban Plan. Dev. 2019, 145, 05018022. [Google Scholar] [CrossRef]
  58. Hardle, W.; Simar, L. Applied Multivariate Statistical Analysis, 3rd ed.; Prentice Hall: Engelwood, NJ, USA, 2012. [Google Scholar]
  59. Chion, M. Producing urban vitality: The case of dance in San Francisco. Urban Geogr. 2009, 30, 416–439. [Google Scholar] [CrossRef]
  60. Bernick, M.; Cervero, R. Transit Villages in the 21st Century; McGraw-Hill: New York, NY, USA, 1997. [Google Scholar]
  61. Belzer, D.; Autler, G. Transit Oriented Development: Moving from Rhetoric to Reality; Brookings Institution Center on Urban and Metropolitan Policy: Washington, DC, USA, 2002. [Google Scholar]
  62. GluonCV: A Deep Learning Toolkit for Computer Vision. Available online: https://cv.gluon.ai/build/examples_segmentation/index.html (accessed on 12 September 2021).
  63. Kutner, M.; Nachtsheim, C.; Neter, J. Applied Linear Statistical Models, 4th ed.; McGraw-Hill: New York, NY, USA, 2004. [Google Scholar]
  64. Viniece, J.; Lincoln, L.; Yun, J. Advancing Sustainability through Urban Green Space: Cultural Ecosystem Services, Equity and Social Determinants of Health. Int. J. Environ. Res. Public Health 2016, 13, 196. [Google Scholar]
  65. Rodrigue, J.P.; Comtois, C.; Slack, B. The Geography of Transport Systems; Routledge: New York, NY, USA, 2009. [Google Scholar]
  66. Weijs-Perrée, M.; Dane, G.; Berg, P.V.D. Analyzing the Relationships between Citizens’ Emotions and their Momentary Satisfaction in Urban Public Spaces. Sustainability 2020, 12, 7921. [Google Scholar] [CrossRef]
  67. Raman, R.; Roy, U.K. Taxonomy of urban mixed land use planning. Land Use Pol. 2019, 88, 104102. [Google Scholar] [CrossRef]
  68. Wei, Y.; Huang, C.; Lam, P.T.I.; Yuan, Z. Sustainable urban development: A review on urban carrying capacity assessment. Habitat Int. 2015, 46, 64–71. [Google Scholar] [CrossRef]
  69. Pan, H.; Yang, C.; Quan, L.; Liao, L. A New Insight into Understanding Urban Vitality: A Case Study in the Chengdu-Chongqing Area Twin-City Economic Circle, China. Sustainability 2021, 13, 10068. [Google Scholar] [CrossRef]
Figure 1. Study area of Chengdu, China.
Ijgi 11 00002 g001
Figure 2. Study Framework.
Ijgi 11 00002 g002
Figure 3. The “Dianping” evaluation system in measuring economic dynamism.
Ijgi 11 00002 g003
Figure 4. Spatial pattern of urban vitality on streets. The locations indicated by numbers (e.g., ①, ②, ③…) in the graph are areas with high vitality values. (a) Social vitality. (b) Economic vitality. (c) Cultural vitality.
Ijgi 11 00002 g004aIjgi 11 00002 g004b
Figure 5. Spatial distribution of the indices of built environment factors on streets. (a) Sky rate. (b) Green rate. (c) Building density. (d) Mixture of POI. (e) POI density. (f) House price level. (g) Road sparsity. (h) Bus convenience. (i) Subway convenience. (j) Crowd counting. (k) Work convenience.
Ijgi 11 00002 g005aIjgi 11 00002 g005bIjgi 11 00002 g005c
Table 1. Detailed description of the study data.
DataSourceContentNumber of RecordsTime
Taxi orderhttps://gaia.didichuxing.com (accessed on 7 May 2020)The latitude, longitude, time, ID and other information generated by GPS positioning in each order of the taxi516,83418–19 November 2016
Bicycle-sharing trajectoryhttps://mobike.com (accessed on 20 August 2018)The latitude, longitude, time, ID and other information generated in the GPS positioning of the bicycle-sharing3,130,13319–20 August 2018
Dianping user reviewhttp://www.dianping.com (accessed on 1 July 2021)Contains user’s evaluation information on the business such as store name, location, score, per capita consumption, etc.321,0272021
House pricehttps://www.lianjia.com (accessed on 1 December 2018)Contains the name, price, address and other information of the sold community26,9562018
Street viewhttps://map.baidu.com (accessed on 1 July 2021)Real street pictures with location information73522021
Population Heat maphttp://c.easygo.qq.com (accessed on 7 December 2018)High resolution location information with time and count1,000,7082018
POIhttps://www.amap.com (accessed on 1 December 2018)Contains point of interest information such as name, category, latitude and longitude130,7822018
Buildinghttps://www.amap.com (accessed on 1 December 2018)Building vector area data71,1712018
Recruitment informationhttps://landing.zhaopin.com (accessed on 1 December 2018)Contains the name, address, salary, education, etc. of the recruiting company100,6532018
Streethttps://www.openstreetmap.org (accessed on 1 December 2018)Basic road vector data44342018
Table 2. Descriptive statistics of built environment factors on streets.
FactorIndexMinimumMaximumMeanStandard DeviationDescription
External street environment Sky rate00.660.270.19Mean value of the proportion of vegetation elements in the street view after semantic segmentation of the street view images
Green rate00.900.220.15Mean value of the proportion of sky elements in the street view after semantic segmentation of the street view images
Building density (Buildings per meter)058154.5244.68Ratio of the number of buildings covered in a 300-m buffer zone around the street line feature to the length of the street
Land useMixture of POI00.990.630.30Entropy values of 14 major POI categories within the 300m buffer zone around the street line feature
POI density (POIs per meter)055129.4236.83Ratio of the number of POI covered in a 300-m buffer zone around the street line feature to the length of the street
House price level (YUAN per square meter)323342,456.8015,737.104458.85The house price of the neighborhood closest to the street’s center point
Transportation and travelRoad sparsity13414.295.93Number of roads covered within a 300-m buffer zone around the midpoint of the street
Bus convenience02310.673.81The cumulative number of street covered by 500m buffer zones around the bus stop
Subway convenience051.470.97The cumulative number of street covered by 800m buffer zones around the subway station
Population and employmentCrowd counting0686.2514.9422.96Mean value of the heatmap in different time covered in a 300-m buffer zone around the street line feature
Work convenience193.612.24Levels after nuclear density analysis and reclassification of recruiting companies
Table 3. Results of the correlation analysis between street built environment factors and social, economic and cultural vitality.
FactorIndexSocial VitalityEconomic VitalityCultural Vitality
External street environment Sky rate0.02−0.09 **−0.20 **
Green rate−0.08 **−0.06 **−0.03 *
Building density0.40 **0.24 **0.12 **
Land useMixture of POI0.38 **0.34 **0.37 **
POI density0.67 **0.63 **0.41 **
House price level−0.03 *0.030.08 **
Transportation and travelRoad sparsity−0.29 **−0.08 **0.28 **
Bus convenience0.13 **0.15 **0.30 **
Subway convenience0.08 **0.12 **0.24 **
Population and employmentCrowd counting0.68 **0.47 **0.23 **
Work convenience0.08 **0.15 **0.46 **
Note: **, * indicate passing the test at the significance level of 0.01 and 0.05, respectively.
Table 4. Multicollinearity test results.
FactorIndexToleranceVIF
External street environment Sky rate0.551.83
Green rate0.621.61
Building density0.661.52
Land useMixture of POI0.611.64
POI density0.502.01
House price level0.961.04
Transportation and travelRoad sparsity0.631.59
Bus convenience0.851.18
Subway convenience0.881.14
Population and employmentCrowd counting0.561.78
Work convenience0.691.45
Table 5. Summary result of model for social, economic and cultural vitality.
Social VitalityEconomic VitalityCultural Vitality
R20.5900.4230.409
Adjust R20.5890.4210.408
F-test582.41 **296.14 **280.32 **
Note: ** indicate passing the test at the significance level of 0.01, respectively.
Table 6. Regression coefficient results for social vitality.
Social VitalityUnstandardized CoefficientStandardized CoefficienttSig.
BStandard ErrorBeta
(Constant)231.75103.98-2.230.026
External street environmentSky rate516.24133.100.053.88<0.001
Green rate−15.80100.98−0.01−0.160.876
Building density2.080.420.065.00<0.001
Land useMixture of POI202.5864.060.043.160.002
POI density15.370.580.3626.39<0.001
House price level0.010.010.010.500.619
Transportation and travelRoad sparsity−36.773.22−0.14−11.44<0.001
Bus convenience20.684.310.054.80<0.001
Subway convenience−36.5716.65−0.02−2.200.028
Population and employmentCrowd counting26.130.880.3829.75<0.001
Work convenience41.908.110.065.17<0.001
Table 7. Regression coefficient results for economic vitality.
Economic VitalityUnstandardized CoefficientStandardized CoefficienttSig.
BStandard ErrorBeta
(Constant)−0.020.50-−0.040.972
External street environmentSky rate −3.100.63−0.08−4.89<0.001
Green rate −2.420.48−0.07−5.04<0.001
Building density −0.01<0.01−0.06−4.36<0.001
Land useMixture of POI 0.950.310.053.130.002
POI density 0.09<0.010.5333.07<0.001
House price level <0.01<0.000.054.01<0.001
Transportation and travelRoad sparsity −0.010.02−0.01−0.690.489
Bus convenience 0.050.020.032.630.009
Subway convenience−0.020.08<−0.01−0.240.809
Population and employmentCrowd counting 0.04<0.010.148.91<0.001
Work convenience0.050.040.021.230.220
Table 8. Regression coefficient results for cultural vitality.
Cultural VitalityUnstandardized CoefficientStandardized CoefficienttSig.
BStandard ErrorBeta
(Constant)−6.551.06−6.20<0.001
External street environmentSky rate −6.411.35−0.07−4.73<0.001
Green rate −7.711.03−0.11−7.50<0.001
Building density −0.030.01−0.09−6.01<0.001
Land useMixture of POI 6.870.650.1610.55<0.001
POI density 0.100.010.2716.68<0.001
House price level <0.01<0.010.043.62<0.001
Transportation and travelRoad sparsity 0.340.030.1510.43<0.001
Bus convenience 0.530.040.1511.96<0.001
Subway convenience 0.760.170.064.51<0.001
Population and employmentCrowd counting 0.030.010.042.830.005
Work convenience1.520.080.2618.47<0.001
Publisher’s Note: MDPI stays neutral with regard to jurisdictional claims in published maps and institutional affiliations.

