

Measuring Spatial Accessibility of Healthcare Facilities in Marinduque, Philippines


Department of Community and Environmental Resource Planning, College of Human Ecology, University of the Philippines Los Baños College, Laguna 4031, Philippines
ISPRS Int. J. Geo-Inf. 2022, 11(10), 516; https://doi.org/10.3390/ijgi11100516
Submission received: 24 August 2022
/
Revised: 23 September 2022
/
Accepted: 14 October 2022
/
Published: 15 October 2022
Abstract
:Sustainable development goal (SDG) 3 promotes well-being and healthy lives for people of all ages. However, based on the literature, one of the main challenges to achieving SDG 3 is inequality in access to health care. In order to support the efforts of the local government of the province to contribute to the achievement of SDG thru equitable access to health care, this study measured the spatial accessibility of healthcare facilities in Marinduque, Philippines. It used distance-based (i.e., travel-time) and area-based (i.e., enhanced two-step floating catchment analysis or E2SFCA) metrics. The distance from each healthcare facility to different villages in the province was established using QGIS and Google Maps. The distance traveled was measured using three (3) modes of transportation: tricycle, jeepney, and private vehicle. The E2SFCA scores were calculated for different population groups: the general population, women, children, and the elderly. Based on the results, island villages and those areas in the inner portion of the province lack physical access to healthcare facilities. Such a limitation was apparent in the distance- and area-based accessibility metrics. Among the population group considered in this study, the women population showed the lowest accessibility scores.
1. Introduction
Promoting well-being and ensuring healthy lives for all ages is the theme of Sustainable Development Goal (SDG) 3 [1,2,3,4]. According to Guégan et al. [5], SDG 3 relates to others since the outcomes of other goals can directly or indirectly influence individuals and the population’s health and well-being. For example, climate change (under SDG 13: Climate Action) can affect people’s health and well-being [5,6]. Air pollution and urban-island heat from urbanization (under SDG 11: Sustainable Cities and Communities) can negatively affect human well-being [5,7]. In contrast, economic and land urbanization can improve the population’s health [5,7]. One of the primary challenges to achieving SDG 3 is inequality in access to health care [3].
Access to healthcare is the access of a consumer or community to a service, provider, or institution appropriate to the proportion of their needs [8]. It is critical in achieving overall population health [9,10]. According to Evans et al. [11], access to healthcare has three dimensions. These three are physical accessibility, financial affordability, and acceptability. Physical accessibility refers to the availability of good health services within reasonable reach in case people need them. Financial affordability measures the ability of people to pay for services without financial hardship. Acceptability is the willingness of people to seek services. Although access to health care is an internationally recognized goal to meet individual health needs, more than 400 million people worldwide lack access to one or more essential health services [12,13].
Assessing physical access to healthcare services is imperative for planning and has been a long-standing concern of planners (i.e., community and public health) and policy makers [14,15]. The measurement of spatial accessibility is critical to developing effective public-health interventions [16,17,18]. In addition, finding areas with limited spatial accessibility allows planners to see the effect of opening, relocating, closing, or modifying the services of existing facilities [19]. Meanwhile, limited physical access to healthcare services is a major contributing factor to poor population health in developing countries [20]. According to Noor et al. [21], timely arrival at the appropriate diagnostic and treatment service provider strongly influences the outcome of any disease outcome. Furthermore, people’s health worsens due to a delay in receiving or an inability to receive healthcare, leading to a loss of income and higher healthcare costs [20].
The measurement of spatial accessibility is categorized into two (2) broad categories: area-based and distance-based metrics [18,22]. Area-based measures use supply (i.e., healthcare services) and demand approaches for healthcare within specified areal units (i.e., census tracts) [10,18]. Although area-based measures are highly affected by areal units of analysis, they provide a practical and straightforward method to summarize inequality in healthcare access [18]. Meanwhile, distance-based measures quantify travel time or distance to health facilities from the population center, considering the conditions of the roads and the means of transport [18,23]. Measuring travel time to assess healthcare services is the recommended methodology by the World Health Organization (WHO) [23].
Several researchers have measured spatial accessibility to determine access to health care. Mathon et al. [24] used an enhanced two-step floating catchment area (E2FCA) to assess the geographical accessibility of health services for people living on the border of Haiti and the Dominican Republic. Paul and Edwards [25] estimate the availability of public health care in developing countries of the Caribbean using an improved two-step floating catchment area (2FCA) approach. Verma and Dash [26] used the travel-time approach to measure the geographical accessibility and spatial coverage of public health care in remote rural areas of India. Shaikh and Malik [27] use spatial accessibility with other non-spatial factors to determine effective health utilization in two districts in Pakistan. Recently, Bakar et al. [28] evaluated the spatial accessibility of health facilities among patients with cerebral palsy in Peninsular Malaysia.
The two-step floating catchment analysis (2SFCA) is a widely accepted method to measure healthcare spatial accessibility [10,16,29]. According to Lou and Qi [10], this methodology is a unique case-gravity model that was first proposed by Radke and Mu [30] and later modified by Luo and Wang [16] and Lou and Wang [31]. It uses a particular physician-to-population ratio, which makes it intuitive to interpret while having the most advantages of a gravity model [10]. There are two (2) limitations of 2SFCA [10]. First, it is a dichotomous measure (meaning that all locations outside the catchment have no access at all). Second, it does not differentiate distance impedance within the catchment (meaning all population locations are assumed to have equal access to physicians). However, several studies have attempted to address these limitations, including the enhanced two-step floating catchment analysis [10,32]. The E2SFCA uses weights to differentiate travel time zones, which account for distance decay [10,32].
In the Philippines, several researchers have studied access to health care in the country. However, most of these researches explore only determinants of health care access, and none measured the spatial accessibility. Thind and Cruz [33] reported that a mother’s educational attainment and the number of illnesses determine the desire to seek care. However, such a decision considers family economic status and household size. Dror et al. [34], Quimbo et al. [35], and Gouda et al. [36] reported the effect of insurance coverage on health service utilization in the country. Bondy et al. [37] identified that maternal education affects the immunization levels of children in the country. Higuchi [38] revealed that financial constraint is key to why Filipino diabetic patients practice intermittent medication. Kim et al. [39] reported that the cost of treatment, the quality of care, and the accessibility to transportation accessibility affect the choice of hospital for children with pneumonia in Muntinlupa City.
The purpose of this study is to measure the current spatial accessibility of different villages in Marinduque, Philippines to healthcare facilities, using distance-based (i.e., travel time) and area-based (i.e., enhanced two-step floating catchment analysis, E2SFCA) approaches. Network-derived distance and travel time are also compared using QGIS and Google Maps. In addition, the study intends to measure the accessibility scores of different vulnerable groups (i.e., children, women, and the elderly) to various health facilities in the province. Lastly, the study aims to provide recommendations to improve accessibility in the province.
2. Materials and Methods
2.1. Study Area
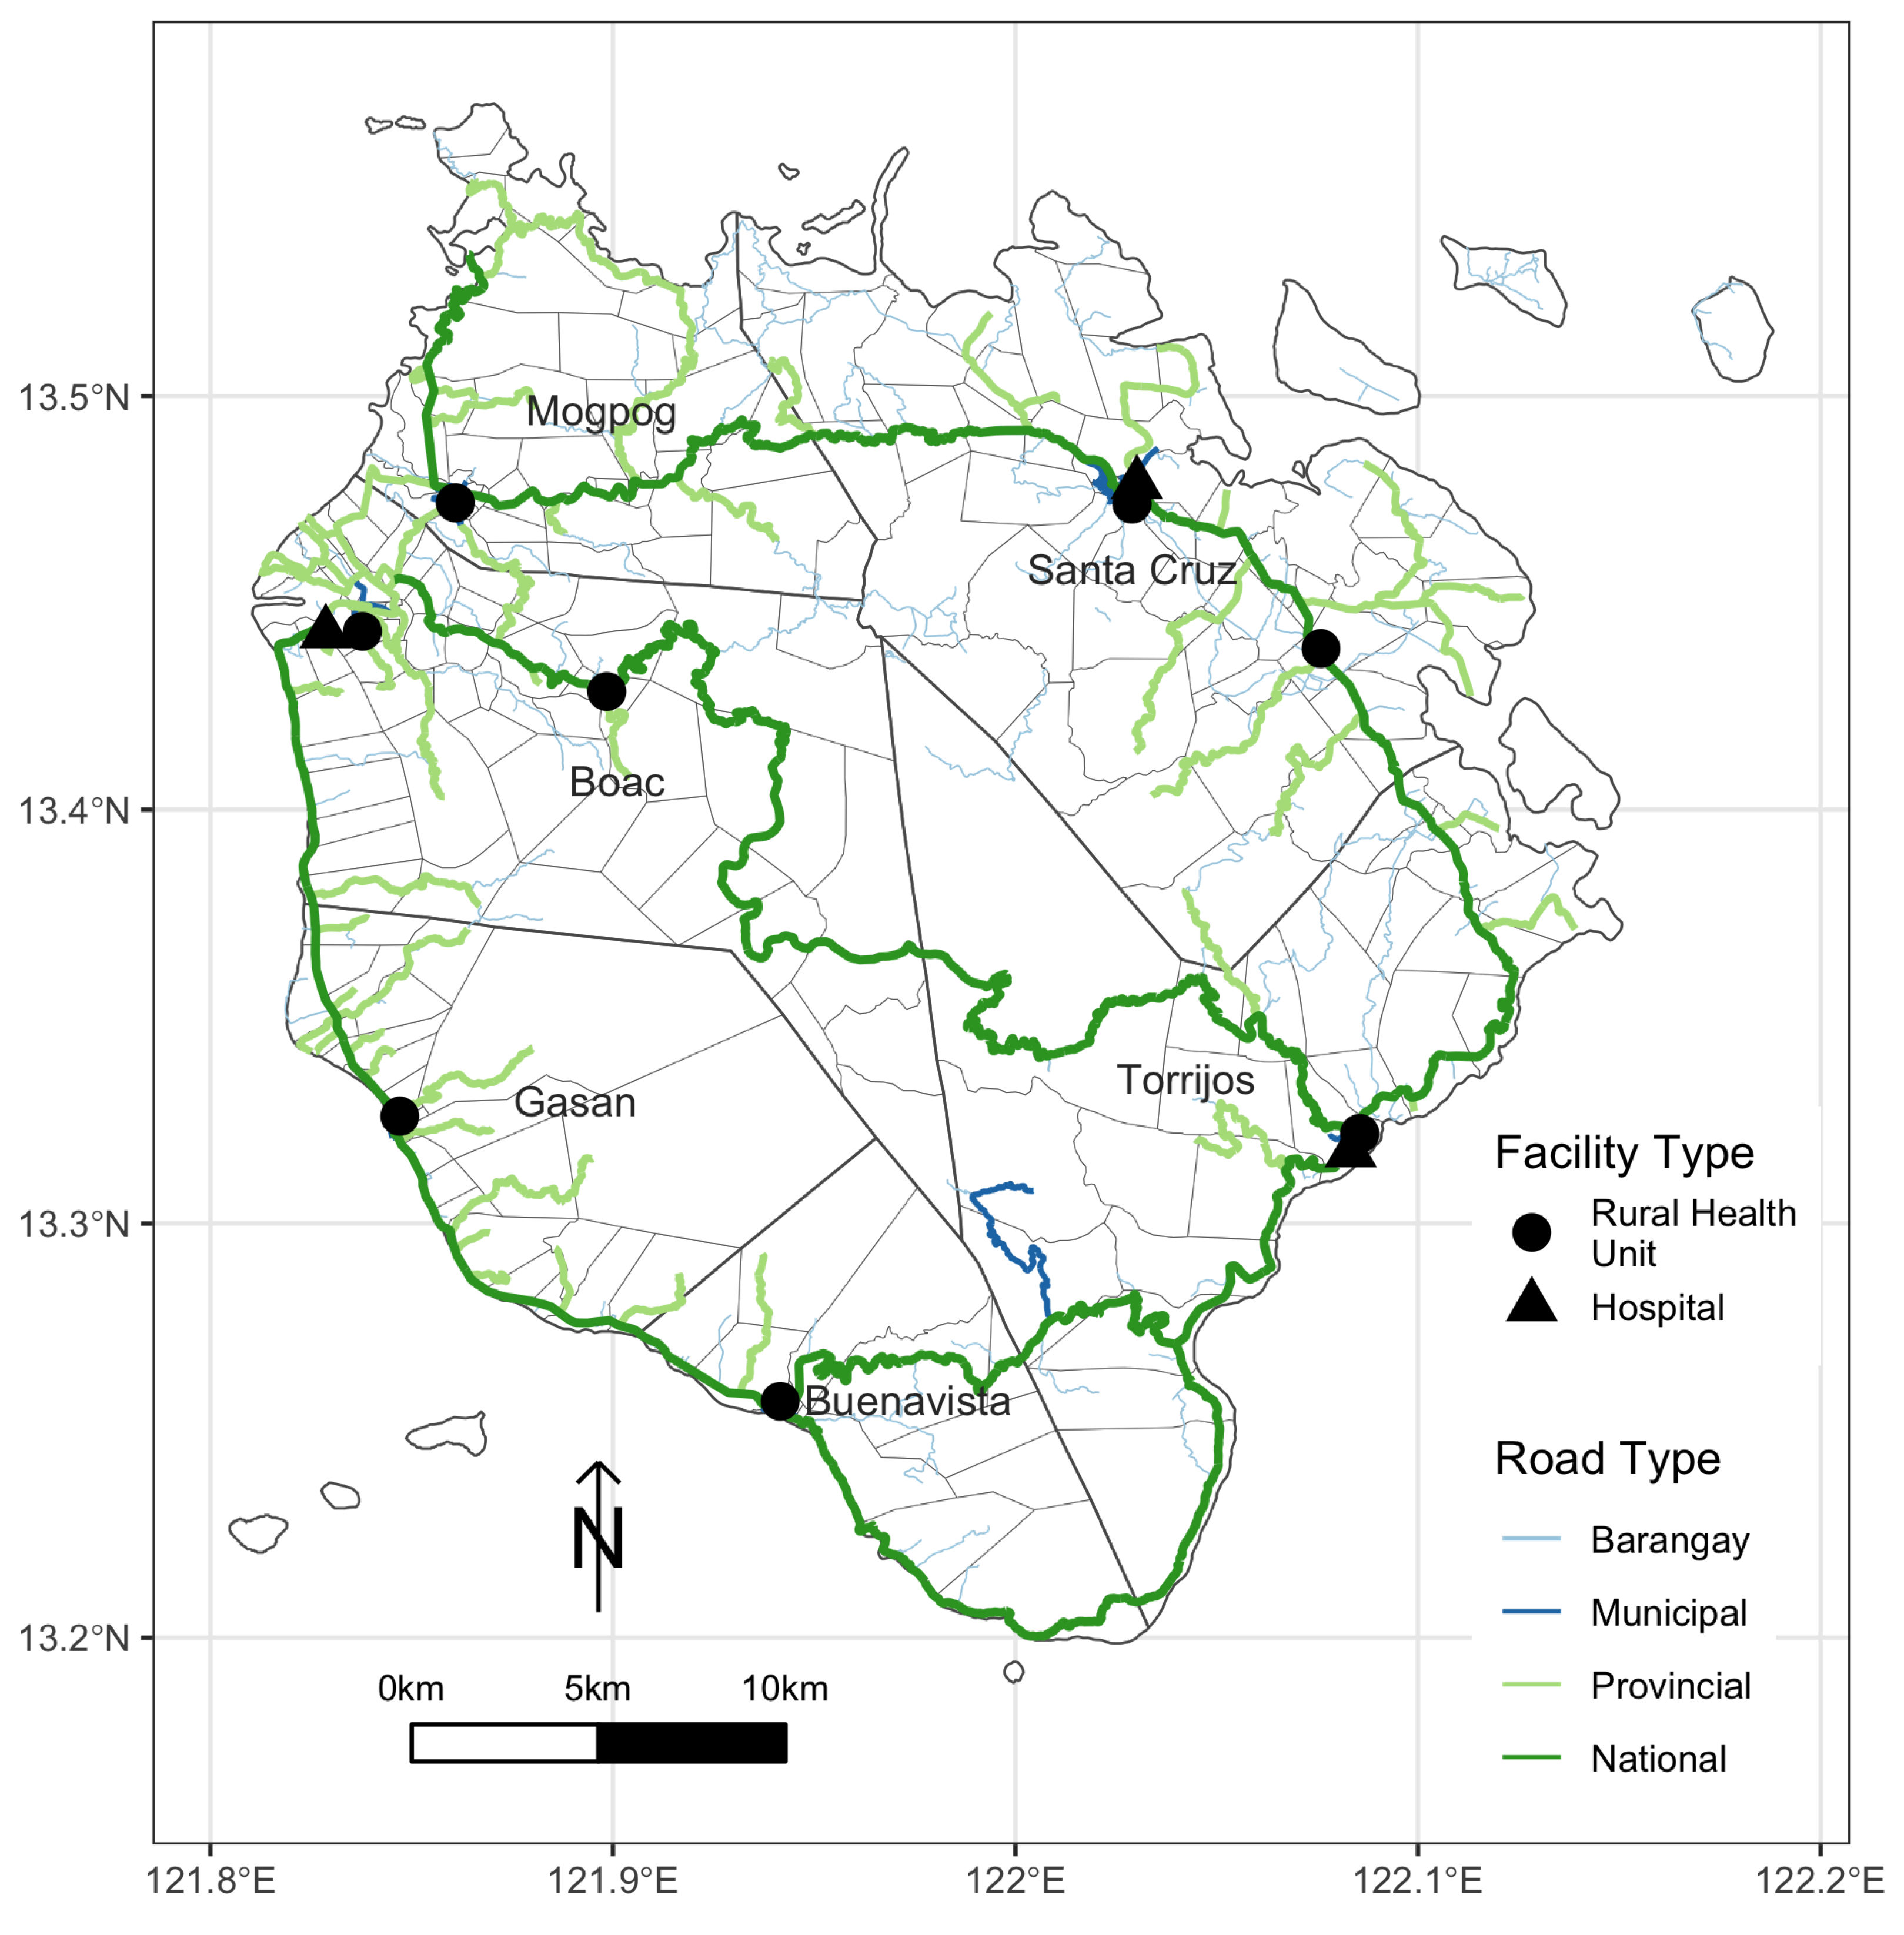
The province of Marinduque is the heart of the Philippine archipelago [40,41,42]. It has rolling terrain, mountains in the inner region, and low-lying coastal areas [43]. The province consists of six (6) municipalities; each has a rural health unit, while others also have hospitals. Municipalities manage these rural health units and are responsible for providing primary and preventive care [1]. Meanwhile, the provincial government oversees the hospitals, which provide tertiary-level health services. Table 1 shows the list of health facilities in the province, while Figure 1 shows the location of different health facilities and road networks in Marinduque.
The main livelihoods in the province are fishing and farming [40,41]. Furthermore, Marinduque has a higher rate of poverty and malnutrition than its regional neighbors [44,45]. It takes around three (3) or more hours to reach mainland Luzon by ferry. Therefore, it is imperative to measure the spatial accessibility of health facilities in the province to identify potential inequality in access to health care and help local planners and policymakers develop strategies for effective public-health intervention.
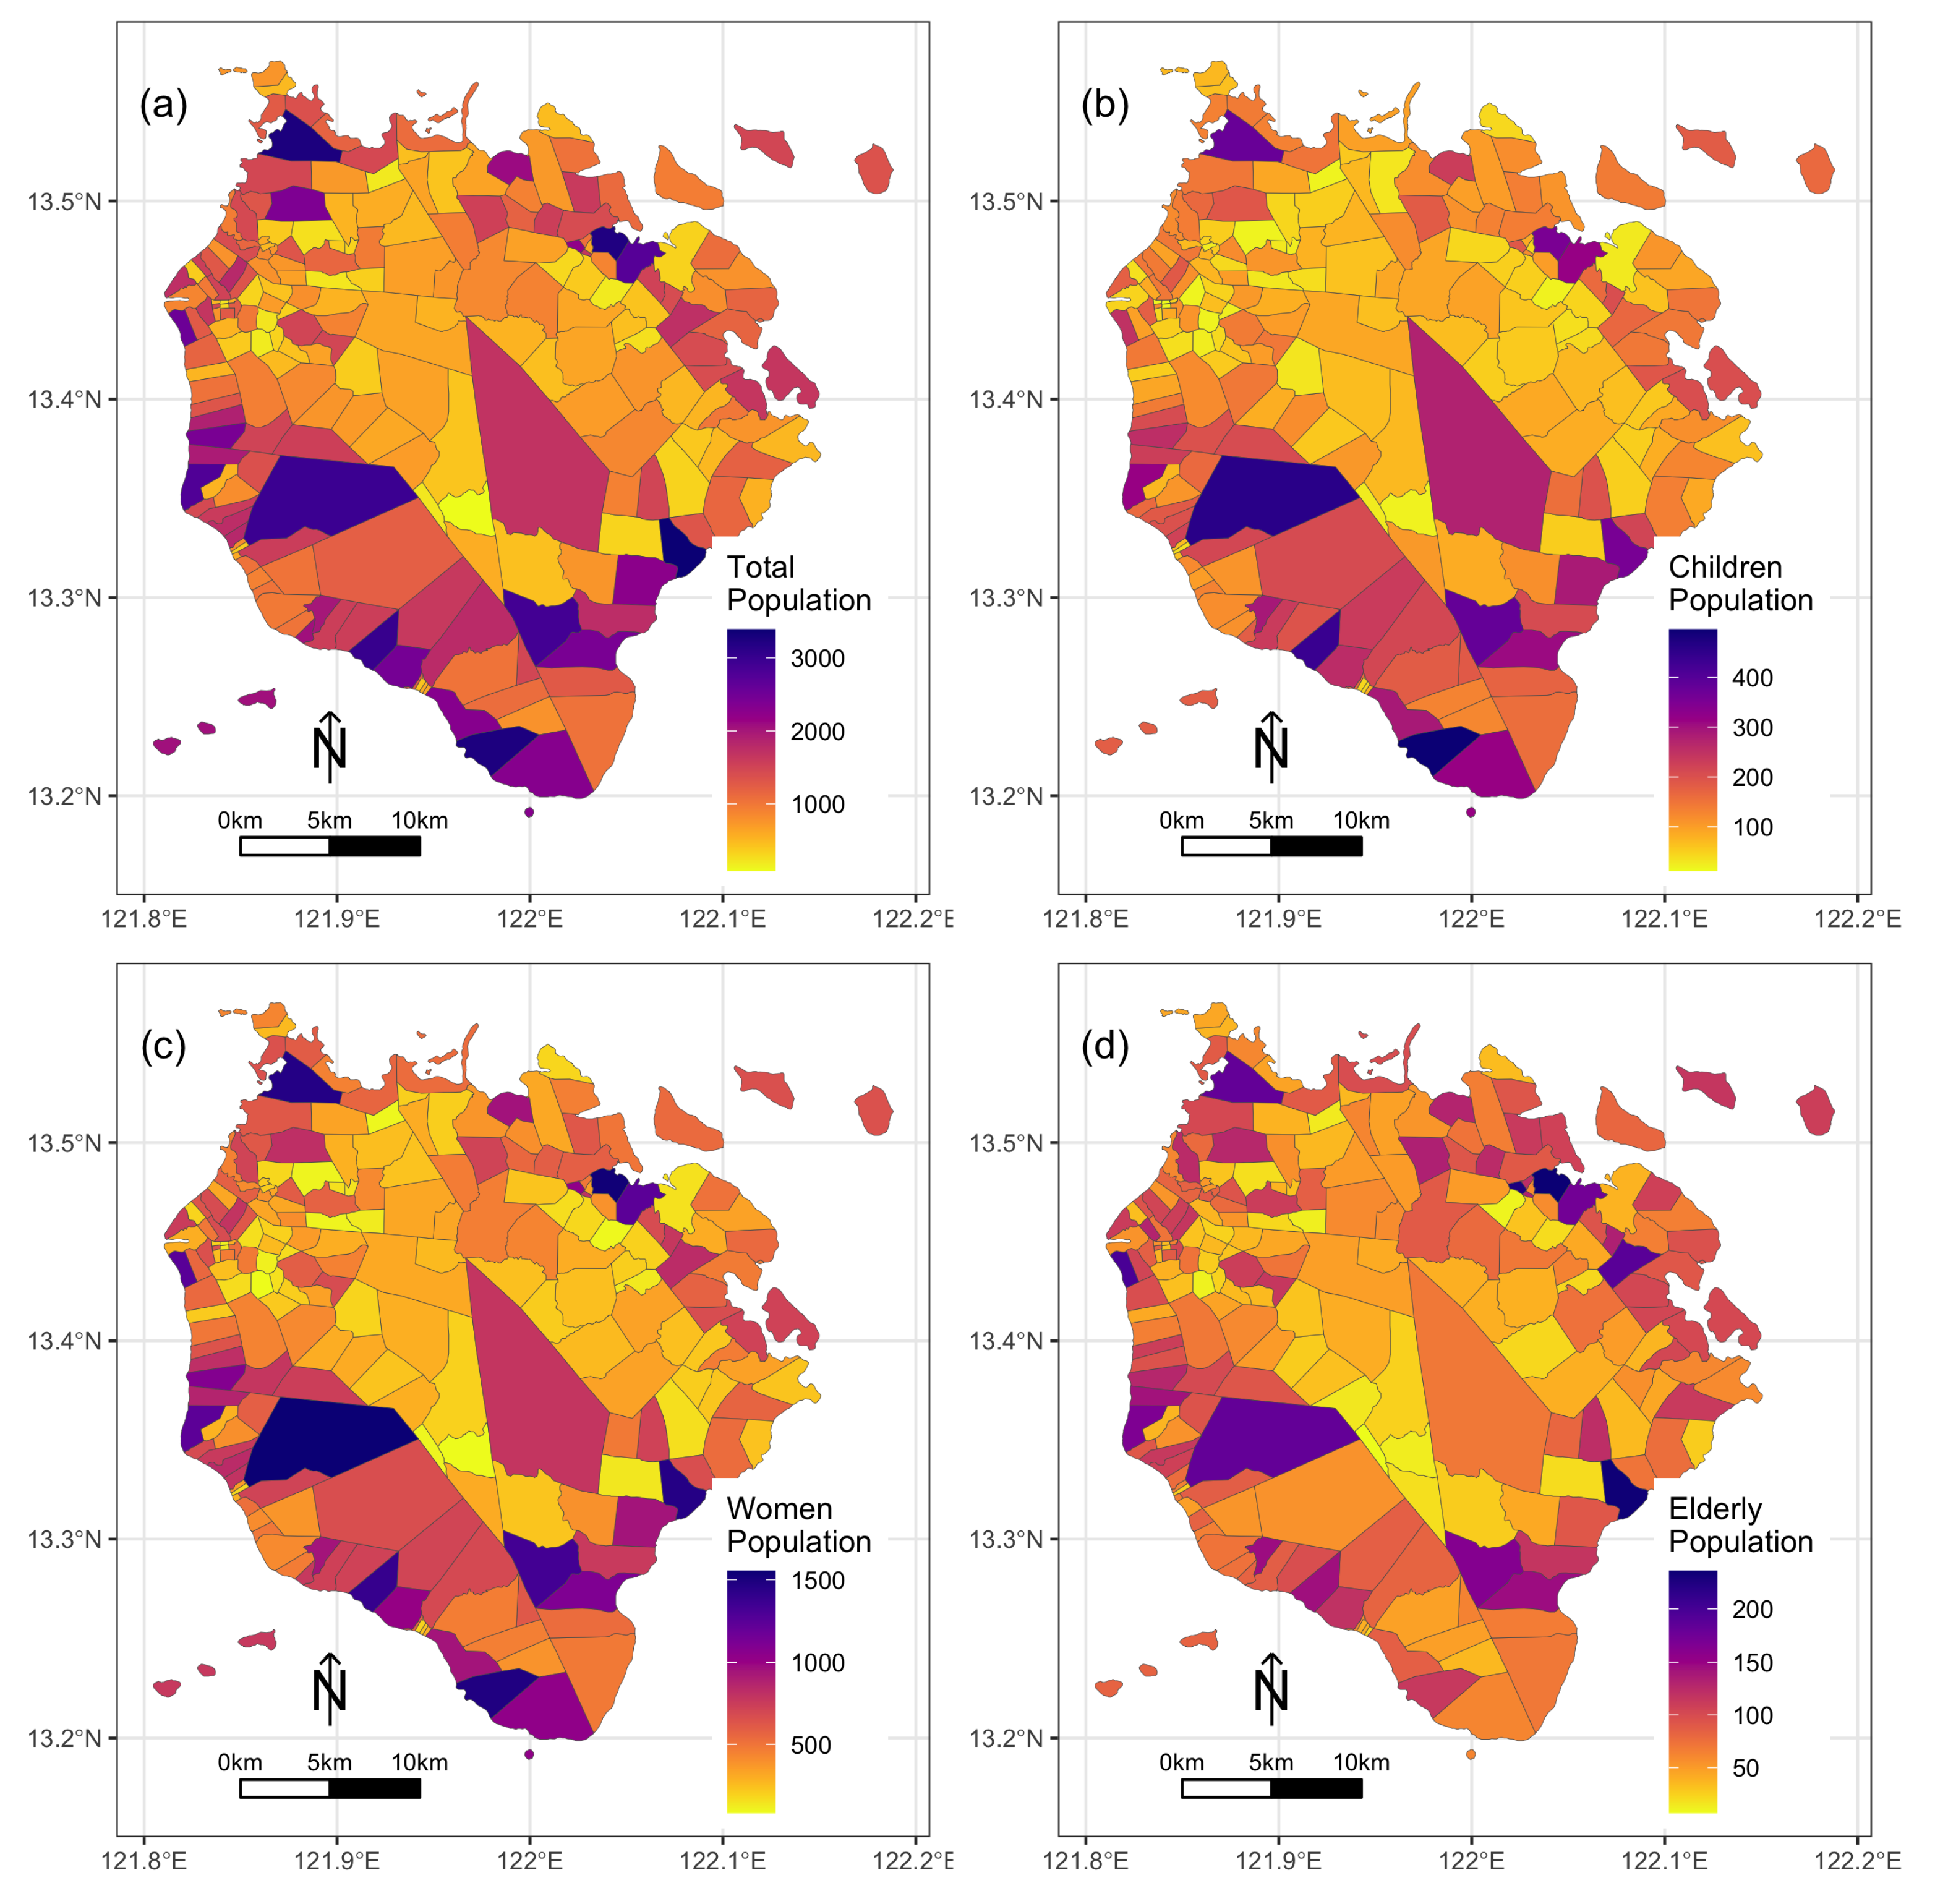
The total population of the province is around 236,000. On average, there are 1080 individuals per village. The most populated village is Poblacion, Torrijos (3389 individuals), while the least populated is Sabong, Boac (85 individuals). Approximately 45% of the Marinduque population are female, 11% are children, and 7% are elderly. In terms of village population, the highest number of women are in Tiguion, Gasan (2966 females), while the lowest number are in Tumapon, Boac (181 females). In terms of the number of children, Yook, Buenavista has the highest number (3249 children), while San Miguel, Boac has the lowest number (216 children). Bayuti, Boac (200 elderly) has the lowest number of elderly, while Lapu-Lapu, Sta. Cruz (3221 elderly) has the highest. Figure 2 shows the distribution of different population groups in Marinduque.
2.2. Data
The Marinduque village boundary map (i.e., GIS map) was from the Global Administrative Boundary map (https://gadm.org/ accessed on 11 December 2021 ). The geographic location of the healthcare facilities in the province was from previous studies of Salvacion [40,41]. The Marinduque road network map was from the Provincial Planning and Development Office (PPDO). Data on the general population, women, children, and the elderly were from the community-based monitoring system (CBMS) [45].
2.3. Distance and Travel Time Measurement
The distance and travel time from each village to different public health facilities were measured using QGIS network analysis and Google Maps. The village centroid served as the origin distance for each village [46]. The Marinduque road network GIS map was used to calculate the distances from the village to a particular health facility. Meanwhile, to calculate the distance of each village from the nearest healthcare facility using Google Maps, each village was paired with each healthcare facility through the input box of the origin and destination. The distance measured using these two approaches was also compared. The minimum distance and travel time to the healthcare facilities of each village were calculated to generate a distance-based accessibility measure. Travel time accessibility was based on the average speed of different transportation modalities in the province (tricycle, jeepney, and private vehicle) because these are the major transport system available in the province. The average travel speed for the tricycle was set at 15 kph, for the jeepney at 20 kph, and for the private car at 30 kph. Meanwhile, E2FCA was used to measure the spatial accessibility of different general populations and specific population groups (i.e., children, women, and elderly) for each village in the province.
2.4. E2SFCA
The E2SFCA formula used in this study was from Nakamura et al. [32]. This method adopts a weighting coefficient (Equation (1)) based on the distance decay function [12,32] using the calculated distance from each village to the specific healthcare facility from the QGIS network analysis. The catchment population for each hospital is the sum of the individuals of each village weighted by the distance decay (Equation (2)). Then, the provider-to-population ratio of the catchment of a particular hospital for each block was the reciprocal of the catchment’s population weighed by the distance decay. The sum of the ratio of the weighting coefficient to the catchment population for each block is the E2SFCA score (Equation (3)) [32]. The average travel time thresholds for patients to reach a healthcare facility were within 15 and 60 min, respectively, adopting previous studies elsewhere [47,48]. The E2SCFA scores for each population group (i.e., general, children, women, and elderly) were calculated using CBMS data. For example, for the general population group, the total population per village was used as an input, while for a specific group, the reported population of children, women, and the elderly per village was used.
where represents the distance (km) between village i and healthcare facility j. and are the average distances to reach a healthcare facility within 15 and 60 min, respectively.
where represents the population around hospital j, represents the weighing coefficient, and represents the population within village i.
where represents the E2SFCA score of village i, represents the population around healthcare facility j, represents the weighing coefficient, and represents the number of healthcare facility j.
3. Results
3.1. Distance Measurement
Figure 3 compares the distance measurements generated using Google Maps and QGIS. There is a strong correlation (r = 0.92) between the distance using Google Maps and QGIS. Meanwhile, mapping the average residuals per village of the linear model fitted between the two data sets reveals a varying spatial pattern of difference between the two approaches (Figure 4). Compared to QGIS, the distance from Google Maps healthcare facilities to villages in the inner part and the island part of the province is longer. It shows the opposite in most towns in the city centers.
3.2. Minimum Distance and Travel Time
Figure 5 shows the map of the minimum travel distance of the different villages in Marinduque to the nearest healthcare facility. The minimum travel distance to the nearest healthcare facility is around 6 km. The shortest travel distance to the nearest healthcare facility is about 140 m, and the farthest is 20 km. Meanwhile, in terms of travel time, the different transportation modalities show varying proportions of villages with access to the nearest healthcare facility within the 15- to 1-h travel time (Figure 6). Roughly 34% of the villages are within the 15 min travel time to the nearest healthcare facility, 62% are within the 15–60 min travel time, and 3% are outside the 60 min travel time when using tricycles as the medium of transportation (Figure Figure 6a). Using the jeepney as the mode of transportation, the proportion of villages within the 15 min travel time increased to 49%, while the percentage of areas within the 15–60 min and beyond the 60 min travel time decreased to 50% and 2%, respectively (Figure 6b). Lastly, when using the private car as a mode of transportation, the proportion of villages within the 15 min travel time was around 73%, 26.5% within 15–60 min, and 0.5% beyond the 60 min travel time (Figure 6c).
3.3. Accessibility Scores
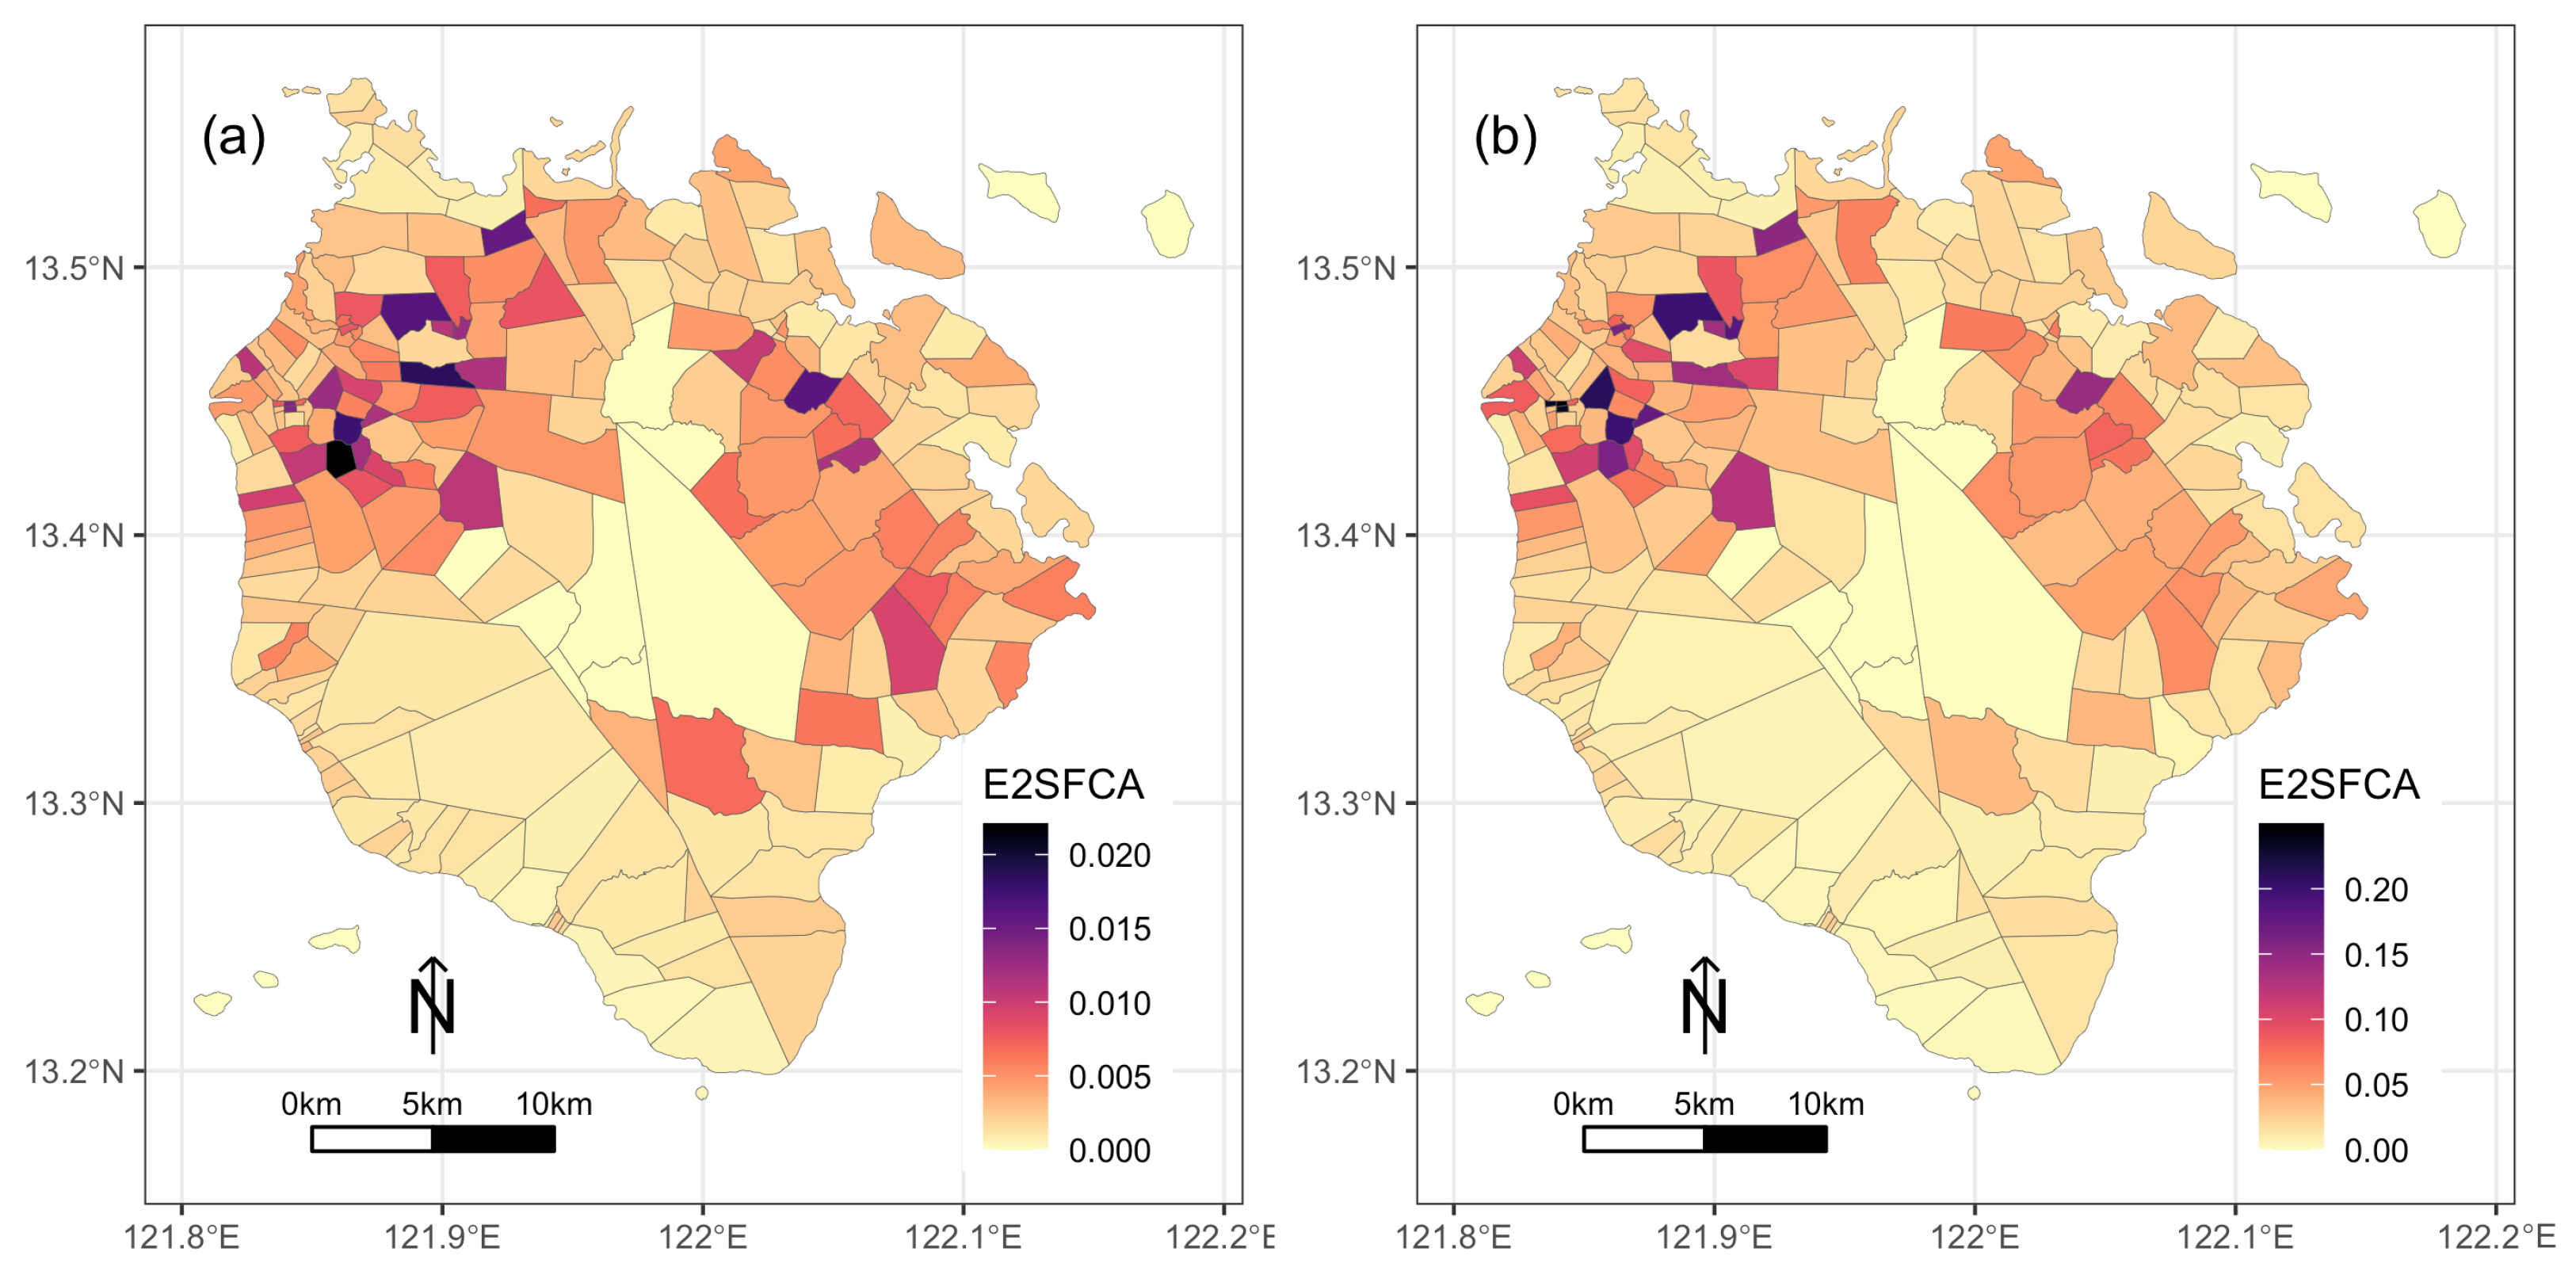
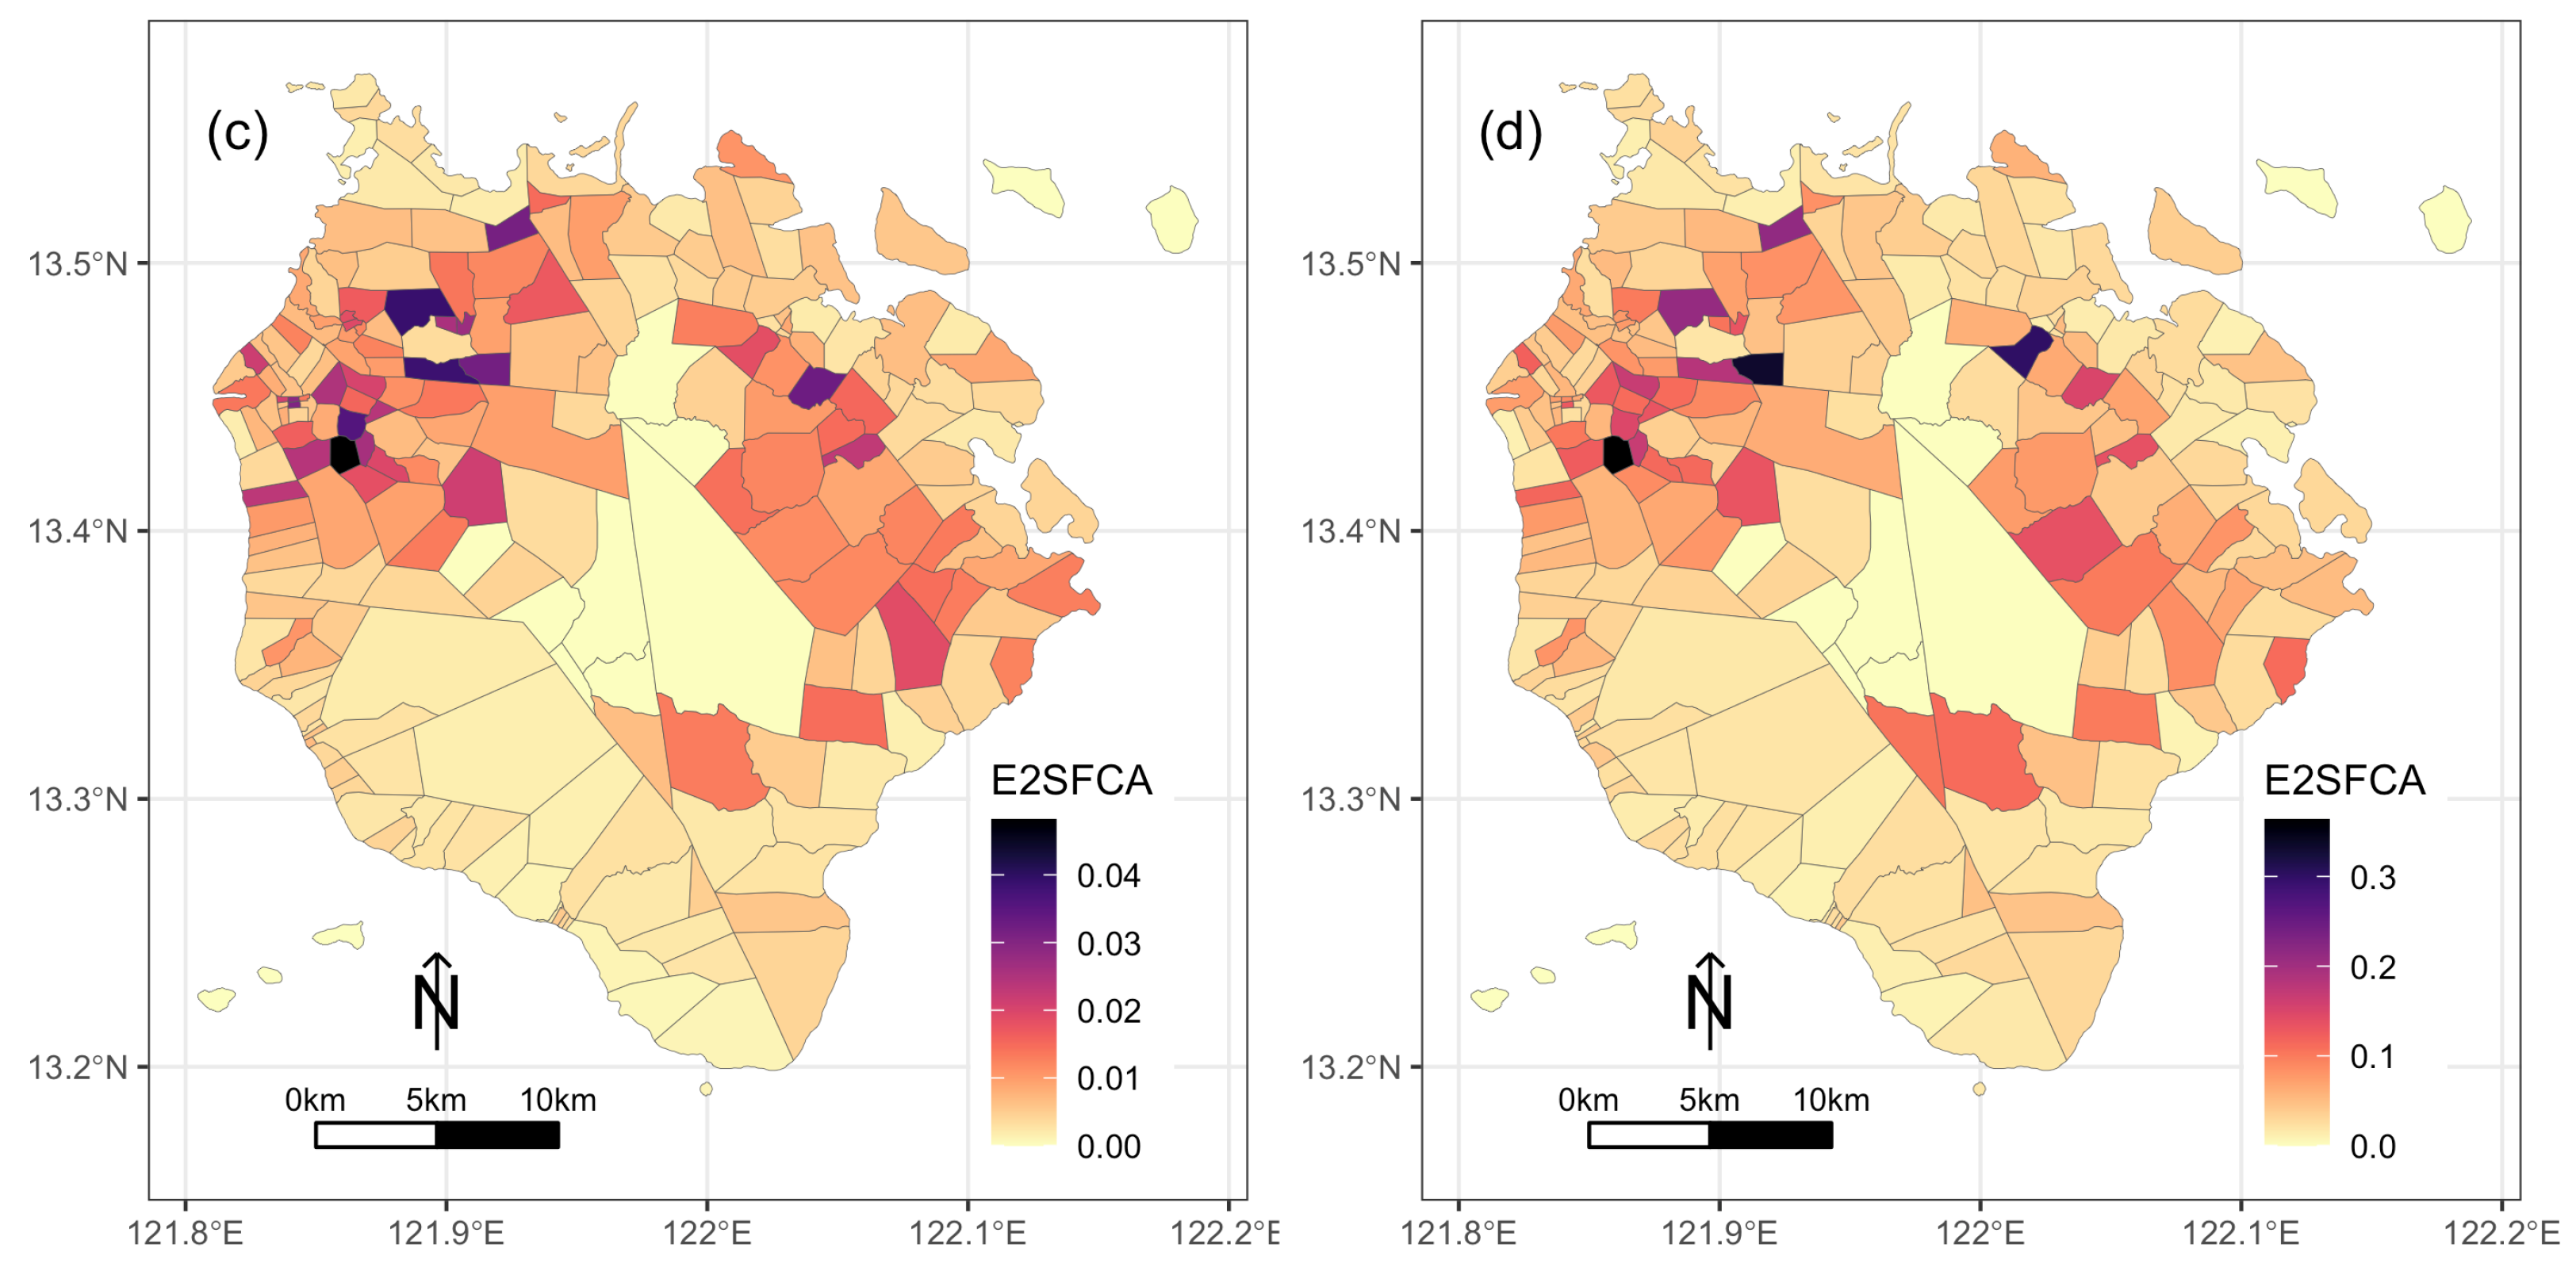
Since the tricycle is Marinduque’s most common mode of transportation, an average speed of 15 kph is the set speed to calculate the distance of 15 and 60 min of travel time for the E2SFCA. In addition, the QGIS-generated distance measurement data was used to calculate accessibility scores because the Marinduque provincial government road network map provided better coverage of the entire province compared to Google Maps. Based on the calculation, the accessibility scores for a different population group in Marinduque varies spatially (Figure 7). However, the spatial pattern of the scores for each population group is almost similar. There are higher accessibility scores in the northeast and northwest part of the province, while the island and interior villages have the lowest accessibility scores. The general population’s accessibility scores ranged from 0 to 0.022, with a mean of 0.004. The children’s population has higher accessibility scores than the general population. The accessibility scores for the children’s group range from 0 to 0.25 and have a mean of 0.039. The mean accessibility score for women was 0.001, ranging from 0 to 0.048. Lastly, the elderly population had the highest accessibility score, ranging from 0 to 0.36 and with a mean of 0.05.
4. Discussion
This study measured the spatial accessibility of villages to healthcare facilities in Marinduque, Philippines. Using two approaches (i.e., QGIS network analysis and Google Map), the study measured the distance between villages and healthcare facilities. Although there is a strong correlation between the two measurements, there are still discrepancies. Wang and Xu [49] reported similar discrepancy results but a high correlation (R2 = 0.91) between the travel time calculated using ArcGIS Network Analyst and Google Map. Such discrepancies can be attributed to updated data, geometric accuracy, and the algorithm for calculating the travel time [49]. For example, Wang and Xu [49] cited that Google Maps has more updated data compared to what they used in ArcGIS Network Analyst. In the case of Marinduque, the differences can be due to the presence or absence of Google Maps road network data in the province. For example, in villages in the inner part of Marinduque, where there are limited or no available Google Maps road-network data, the application tries to provide a longer route to connect the village to a specific health facility.
With accessibility to healthcare facilities, the study showed the consistent disadvantages of the island villages and those in the inner portion of the province, for example, islands in the municipality of Sta. Cruz, the Tres Reyes Island in Gasan, and some interior villages in Boac are consistently beyond 60 min travel time via tricycle or jeepney. Similarly, the E2SFCA scores of these villages are below the standard ratio of 1/10,000 population to healthcare facility and can be classified as shortage areas [50]. Meanwhile, the relatively low E2SFCA score of the villages in the southwest part of the province is worth noting. These villages are in the municipalities of Gasan and Buenavista, where the RHU is the only available healthcare facility and is relatively farther from hospitals. Children and the elderly have higher E2SFCA scores due to their smaller population size than the other groups. However, the low range of E2SCFA scores for the women population is due to the larger population size of women per village compared to children and the elderly, which affects the provider-to-population ratio in the E2SFCA calculation.
Optimal access to healthcare decreases health inequalities and improves health status [51]. In the case of Marinduque, the provincial government needs to find ways to improve spatial access to healthcare facilities in the province to provide universal health coverage to its constituent. For example, a hospital near the boundary of Gasan and Buenavista can improve the spatial accessibility of its villages. An additional RHU can do the same for the interior portion of the municipality of Boac. Additionally, the provincial government can also consider short-term medical trips or missions to areas with limited to no access to healthcare facilities. Access to healthcare for the female population should also be a priority in the province. According to Rukmana [52], women are more likely to be affected by infectious diseases and suffer illnesses due to the lack or deprivation of preventive health services. Meanwhile, this study only covers accessibility to infrastructure and only considers the physical locations of healthcare facilities. The issue of healthcare capacities, such as the number of physicians, bed capacity, and propensity to avail healthcare services among the population of Marinduque, is beyond the scope of this study.
5. Conclusions
This study evaluated the spatial accessibility of healthcare facilities in each village in the Marinduque province using travel time and E2SFCA. The results showed that access to healthcare facilities varies between villages in Marinduque. However, areas in the inner part and those on smaller islands have consistently limited access to health facilities. Furthermore, among the population group (i.e., general population, children, women, and the elderly), women have the lowest accessibility score. The results of this study can help policymakers in Marinduque to design effective measures to improve healthcare accessibility in the province, especially for children, women, and the elderly population of the province. Meanwhile, other parts of the country can adopt the approach used in this study; distance measurements from Google Maps can be an alternative in areas with limited or no GIS data on the road network.
Funding
This study was funded by the Office of the Vice President for Academic Affairs (OVPAA) of the University of the Philippines System under the Enhanced Creative Work and Research Grant (ECWRG), Grant No: ECWRG-2020-2-31R.
Institutional Review Board Statement
Not applicable.
Informed Consent Statement
Not applicable.
Data Availability Statement
Not applicable.
Acknowledgments
The author would like to acknowledge the help of the Marinduque Provincial Government and the Provincial Planning Development Office for providing the latest CBMS data of the province, especially Rocy Moreno and Richard Calub.
Conflicts of Interest
The author declares no competing interest.
References
- Dodd, W.; Kipp, A.; Nicholson, B.; Lau, L.L.; Little, M.; Walley, J.; Wei, X. Governance of community health worker programs in a decentralized health system: A qualitative study in the Philippines. BMC Health Serv. Res. 2021, 21, 451. [Google Scholar] [CrossRef] [PubMed]
- Eckermann, E. SDG 3: A Missed Opportunity to Transform Understandings and Monitoring of Health, Well-Being and Development? Appl. Res. Qual. Life 2018, 13, 261–272. [Google Scholar] [CrossRef]
- Lawal, O.; Anyiam, F.E. Modelling geographic accessibility to Primary Health Care Facilities: Combining open data and geospatial analysis. Geo-Spat. Inf. Sci. 2019, 22, 174–184. [Google Scholar] [CrossRef] [Green Version]
- Palozzi, G.; Schettini, I.; Chirico, A. Enhancing the Sustainable Goal of Access to Healthcare: Findings from a Literature Review on Telemedicine Employment in Rural Areas. Sustainability 2020, 12, 3318. [Google Scholar] [CrossRef] [Green Version]
- Guégan, J.F.; Suzán, G.; Kati-Coulibaly, S.; Bonpamgue, D.N.; Moatti, J.P.; Guégan, J.F.; Suzán, G.; Kati-Coulibaly, S.; Bonpamgue, D.N.; Moatti, J.P. Sustainable Development Goal #3, “health and well-being”, and the need for more integrative thinking. Vet. México OA 2018, 5. [Google Scholar] [CrossRef]
- Havea, P.; Hemstock, S.; des Combes, H. Improving health and well-being through climate change adaptation. In Advances in Health and Disease; Nova Science Publishers, Inc.: Hauppauge, NY, USA, 2018; Volume 4, pp. 215–230. [Google Scholar]
- Liu, R.; Dong, X.; Wang, X.C.; Zhang, P.; Liu, M.; Zhang, Y. Study on the relationship among the urbanization process, ecosystem services and human well-being in an arid region in the context of carbon flow: Taking the Manas river basin as an example. Ecol. Indic. 2021, 132, 108248. [Google Scholar] [CrossRef]
- Levesque, J.F.; Harris, M.F.; Russell, G. Patient-centred access to health care: Conceptualising access at the interface of health systems and populations. Int. J. Equity Health 2013, 12, 18. [Google Scholar] [CrossRef] [Green Version]
- Guagliardo, M.F. Spatial accessibility of primary care: Concepts, methods and challenges. Int. J. Health Geogr. 2004, 3, 1–13. [Google Scholar] [CrossRef] [PubMed] [Green Version]
- Luo, W.; Qi, Y. An enhanced two-step floating catchment area (E2SFCA) method for measuring spatial accessibility to primary care physicians. Health Place 2009, 15, 1100–1107. [Google Scholar] [CrossRef]
- Evans, D.B.; Hsu, J.; Boerma, T. Universal health coverage and universal access. Bull. World Health Organ. 2013, 91, 546-546A. [Google Scholar] [CrossRef]
- McGrail, M.R.; Humphreys, J.S. The index of rural access: An innovative integrated approach for measuring primary care access. BMC Health Serv. Res. 2009, 9, 124. [Google Scholar] [CrossRef] [PubMed] [Green Version]
- Woolley, T.; Cristobal, F.; Siega-Sur, J.; Ross, S.; Neusy, A.J.; Halili, S.; Reeve, C. Positive implications from socially accountable, community-engaged medical education across two Philippines regions. Rural Remote Health 2018, 18, 1–10. [Google Scholar] [CrossRef] [PubMed] [Green Version]
- Comber, A.J.; Brunsdon, C.; Radburn, R. A spatial analysis of variations in health access: Linking geography, socio-economic status and access perceptions. Int. J. Health Geogr. 2011, 10, 44. [Google Scholar] [CrossRef] [Green Version]
- Al-Taiar, A.; Clark, A.; Longenecker, J.C.; Whitty, C.J. Physical accessibility and utilization of health services in Yemen. Int. J. Health Geogr. 2010, 9, 38. [Google Scholar] [CrossRef] [Green Version]
- Luo, W.; Wang, F. Spatial accessibility to primary care and physician shortage area designation: A case study in Illinois with GIS approaches. Geogr. Inf. Syst. Health Appl. 2003, 260–278. [Google Scholar]
- Wang, X.; Yang, H.; Duan, Z.; Pan, J. Spatial accessibility of primary health care in China: A case study in Sichuan Province. Soc. Sci. Med. 2018, 209, 14–24. [Google Scholar] [CrossRef]
- Pu, Q.; Yoo, E.H.; Rothstein, D.H.; Cairo, S.; Malemo, L. Improving the spatial accessibility of healthcare in North Kivu, Democratic Republic of Congo. Appl. Geogr. 2020, 121, 102262. [Google Scholar] [CrossRef]
- Delamater, P.L.; Messina, J.P.; Shortridge, A.M.; Grady, S.C. Measuring geographic access to health care: Raster and network-based methods. Int. J. Health Geogr. 2012, 11, 15. [Google Scholar] [CrossRef] [Green Version]
- Peters, D.H.; Garg, A.; Bloom, G.; Walker, D.G.; Brieger, W.R.; Rahman, M.H. Poverty and Access to Health Care in Developing Countries. Ann. N. Y. Acad. Sci. 2008, 1136, 161–171. [Google Scholar] [CrossRef]
- Noor, A.M.; Zurovac, D.; Hay, S.I.; Ochola, S.A.; Snow, R.W. Defining equity in physical access to clinical services using geographical information systems as part of malaria planning and monitoring in Kenya. Trop. Med. Int. Health 2003, 8, 917–926. [Google Scholar] [CrossRef] [PubMed] [Green Version]
- Mclafferty, S.; Williamson, D.; McGuire, P.G. Identifying Crime Hot Spots Using Kernel Smoothing. In Analyzing Crime Patterns: Frontiers of Practice; SAGE Publications, Inc.: Thousand Oaks, CA, USA, 2000; pp. 77–86. [Google Scholar] [CrossRef]
- dos Anjos Luis, A.; Cabral, P. Geographic accessibility to primary healthcare centers in Mozambique. Int. J. Equity Health 2016, 15, 173. [Google Scholar] [CrossRef] [PubMed] [Green Version]
- Mathon, D.; Apparicio, P.; Lachapelle, U. Cross-border spatial accessibility of health care in the North-East Department of Haiti. Int. J. Health Geogr. 2018, 17, 36. [Google Scholar] [CrossRef] [PubMed] [Green Version]
- Paul, J.; Edwards, E. Temporal availability of public health care in developing countries of the Caribbean: An improved two-step floating catchment area method for estimating spatial accessibility to health care. Int. J. Health Plan. Manag. 2019, 34, e536–e556. [Google Scholar] [CrossRef] [PubMed] [Green Version]
- Verma, V.R.; Dash, U. Geographical accessibility and spatial coverage modelling of public health care network in rural and remote India. PLoS ONE 2020, 15, e0239326. [Google Scholar] [CrossRef] [PubMed]
- Shaikh, M.; Malik, N. Spatial distribution and accessibility to public sector tertiary care teaching general hospitals: Tale of Two Khyber Pakhtunkhwa districts—Peshawar and Abbottabad. J. Coll. Physicians Surg. Pak. 2019, 29, 87–89. [Google Scholar] [CrossRef] [PubMed]
- Bakar, M.; Samat, N.; Yaacob, N. Spatial accessibility to health care services among children with cerebral palsy in Johor, Peninsular Malaysia. Geospat. Health 2021, 16, 987. [Google Scholar] [CrossRef]
- Fransen, K.; Neutens, T.; De Maeyer, P.; Deruyter, G. A commuter-based two-step floating catchment area method for measuring spatial accessibility of daycare centers. Health Place 2015, 32, 65–73. [Google Scholar] [CrossRef] [PubMed]
- Radke, J.; Mu, L. Spatial decompositions, modeling and mapping service regions to predict access to social programs. Geogr. Inf. Sci. 2000, 6, 105–112. [Google Scholar] [CrossRef]
- Luo, W.; Wang, F. Measures of Spatial Accessibility to Health Care in a GIS Environment: Synthesis and a Case Study in the Chicago Region. Environ. Plan. B Plan. Des. 2003, 30, 865–884. [Google Scholar] [CrossRef] [PubMed] [Green Version]
- Nakamura, T.; Nakamura, A.; Mukuda, K.; Harada, M.; Kotani, K. Potential accessibility scores for hospital care in a province of Japan: GIS-based ecological study of the two-step floating catchment area method and the number of neighborhood hospitals. BMC Health Serv. Res. 2017, 17, 438. [Google Scholar] [CrossRef] [PubMed]
- Thind, A.; Cruz, A.M. Determinants of Children’s Health Services Utilization in the Philippines. J. Trop. Pediatr. 2003, 49, 269–273. [Google Scholar] [CrossRef] [PubMed] [Green Version]
- Dror, D.M.; Soriano, E.S.; Lorenzo, M.E.; Sarol, J.N.; Azcuna, R.S.; Koren, R. Field based evidence of enhanced healthcare utilization among persons insured by micro health insurance units in Philippines. Health Policy 2005, 73, 263–271. [Google Scholar] [CrossRef] [PubMed]
- Quimbo, S.A.; Peabody, J.W.; Shimkhada, R.; Florentino, J.; Solon, O. Evidence of a causal link between health outcomes, insurance coverage, and a policy to expand access: Experimental data from children in the Philippines. Health Econ. 2011, 20, 620–630. [Google Scholar] [CrossRef] [PubMed]
- Gouda, H.; Hodge, A.; Bermejo, R., III; Zeck, W.; Jimenez-Soto, E. The impact of healthcare insurance on the utilisation of facility-based delivery for childbirth in the philippines. PLoS ONE 2016, 11, e0167268. [Google Scholar] [CrossRef] [PubMed]
- Bondy, J.N.; Thind, A.; Koval, J.J.; Speechley, K.N. Identifying the determinants of childhood immunization in the Philippines. Vaccine 2009, 27, 169–175. [Google Scholar] [CrossRef] [PubMed]
- Higuchi, M. Access to Diabetes Care and Medicines in the Philippines. Asia Pac. J. Public Health 2010, 22, 96S–102S. [Google Scholar] [CrossRef]
- Kim, S.A.; Capeding, M.R.Z.; Kilgore, P.E. Factors influencing healthcare utilization among children with pneumonia in Muntinlupa City, the Philippines. Southeast Asian J. Trop. Med. Public Health 2014, 45, 727–735. [Google Scholar]
- Salvacion, A. Exploring Determinants of Child Malnutrition in Marinduque Island, Philippines. Hum. Ecol. 2017, 45, 853–863. [Google Scholar] [CrossRef]
- Salvacion, A.R. Spatial pattern and determinants of village level poverty in Marinduque Island, Philippines. GeoJournal 2020, 85, 257–267. [Google Scholar] [CrossRef]
- Lutero, D.S.; Cerilo, G.E.A.; Eustaquio, A.M.; Buhat, C.A.H.; Nazareno, A.O.; Nazareno, A.L.; Salvacion, A.R. Optimal route planning for day tours in Marinduque, Philippines. Spat. Inf. Res. 2022, 30, 205–214. [Google Scholar] [CrossRef]
- Salvacion, A. Mapping land limitations for agricultural land use planning using fuzzy logic approach: A case study for Marinduque Island, Philippines. GeoJournal 2021, 86, 915–925. [Google Scholar] [CrossRef]
- Reyes, C.; Due, E. Fighting Poverty with Facts Community-Based Monitoring Systems; International Development Research Centre: Ottawa, ON, Canada, 2009. [Google Scholar]
- Reyes, C.; Mandap, A.; Quilitis, J.; Calubayan, S.; Nabiong, J.; Adudar, R.; Binas, V.; Bacud, E.; Moreto, J. The Many Faces of Poverty: Volume 8. Technical Report; De La Salle University: Manila, Philippines, 2017. [Google Scholar]
- Duran-Fernandez, R.; Santos, G. Gravity, distance, and traffic flows in Mexico. Res. Transp. Econ. 2014, 46, 30–35. [Google Scholar] [CrossRef]
- Wu, J.; Cai, Z.; Li, H. Accessibility of Medical Facilities in Multiple Traffic Modes: A Study in Guangzhou, China. Complexity 2020, 2020, e8819836. [Google Scholar] [CrossRef]
- Zhuge, C.; Shao, C.; Li, X.; Yu, M. Commuter’s choice behavior of travel time and travel mode. J. Transp. Syst. Eng. Inf. Technol. 2012, 12, 126–131. [Google Scholar]
- Wang, F.; Xu, Y. Estimating O–D travel time matrix by Google Maps API: Implementation, advantages, and implications. Ann. GIS 2011, 17, 199–209. [Google Scholar] [CrossRef]
- Weinhold, I.; Gurtner, S. Understanding shortages of sufficient health care in rural areas. Health Policy 2014, 118, 201–214. [Google Scholar] [CrossRef] [PubMed]
- Gao, F.; Jaffrelot, M.; Deguen, S. Measuring hospital spatial accessibility using the enhanced two-step floating catchment area method to assess the impact of spatial accessibility to hospital and non-hospital care on the length of hospital stay. BMC Health Serv. Res. 2021, 21, 1078. [Google Scholar] [CrossRef]
- Rukmana, D. Vulnerable Populations. In Encyclopedia of Quality of Life and Well-Being Research; Michalos, A.C., Ed.; Springer: Dordrecht, The Netherlands, 2014; pp. 6989–6992. [Google Scholar] [CrossRef]
Figure 1.
Map of healthcare facilities and road network in the province of Marinduque. Note that the thicker black lines in the map represent the municipal boundary, while the grey black lines are the village boundary.
Figure 1.
Map of healthcare facilities and road network in the province of Marinduque. Note that the thicker black lines in the map represent the municipal boundary, while the grey black lines are the village boundary.

Figure 2.
Map of the population distribution of different population groups in the province of Marinduque: (a) general population; (b) children; (c) women; and, (d) elderly.
Figure 2.
Map of the population distribution of different population groups in the province of Marinduque: (a) general population; (b) children; (c) women; and, (d) elderly.

Figure 3.
Scatterplot between distance measure generated using Google Maps and QGIS.
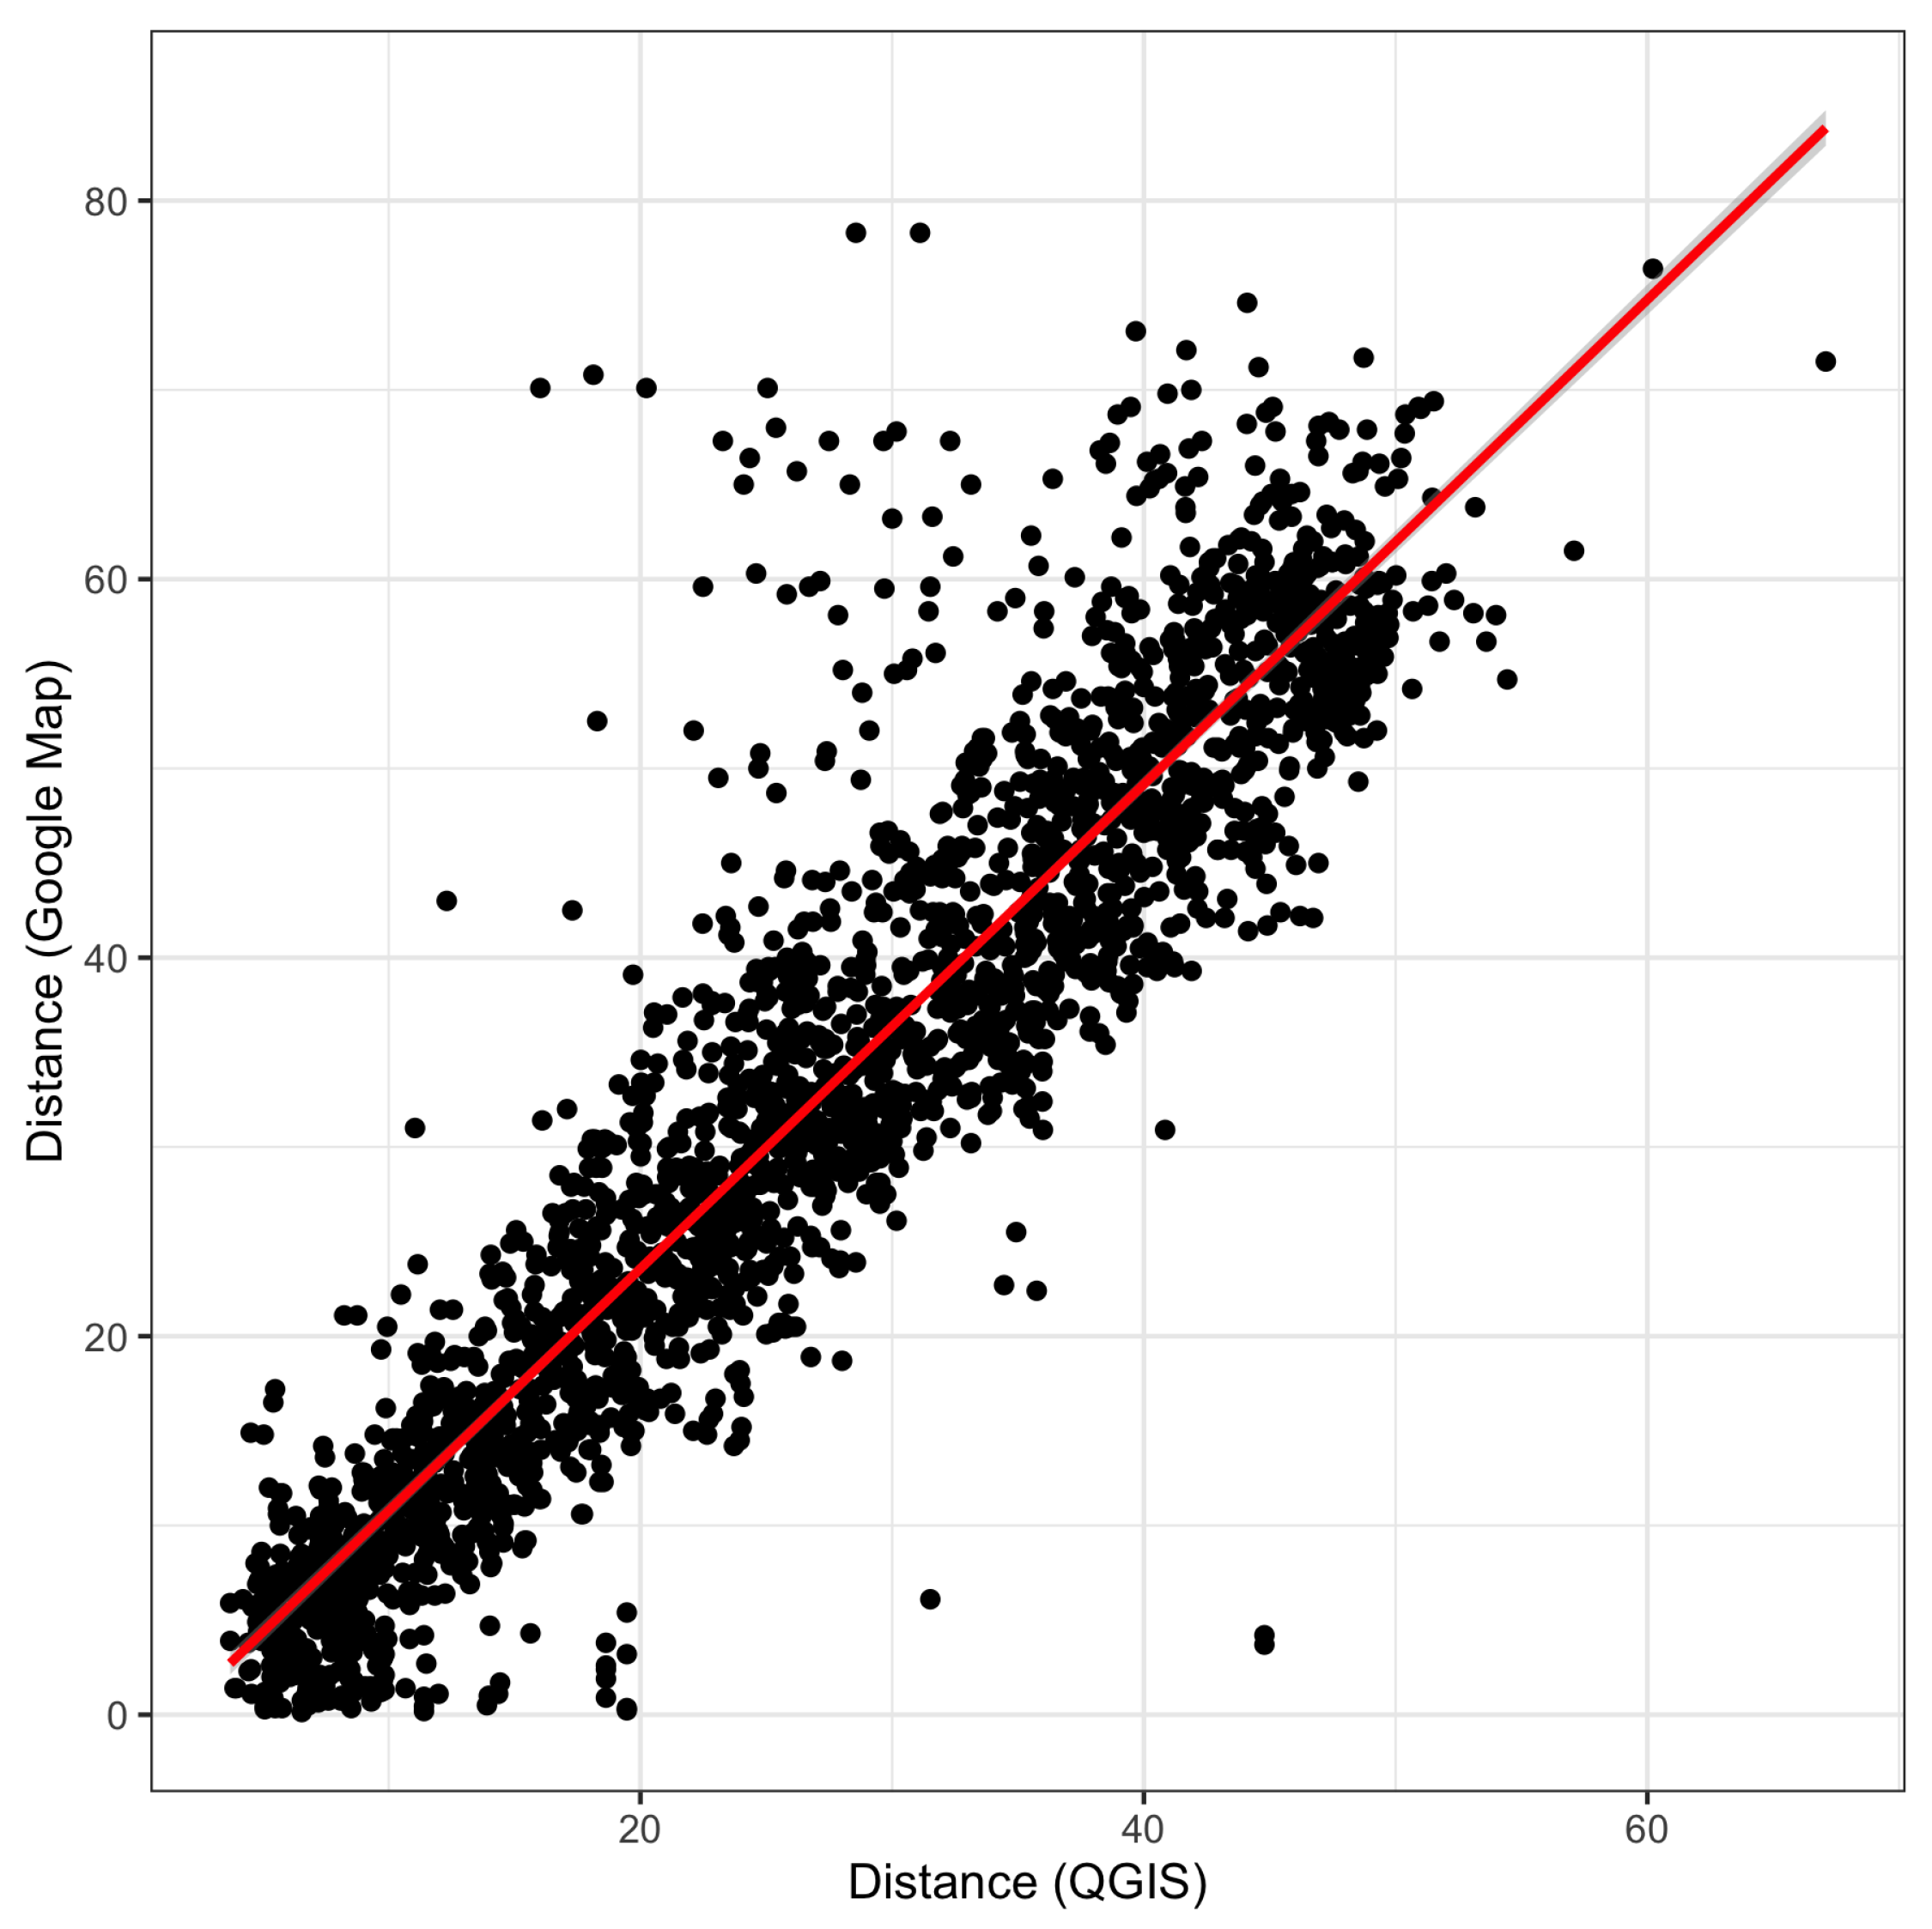
Figure 4.
Map of residuals between Google Maps and QGIS generated distance measurement.

Figure 5.
Minimum village distance travel to the nearest healthcare facility in Marinduque, Philippines.
Figure 5.
Minimum village distance travel to the nearest healthcare facility in Marinduque, Philippines.
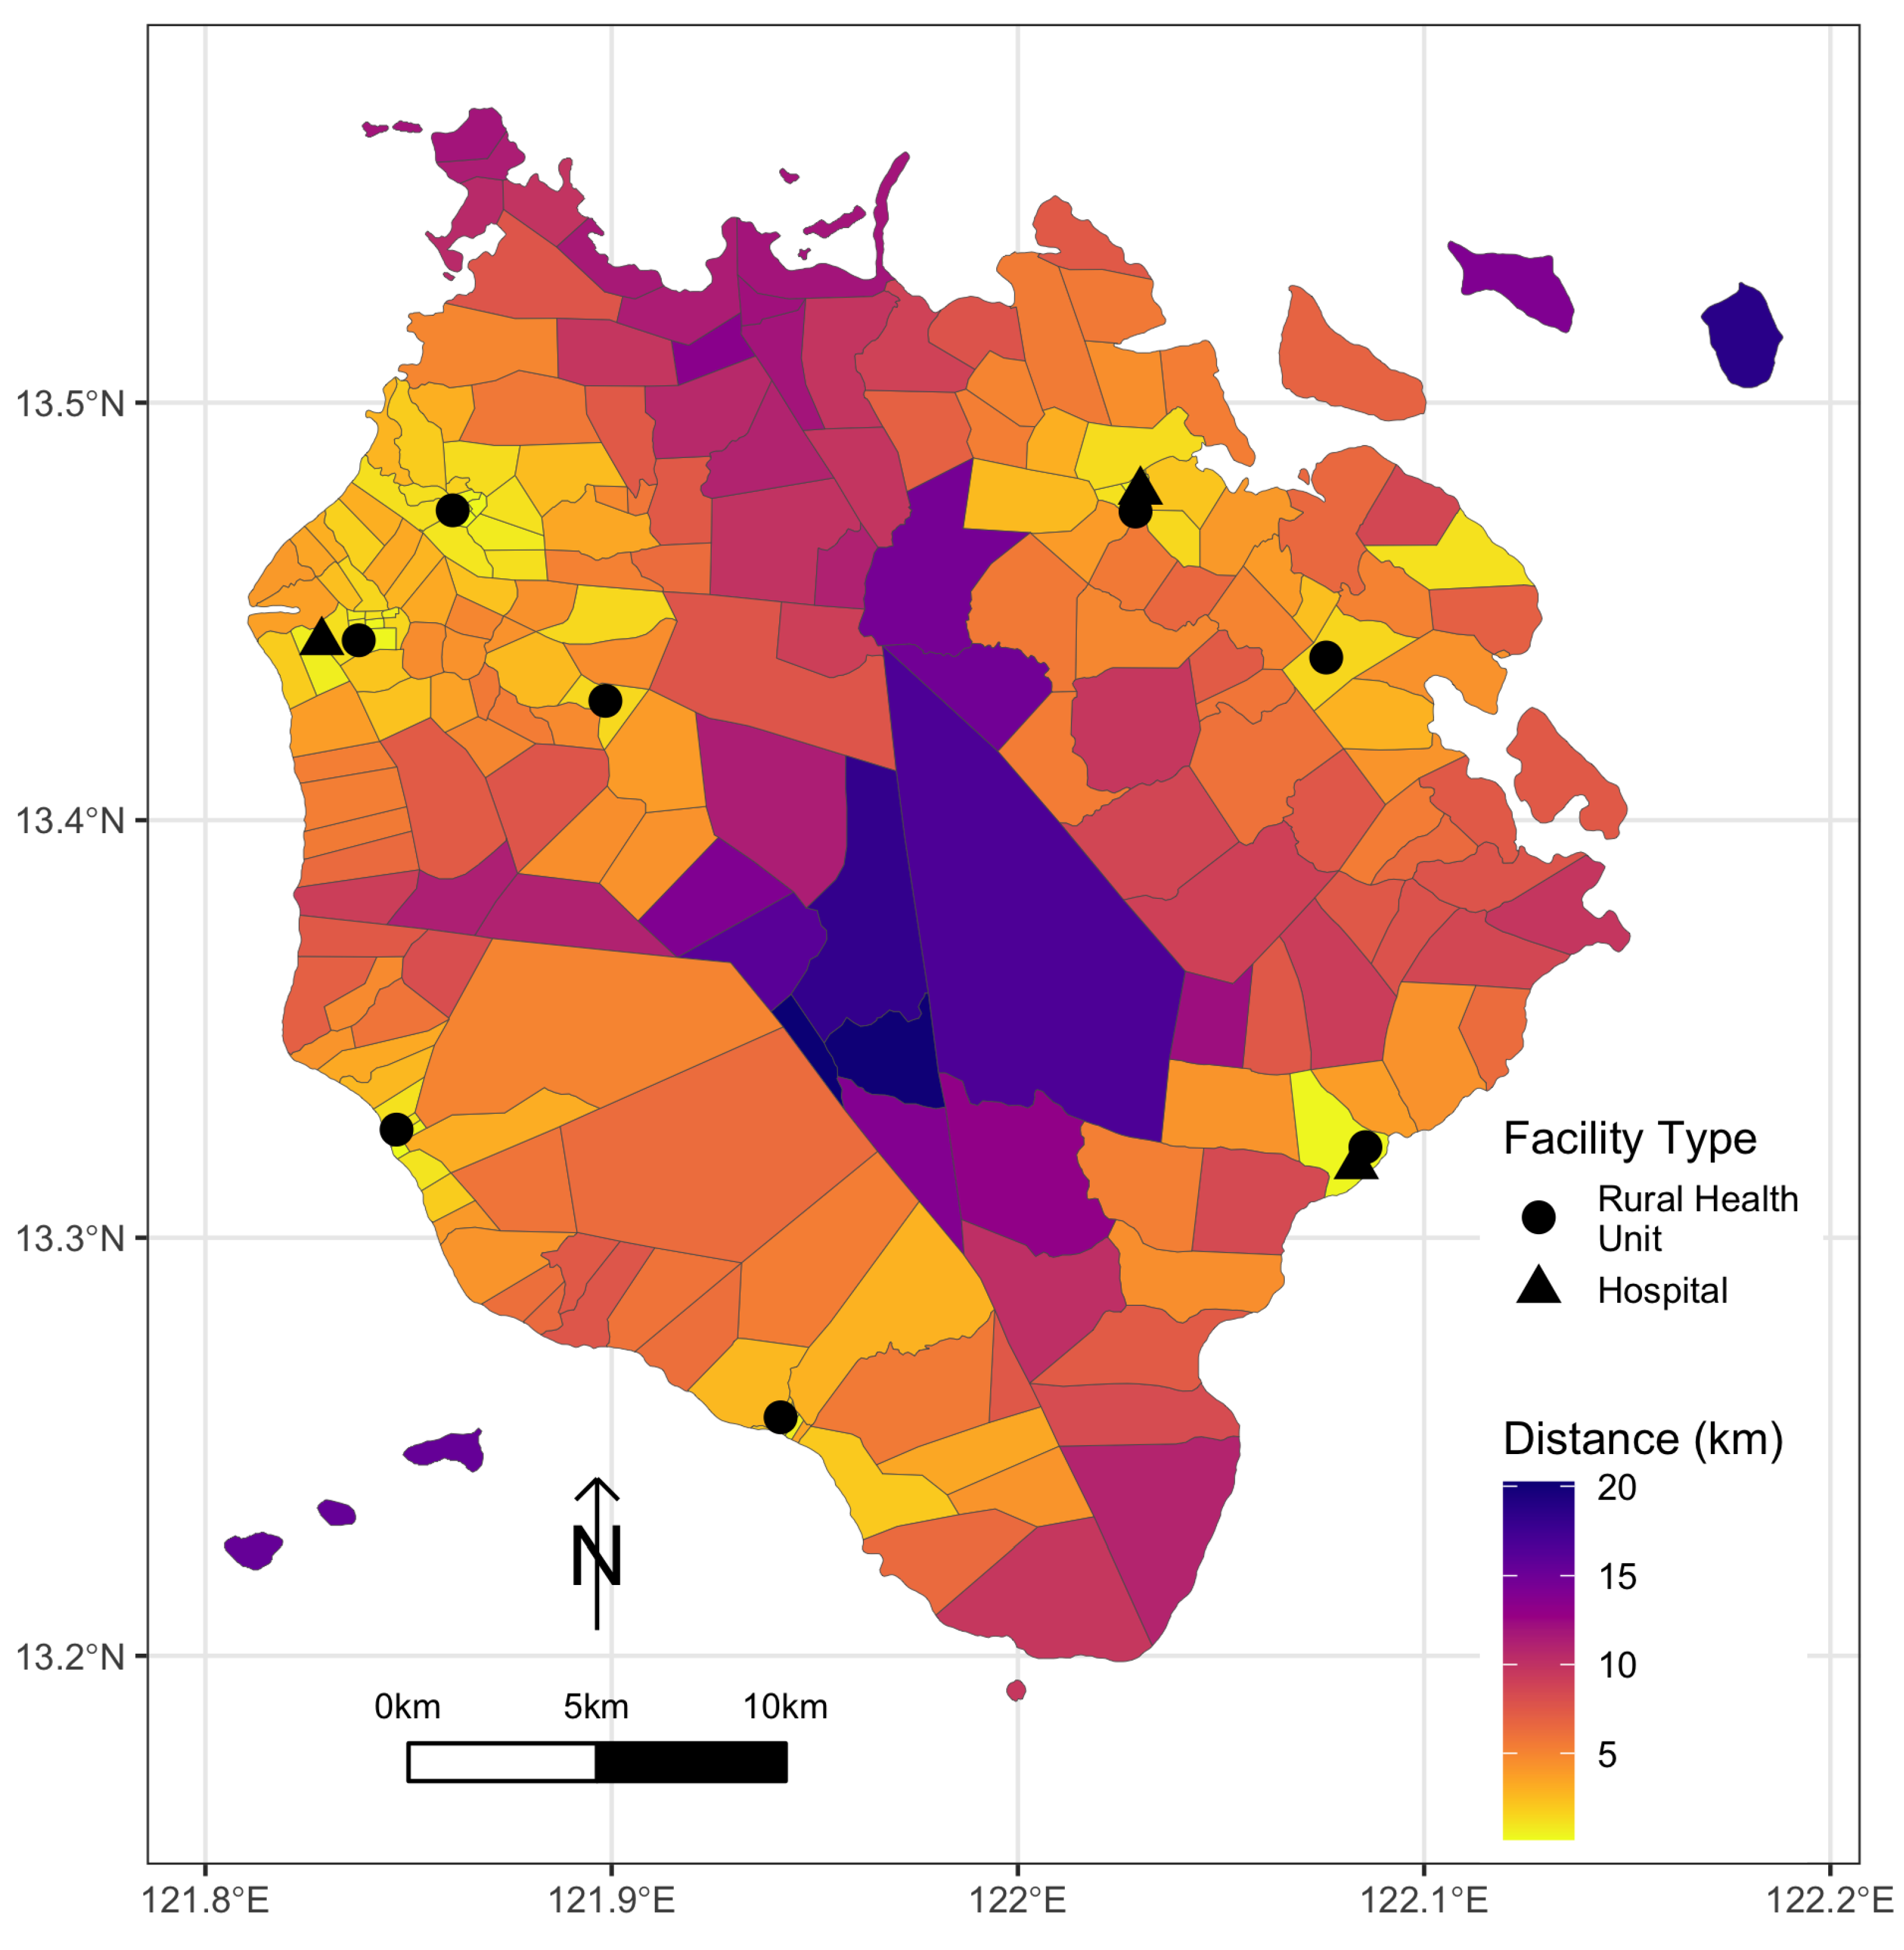
Figure 6.
Map of travel-time interval to the nearest healthcare facility of different transportation modes: (a) tricycle; (b) jeepney; and (c) private car.
Figure 6.
Map of travel-time interval to the nearest healthcare facility of different transportation modes: (a) tricycle; (b) jeepney; and (c) private car.

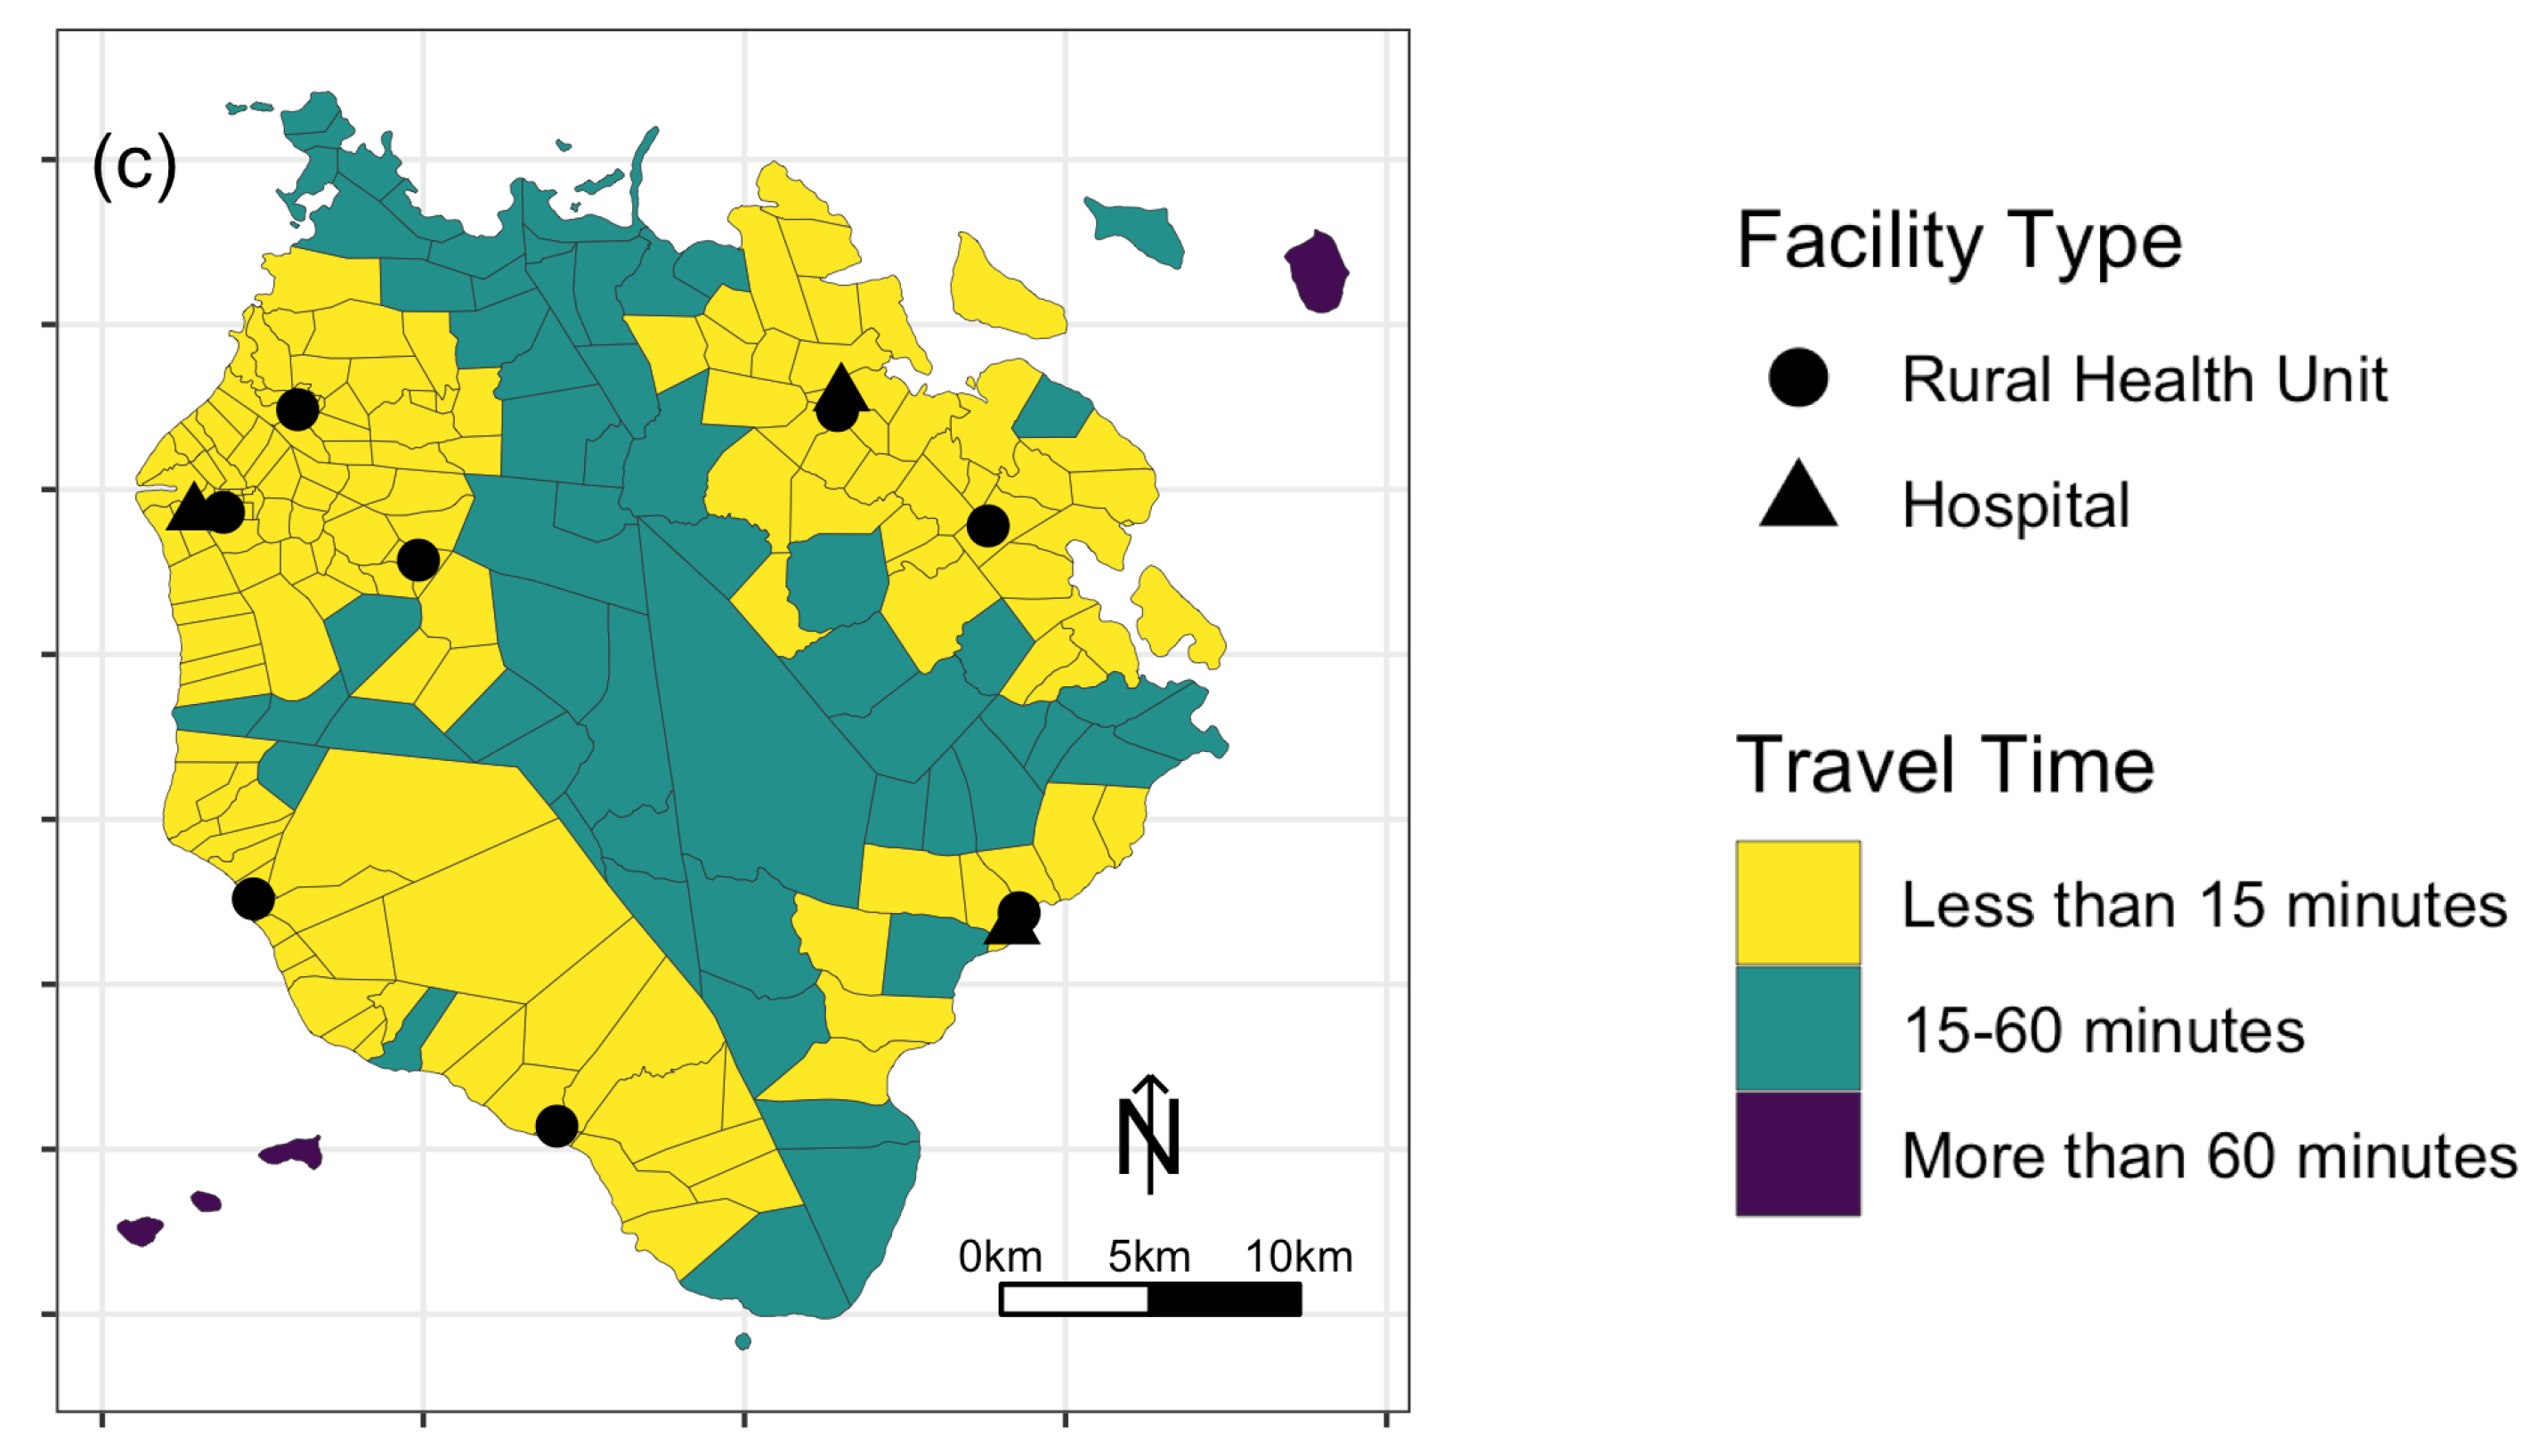
Figure 7.
Accessibility scores of different population groups in the province of Marinduque: (a) general population; (b) children; (c) women; and (d) elderly.
Figure 7.
Accessibility scores of different population groups in the province of Marinduque: (a) general population; (b) children; (c) women; and (d) elderly.

Table 1.
Healthcare facilities in Marinduque, Philippines.
| Name | Municipality |
|---|---|
| Boach RHU1 | Boac |
| Boach RHU2 | Boac |
| Dr. Damian Reyes Memorial Hospital | Boac |
| Buenavista RHU | Buenavista |
| Gasan RHU | Gasan |
| Mogpog RHU | Mogpog |
| Sta. Cruz RHU1 | Sta. Cruz |
| Sta. Cruz RHU2 | Sta. Cruz |
| Sta. Cruz District Hospital | Sta. Cruz |
| Torrijos RHU | Torrijos |
| Torrijos Municipal Hospital | Torrijos |
Publisher’s Note: MDPI stays neutral with regard to jurisdictional claims in published maps and institutional affiliations. |
© 2022 by the author. Licensee MDPI, Basel, Switzerland. This article is an open access article distributed under the terms and conditions of the Creative Commons Attribution (CC BY) license (https://creativecommons.org/licenses/by/4.0/).
Share and Cite
MDPI and ACS Style
Salvacion, A.R. Measuring Spatial Accessibility of Healthcare Facilities in Marinduque, Philippines. ISPRS Int. J. Geo-Inf. 2022, 11, 516. https://doi.org/10.3390/ijgi11100516
AMA Style
Salvacion AR. Measuring Spatial Accessibility of Healthcare Facilities in Marinduque, Philippines. ISPRS International Journal of Geo-Information. 2022; 11(10):516. https://doi.org/10.3390/ijgi11100516
Chicago/Turabian StyleSalvacion, Arnold R. 2022. "Measuring Spatial Accessibility of Healthcare Facilities in Marinduque, Philippines" ISPRS International Journal of Geo-Information 11, no. 10: 516. https://doi.org/10.3390/ijgi11100516
Note that from the first issue of 2016, this journal uses article numbers instead of page numbers. See further details here.