

Assessing the Spatial Accessibility of Urban Medical Facilities in Multi-Level and Multi-Period Scales Based on Web Mapping API and an Improved Potential Model

Abstract
:1. Introduction
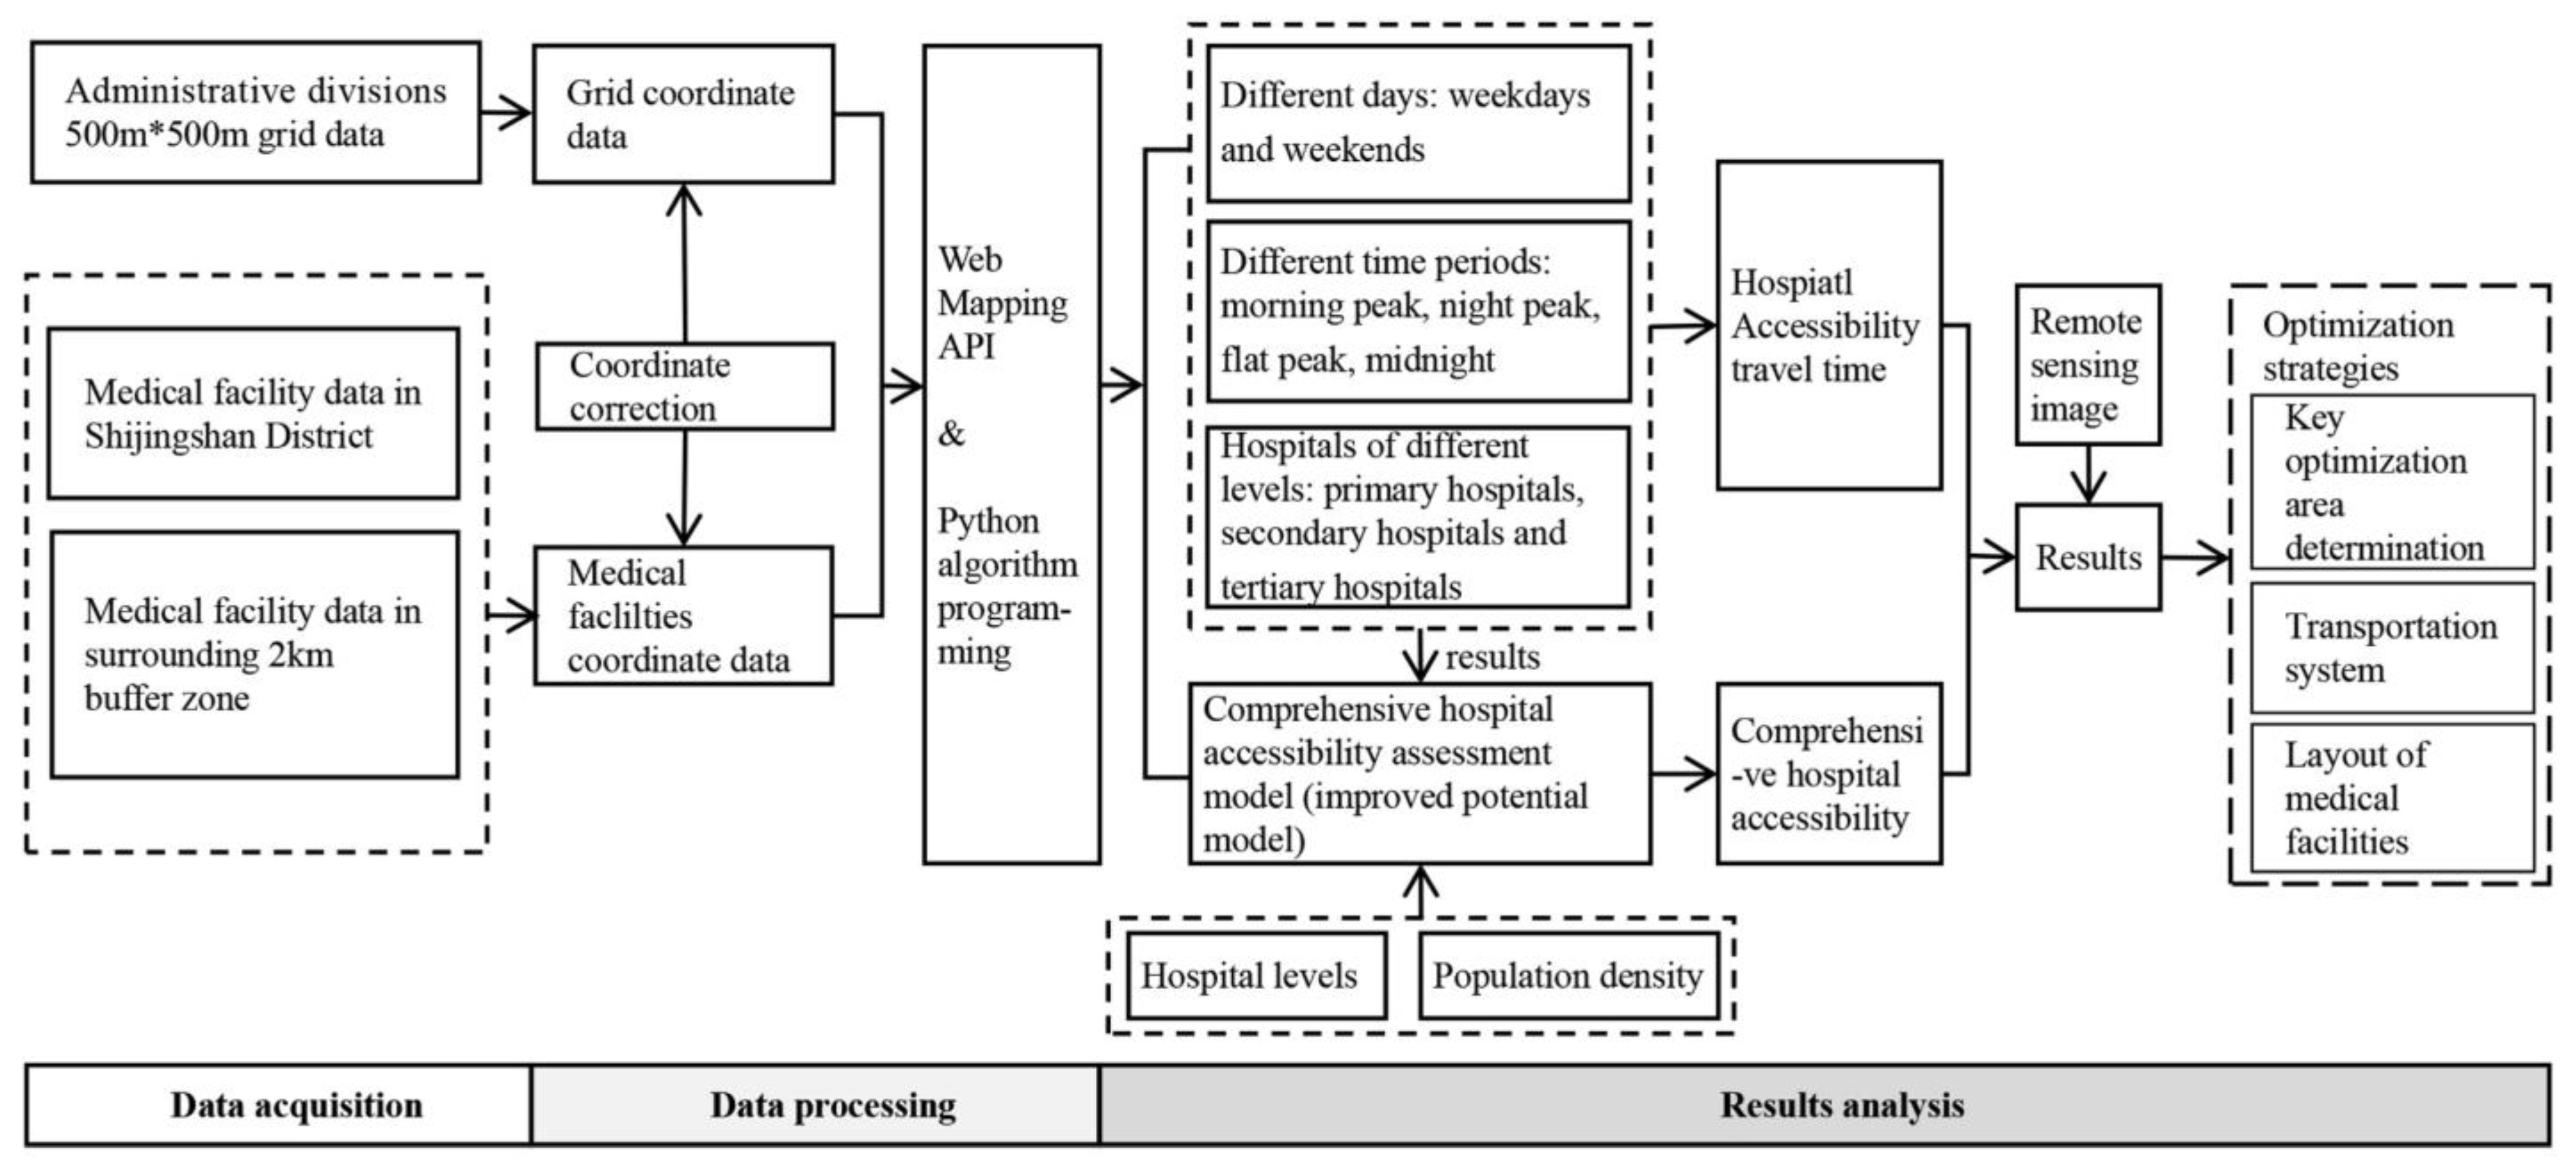
2. Methods
2.1. Assessing the Hospital Accessibility Travel Time
2.2. Potential Model and Its Improvement
3. Study Area and Data Sources
3.1. Overview of the Study Area
3.2. Data
4. Results
4.1. Analysis of Hospital Accessibility Travel Time
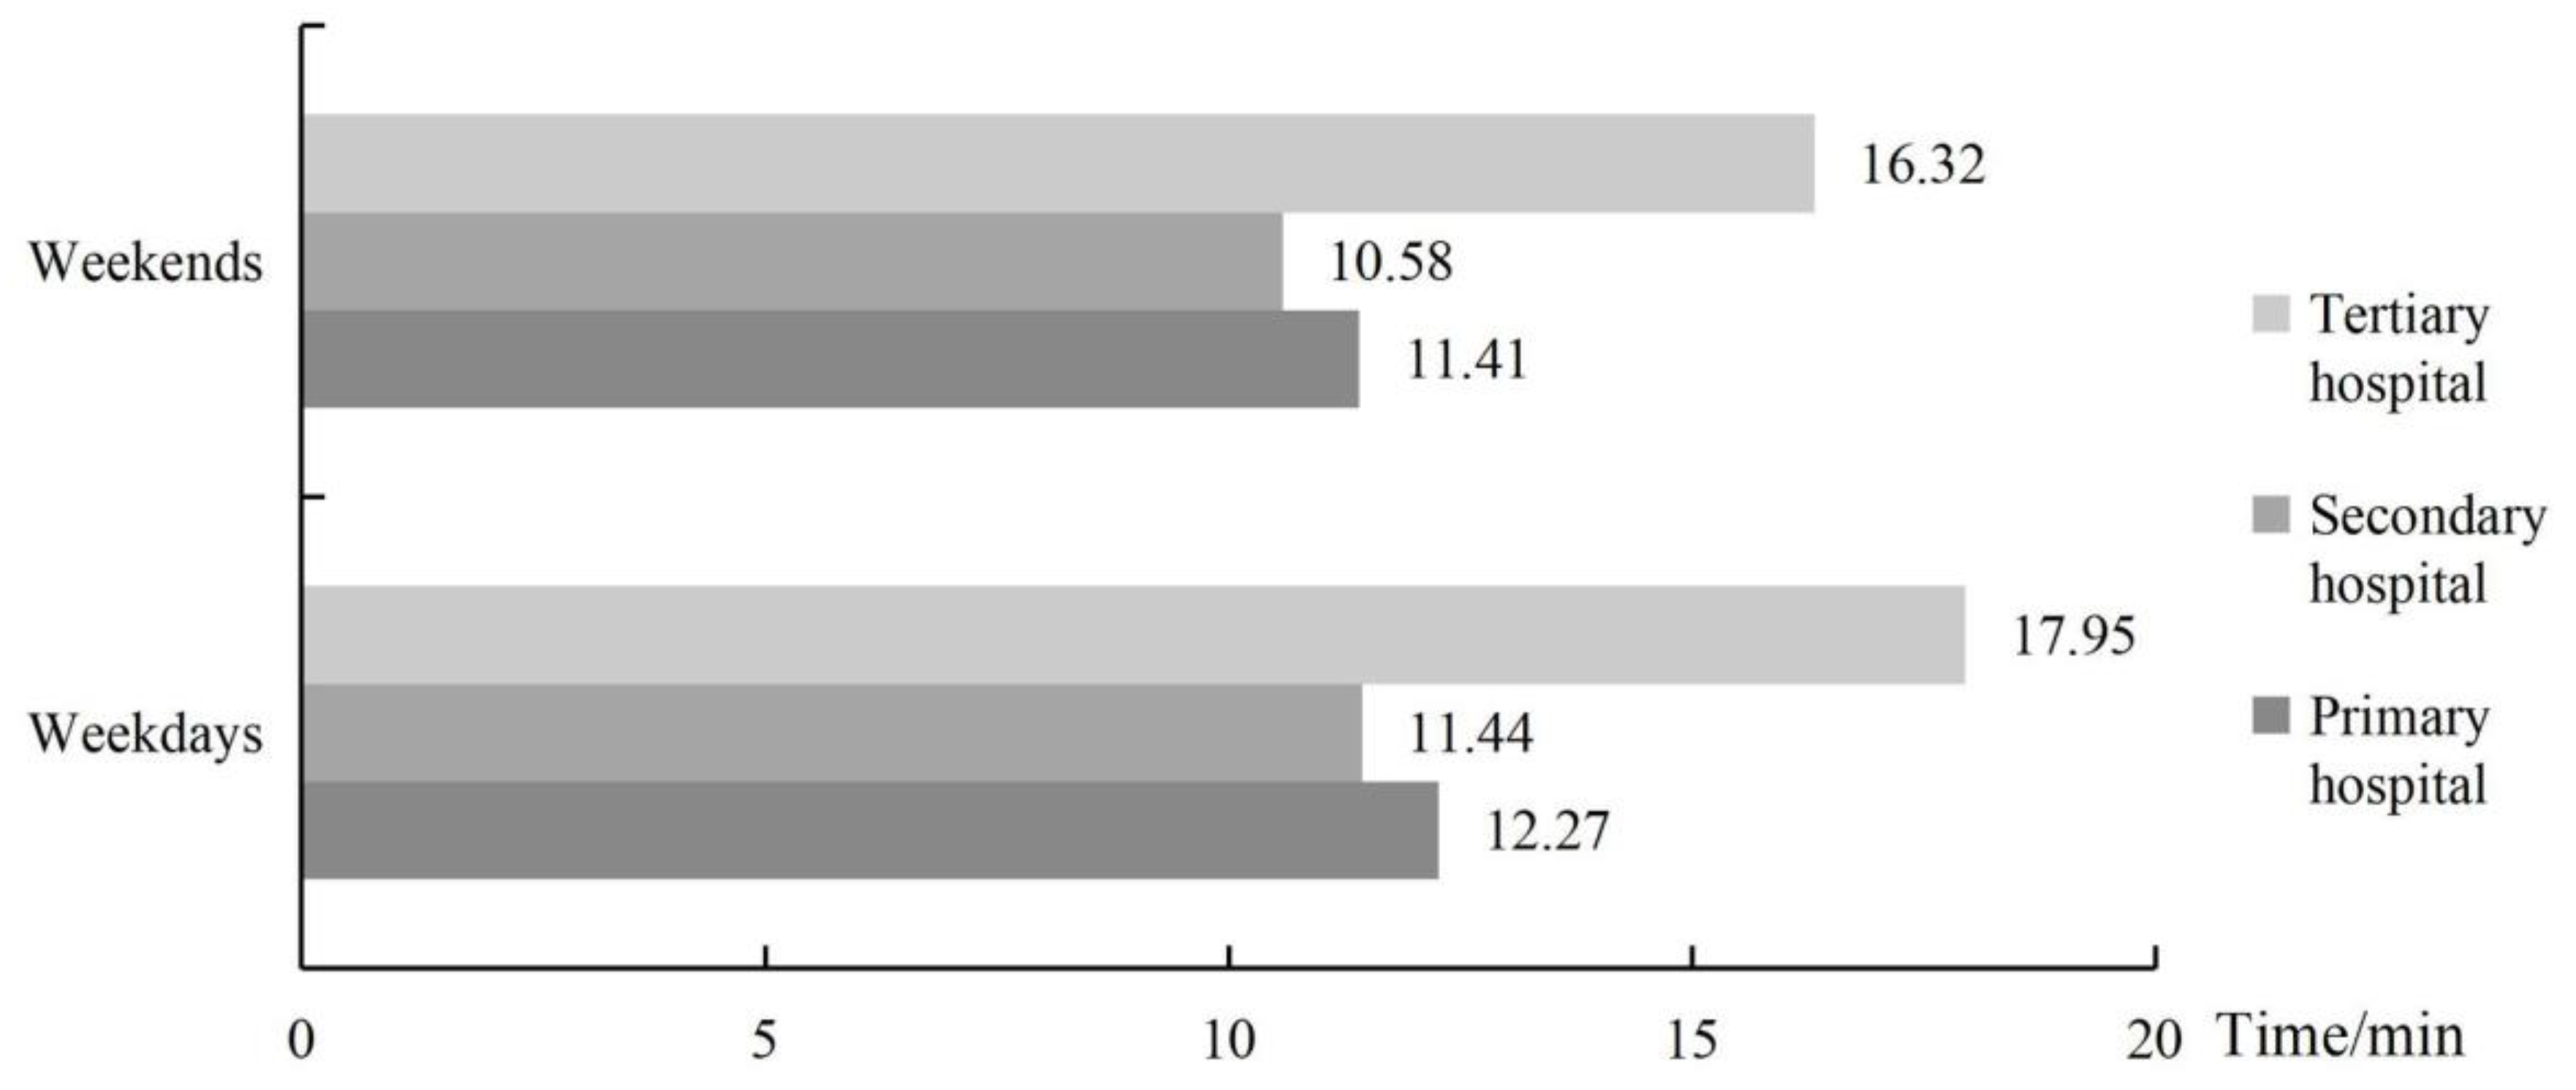
4.1.1. Analysis of Hospital Accessibility Travel Time on Weekdays and Weekends
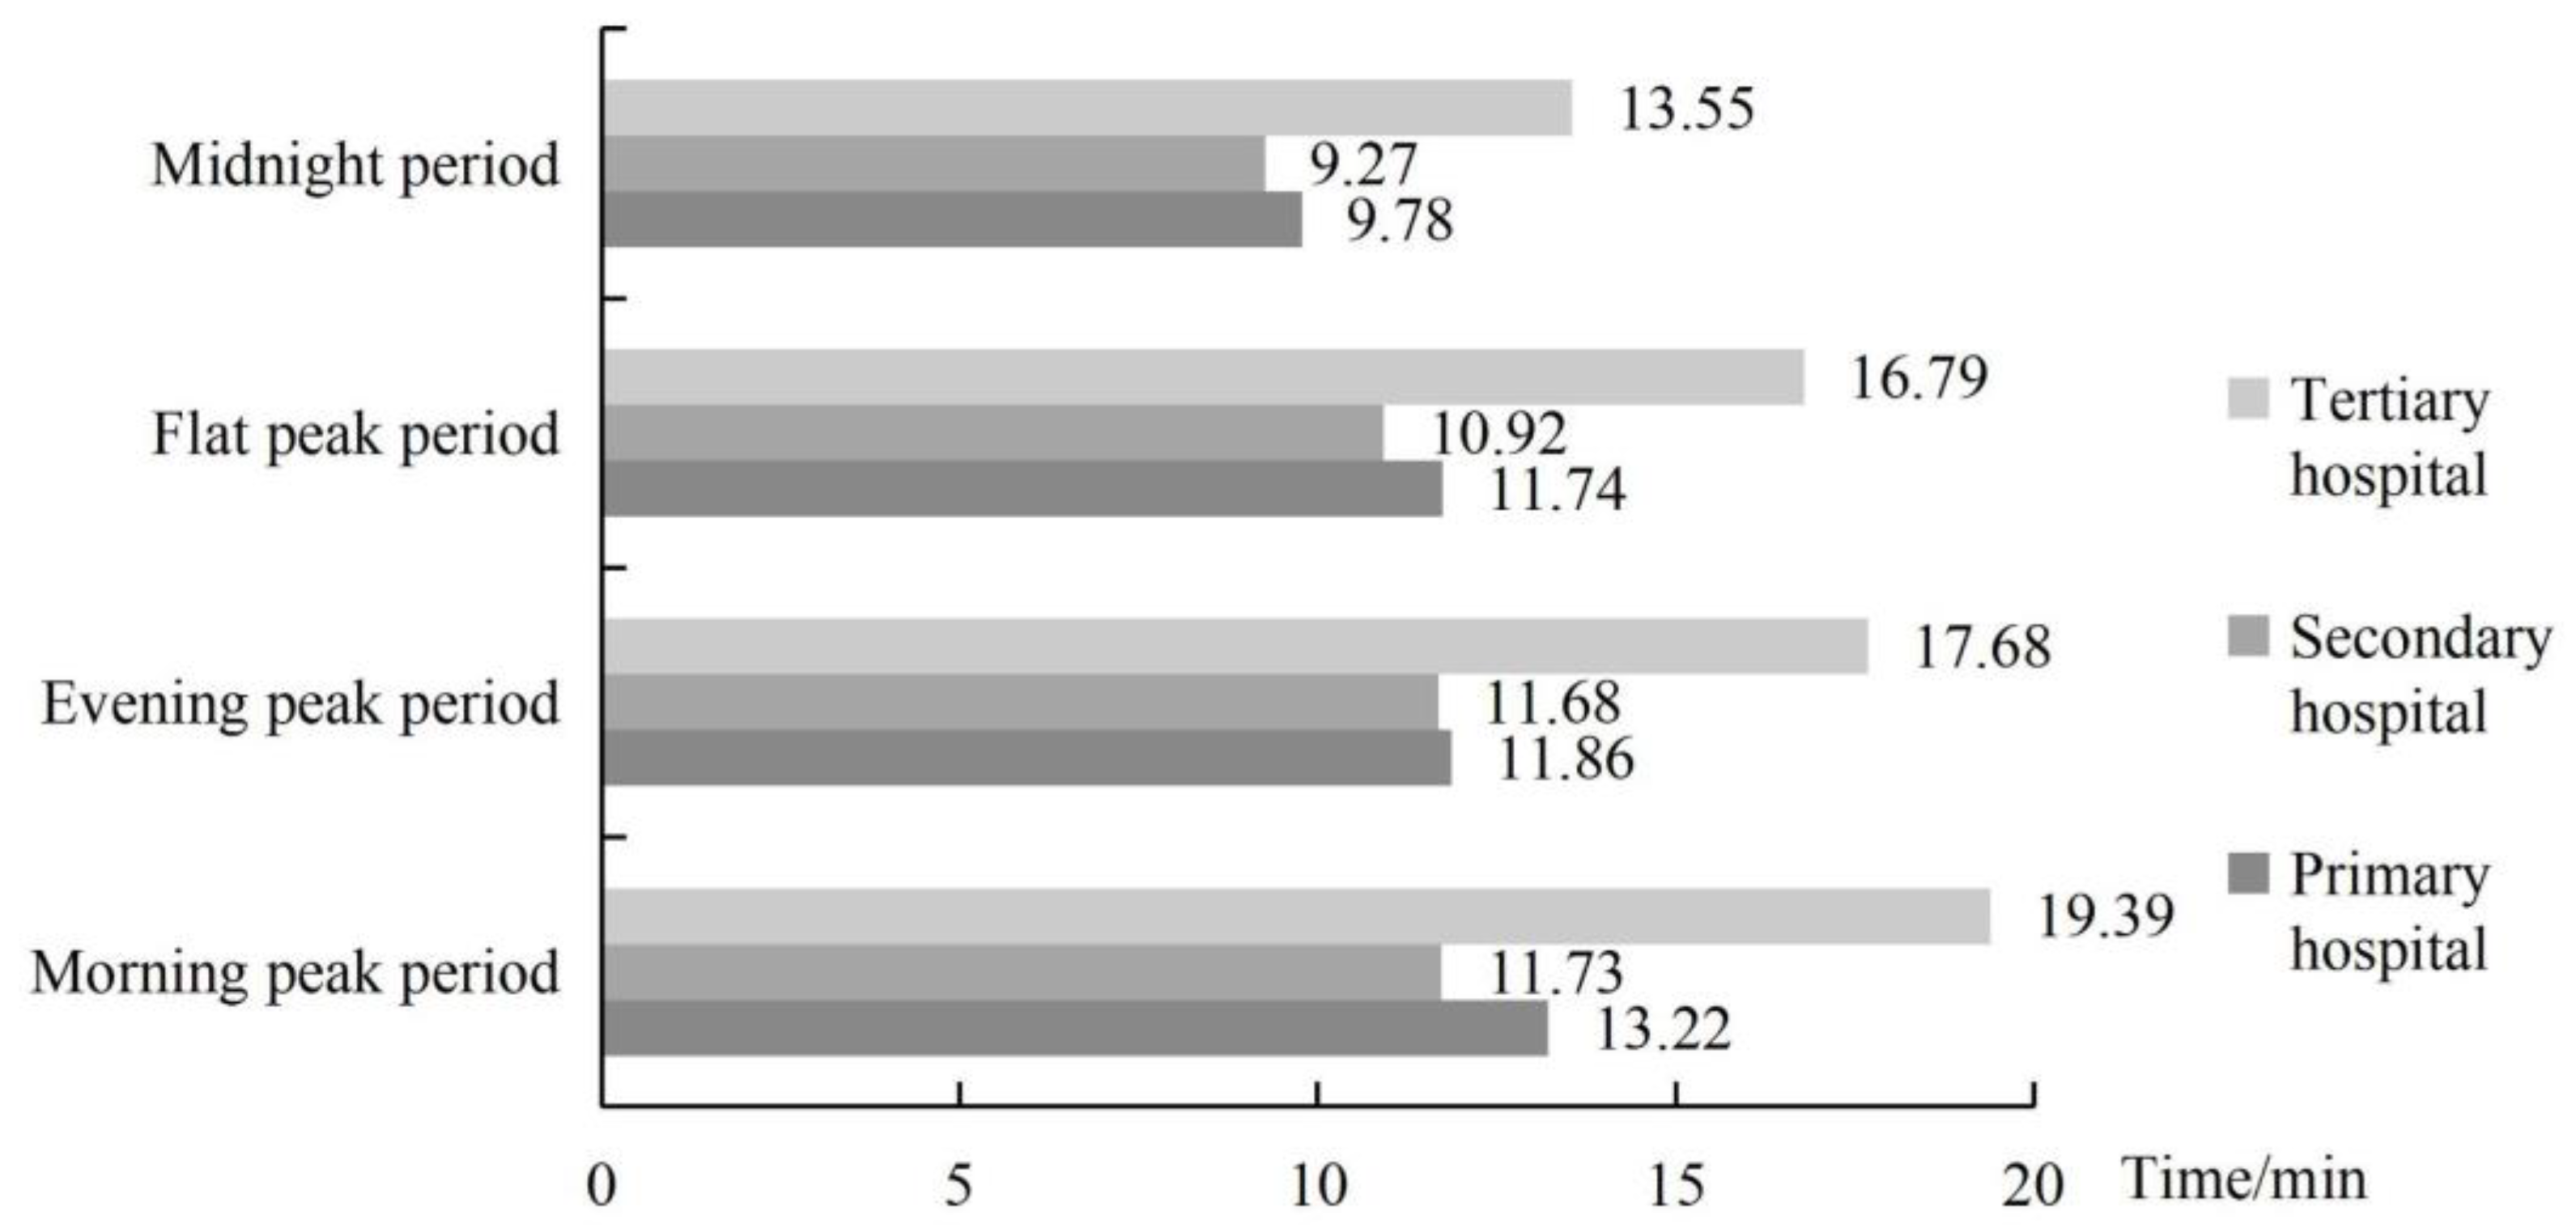
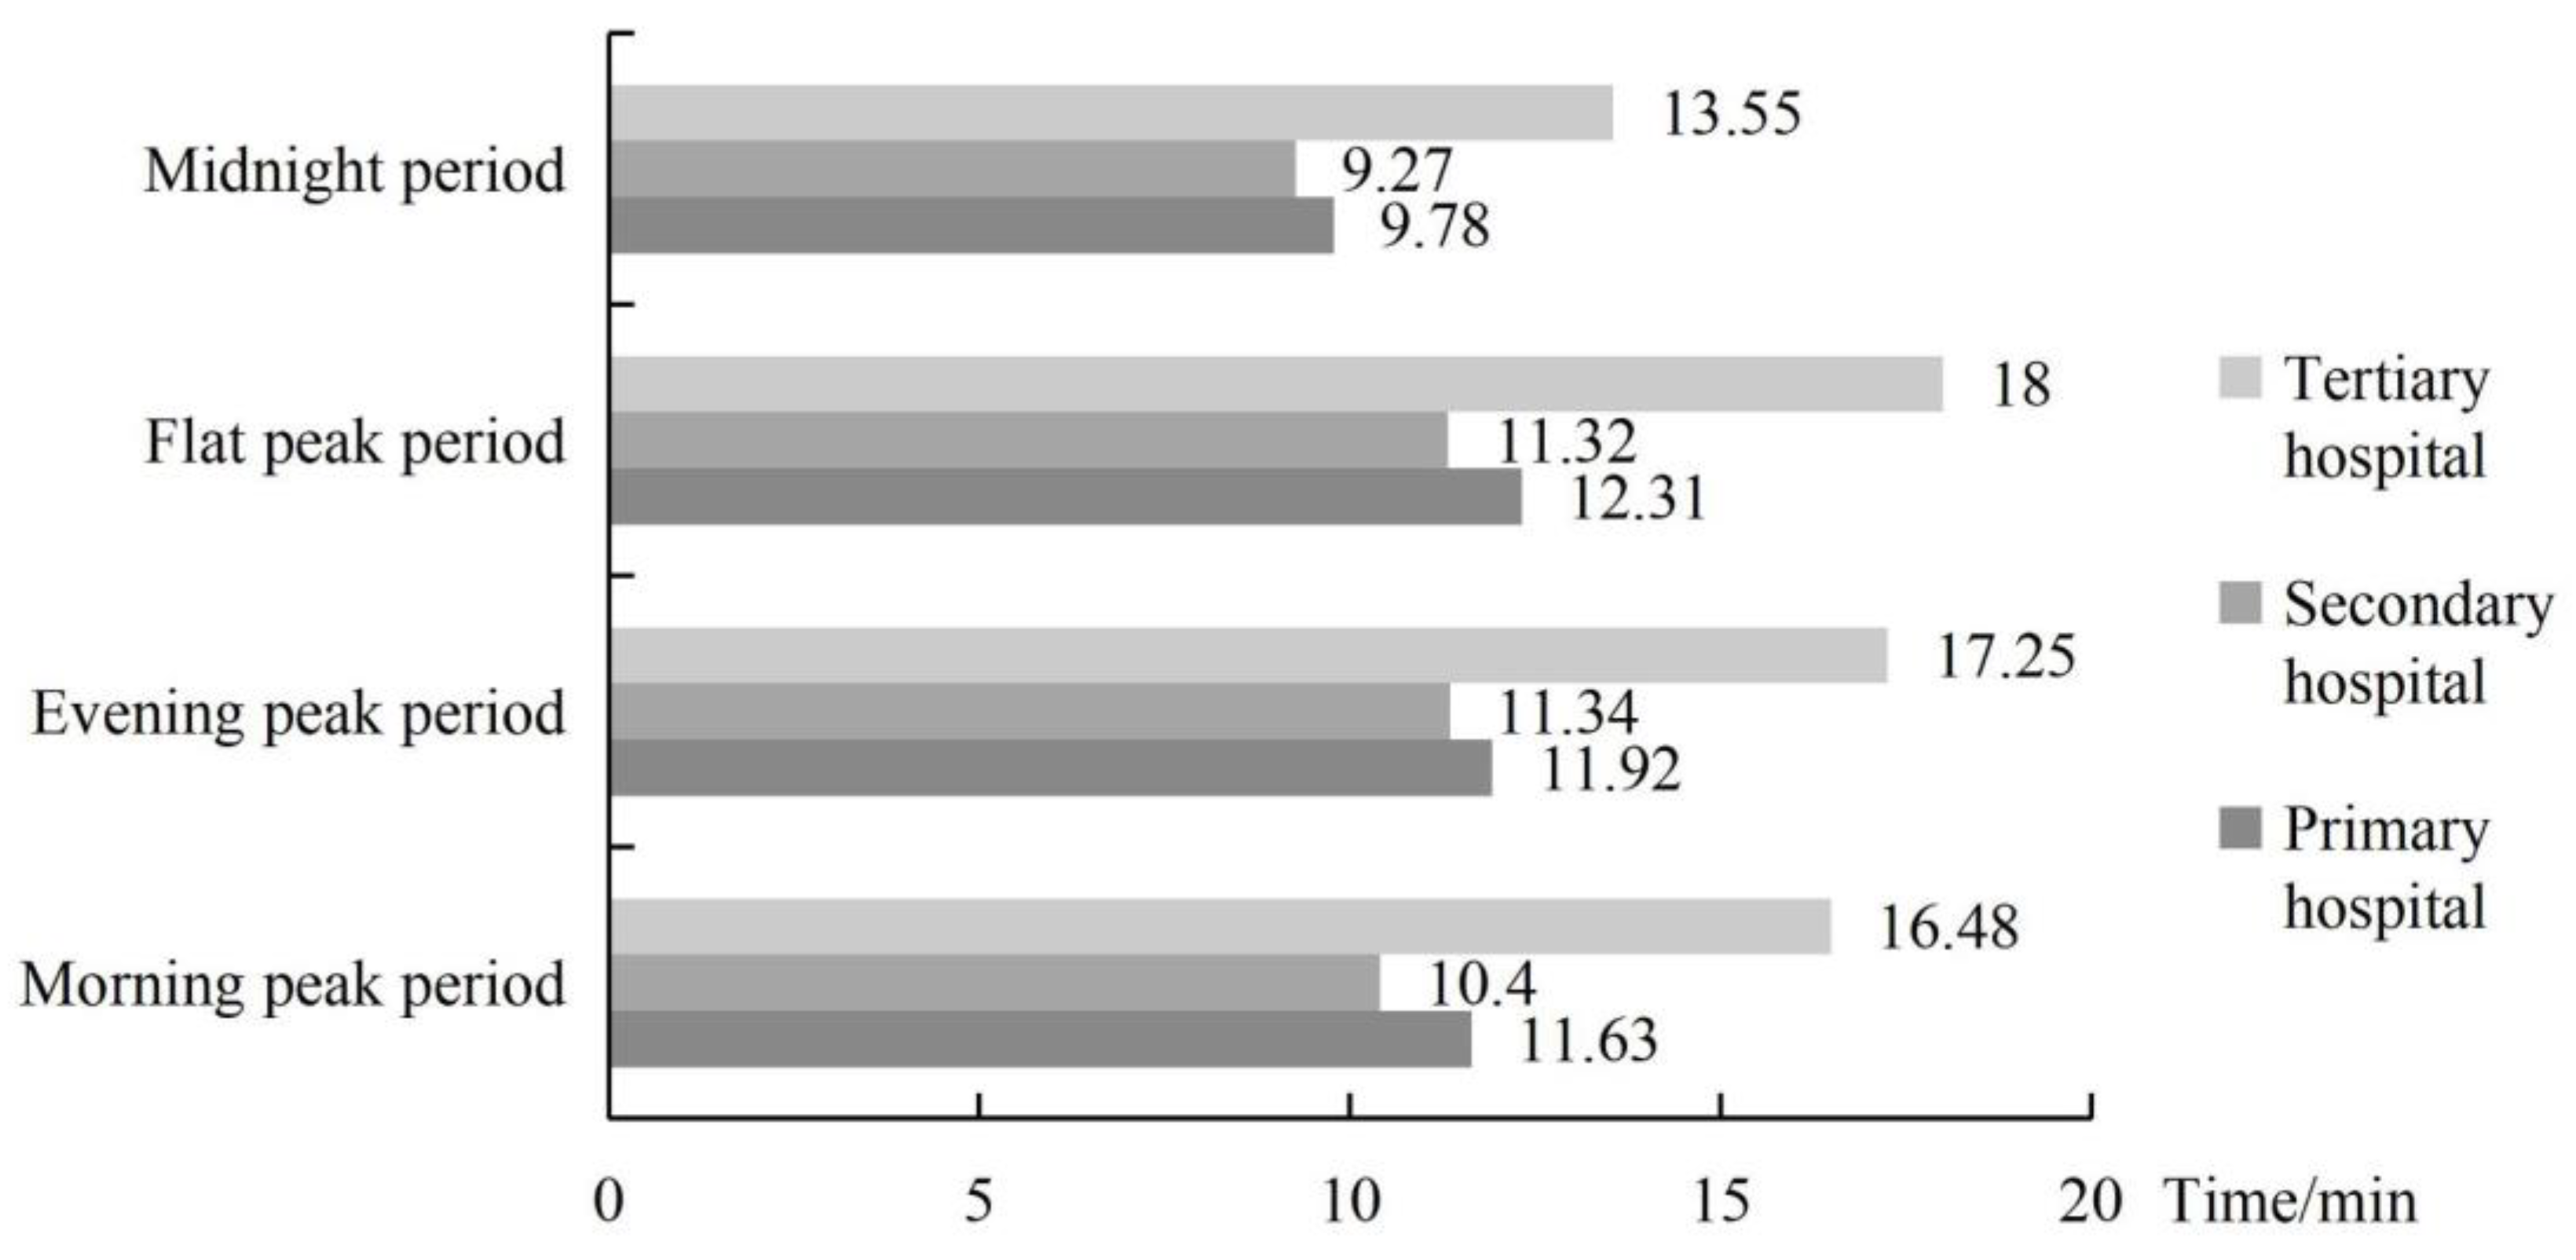
4.1.2. Analysis of Hospital Accessibility Travel Time in Different Time Periods
4.2. Analysis of Comprehensive Hospital Accessibility
4.2.1. Determination of Friction Coefficient
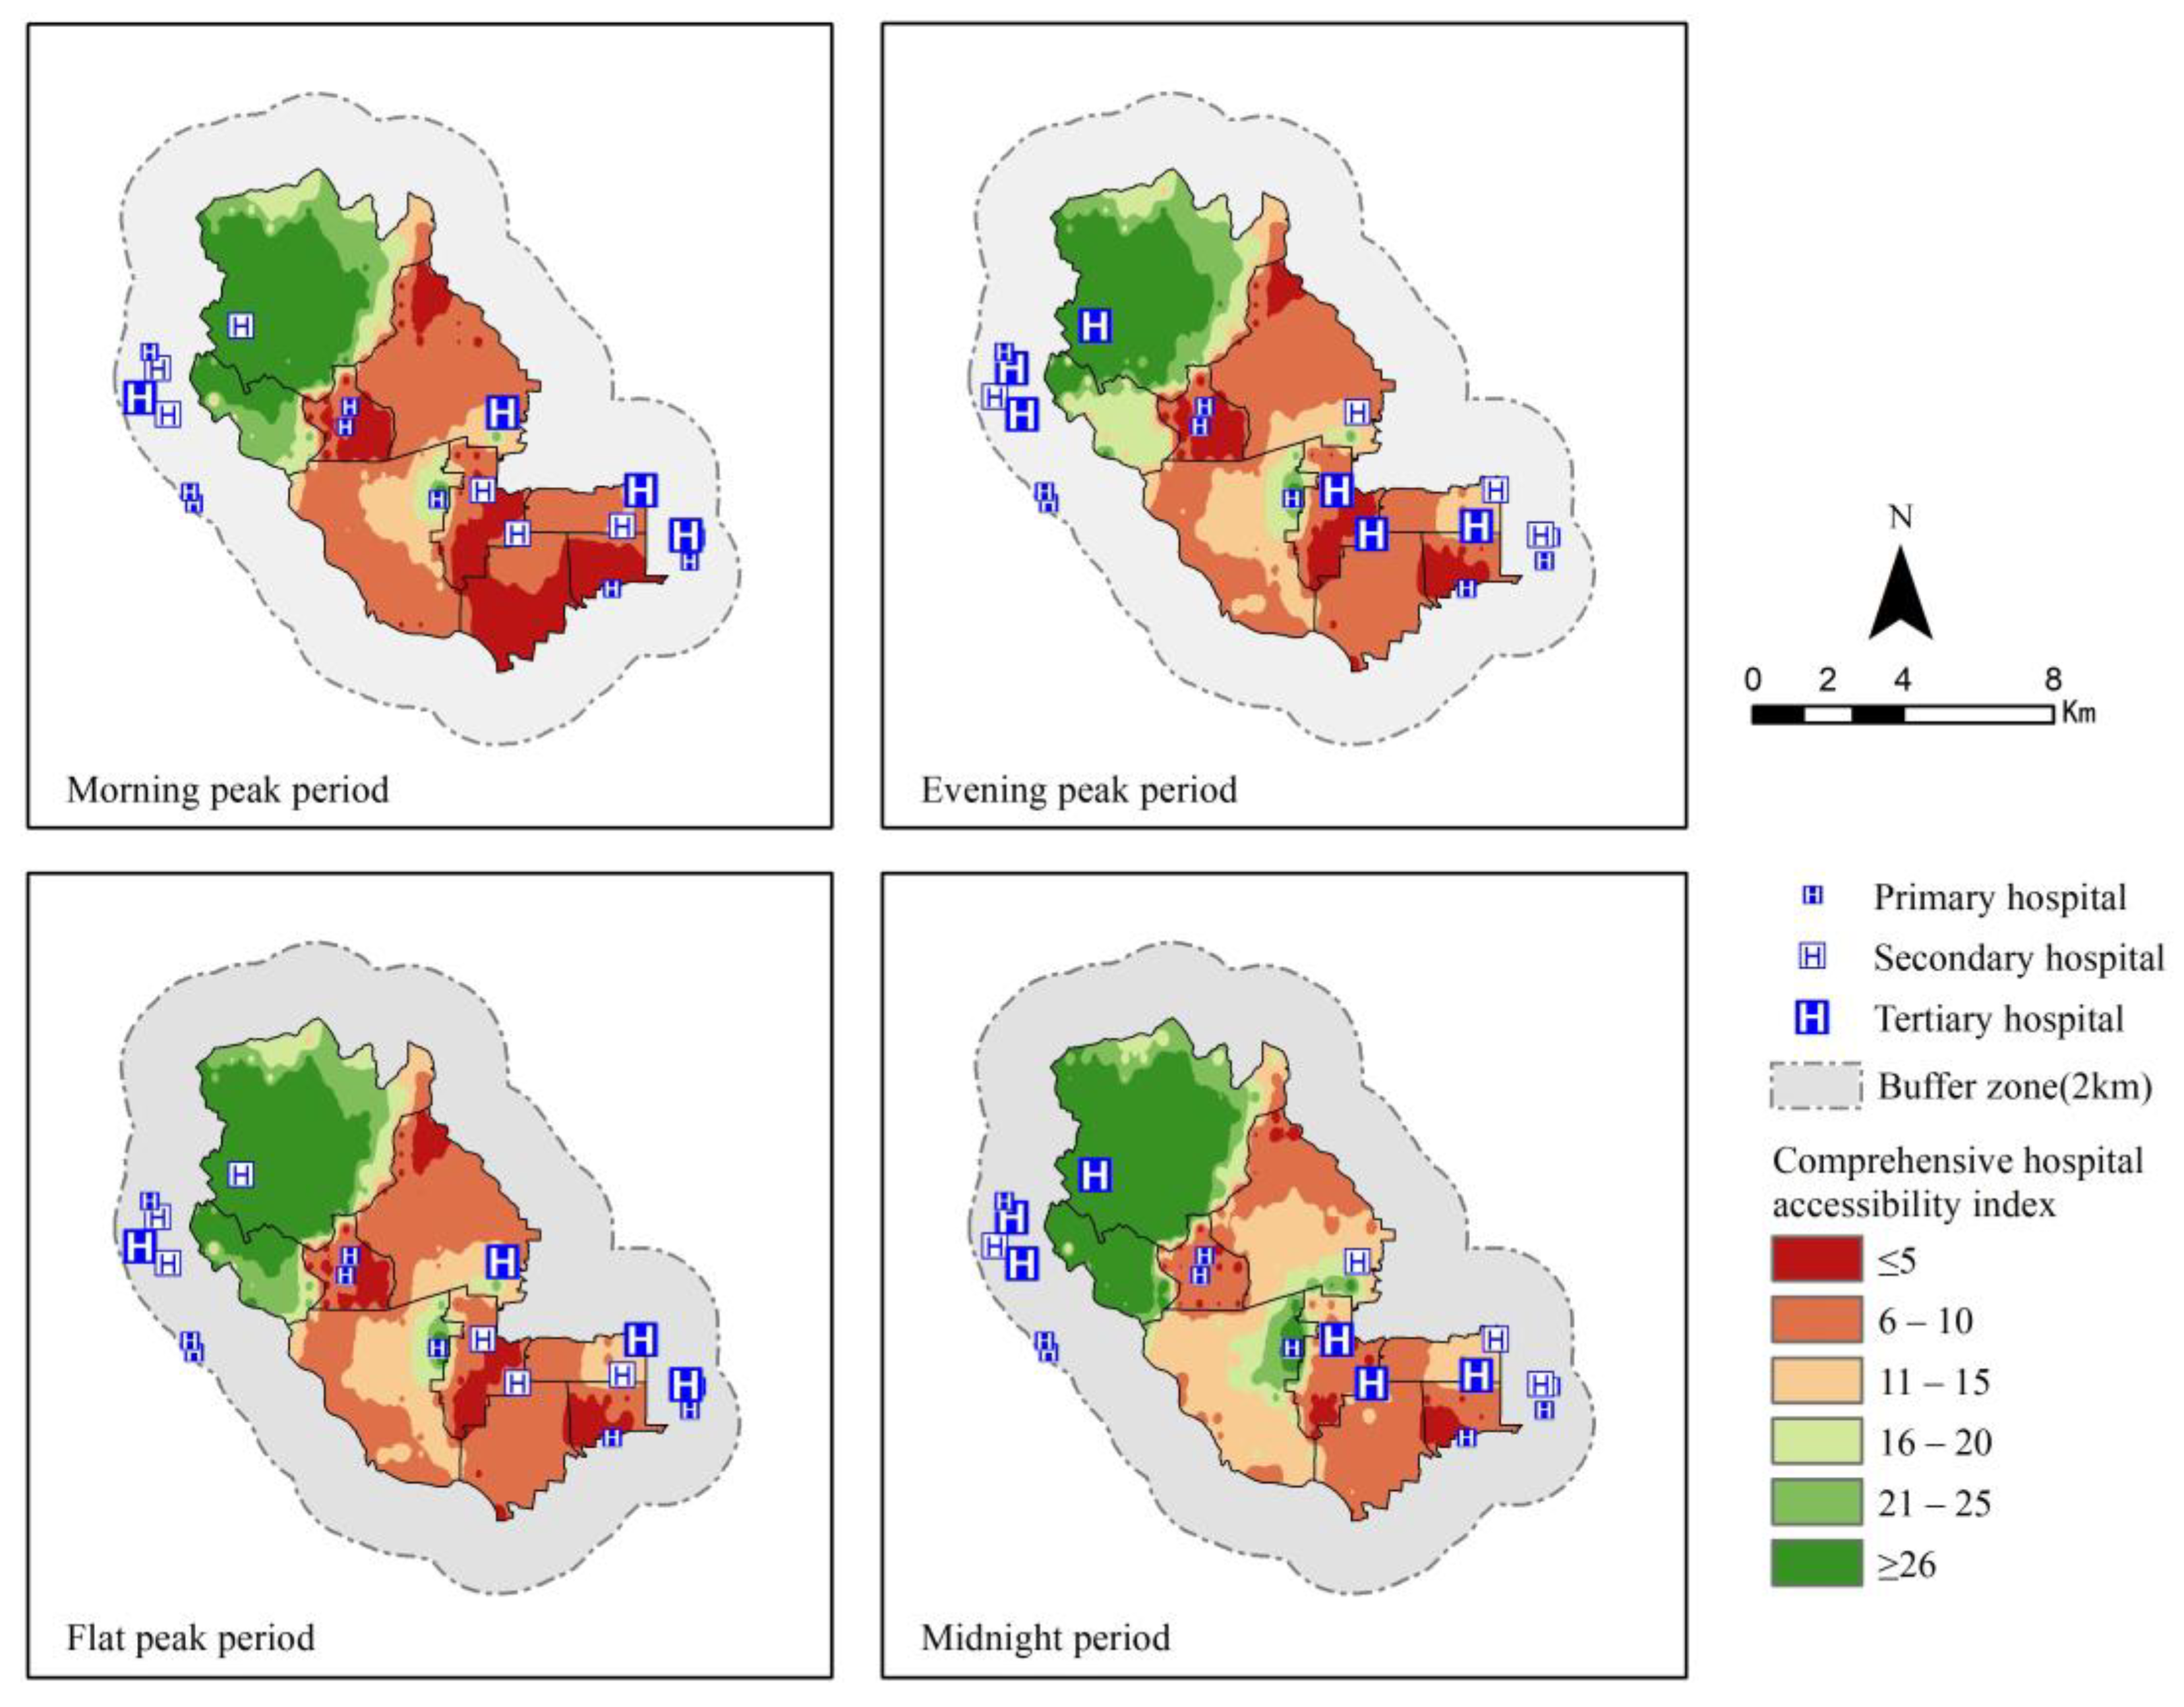
4.2.2. Analysis of Comprehensive Hospital Accessibility on Weekdays
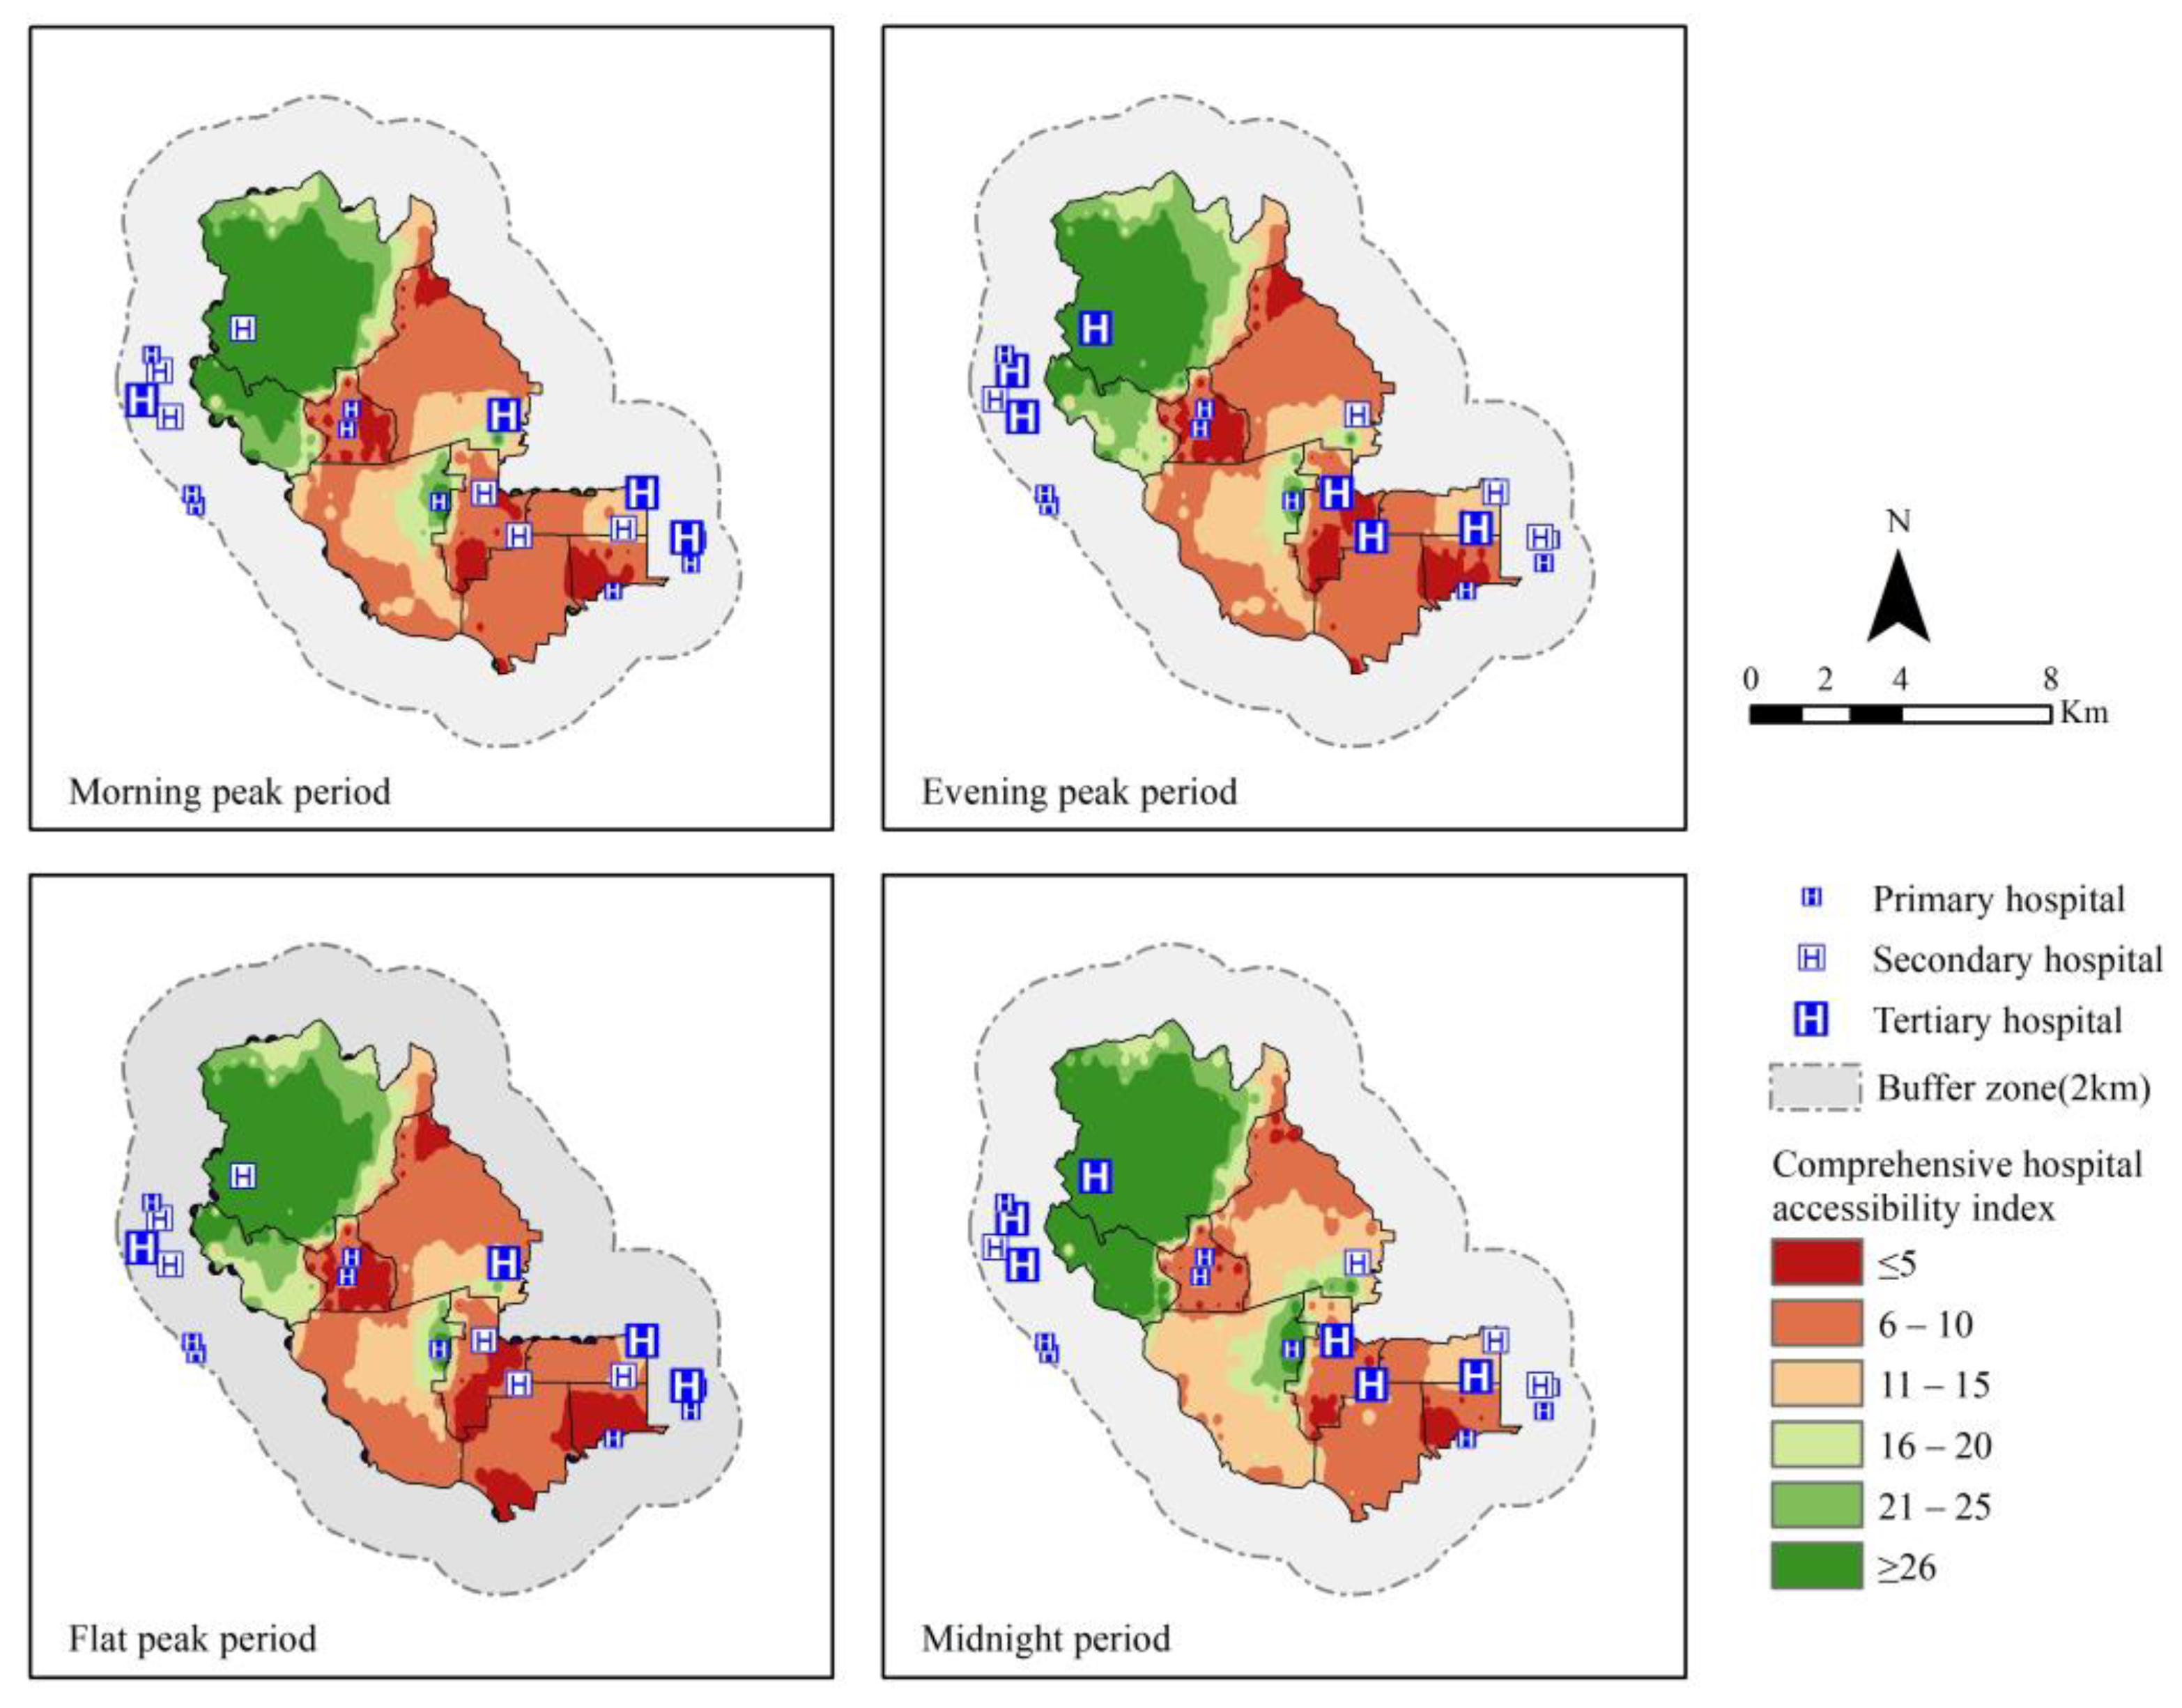
4.2.3. Analysis of Comprehensive Hospital Accessibility on Weekends
4.3. Identification of Key Optimization Areas and Optimization Strategies
4.3.1. Identification of Key Areas for Transportation Optimization
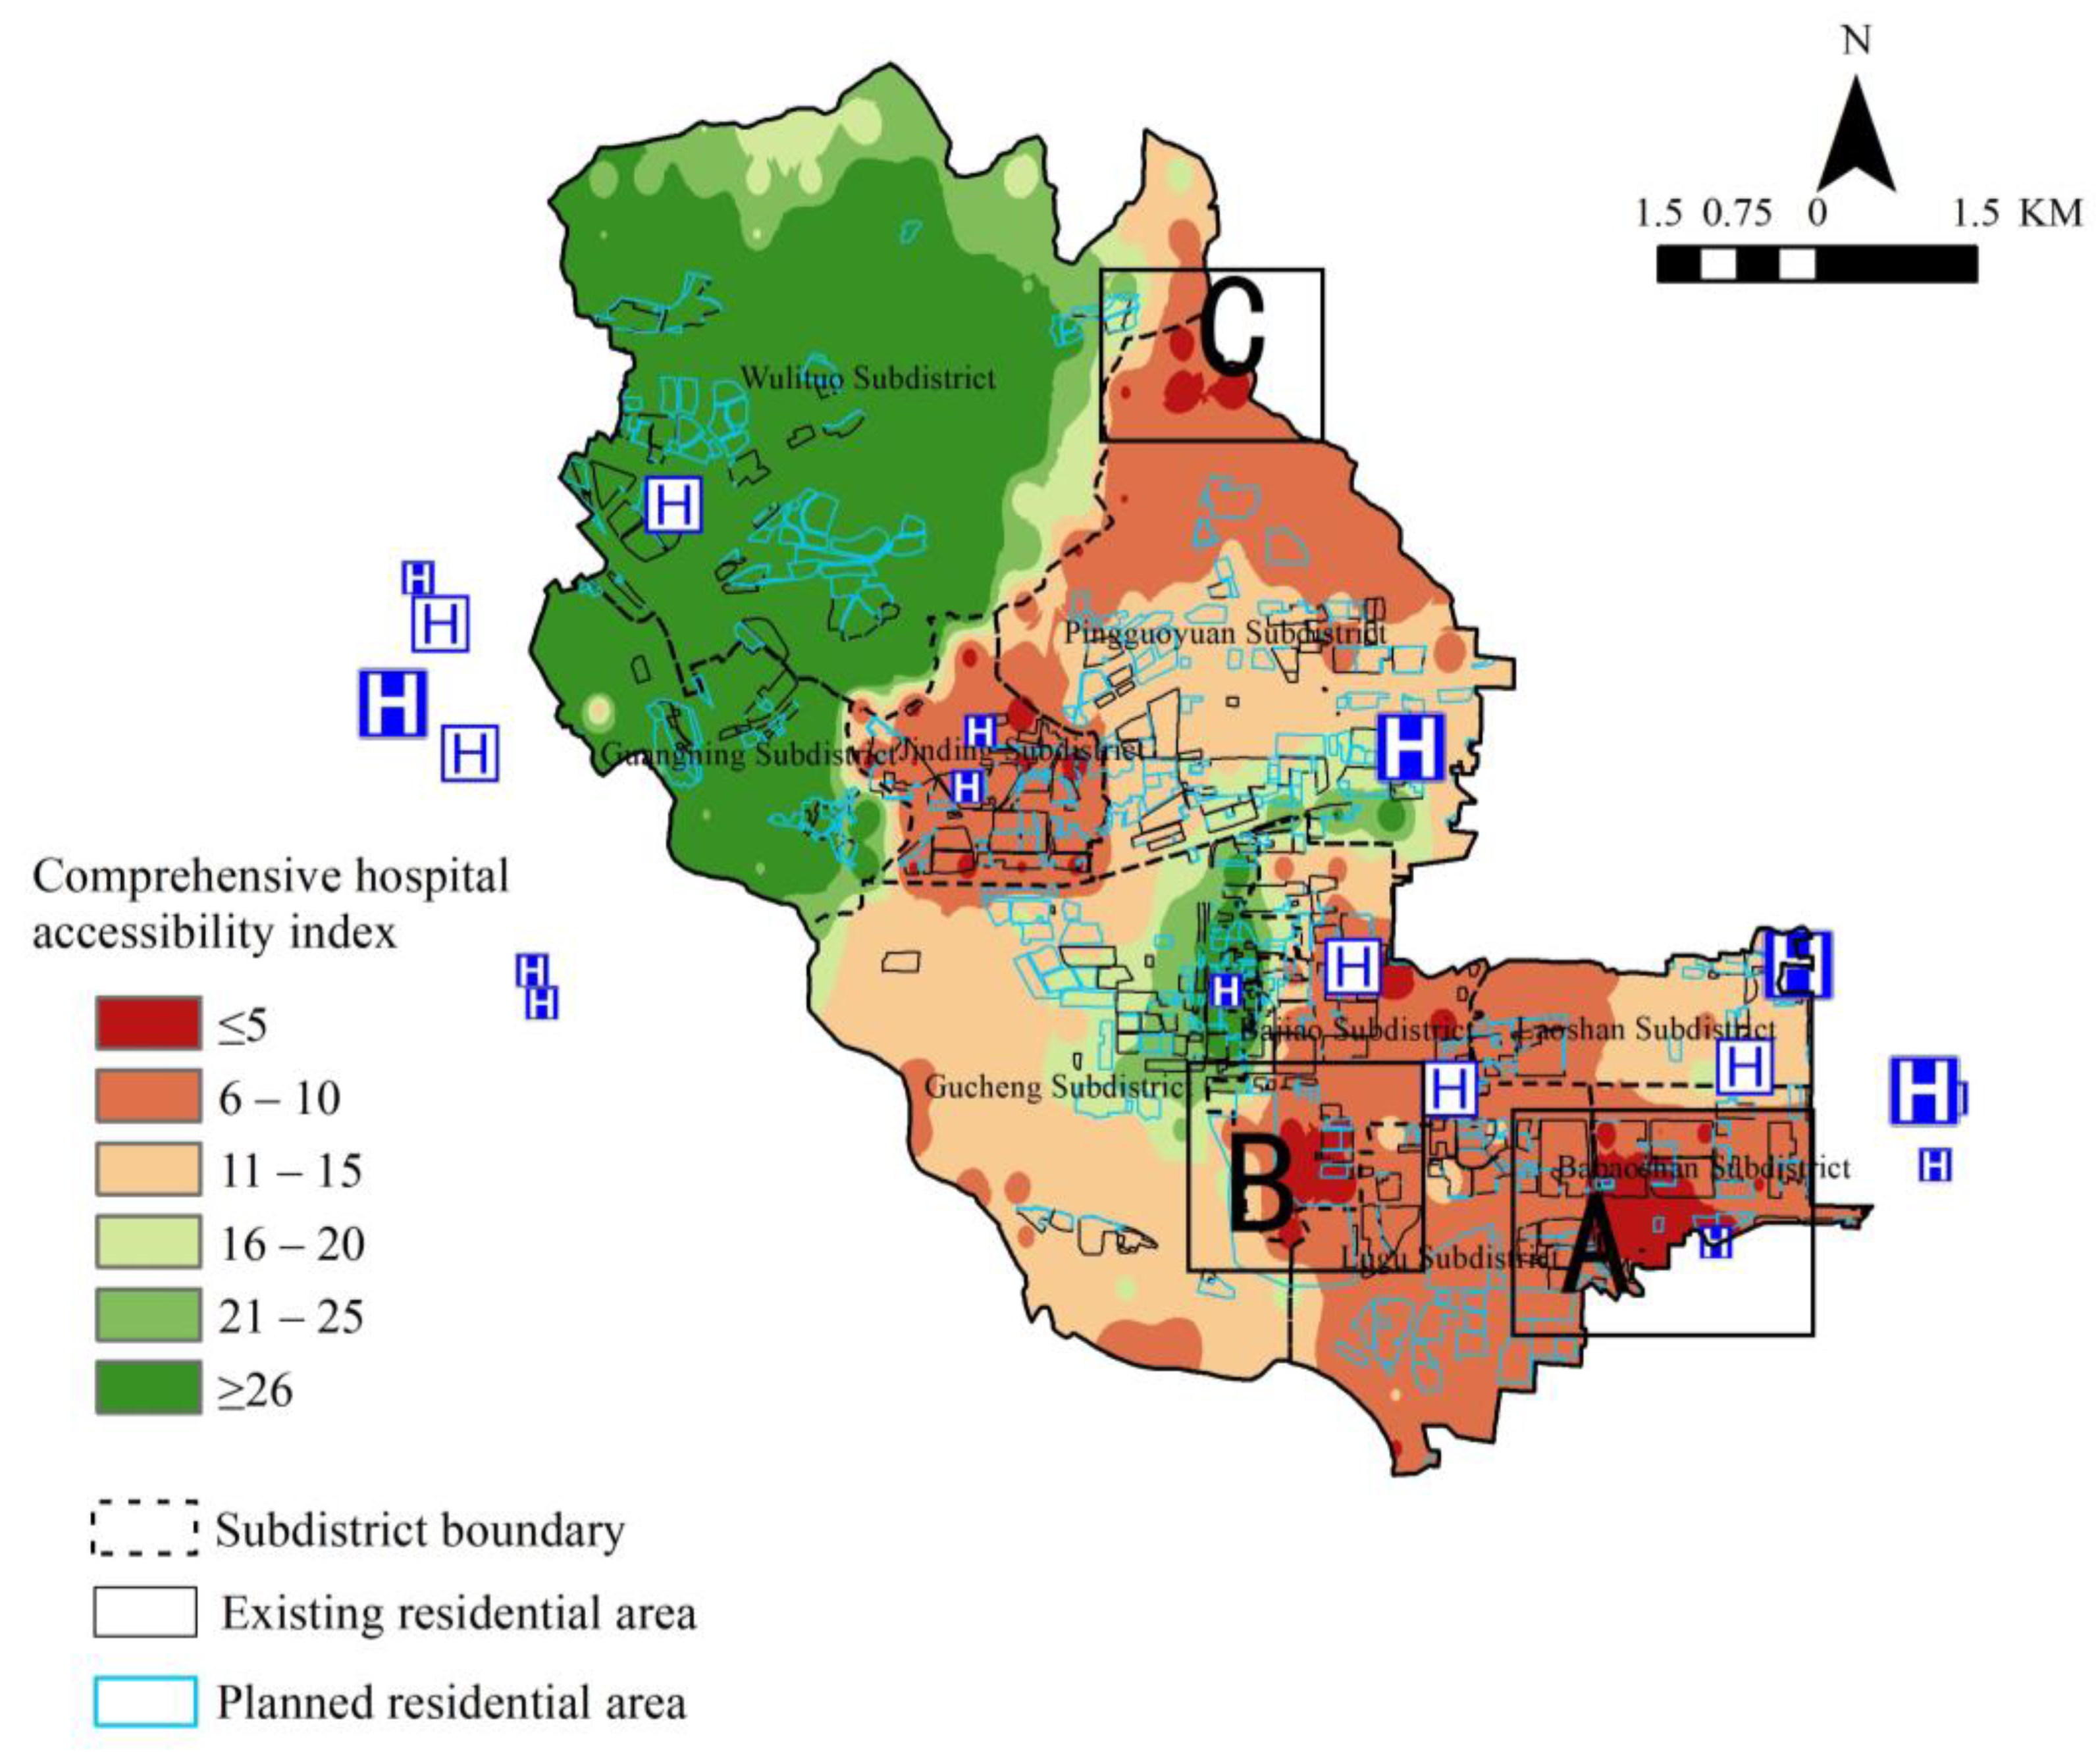
4.3.2. Identification of Key Areas for Medical Facility Layout Optimization
4.3.3. Optimization Strategies
5. Discussion
6. Conclusions
Author Contributions
Funding
Institutional Review Board Statement
Informed Consent Statement
Data Availability Statement
Acknowledgments
Conflicts of Interest
References
- World Health Organization (WHO). Available online: https://www.who.int/publications/i/item/9789241548038 (accessed on 4 July 2022).
- Neutens, T. Accessibility, equity and health care: Review and research directions for transport geographers. J. Transp. Geogr. 2015, 43, 14–27. [Google Scholar] [CrossRef]
- Lee, D.C.; Carr, B.G.; Smith, T.E.; Tran, V.C.; Polsky, D.; Branas, C.C. The impact of hospital closures and hospital and population characteristics on increasing emergency department volume: A geographic analysis. Popul. Health Manag. 2015, 18, 459–466. [Google Scholar] [CrossRef] [PubMed]
- Jia, P.; Xierali, I.M.; Wang, F. Evaluating and re-demarcating the hospital service areas in Florida. Appl. Geogr. 2015, 60, 248–253. [Google Scholar] [CrossRef]
- Goodman, D.C.; Fisher, E.; Stukel, T.A.; Chang, C. The distance to community medical care and the likelihood of hospitalization: Is closer always better? Am. J. Public Health 1997, 87, 1144–1150. [Google Scholar] [CrossRef] [Green Version]
- Wilkin, D. Primary care budget holding in the United Kingdom National Health Service: Learning from a decade of health service reform. Med. J. Aust. 2002, 11, 539–542. [Google Scholar] [CrossRef]
- Goldfield, N.; Gnani, S.; Majeed, A. Profiling performance in primary care in the United States. BMJ 2003, 326, 744. [Google Scholar] [CrossRef] [Green Version]
- Ricarda, M.; Carl, R.B. The Health Care Strengthening Act: The next level of integrated care in Germany. Health Pol. 2016, 120, 445–451. [Google Scholar] [CrossRef] [Green Version]
- Ossi, K.; Aleksi, N.; Tiina, L.; Tiina, H.; Eric, D.; Harri, A. Geographical accessibility to primary health care in Finland—Grid-based multimodal assessment. Appl. Geogr. 2021, 136, 102583. [Google Scholar] [CrossRef]
- Yiling, S.; Junyan, Y.; Michael, K.; Kun, S.; Ying, L.; Cheng, G. Spatial Accessibility Patterns to Public Hospitals in Shanghai: An Improved Gravity Model. Prof. Geogr. 2022, 74, 265–289. [Google Scholar] [CrossRef]
- Paulo, B.; Paulo, G. Health care systems in transition: Brazil: Part I: An outline of Brazil’s health care system reforms. J. Public Health 1996, 18, 289–295. [Google Scholar] [CrossRef]
- Shroff, Z.C.; Marten, R.; Ghaffar, A.; Kabir, S.; Hendrik, B.; Manoj, J.; Soumya, S. On the path to Universal Health Coverage: Aligning ongoing health systems reforms in India. BMJ Glob. Health 2020, 5, 3801. [Google Scholar] [CrossRef] [PubMed]
- Lechowski, Ł.; Jasion, A. Spatial Accessibility of Primary Health Care in Rural Areas in Poland. Int. J. Environ. Res. Public Health 2021, 18, 9282. [Google Scholar] [CrossRef] [PubMed]
- Shaoyao, Z.; Xueqian, S.; Jie, Z. An equity and efficiency integrated grid-to-level 2SFCA approach: Spatial accessibility of multilevel healthcare. Int. J. Equity Health 2021, 20, 229. [Google Scholar] [CrossRef]
- National Bureau of Statistics. Available online: http://www.stats.gov.cn/tjsj/zxfb/202002/t20200228_1728913.html (accessed on 4 July 2022).
- Hansen, W.G. How accessibility shapes land-use. J. Am. Inst. Plan. 1959, 25, 73–76. [Google Scholar] [CrossRef]
- Khan, A.A. An integrated approach to measuring potential spatial access to health care services. Socio-Econ. Plan. Sci. 1992, 26, 275–287. [Google Scholar] [CrossRef]
- Zheng, S.; Wen, C.; Qian, C.; Lei, Z. Measurement of Spatial Accessibility to Health Care Facilities and Defining Health Professional Shortage Areas Based on Improved Potential Model: A Case Study of Rudong County in Jiangsu Province. Sci. Geogr. Sin. 2010, 30, 213–219. [Google Scholar] [CrossRef]
- Penchansky, R.; Thomas, J.W. The Concept of Access: Definition and Relationship to Consumer Satisfaction. Med. Care 1981, 19, 127–140. [Google Scholar] [CrossRef] [PubMed]
- Tobias, M.; Silva, N.; Rodrigues, D. A107 perception of health and accessibility in Amazonia: An approach with GIS mapping to making decision on hospital location. J. Trans. Health 2015, 2, 60–61. [Google Scholar] [CrossRef]
- Dewulf, B.; Neutens, T.; de Weerdt, Y.; van de Weghe, N. Accessibility to primary health care in Belgium: An evaluation of policies awarding financial assistance in shortage areas. BMC Fam. Pract. 2013, 14, 122. [Google Scholar] [CrossRef] [Green Version]
- Sreemongkol, K.; Lohatepanont, M.; Cheewinsiriwat, P.; Bunlikitkul, T.O.; Supasaovapak, J. GIS Mapping Evaluation of Stroke Service Areas in Bangkok Using Emergency Medical Services. ISPRS Int. J. Geo-Inf. 2021, 10, 651. [Google Scholar] [CrossRef]
- Lovett, A.; Sunnenberg, G.; Haynes, R. Using GIS to assess accessibility to primary health care services. Public Health Pract. 2004, 2, 187–204. [Google Scholar]
- Fan, P.; Xu, L.; Yue, W.; Chen, J. Accessibility of public urban green space in an urban periphery: The case of Shanghai. Landsc. Urban Plan. 2016, 165, 177–192. [Google Scholar] [CrossRef]
- Guagliardo, M.F. Spatial accessibility of primary care: Concepts, methods and challenges. Int. J. Health Geogr. 2004, 3, 3. [Google Scholar] [CrossRef] [PubMed] [Green Version]
- Yang, N.; Chen, S.; Hu, W.L.; Wu, Z.; Chao, Y. Spatial distribution balance analysis of hospitals in Wuhan. Int. J. Environ. Res. Public Health 2016, 13, 971. [Google Scholar] [CrossRef] [Green Version]
- Ngamini Ngui, A.; Vanasse, A. Assessing spatial accessibility to mental health facilities in an urban environment. Spat. Spat. Epidemiol. 2012, 3, 195–203. [Google Scholar] [CrossRef]
- Wang, F. Measurement, Optimization, and Impact of Health Care Accessibility: A Methodological Review. Ann. Am. Assoc. Geogr. 2012, 102, 1104–1112. [Google Scholar] [CrossRef] [Green Version]
- Yiannakoulias, N.; Bland, W.; Svenson, L.W. Estimating the effect of turn penalties and traffic congestion on measuring spatial accessibility to primary health care. Appl. Geogr. 2013, 39, 172–182. [Google Scholar] [CrossRef]
- Andersen, R. A behavioral model of families’ use of health services. J. Hum. Resour. 1968, 7, 125. [Google Scholar]
- Luo, W.; Wang, F. Measures of spatial accessibility to health care in a GIS environment: Synthesis and a case study in the Chicago region. Environ. Plann. Plann. Des. 2003, 30, 865–884. [Google Scholar] [CrossRef] [Green Version]
- Wang, F.H.; Luo, W. Assessing spatial and non-spatial factors for healthcare access: Towards an integrated approach to defining health professional shortage areas. Health Place 2005, 11, 131–146. [Google Scholar] [CrossRef]
- Xing, L.; Liu, Y.; Wang, B.; Wang, Y.; Liu, H. An environmental justice study on spatial access to parks for youth by using an improved 2SFCA method in Wuhan, China. Cities 2020, 96, 102405. [Google Scholar] [CrossRef]
- Wan, N.; Zou, B.; Sternberg, T. A three-step floating catchment area method for analyzing spatial access to health services. Int. J. Geogr. Inf. Sci. 2012, 26, 1073–1089. [Google Scholar] [CrossRef]
- Zhang, F.; Li, D.; Sherry, A.; Zhang, J. Assessing spatial disparities of accessibility to community-based service resources for Chinese older adults based on travel behavior: A city-wide study of Nanjing, China. Habitat Int. 2019, 88, 101984. [Google Scholar] [CrossRef]
- Ye, C.; Hu, L.; Li, M. Urban green space accessibility changes in a high-density city: A case study of Macau from 2010 to 2015. J. Transp. Geogr. 2018, 66, 106–115. [Google Scholar] [CrossRef]
- Wang, H.; Wei, X.; Ao, W. Assessing Park Accessibility Based on a Dynamic Huff Two-Step Floating Catchment Area Method and Map Service API. ISPRS Int. J. Geo-Inf. 2022, 11, 394. [Google Scholar] [CrossRef]
- Luo, W.; Qi, Y. An enhanced two-step floating catchment area (E2SFCA) method for measuring spatial accessibility to primary care physicians. Health Place 2009, 15, 1100–1107. [Google Scholar] [CrossRef]
- Xiao, Y.; Chen, X.; Li, Q.; Jia, P.; Li, L.; Chen, Z. Towards healthy China 2030: Modeling health care accessibility with patient referral. Soc. Sci. Med. 2021, 276, 113834. [Google Scholar] [CrossRef]
- Liu, Z.; Yang, H.; Xiong, W.; Chen, G. Spatial accessibility of medical services at county level based on optimized two-step floating catchment area method. Sci. Geogr. Sin. 2017, 5, 91–100. [Google Scholar] [CrossRef]
- Cheng, G.; Zeng, X.; Duan, L.; Lu, X.; Sun, H.; Jiang, T.; Li, Y. Spatial difference analysis for accessibility to high level hospitals based on travel time in Shenzhen, China. Habitat Int. 2016, 53, 485–494. [Google Scholar] [CrossRef] [Green Version]
- Cheng, M.; Lian, Y. Spatial accessibility of urban medical facilities based on improved potential model: A case study of Yangpu District in Shanghai. Prog. Geogr. 2018, 37, 266–275. [Google Scholar] [CrossRef] [Green Version]
- Schuurman, N.; Bérubé, M.; Crooks, V.A. Measuring potential spatial access to primary health care physicians using a modified gravity model. Can. Geogr. 2010, 54, 29–45. [Google Scholar] [CrossRef]
- Cheng, M.; Tao, L.; Lian, Y.; Huang, W. Measuring Spatial Accessibility of Urban Medical Facilities: A Case Study in Changning District of Shanghai in China. Int. J. Environ. Res. Public Health 2021, 18, 9598. [Google Scholar] [CrossRef] [PubMed]
- Ding, S.; Chen, B. Rationality Assessment of the Spatial Distributions of Urban Medical Facility. J. Geo-Inf. Sci. 2017, 19, 185–196. [Google Scholar] [CrossRef]
- Zheng, Z.; Zhang, L.; Qin, Y.; Xie, Z.; Rong, P.; Li, Y. Analysis of medical accessibility in Kaifeng based on Internet map service. Res. Sci. 2018, 11, 2307–2316. [Google Scholar] [CrossRef]
- Zhou, Y.; Li, Y.; Huang, Y.; Geng, E. Classification and activity characteristics analysis of urban population based on social media data. J. Geoinf. Sci. 2017, 19, 1238–1244. [Google Scholar] [CrossRef]
- Niu, Q.; Wang, Y.; Xia, Y.; Wu, H.; Tang, X. Detailed Assessment of the Spatial Distribution of Urban Parks According to Day and Travel Mode Based on Web Mapping API: A Case Study of Main Parks in Wuhan. Int. J. Environ. Res. Public Health 2018, 15, 1725. [Google Scholar] [CrossRef] [PubMed] [Green Version]
- Choi, W.; Min, S.; Jang, I.; Chang, Y. The Comparative Research On 2D Web Mapping Open API for Designing Geo-Spatial Open Platform. J. Kor. Spat. Inf. Soc. 2014, 22, 87–98. [Google Scholar] [CrossRef] [Green Version]
- Zhou, X.; Kim, J. Social disparities in tree canopy and park accessibility: A case study of six cities in Illinois using GIS and remote sensing. Urban For. Urban Green. 2013, 12, 88–97. [Google Scholar] [CrossRef]
- Xia, N.; Cheng, L.; Chen, S.; Wei, X.; Zong, W.; Li, M. Accessibility based on Gravity-Radiation model and Google Maps API: A case study in Australia. J. Transp. Geogr. 2018, 72, 178–190. [Google Scholar] [CrossRef]
- Zheng, Z.; Shen, W.; Li, Y.; Qin, Y.; Wang, L. Spatial equity of park green space using KD2SFCA and web map API: A case study of Zhengzhou, China. Appl. Geogr. 2020, 123, 102310. [Google Scholar] [CrossRef]
- Xu, M.; Xin, J.; Su, S.; Weng, M.; Cai, Z. Social inequalities of park accessibility in Shenzhen, China: The role of park quality, transport modes, and hierarchical socioeconomic characteristics. J. Transp. Geogr. 2017, 62, 38–50. [Google Scholar] [CrossRef]
- Rong, P.; Zheng, Z.; Kwan, M.; Qin, Y. Evaluation of the spatial equity of medical facilities based on improved potential model and map service API: A case study in Zhengzhou, China. Appl. Geogr. 2020, 119, 102192. [Google Scholar] [CrossRef]
- Zheng, Z.; Xia, H.; Ambinakudige, S.; Qin, Y.; Li, Y.; Xie, Z.; Zhang, L.; Gu, H. Spatial Accessibility to Hospitals Based on Web Mapping API: An Empirical Study in Kaifeng, China. Sustainability 2019, 11, 1160. [Google Scholar] [CrossRef] [Green Version]
- Zheng, S.; Wen, C. Measuring Spatial Accessibility to Health Care Facilities Based on Potential Model. Progr. Geogr. 2009, 28, 848–854. [Google Scholar]
- Beijing Transport Institute. Available online: https://www.bjtrc.org.cn/List/index/cid/7.html (accessed on 4 July 2022).
- Joseph, A.E.; Bantock, P.R. Measuring potential physical accessibility to general practitioners in rural areas: A method and case study. Soc. Sci. Med. 1982, 16, 85–90. [Google Scholar] [CrossRef]
- National Health Commission of the People’s Republic of China. Available online: http://www.nhc.gov.cn/yzygj/s7657/202012/c46f97f475da4d60be21641559417aaf.shtml (accessed on 4 July 2022).
- Wang, X.; Yang, H.; Duan, Z.; Pan, J. Spatial accessibility of primary health care in China: A case study in Sichuan Province. Soc. Sci. Med. 2018, 209, 14–24. [Google Scholar] [CrossRef]
- Zeng, W.; Xiang, L.; Li, H.; Zhang, X.; Zhang, H. Spatial pattern and formation mechanism of accessibility of medical service facilities in Nanjing, China. Econo. Geogr. 2017, 37, 136–143. [Google Scholar] [CrossRef]
- Shijingshan District People’s Government of Beijing Municipality. Available online: http://www.bjsjs.gov.cn/sjsview/qqgk/ (accessed on 4 July 2022).
- The Seventh National Population Census Bulletin of Beijing Shijingshan District. Available online: http://www.bjsjs.gov.cn/ywdt/sjsdt/20210611/15215453.shtml (accessed on 4 July 2022).
- Beijing Municipal Commission of Transportation. Available online: http://service.jtw.beijing.gov.cn/creditTransport/ (accessed on 4 July 2022).
- Beijing Municipal Government Affairs Data Resource Network. Available online: https://data.beijing.gov.cn/zyml/azt/index.htm (accessed on 4 July 2022).
- Beijing City Lab. Available online: https://www.beijingcitylab.com/ (accessed on 4 July 2022).
- Reggiani, A.; Bucci, P.; Russo, G. Accessibility and impedance forms: Empirical applications to the German commuting network. Int. Reg. Sci. Rev. 2011, 34, 230–252. [Google Scholar] [CrossRef] [Green Version]
- Peeters, D.; Thomas, I. Distance predicting functions and applied location-allocation models. J. Geogr. Syst. 2000, 2, 167–184. [Google Scholar] [CrossRef]
- Wang, F. Modeling Commuting Patterns in Chicago in a GIS Environment: A Job Accessibility Perspective. Prof. Geogr. 2000, 52, 120–133. [Google Scholar] [CrossRef] [Green Version]
- Tao, H.; Chen, X.; Li, X. Research on Spatial Accessibility of Public Medical and Health Services: Taking Haizhu District of Guangzhou City as an Example. Geomapp. Spat. Inf. Technol. 2007, 30, 1–5. [Google Scholar]
- Wu, J.; Kong, Y.; Li, B. Spatial accessibility analysis of rural medical facilities based on GIS: A Case Study of Taking Lankao County, Henan Province as an example. Hum. Geogr. 2008, 5, 37–42. [Google Scholar] [CrossRef]
- Wang, F.; Zhang, C. Application of GIS and Gravitational Polygon Methods in Public Facility Service Domain Research: A Case Study of Shanghai Pudong New Area General Hospital. Econ. Geogr. 2005, 25, 800–809. [Google Scholar] [CrossRef]
- Wang, X.; Pan, J. Assessing the Disparity in Spatial Access to Hospital Care in Ethnic Minority Region in Sichuan Province, China. BMC Health Serv. Res. 2016, 16, 399. [Google Scholar] [CrossRef]
- Chen, B.Y.; Cheng, X.P.; Kwan, M.P.; Schwanen, T. Evaluating Spatial Accessibility to Healthcare Services Under Travel Time Uncertainty: A Reliability-based Floating Catchment Area Approach. J. Transp. Geogr. 2020, 87, 102794. [Google Scholar] [CrossRef]


Publisher’s Note: MDPI stays neutral with regard to jurisdictional claims in published maps and institutional affiliations. |
© 2022 by the authors. Licensee MDPI, Basel, Switzerland. This article is an open access article distributed under the terms and conditions of the Creative Commons Attribution (CC BY) license (https://creativecommons.org/licenses/by/4.0/).
Share and Cite
Wang, J.; Su, Y.; Chen, Z.; Tang, L.; Wang, G.; Wang, J. Assessing the Spatial Accessibility of Urban Medical Facilities in Multi-Level and Multi-Period Scales Based on Web Mapping API and an Improved Potential Model. ISPRS Int. J. Geo-Inf. 2022, 11, 545. https://doi.org/10.3390/ijgi11110545
Wang J, Su Y, Chen Z, Tang L, Wang G, Wang J. Assessing the Spatial Accessibility of Urban Medical Facilities in Multi-Level and Multi-Period Scales Based on Web Mapping API and an Improved Potential Model. ISPRS International Journal of Geo-Information. 2022; 11(11):545. https://doi.org/10.3390/ijgi11110545
Chicago/Turabian StyleWang, Jingyong, Yuwei Su, Zihao Chen, Lixuan Tang, Guoen Wang, and Jiangping Wang. 2022. "Assessing the Spatial Accessibility of Urban Medical Facilities in Multi-Level and Multi-Period Scales Based on Web Mapping API and an Improved Potential Model" ISPRS International Journal of Geo-Information 11, no. 11: 545. https://doi.org/10.3390/ijgi11110545