1. Introduction
Geospatial catalogues are discovery and access systems that use metadata as the target for querying geospatial resources [
1]. They are typically either directly downloadable datasets (identifiable collections of data) or services for visualising and accessing these datasets. Metadata indicates the purpose, quality, timeliness, location, subjects, and relationships enabling the discovery, evaluation, and application of geospatial resources within and beyond the objectives of the originating data provider [
2].
The objective of any catalogue storage system is to make the contained resources findable, accessible, interoperable, and reusable, which is commonly known as the FAIR principle [
3]. With respect to findability, the prevalent approach for searching geospatial data in geospatial catalogues is the “concept at location in time” query [
4]. That is, users expect that geospatial catalogues will return information based on their conceptual, spatial, and temporal relevance with respect to a query. This approach is natural, but it is known to be ineffective in the real world without improving the different geospatial catalogue components with intelligent metadata curation methods or the use of advanced search engines [
5]. There are multiple works in the literature proposing search improvements in the fulfilment of FAIR principles through adding semantics and ontologies to the metadata, using new ranking algorithms, or boosting data storage [
6,
7,
8,
9].
However, none of these proposals addresses the mismatch between the continuous nature of geospatial information and the discrete nature of data production. When a query is submitted to a geospatial catalogue about a concept covering a wide spatial extent, likely none of the retrieved resources will cover the entire extent (most of the results will only cover small parts of this extent). For example, an analyst could search for data about the hydrological behaviour in a given mountain range in a catalogue. However, river basin datasets usually cover a single basin, since each basin is separated topographically from adjacent ones by a mountain range forming a drainage divide. Therefore, a query for rivers (concept) covering the mountain range (location) will return a collection of datasets describing all the river basins where the mountain range acts as drainage divide among many others containing the concepts of river and mountain range. If there is no single resource containing all the requested information, the analyst is forced to review all search results to locate those that contain relevant information and merge their content.
We think that one of the main sources of this problem is the lack of alignment between user needs and data producer objectives. Data producers create resources based on their areas of responsibility. Users query catalogues based on their own areas of interest. These areas of interest may be defined by themes covering a spatial continuum from the user’s point of view, which does not necessarily match with the areas of responsibility of data producers. Therefore, geospatial catalogues may often return resources that partially cover the query area without contextual information useful to discover sets of results that, seen as a collection, cover the whole query area. We refer to this problem as data fragmentation in the results. This problem can be solved by identifying the set of resources that conceptually belong to the same thematic layer. From the provider side, a solution for this challenge is the use of spatial dataset series, which are collections of spatial datasets that share similar properties of theme, scale, or purpose [
10]. However, from the point of view of users, they are not enough since the relevant data of an area could be scattered across different spatial dataset series from different data providers. Therefore, a more general solution is required to identify thematic relationships in the resources of a geospatial catalogue, create virtual spatial dataset series from them, and return them as part of related query result sets.
Objectives and Contributions
Our proposal to deal with data fragmentation is to change the way in which results are presented in geospatial catalogues. The described information retrieval (IR) problem is not specifically related to the selection of an IR algorithm, since all resources can be considered as partially relevant, but about how the information fragments (individual resources) are presented to the users. Instead of a list of individual results covering parts of the requested area, we think that it is better if these results are grouped by spatial compatibility with respect to the spatial extent specified in the user query. That is, compatible resources that provide jointly a better answer to the user query should be shown as a set.
To generate these collections, we propose to cluster the metadata records to identify sets of similar resources from different providers that describe the same theme. Due to their heterogeneous creation, these resources may have a different format, resolution, or data granularity. However, as they have the same theme and their union covers wider areas than each resource individually, these sets can be perceived by users as a valid response to their search. We can name these sets as quasi-spatial dataset series because they can be described as virtual collections of spatial datasets that share some features attributed to data series. That is, these sets are collections of spatial datasets with a close product specification. These series aggregate, by similarity, the resources that are compatible, preventing the user from needing to do this analysis. These collections will probably contain resources with different resolution, overlapping areas, or different temporal extent, but, from the point of view of the user, they aggregate resources that can be seen as a whole in a similar way to a dataset series. In the case of dataset series, their homogeneity makes their integration direct, while the proposed quasi-spatial dataset series would require harmonisation of their content. We do not perform data integration in this work, but it would be the next natural step of the proposal presented in this paper. In this way, the user could obtain the available information in the defined quasi-spatial dataset series homogeneously.
This work evaluates whether state-of-the-art clustering processes can efficiently aggregate spatial resources into quasi-spatial dataset series, using only textual information from elements in their associated metadata records. To identify which clustering process is best suited for this task, we compare the performance obtained using different data cleaning, feature representation models, and clustering algorithms. The evaluation has been performed with a collection of 630 metadata records obtained from a catalogue published at IDEE (the National Spatial Data Infrastructure of Spain), a leading national spatial data infrastructure in Europe. These records, compliant with the ISO 19115 geographic metadata standard [
2], contain descriptive textual information on a range of themes such as cadastre, environment, and infrastructures.
The contributions of this paper are focused on two areas: the study of the IR problem of current geospatial catalogues and the comparison of different clustering alternatives that can reduce this problem. It addresses the following research questions:
- RQ1
What causes the ineffectiveness of current geospatial catalogue IR systems, and how can they be improved? To answer this question, we analyse the current state of geospatial catalogues and describe the IR problems related with the dissonance between the continuous nature of geospatial information and the digital library-based structure of these metadata catalogues. As a solution to reduce these IR issues, we propose the generation of collections of related resources, which we call quasi-spatial dataset series, defined to improve the display of query results.
- RQ2
Can current clustering techniques generate good quality quasi-spatial dataset series? Here, we have established as baseline a collection of metadata records with manually tagged quasi-spatial dataset series. Then, we have performed experiments with multiple clustering process configurations to determine if they could automatically identify the collections. We perform different kinds of cleaning of the source data and compare the results using the classic TF-IDF feature representation with respect to modern embeddings (Word2Vec, GloVe, FastText, ELMo, Sentence BERT, and Universal Sentence Encoder). As clustering algorithms, we have compared K-Means, DBSCAN, OPTICS, and Agglomerative clustering.
- RQ3
Which clustering processes are the most suitable for this task? The different processes performed are compared with respect to the manually tagged collections using V-measure and Adjusted-Mutual-Information. Apart from identifying the best performing configurations, we also search for general solutions (those that do not preprocess the input text in any way) to determine if they are good enough to be used by a catalogue.
The paper is organised as follows:
Section 2 describes the state-of-the-art in clustering techniques to generate the desired quasi-spatial dataset series.
Section 3 introduces the problems that produce data fragmentation in geospatial catalogues.
Section 4 explains the characteristics of the clustering processes used in the experiments. Then,
Section 5 presents the dataset and the experimental setup used for the experiments, and
Section 6 compares the results obtained with respect to the selected reference collection. The paper finishes with a discussion about the results, conclusions, and an outlook on future work.
2. Related Work
In the geospatial catalogue context, there have been numerous works trying to improve search processes in different ways. Larson and Frontiera [
11] make a comparison of several ranking algorithms for georeferenced objects including simple, topological, and extent overlap, then propose a probabilistic spatial ranking based on logistic regression that uses the area of the overlap as the main similarity factor. Zhan et al. [
12] propose a semantic description model for geographic information able to deal with heterogeneity problems in descriptions by using ontologies. The proposal is focused on allowing the user to express the meaning of their queries so the results obtained are improved. Zhang et al. [
13] show an approach to extract geospatial data from multiple sources, model it as RDF to eliminate heterogeneity, and link it using a semantic matching algorithm. de Andrade et al. [
14] remark the limitations that make it difficult to find geospatial data in current geospatial catalogues. Some of the identified problems are the use of a single record to describe the feature types in a service, the lack of semantics in the descriptions, and the lack of a suitable ranking to organise the results in a query. They propose a framework with ranking metrics to improve spatial, semantic, temporal, and multidimensional queries. Li et al. [
15] describe an information retrieval process for geospatial catalogues that uses semantic latent analysis to improve effectiveness of the search engines. This enables the discovery of the semantics between word patterns that allows the identification of relevant resources not directly containing the query terms. Fugazza et al. [
16] and Fugazza et al. [
17] propose a methodology to add semantic features to metadata that allows metadata delegation and facilitates the identification of relations and simplifies their evolution management. Miao et al. [
18] show how to improve the effectiveness of geospatial data discovery using a measurement model of spatio-temporal similarity. Finally, Li et al. [
19] describe a deep-learning solution to improve search ranking of geospatial data using logs of previous user interactions in the catalogue. They model the relevance of data according to user interaction and use a deep learning ranking model to determine the order of the results for the queries. They propose a similarity measure that uses the maximum semantic distance between any pair of nodes in the ontology used for matching and the weighted distance from the lowest common ancestor node to the root node.
In the field of digital libraries, clustering has been frequently used to generate sets of related resources that facilitate search and browsing. Aggarwal and Zhai [
20] make a detailed compilation of the classic clustering techniques for organisation, browsing, summarisation, and classification of documents. Metadata records can be treated as short documents in which the description plays the role of document content, and, therefore, can be clustered according to their similarity.
A basic aspect of clustering is feature representation. Document Frequency, Latent Semantic Indexing, and Non Negative Matrix Factorisation are classic solutions for this task [
20]. Word embeddings is a recent word representation also suitable for clustering [
21,
22]. It maps words to a multidimensional vector space model so that semantically similar/related words tend to be close in that space. There are multiple neural network architectures able to generate these embeddings. Word2Vec [
23], GloVe [
24], or FastText [
25], ELMo [
26], BERT [
27], or GPT-3 [
28] are among the most popular ones. They have evolved from context independent architectures to context dependent ones that produce better results for understanding the semantics of the words. Since word embeddings are word representations, to represent text sentences, Arora et al. [
29] propose different means of the word embeddings of words in a sentence. Sentence embeddings is the evolution of word embeddings to encode complete sentences into vector representations. They have the advantage of obtaining a sentence representation directly without having to consider each word independently. The most popular architectures are Doc2Vec [
30], Sentence BERT [
31], InferSent [
32], and the Universal Sentence Encoder [
33]. An example of the use of embeddings in clustering is Kusner et al. [
34], who use the minimum distance between their document embeddings as a distance metric. Similarly, Zhang et al. [
35] describe the generation of classification taxonomies from documents using word embeddings of the document content. They define an embedding module that learns discriminative embeddings at the different levels of the taxonomy. Hu et al. [
36] analyse the evolution of topics in scientific papers through their representation as Word2Vec embeddings and measuring their spatial autocorrelation in the embeddings space. They measure how the popularity of some keywords affects the surrounding ones. Diaz et al. [
37] propose the embedding of spatio-temporal textual data in a representation that allows identifying patterns associated with time and location of human activities described as text. Their model allows suggesting periods or locations linked to a sentence and vice versa. Li et al. [
38] perform text clustering using Sentence BERT as encoding of the text sentences, a weighting layer to increase the relevance of sentences as a function of the named entities contained, and K-means as the clustering algorithm. Arenas-Márquez et al. [
39] describes the use of a convolutional neural network to identify topics of interest in a collection of TripAdvisor messages using Word2Vec embeddings of the words in the documents as input. They compare this approach with respect to Latent Dirichlet Allocation encoding of the texts and Word2Vec mean.
Multiple clustering algorithms can use these feature representations. The most used algorithms are distance-based solutions such as K-means, Density-Based Spatial Clustering of Applications with Noise (DBSCAN), or Ordering Points To Identify the Clustering Structure (OPTICS), and probabilistic ones like Probabilistic Latent Semantic Indexing (PLSI) [
20]. The work of Zola et al. [
40] is a good example of how some of these clustering techniques are currently used in the spatial data context to identify patterns in text collections. They estimate Twitter user location based on their tweets using Google Trends frequencies of tweet nouns and clustering to identify the most probable location. Newman et al. [
41] show how statistical topic models classify thematically a collection of metadata records and provide faceted search. Lacasta et al. [
42] describe a clustering process for metadata that uses the hierarchical structure of the concepts contained in Knowledge Organisation Systems (KOS) to improve the clustering results. Thomas and Khan [
43] propose a clustering process for documents that uses the metadata information associated with each document to improve the quality of the clusters. Rajan et al. [
44] depict a clustering process to aggregate patent descriptions into similar groups to facilitate the search process in patent databases. Rakib et al. [
45] propose an iterative classification method that improves the clustering of short texts. This is done by detecting outliers during the clustering process and changing the clusters to which they are assigned. They apply this improvement to different K-means and hierarchical agglomerative clustering variants to determine the applicability to multiple clustering algorithms. Cai et al. [
46] propose the Adaptive DBSCAN clustering algorithm, a DBSCAN variant to deal with issues related to linear connections between objective clusters and parametrisation complexity. It uses a data splitter and merger coordinated in local and global clustering steps. This allows dynamically discovering clusters from local to global. Lou et al. [
47] analyse the evolution of research methods in the Chinese information science community. Multiple features, such as publication time, researcher age, novelty, or paper diversity, are taken into account for the analysis. To identify similarities by period, theme, or researcher, they cluster the works in the analysed collection using Euclidean distance similarity, Partitioning Around Medoids, and K-means. Misztal-Radecka and Indurkhya [
48] describes a Bias-Aware Hierarchical Clustering algorithm to improve recommendation systems by identifying clusters of users with unsuitable recommendations. It is a variation of K-means where splitting depends on high biases instead of minimum variance. They compare this solution with respect to other K-means variants, agglomerative clustering, Hierarchical BDSCAN, and Local Outlier Factor between others.
The work presented in this paper is similar to the previously described works that use clustering techniques to identify similarities in digital library collections. However, in our case, we search clusters in the metadata descriptions that can be classified as quasi-spatial dataset series, which puts limits on the way the clustering process is performed. To analyse the suitability of the different techniques and models, we compare a set of classical and modern clustering techniques. This includes different data-cleaning processes, feature representation models, and parametrisation of clustering algorithms.
3. Geospatial Catalogues and the Spatial Data Continuum
Geospatial catalogues are repositories of spatial resources defined by multiple providers and described through metadata. Data providers focus on specific areas because of legal obligations, economic limitations, and changing objectives over time.
These catalogues are technologically similar to digital libraries as they manage their content as any other discrete digital resource (e.g., a photo, a book, or a video). However, the spatial dimension makes geospatial catalogue content to be a patchwork of regions over the earth’s surface about heterogeneous themes. Ahmad and Ali [
49] show a comprehensive compilation of services with 153 active catalogues providing spatial data all around the globe that follow this approach. Among them, some relevant examples are the pan-European INSPIRE catalogue (
https://inspire-geoportal.ec.europa.eu/, accessed on 26 November 2021) and the national catalogues of the USA (GeoPlatform) (
https://www.geoplatform.gov/, accessed on 26 November 2021), Spain (IDEE) (
https://www.idee.es/es, accessed on 26 November 2021), United Kingdom (Data.Gov) (
https://data.gov.uk, accessed on 26 November 2021), and Canada (GeoDiscovery) (
https://geodiscover.alberta.ca/geoporta, accessed on 26 November 2021).
These catalogues provide a simple solution to publish resources, but the way they present results limits their usability. Geospatial information forms a continuum around Earth characterised by the spatial location (point, line, or polygon), and the theme, which is a conceptual abstraction of the nature/purpose of the represented data. Even discrete geospatial types, such as tree locations, rivers, or streets, are part of a bigger set covering all the earth’s surface (e.g., all the trees, rivers, or streets on the earth). Any division of this continuum is artificial and makes data management more complex, since the continuum has to be reconstructed to obtain the information distributed in multiple fragments. This indirectly downgrades the performance of any search system using this approach as partial data results are presented as complete results. This makes results of “concept at location in time” queries incomplete because, in most cases, the area queried by users does not fit the arbitrary partition of the spatial data. It is as if each spatial resource were a “book page” whose author, page title, date of creation, or publisher contained in the metadata could help to decide which “book page” fits better the user needs, even though the needed information may be found along all the “book”. Spatial data fragmentation increases existing challenges regarding metadata generation, update, and improvement [
50] and makes it difficult to maintain complete, up-to-date, and useful metadata. It causes heterogeneity and lack of harmonisation in descriptions, even in versions of the same resource, which is one of the causes of their poor performance [
5]. Finally, since the provided results are only partially relevant, they are difficult to present in a suitable way for the users. A sequential list of results is confusing when the provided results are only fragments of the data in a given theme.
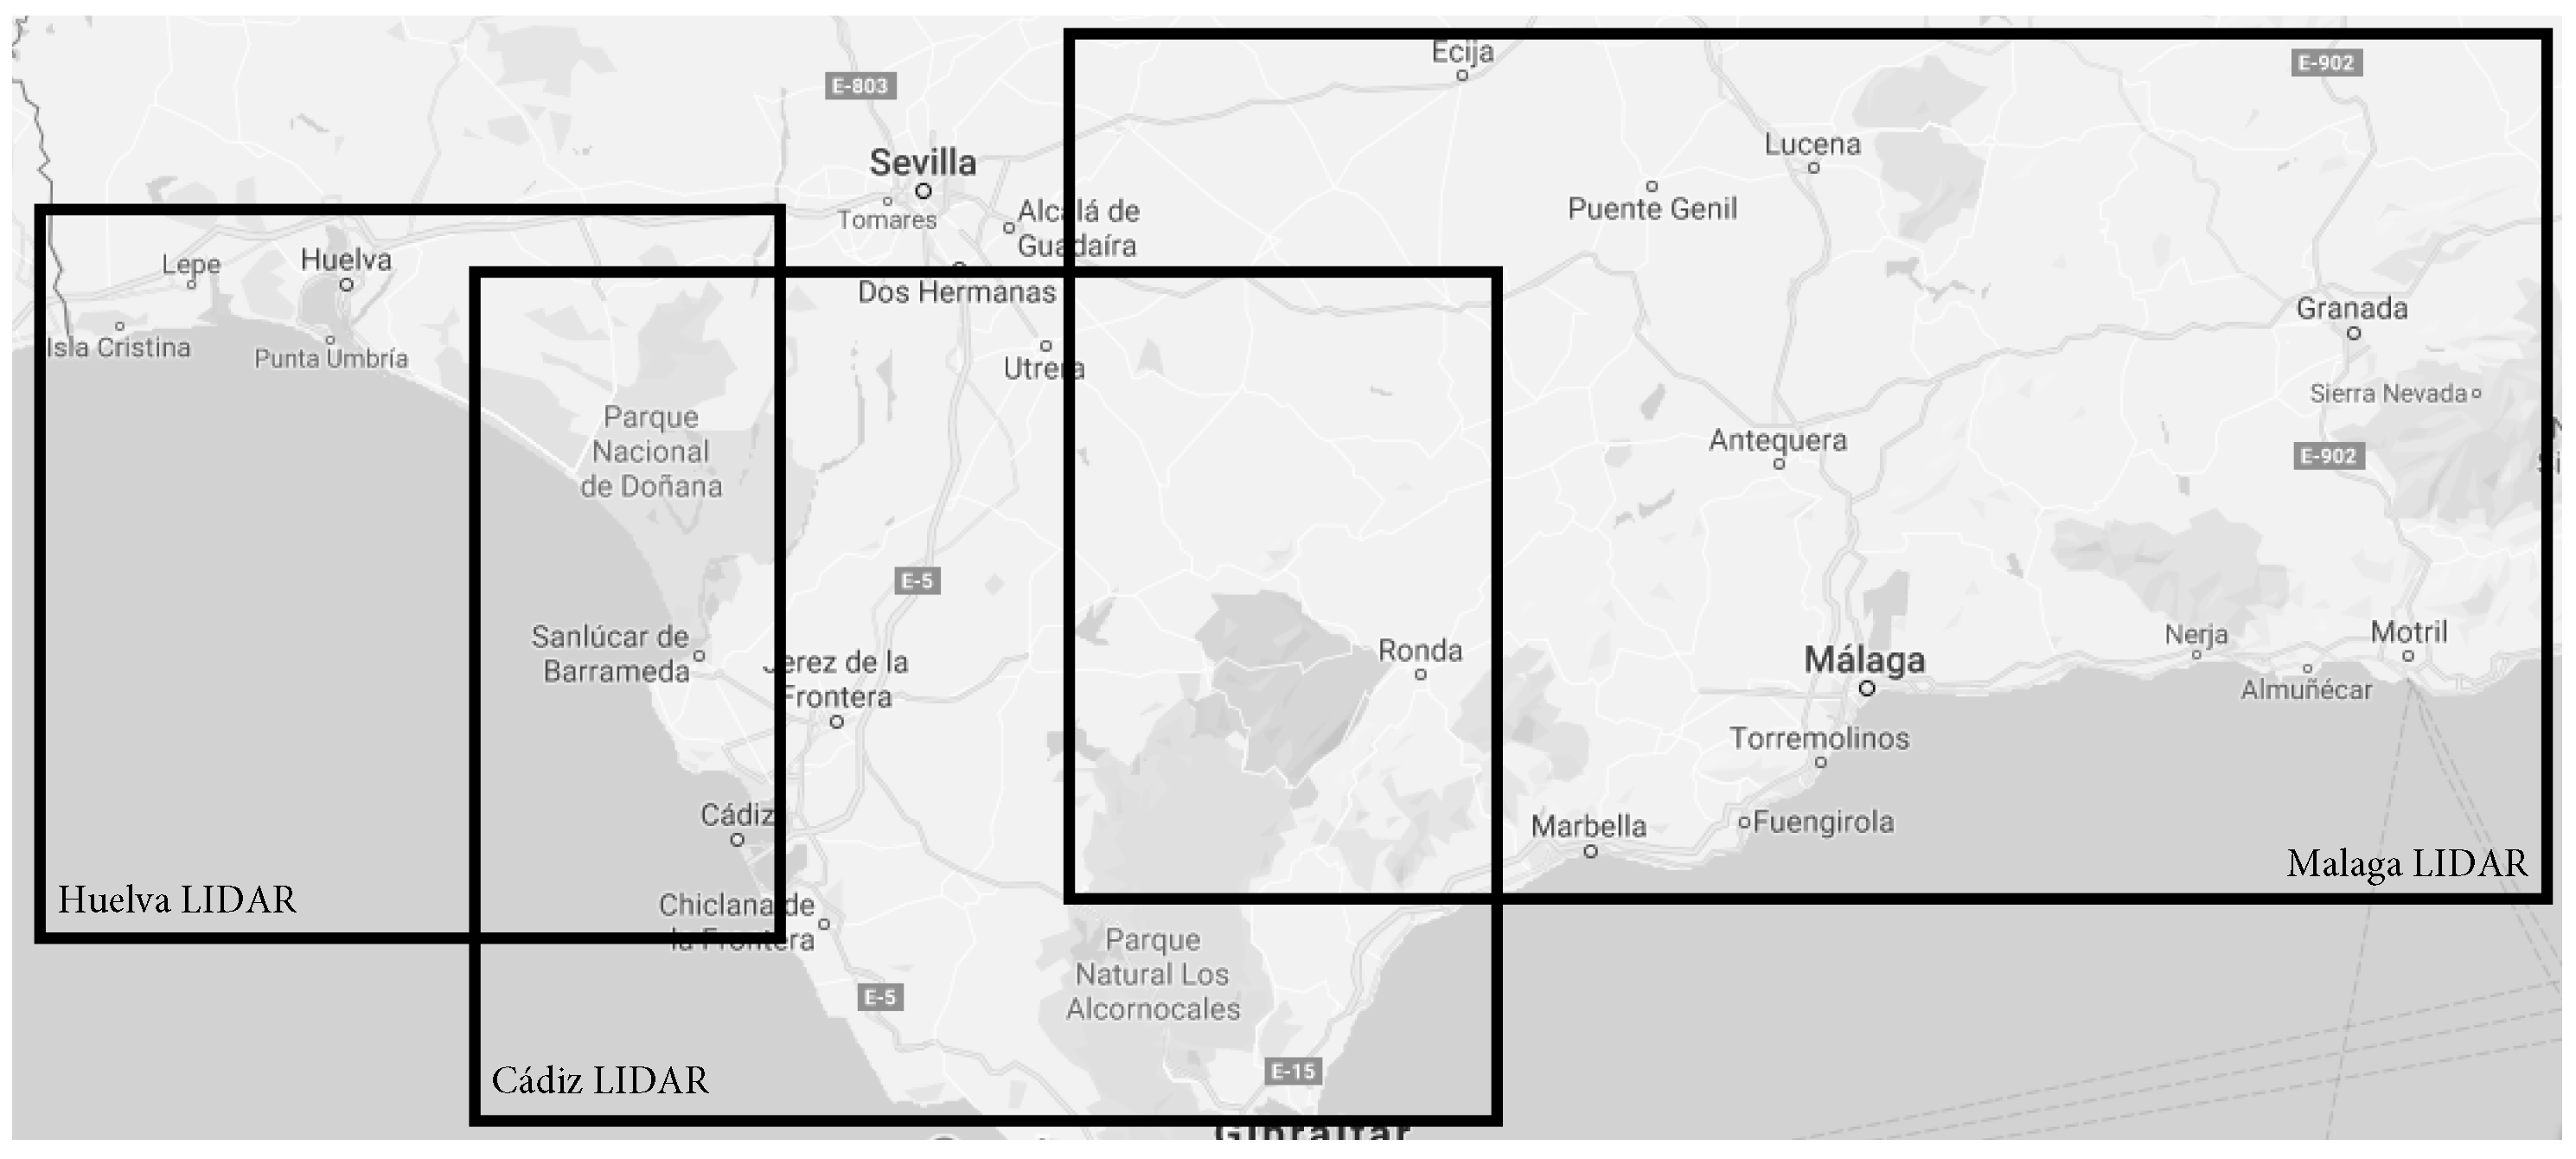
Figure 1 illustrates some of the problems of spatial fragmentation in a simplified way. It shows the coverage of LIDAR resources in the south of Spain from different providers (Provincial Councils of Málaga, Cádiz, and Huelva). They contain equivalent content, but there is no connection between them. In the current geospatial catalogues, a query covering all the south of Spain will return a list containing the three results (among others) because they partially cover the user needs. Then, the user will have to review manually the entire result list to identify the items that cover his needs. This may seem simple, but if there are hundreds of resources with similar issues, finding those that are related can be time-consuming. For example, a query about Laser Imaging (LIDAR) in the Spanish catalogue provides 305 results about themes such as land cover, forestry, water, or coast information, among others. They are presented without any order that could simplify the identification of those that are implicitly related.
The problem here is that the spatial needs of the user do not fit with the classic digital library-based organisation. Due to the spatial data fragmentation, a resource covering the user-required data may not even exist. In this context, to provide good search capabilities and to improve user satisfaction, we should evolve geospatial catalogues from IR systems for data producers dealing with self-contained metadata records with spatial properties to IR systems for data consumers dealing with continuous content layers. Hennig and Belgui [
51] and Masó et al. [
52] already highlighted the need to make user-centric SDIs instead of focusing on products or processes. Specifically, they describe the need to improve metadata descriptions in geospatial catalogues to focus on the user needs and to avoid the disconnection between data and metadata descriptions.
Applications such as Google Maps (
https://www.google.com/, accessed on 26 November 2021) or Open Street Map (
https://www.openstreetmap.org/, accessed on 26 November 2021) show that continuous layers of spatial information improve the user experience in some scenarios. They provide seamless layers of information for a few data types, such as cartography, roads, and commercial business, so that users can directly select/visualise/copy information in any part of the globe. This simplifies the search process, and, independently of the area requested, all the information is in a single resource with the same format and quality.
Defining such continuous layers is not currently viable. In addition to the huge cost of cleaning, harmonisation, and integration of existing data, the manual management and update of resources created by multiple providers with different interests would be extremely difficult. An alternative to this manual work would be the development of a process for the automatic identification of thematically-compatible resources so that they can be presented as a set in the result lists. The identifiable sets of thematically-related resources would not be continuous layers, but it could be the closest possible representation with the available metadata. In that form, it would be simpler for the user to get all the resources needed for answering his or her query. This idea comes from the concept of spatial dataset series. When a provider creates a spatial dataset series from a set of uniform and similar resources, the user can manage them as a single resource. The kind of sets we want to identify can be named as quasi-spatial dataset series because, as previously indicated, they are collections of spatial datasets with a close product specification that can help IR systems to provide results that are more compact.
The improved IR process for geospatial catalogues using these quasi-spatial dataset series is shown in
Figure 2. All algorithms and methods used in the search process of current geospatial catalogues return a ranked list of results. Our proposal is to identify the relations between the datasets (the quasi-spatial dataset series) and use them to cluster the result list in the query post-processing step. The task consists of grouping those resources in the result list that are part of the same quasi-spatial dataset series and placing them in the best ranked positions of the result set.
Table 1 shows how this organisational change improves the result list. Following the previous LIDAR example, the table shows a selected subset of the 305 results of a query with the LIDAR term submitted to the Spanish geospatial catalogue according to our definition of quasi-spatial dataset series. The results have been simplified for illustrative purposes to remark how a clustered list of results shows relations that would be hidden if the list were not organised. A few products occur several times in the result list for the same type of data in different areas, such as LIDAR points for administrative divisions, Photogrammetric-LIDAR for river basins, or digital elevation models of rivers and coasts. The shown groups have similarity in their titles, but, in many cases, this is not enough, as the description may show that their content is too different (e.g., Cloud of points of Cerro Muriano fire and Guadalete-Barbate river basin), or their titles may differ even if their description is similar. It is also important to note that the shown clusters are only partially compatible. They are from different years, and, if observed deeply, they may have different formats, resolution, or other incompatible technical aspects. However, from the user perspective, knowing easily which types of resources are available is a relevant improvement, as the integration part can be done by him on the final selected subset that fulfils his needs.
The identification of these quasi-spatial dataset series is not an easy task because available resources are not evenly distributed and have different characteristics. The descriptions in their metadata contain technical domain terminology, such as scales, resolutions, or formats; textual place names that complement numeric spatial bounding boxes; and various information about the multiple themes of the described data (e.g., agriculture, environment, pollution, or cadastre).
The literature has some works in this field. For instance, Lacasta et al. [
53] describe an IR process for geospatial data catalogues that focuses on solving this fragmentation problem by identifying the implicit spatial/thematic relations among query results. Their process focuses on finding resources spatially and thematically compatible with the user query and identifying their theme and spatial overlap. Result sets constructed this way fulfil user queries better than each resource individually (they cover a bigger part of the required area for the required keywords). However, the need to construct dynamically the aggregated result sets from each performed query and the complexity of selecting thematically compatible results complicate its application. Previously, Latre et al. [
54] proposed a process for the integration of hydrological data by merging the ontologies that represent their models. This process allows providing a unified view of fragmented data collections at the cost of creating complex ontologies that describe the data.
We think that clustering is a suitable approach for data aggregation tasks such as the one proposed in this paper. However, geospatial data have features that make this process difficult. Firstly, the resources must be aggregated by thematic similarity and not by other dimensions such as location, format, or resolution between others. Additionally, the number of sets and their dimensions may be heterogeneous, and many of the resources may not have any thematic relation with the rest (they are independent). Solving these issues is possible, but it requires processes adapted to the analysed data that may not be generalised to other collections. Due to these considerations, our objective has been to identify not only the best clustering solution but also the best between those without data preprocessing.
4. Evaluation Framework
To identify quasi-spatial dataset series in a geospatial catalogue, we cluster the textual information in the contained metadata records.
Figure 3 shows the details of this process. It performs the cleaning of the selected metadata properties, transforms them into features, and clusters them into quasi-spatial dataset series. For each step, we have compared different solutions used in the literature. The developed pipeline contains the classic processes to remove undesired elements that affect the results. However, since cleaning steps are specific to the processed data, we have also tested process configurations without any cleaning.
4.1. Property Selection
The initial step is the selection of the metadata properties to process.
We have decided to focus on the properties that act as title and abstract because they are the main metadata elements filled with free text in metadata records. The use of keyword elements, although they refer to concepts, is not a viable alternative because they contain just one or two words, whose TF-IDF or word-embeddings representation refer to general concepts and would probably generate big and heterogeneous clusters (there may be thousands of datasets classified as “land cover”). Given a metadata schema, the title property holds the distinguishing name of the resource and may convey a minimal summary of its contents, whereas the abstract property describes the contents of the resource in a more detailed way. In general, the more information available for a clustering technique, the better it can identify the similarity of resources. However, we do not want a clustering of maximum similarity, as we want to avoid clustering by location, scale, or other aspects described in the metadata records that are not the theme. In this context, adding more textual content may lead to incorrect aggregations (i.e., clusters of data about the same place but different theme). To assess the potential impact of this possibility, we have evaluated three scenarios: using only the title property as input of the clustering, using only the abstract property as input, and using both properties as input.
4.2. Cleaning
The selected text is tokenised into words (tokens), and tokens that may negatively affect the clustering results are removed. For this task, we have evaluated a set of basic normalisation and cleaning processes from the literature to increase the uniformity of tokens [
55]. Specifically, we have tested all possible combinations of the following cleaning processes: conversion to lowercase, removal of stop words, removal of place names, removal of text within parentheses, and reduction of word forms to stems. The removal of stop words and place names is performed thanks to the use of word lists. Regular expressions are used to remove text within parentheses. Finally, we use the Snowball algorithm for stemming [
56].
4.3. Feature Representation
The next step transforms the cleaned tokens of the metadata record into features that will be the input of the clustering algorithms. As feature representation, we have compared word embeddings, sentence embeddings, and the classic TF-IDF matrix representation as baseline.
TF-IDF feature representation is a document-term matrix where each position
contains the frequency of a term
t in a metadata record
d multiplied by the inverse document frequency of the term
t in the collection
D. From the different TF-IDF variants, we use the one shown in Equation (
1). It measures the relevance of a term contained in a document. The term frequency takes into account the number of occurrences of the term in the document, and the inverse document frequency depicts how rare and informative the term is in the collection to reduce the TF-IDF value of common terms. The term frequency of a term
t in a metadata record
d is the number of occurrences of the term
divided by the total number of terms in the metadata record (
). The inverse term frequency of a term
t in the collection is the logarithm of the number of metadata records in the collection (
N) divided by the number of metadata records containing
t in the collection (
).
Word embeddings represent words as a multidimensional vector space model in such a way that semantically similar/related words are represented as close points in that space. There are multiple implementations of word embeddings depending on the used neural network architecture and training data. We cannot use these word embeddings directly as we need to compare the similarity of complete sentences to determine if they are about the same theme. Therefore, we transform them into a sentence representation through summarisation. For this transformation, we have compared the use of the word-embeddings mean and word-embeddings weighted mean in each sentence as indicated in Arora et al. [
29]. Word-embeddings mean uses the mean of the different embeddings of each document as document representation. Word-embeddings weighted mean uses TF-IDF to adjust the weight of each embedding. The sentence representation of a metadata record (
d) using a word-embeddings mean (
) is computed as the sum of the word-embeddings representation of each different term in the metadata record (
) divided by the number of different terms in the metadata record (
) (see Equation (
2)). The weighted mean sentence representation objective (
) is to correct the difference in frequency of the words in the collection, so common terms weigh less in the mean than uncommon ones. It is calculated as in the previous equation but with multiplying the word-embeddings representation of each different term in the metadata records by the TF-IDF of such term in the collection (see Equation (
3)). We have also tested pure sentence embeddings as feature representation. These systems directly represent sentences as a multidimensional vector space model, avoiding the need of summarisation.
Specifically, we have tested the following embeddings generated with Spanish text collections (the language of our experiment data). As word embeddings, we have used: Word2Vec [
57], GLoVe [
24], FastText [
25] generated with the text collection proposed by Cardellino [
57], and ELMo multilingual embeddings [
58]. As sentence embeddings, we have used: Sentence BERT [
31] and Universal Sentence Encoder [
33].
4.4. Clustering
Given the federated nature of geospatial catalogues, they include data from national to local governments and organisations. Upper-level governments and organisations publish datasets covering large areas under their jurisdiction. These, in turn, are often subdivided into smaller units that also publish data covering areas under their jurisdiction. In many cases, but not always, datasets from smaller units can be aggregated to form a quasi-spatial dataset series. That is, they can be grouped in clusters. For example, it is possible to create an address gazetteer by hand for a specific purpose by aggregating addresses published by local governments. This is not the case of upper-level datasets, as they are whole sets. That is, they are one-element clusters. For example, national address gazetteers are datasets created by upper-level entities that bring together address information from all authorities from a country.
This characteristic is an issue for many of the classic clustering algorithms, as they usually are not able to identify one-element clusters. We have compared K-means [
59], DBSCAN [
60], OPTICS [
61], and agglomerative clustering. K-means, DBSCAN, and OPTICS are some of the most-used clustering techniques in the literature, but they have some drawbacks with one-element clusters. K-means generates one-element clusters, but it requires selecting the desired number of clusters manually, and finding it in each collection requires much experimentation. DBSCAN can generate them depending on the configuration, but their hyper-parameters are difficult to adjust. OPTICS is quite stable, but it is unable to generate one-element clusters. It assigns isolated elements to other clusters or marks them as spurious data. Finally, we have tested an agglomerative clustering process that directly allows the generation of one-element clusters. This process is a simplification of an agglomerative clustering algorithm [
62] that stops constructing the cluster tree when the similarity between all the elements of different clusters is less than a given threshold. It calculates the similarity between two metadata records using the cosine distance and aggregates the pair with the highest similarity value, that is, the dot product between the vector representations of the metadata records divided by the product of their norms. The process is repeated until the highest similarity found is less than the selected value.
In these clustering algorithms, the hyper-parameters related to the minimum cluster size have been selected to be the minimum possible to facilitate the identification of metadata records with no relations or small clusters. The values of the remaining parameters have been obtained through a value sweep done with the experiment data. The distance between samples in DBSCAN has been set to 1.05 for Euclidean distance and 0.09 for Cosine distance since other values increased the number of heterogeneous clusters or the division of uniform ones. Similarly, in the agglomerative solution, the selected similarity value to identify if two resources are in the same cluster has been set to 0.98. Bigger values divided too many uniform sets and lower ones created additional heterogeneous ones. The parametrisation has been done to compare the best configuration of the different algorithms, but our experiments have shown that the differences with the default configuration of the algorithms are not big, and they could have been directly used at a small performance cost.
4.5. Validation of Results
We have compared the results of each approach with respect to a manual classification of the experiment data done by a board of 5 experts in Spatial Data Infrastructures. The result quality measures used are the V-Measure score [
63] and the Adjusted-Mutual-Information (AMI) [
64]. V-Measure calculates the harmonic mean between homogeneity and completeness of the clusters. A cluster is homogeneous if it only contains members of a single class and complete if all the members of the class are in the cluster. Exact partitions are both homogeneous and complete, having a score of 1. With respect to AMI, it quantifies the mutual dependence between two sets of clusters according to the information they share. That is, it measures how one of the sets of clusters allows knowing about the other. The mutual information between two partitions is calculated as the sum of the probabilities that each collection resource has of belonging to any pair of clusters multiplied by the logarithm of the observed/expected ratio of belonging to the clusters. This metric is then adjusted to take values between 1 for complete similarity and 0 for complete dissimilarity. In both cases, we calculate the measures comparing the clusters generated in each experiment with respect to the clusters created in the manual classification.
5. Dataset Description
The National Spatial Data Infrastructure of Spain (IDEE) is the official body that coordinates the cooperation of Spatial Data Infrastructures launched by public administrations at national, regional, and local level. In 2021, it integrates the collaboration of the governments of 19 autonomous communities, 14 national agencies, and 39 city councils (
https://www.idee.es/resources/documentos/Responsables_nodos_IDE.pdf, accessed on 26 November 2021). Through the IDEE geoportal (name given to the portal of this type of infrastructure), it is possible to access thousands of resources (datasets and services) about a myriad of themes with coverage that range from the whole country to a municipality.
We have selected this collection because it contains a complete collection of the geospatial resources published in Spain. Specifically, this collection has been curated through a harvesting process that retrieves the contents of the catalogues running at the different SDI initiatives that belong to either national governmental offices or regional governments.
We downloaded 4824 metadata records describing these resources, but not all of them were suitable for the analysis in this paper. For comparison between the previously described processes, we have selected a subset of 630 metadata records describing datasets in this infrastructure. These records, compliant with the ISO 19115 geographic metadata standard [
2], contain descriptive textual information on a range of themes such as cadastre, environment, and infrastructures. They have been selected because they are all in Spanish (there are many other records using different Spanish official languages), and none of them is tagged as part of an explicit series. In this subset, many resources cover small areas about equivalent themes, but, since they have been created by different providers, they do not have any explicit relation in their metadata. That is, it contains many resource sets that can be organised as quasi-spatial dataset series, making it very appropriate for the comparison of algorithms trying to identify such series. Additionally, the size of the collection allows its manual analysis to provide a baseline for the results comparison.
Table 2 shows some relevant features of the title and abstract properties of the 630 metadata records used in the experiments. The mean words per field and the standard deviation show that most of the analysed text values are short. Although the longest abstract contains 712 words, the majority have less than 250 words, and a relevant set less than 10 words.
Figure 4 shows an example of an original metadata record in XML format and translated into English. As it is shown, it is usual that such descriptions contain thematic information about the nature or purpose of the data combined with other factors such as formats, spatial references, and other technical characteristics of the data. Many of the terms frequently occurring in these descriptions are common but have no relevance for the desired thematic aggregation, so they can cause the generation of undesired clusterings.
The performance of each experiment has been evaluated with respect to a manual classification performed by a board of experts that has identified 80 quasi-spatial dataset series. The biggest manual cluster contains 119 elements, and there are 111 metadata records with no relations. This classification was done in a two-step process. First, the metadata of the resources was manually reviewed and grouped by similarity in their description (their content is equivalent). Then, the data on each identified cluster has been visualised to determine how the contained resources are spatially distributed. The decision about the correctness of the identified sets has been done by consensus of the board of experts. We have identified that the main themes of the resources are related to nature protection (vegetation, soil erosion, floods, climate), agricultural activities (crops, cattle, forestry, hydrography, dams, irrigation), industry (distribution, pollution), and political organisation (administrative divisions, land uses). Some of the identified clusters are a collection of meteorological images from the LINDE satellite covering different Spanish municipalities, a compilation of pressures that produce the arrival of marine trash in each different Spanish sea demarcation, or a cluster with the areas of flood risk in rivers and coasts.
6. Experimental Results
This section compares the results of the different clustering techniques. Because of the number of experiments, we show the process configurations with the best performance for each different feature representation and clustering algorithm and the list of the ten best ones. Additionally, since one of our objectives was to identify if a general solution without data cleaning is viable, we also show the best results of such configurations.
Table 3 summarises the experiment configurations used and the acronyms shown in the result tables to indicate a specific configuration. In total, 5760 process configurations have been tested. They are all the possible combinations of the following elements: The “Data source” used in the experiments has been the title, abstract, or the title and abstract together. The “Cleaning” processes used are: deleting the text within parentheses (PT), converting all the text values to lowercase (CS), removal of stop words (SW), removal of places (P), and application of stemming (ST). These five cleaning processes generate 32 different cleaning combinations. As “Feature model”, we have used: Word2Vec, GloVe, and ELMo word embeddings aggregated using the Mean (M) and Weighted Mean (WM) and TF-IDF, Sentence BERT, and the Universal Sentence Encoder that directly provide sentence representations. Finally, the “Clustering” algorithms include: DBSCAN and OPTICS clustering computed with both the Cosine (Cos) and Euclidean (Eucl) distance, KMEANS, and agglomerative clustering (AG). In the case of K-Means, the number of clusters to create has been manually set to the number identified in the manual classification.
Table 4 shows the best configuration for each feature representation and clustering technique. The order column shows the experiment rank in terms of V-Measure result. The results have almost the same ordering with both measures and high similarity values. They show that it is possible to identify automatically quasi-spatial dataset series in the collection data with a high precision although, depending on the feature representation and clustering technique used, the quality of the results vary.
Whereas Word2Vec and GloVe with agglomerative clustering are the best solutions, classical TF-IDF representation and clustering solutions such as DBSCAN, OPTICS, or KMEANS perform worse in all the cases. It is not surprising that word-embeddings representation works better than TF-IDF because they are richer representations, but it is important to note how the pure sentence-embeddings solutions perform worse than word-embeddings summarisation. We think that the cause of this is the difference between the collections used for training the embeddings and the terminology used in the test collection. Since some geospatial terms are specialised and technical, they may not appear in the training data of the sentence-embeddings models used in the experiment. The agglomerative clustering results were as expected because it was explicitly designed to avoid forcing individual elements inside a cluster as the other techniques do. However, the execution time is much bigger than the other techniques. Using an i5-4590 processor, DBSCAN had a mean cost of 0.03 s, K-means of 0.16 s, OPTICS of 0.83 s, and the agglomerative clustering of 30.77 s. The agglomerative clustering has a cost three orders of magnitude higher than the fastest solution, which becomes a relevant issue with large metadata collections.
Additionally, it is important to note that, in most cases, the use of the titles of the metadata records is not relevant in terms of results. Their content tends to have a negative impact on the results. We think this is caused by the terminology they contain. Even if the descriptions are very different, titles tend to be similar with the same terms repeating in many resources. This causes small distortions in the generated clusters that worsen the obtained results. Finally, the cleaning steps show that stop words and place names are the elements in the metadata that affect, in a greater way, the clusters generated. This is also natural as they are common words in all the metadata records, so they affect the type of aggregation generated (e.g., clustering by place instead of by theme).
Table 5 shows the 10 best configurations without data cleaning. It can be observed that cleaning improves results, but the difference is small. The first eight configurations use a word-embeddings representation and an agglomerative clustering. The last two use DBSCAN with Euclidean distance. In this case, ELMO, FastText, and Word2Vec have similar results in both measures being small differences in the order. The fact that the two best ELMO results use mean embeddings (M) instead of weighted mean (WM) seems to indicate that word context in ELMO helps to correct the over-representation of common terms, which, in the rest of the techniques, is adjusted using the embeddings weighted mean. The last two results are a bit far from the rest in terms of performance, but they have the advantage of using a general clustering algorithm with a much lower execution time than the agglomerative one.
Finally,
Table 6 shows the 10 process configurations with the highest V-measure score among all the experiments performed. It can be observed how the use of Word2Vec of GloVe with agglomerative clustering always produces the best results independently of the other steps. Although the AMI score ordering is a bit different, the change in order is minimal.
7. Discussion
We have tested multiple clustering solutions on a manually tagged collection to determine if the desired quasi-spatial dataset series can be generated automatically. The results have shown multiple suitable configurations with similar performance.
We can state that the use of word-embeddings representation improves the generation of the desired quasi-spatial dataset series, with respect to classical TF-IDF, even when no data cleaning is performed. Similarly, sentence embeddings could be used for feature representation at a small loss of performance. The results obtained with word-embeddings and sentence-embeddings representations always outperform the equivalent TF-IDF representations. This shows that they express better the information contained in the metadata records. However, it is also necessary to be careful with these solutions as sentence embeddings have proven to be dependent on the training data, making difficult to determine how they would behave with other collections with different terminology.
With respect to the clustering, even though agglomerative clustering outperforms the rest of the analysed techniques and deals well with the problem of one-element clusters, its execution time may discourage its use for big collections. In those cases, DBSCAN is faster and has proven to have a close performance.
The proposed quasi-spatial dataset series generation presents some limitations that have to be taken into account in the obtained results. Firstly, the process is completely dependent on the metadata quality. It requires a complete description of the resources, so the similarity in the definitions can be calculated. This may seem obvious, but currently there are many geospatial metadata collections with short descriptions where the proposed process could not be applied. Secondly, due to the nature of the algorithms, even though the quality of the generated aggregations is good, it is not perfect. Therefore, the results have to be interpreted by the users to determine if they make sense or not. Finally, the current proposal does not provide any intra-clustering ordering of the results, since it is not able to identify the nature of the identified clusters. A cluster may contain resources distributed along the space containing similar content, focus on the same area but with different creation times, or both of them simultaneously. A solution for this problem needs to be studied in future work.
8. Conclusions
This paper has shown how spatial fragmentation in geospatial catalogues can cause ineffectiveness in “concept at location” searches. We have summarised existing IR problems and described the existing dissonance between the continuous nature of geospatial information and the digital library based structure of these metadata catalogues. To solve this problem, we have proposed the automatic identification of quasi-spatial dataset series to provide aggregated results that can be used to improve query result lists.
We have shown how current clustering techniques can be used to generate good quality quasi-spatial dataset series using, as baseline, a Spanish metadata collection manually tagged. The results show clearly that the use of word embeddings with agglomerative clustering is the best solution, but it can be replaced with DBSCAN if execution time is a relevant factor.
As future work, we want to extend the proposed approach towards the direction of providing a continuous layer solution. The identified quasi-spatial dataset series can be added to the corresponding catalogue IR system using a spatial metadata automation tool. In this way, they could be provided as query results that make it easier for users to find data that meet their needs. For this purpose, we plan to develop an enrichment pipeline that allows integrating the heterogeneous resources of a quasi-spatial dataset series into a single resource. This will be useful not only for improving search capabilities of geospatial catalogues but also for data analysis. For example, these integrated layers would make it possible to identify areas with no data about a theme or to find areas with better or worse data quality. An equivalent problem to spatial fragmentation is the temporal fragmentation of data. Given the bigger relevance of spatial aspects, we have only focused on spatial fragmentation, but we want to analyse the temporal management problem to determine if the same solutions proposed for spatial aspects can be applied. As part of this process, it would be necessary to analyse if additional metadata elements could be used and how to deal with multilingual catalogues. Another area of improvement is the identification of the nature of the clusters and presentation of the results. If the spatial or temporal relation present in each cluster can be identified, the content of each cluster can be presented in an ordered way that would simplify the task of analysing the content of the results.


 ,
, 


