
Implementation of Web Map Services for Old Cadastral Maps
by
 , , and
Alvaro Verdu-Candela
1,*,
Carmen Femenia-Ribera
1 ,
,
Gaspar Mora-Navarro
1 and
and
Rafael Sierra-Requena
2 1
Department of Cartographic Engineering, Geodesy and Photogrammetry, Universitat Politècnica de València, Camino de Vera s/n, 46022 Valencia, Spain
2
Spanish Directorate General for Cadastre, Management of Valencia, C/Roger de Lauria nº 26, 46002 Valencia, Spain
*
Author to whom correspondence should be addressed.
ISPRS Int. J. Geo-Inf. 2023, 12(10), 413; https://doi.org/10.3390/ijgi12100413
Submission received: 2 August 2023
/
Revised: 27 September 2023
/
Accepted: 6 October 2023
/
Published: 10 October 2023
Abstract
:It is widely accepted that old cadastral maps have multiple uses, such as reestablishing cadastral parcel boundaries, municipality boundaries, and coastal limits, or conducting historical, economic, and social studies. In Spain, the Directorate General for Cadastre, and the National Geographic Institute, has numerous digitized old maps that are accessible to users. In the Comunidad Valenciana, the georeferencing of certain series of old cadastral maps is being carried out in phases, which is one of the subjects of this study. A metric analysis of two series of old cadastral maps from a municipality was conducted. One of the series was georeferenced by the Valencia Provincial Cadastre Office, while the other was georeferenced in this research. Additionally, a spatial data infrastructure (SDI) was created, providing WMS, catalog, and document download services. Metadata were also published, containing information about the source, digitalization process, georeferencing, and achieved accuracy, following the ISO 19115 standard for geographic metadata. Furthermore, through individual and group interviews, participatory social research was conducted, to assess the use of old cadastral maps and the created SDI services, aiming to understand the users’ appreciation of the services. The results of the social research indicate that the SDI services created are highly valued, but certain conditions need to be met to ensure their effective use by the general public in order to avoid misuses and misinterpretations.
1. Introduction
Cadastral maps are generally an essential part of territory management, serving different purposes depending on their characteristics [1]. In Spain, cadastral data are primarily created for calculating taxes. Properties’ maps, uses, owners, and values are recorded. The main objective of Spanish cadastral cartography is fiscal, although it also delimits geographic elements such as settlements, buildings, urban furniture, place names, administrative boundaries [2], addresses, and public domain features (hydrography, transport infrastructure, protected areas). The purpose of including these additional cartographic elements is to provide context to the properties within their surroundings. Thanks to these cartographic elements, current cadastral maps are widely used as a source for many studies, including geomarketing [3,4], analysis of urban development [5,6] and optimizing access to urban facilities [7]. Many of these studies are made possible because cadastral maps allow for georeferencing other data through the national cadastral reference.
In Spain, the competent authority responsible for managing the cadastral maps of most Spanish territory is the Spanish Directorate General for Cadastre (DGC). Cadastral maps are freely available through the Electronic Office of Cadastre (EOC).
Old cadastral maps (OCMs) also have numerous applications, such as land use reconstruction [8,9], agricultural studies [10], mining [11], archaeological research [12], cadastral plot stakeout [13,14], and historical demographic and social studies [15,16].
OCMs are usually available in scanned format, but some studies may require them to be in vector format [17,18]. Aside from their applications, OCMs constitute a vast and fundamental asset, containing unique historical and geographical information [19].
“Old cadastral maps” is the most appropriate term to refer to historical cadastral maps [20,21]. However, in Spain, the term “antiguo”, old in English, is not commonly used in this context; instead, the Spanish cadastre refers to this cartography as “Cartografía Catastral Histórica”, which could be translated to English as historical cadastral cartography.
In general, cartography represents a necessary public investment as it enables the localization of phenomena in the territory, providing detailed information that improves decision-making [22]. Spatial data infrastructures (SDIs) were designed to facilitate cartographic data sharing [23]. SDIs offer various services, allowing users to discover available resources and obtain cartographic data, saving time and costs [24]. SDIs enable each organization to publish and maintain the data they are responsible for, avoiding unnecessary data copies or outdated data.
The web services provided by SDIs publish geographic information and follow communication protocols like HTTP, developed by the Open Geospatial Consortium [25]. Thanks to this standardization, SDIs’ data are accessible to users, external to the data-producing organizations, through the Internet. Evaluating the impact of SDIs on society is challenging, and various methodologies exist [26].
An important aspect of SDIs is that they facilitate understanding the characteristics of datasets, which are described in a standardized way using geographic metadata standards. The most commonly used standards for geographic metadata are ISO 19115 [27] and the Dublin Core standard [28]. These standards ensure that crucial dataset information is well-documented and readily available to users.
This article describes the techniques used for georeferencing two series of old cadastral maps (OCMs) and creating a spatial data infrastructure (SDI) to publish the results. The SDI also includes metadata regarding each map’s origin, georeferencing process, and external absolute accuracy. Additionally, it offers the option to download related alphanumerical and field survey information. To assess the usefulness of the OCM and the SDI services generated, qualitative social research methodologies, such as individual and group interviews, were employed. Social research methodologies are commonly used in cadastral studies [29]. The interviews were conducted with various user profiles, all of whom had professions related to cadastral cartography.
It is essential, to understand the obtained results, to know that the Spanish cadastral maps have been acquired over time using various techniques, resulting in varying qualities. In this research, two series of OCM were studied. The first series, topographical cadastral maps (TCMs), was obtained using geodetic and classical topographical techniques, when the National Geographic Institute (NGI) was responsible for the cadastral data. The acquisition period ranges from the early 20th century to 1986. The second series of maps is more recent, covering the period between 1986 and 2005. This series was produced utilizing photogrammetric restitution techniques, resulting in what is known as the “Renovation of Rústica” (REN) series. Both cartographic series delimit the existing fiscal properties from the mid-20th century onward.
The TCM series was georeferenced by the Valencia Provincial Cadastral Office before the commencement of this research and consists of a total of 31 sheets, each of which is a scanned map that contains cadastral parcels, usually grouped in only one cadastral polygon. In this case, a metric analysis was performed for all the maps in the series. Meanwhile, the REN series was georeferenced during this research, and a metric analysis was also conducted. The REN series comprises a total of 24 sheets. Each sheet in either series has been metadata tagged with the results of the metric analysis, and it is possible to download either the georeferenced version or the original version from the SDI. In this study, we completed specific metadata attributes proposed in ISO 19115 for each map. These attributes relate to the data quality, data origin, data acquisition process, and data accuracy. Describing the data quality is considered essential to determine the possible uses of the cartography [2,30,31,32,33]. Furthermore, two web map services (WMSs) of continuous cartography were created, one for each series, along with a geoportal. The WMS standard has been proven to be the most successful in enabling geographic information interoperability [34]. The geoportal enables straightforward visualization of the layers and the results of the metric analysis, making it more accessible to users who may not be experts in cartography and, therefore, not used to using specialized software [35,36,37].
1.1. Cadastre and Old Cadastral Maps in Spain
From the early 20th century to approximately the 1980s, the Spanish Government, through the NGI, used topographic surveys in the field to delimit countryside cadastral parcels, which were then represented in the maps of the TCM series. These maps, at scales of 1:2000 to 1:5000, were produced for entire municipalities and were inputted into the national geodetic network. The official delimitation of municipal boundaries and auxiliary geographical elements such as hydrography, roads, towns, and place names was captured from the National Topographic Map at a scale of 1:25,000. Parcels were drawn and labeled, then grouped into cadastral polygons, and cadastral polygons were represented on a single map. The maps were published in the town halls, allowing property owners to rectify the location and dimensions of their parcels in case of any errors.
Later, the TCM series was updated using photogrammetric techniques from 1986 to 2005, creating the REN series. In the REN series, the data from the TCM series were used as a basis for delimiting the boundaries of the parcels. Currently, the digitized files of the TCM and REN series can be downloaded from the EOC without being georeferenced.
The scanning of both series was carried out by personnel from the cadastre and private companies. The generated images were required to be compatible with the corporate application SIGCA, which is the current cadastral management program. SIGCA is a geographic information system based on ESRI and open-source GDAL libraries.
The requirements for scanning the maps were as follows:
- Raster bitmap images with binary values.
- Minimum resolution of 200 dots per inch, which translates to a pixel size of 0.254 meters at a scale of 1:2000.
- Image rotation according to the orientation of the geographic north indicated on the map itself.
- Image in TIFF format.
1.2. Aldaia’s Old Cadastral Maps
The following are the most relevant characteristics of the studied municipality, Aldaia (Valencia, Spain), and the available cadastral information. Aldaia is located to the west of the city of Valencia, within its metropolitan area (Figure 1). As of 2022, the municipality has a population of 32,656 inhabitants and covers an area of 16.1 square kilometers.
The main cadastral variables for countryside and urban areas in the municipality of Aldaia, according to the DGC [38], are as follows:
- Countryside data (2022): Year of renovation: 2003. Area: 1190.29 hectares. Number of parcels: 3044. Number of sub-parcels: 3337. Cadastral value (in thousands of euros): 45,357.59.
- Urban data (2022): Year of the last valuation: 2009. Urban parcels: 3493. Urban parcel area: 301.09 square meters. Real estate properties: 22,310. Cadastral value of buildings (in thousands of euros): 626,603.58. Cadastral value of urban land (in thousands of euros): 657,410.77. Total cadastral value (in thousands of euros): 1,284,014.35.
2. Material and Methods
2.1. Information Gathering
The Valencia Provincial Cadastre Office was contacted, and it provided the georeferenced TCM series and the non-georeferenced REN series. Contact was also made with the PHA of Valencia and the Aldaia municipality to gather more relevant documentation. The following information was obtained from the TCM series:
- Parcel owner cards: They are cards where the successive parcel owners were registered, together to a description of the changes suffered by the cadastral parcel: unions with other parcels, and divisions to obtain new parcels (Figure 3a).
- Polygon field sketches: Sketches where the survey points, owners, parcel numbers, and the survey base points were noted. These sketches were necessary to produce the topographic maps (Figure 3b).
- Parcel characteristics cards: They are documents where the following information was registered: municipality, cadastral polygon, cadastral parcel number, place name, area, sub-parcel letter, use, and owners. Sub-parcels are smaller parcels in which the cadastral parcels are divided, even currently, because they have different uses. Different uses have different values. Therefore, the parcel tax is calculated according to the function of the area and use of each sub-parcel.
- Survey field notebooks: They are the field notebooks where the surveyors noted survey observations: base point, point number, bearing, and distance. To obtain the bearings, a survey compass was used.
2.2. Georeferencing of the TCM and REN Series
The Valencia Provincial Cadastre Office has georeferenced the 8000 maps of the TCM series, all the TCM maps of the Valencian community. These maps cover an area of 826,789 hectares. Before georeferencing, a series of editing works were carried out on the digitized images using the open-source software GIMP. The following processes were applied:
- Delimitating the cadastral polygon by its boundary, removing unnecessary objects (like map title, annotations, and borders).
- Orientation to the drawn north on the map.
- Map union in the cases where the cadastral polygon was split into several sheets.
- Removal of scanning noise. Figure 4 shows an example.
The georeferencing process involved overlaying the scanned maps with old orthophotos, providing four corresponding points, and then applying a Helmert transformation without scale. A Helmert non-scaling transformation was chosen because the original maps are topographic scale maps. The goal was to apply a transformation that would not distort the maps. This approach preserves the areas as determined at the measurement time, which is one of Spain’s primary principles of cadastral cartography. Using other transformations, such as the projective transformation, would have resulted in the distortion of the original shape of the cadastral parcels, altering the surface areas, which is to be avoided. Additionally, no rotation was applied since the maps were already oriented to the north. Distortion or rotation of the maps and parcels could impact the historical value of the maps.
The relative precision of the maps in the TCM series is very high when considering small areas. This means that georeferencing with significant absolute positional accuracy can be achieved for each of these small areas, if a specific coordinate transformation is applied to each area. However, even with the best possible Helmert transformation for the entire map, in many cases, the expected absolute positional accuracy for the map’s scale is not achieved. This is because these maps were produced through topographic surveys, using analog instruments, and were supported into coordinate networks, based on a national geodetic network, determined at that time using astronomical methods.
The REN series is currently undergoing the process of georeferencing by the DGC.
For the municipality of Aldaia, the maps of the REN series, totaling 24 maps, have yet to be georeferenced. To determine the best georeferencing method, an initial attempt was made using the georeferencing tool included in QGIS, which utilizes control points. However, this method yielded poor precision, likely due to the local deformations present in these old maps. As a result, a manual method was chosen, employing the Raster Georeferencer QGIS plugin. This manual approach allowed the map image to be adjusted as a whole, aligning it to the limits of the cadastral polygons, resulting in an overall better fit and improved accuracy.
2.3. Georeferencing Accuracy Assessment
A manual analysis of the quality of the georeferenced series was conducted. An auxiliary grid of approximately 200-meter intervals was employed. Recognizable points were chosen on the old maps as uniformly as possible. Then, a vector line layer was used to record the displacements observed between the old map features and an orthophoto. Two orthophotos were used as a reference, the current one and a historical orthophoto of 1956, depending on whether the corresponding elements remained or were visible (Figure 5).
Once the vector displacements were drawn, it was possible to calculate the accuracy of each georeferenced map. Table 2 shows the average errors and the standard deviations obtained, considering all displacement vectors, in all maps, in each map series. They are the absolute external positional accuracy achieved in each series.
We present a continuous map of the errors obtained from each series (Figure 6). The map exhibits consistent accuracy, except in four small-sized areas, where the displacements can be considered anomalous. The potential sources of these elevated errors may be attributed to errors introduced during the surveying of the maps, which may be due to gross errors in the reference points in the area, but a more comprehensive investigation would be necessary to ascertain the origin of these anomalous differences.
The average standard deviation obtained was approximately 3 meters. Considering that the survey and the reference map scales are 1:5000, which implies a minimum expected error of 1 meter, we believe the obtained error to be quite satisfactory. The most significant average error in both series was in the Y coordinate of TCM (Table 2), at 1.26 m, which was also in the range of the expected.
Normality tests (chi-square) were conducted on displacement vectors’ X and Y components to detect any potential lack of randomness and possible systematic patterns. Before conducting these tests, anomalous values in both series were spatially identified and removed from the two darkest areas in Figure 6, as they could be considered outliers and may have distorted the fitting results. In the case of the TCM series, eight data points were removed, and six data points were eliminated for the REN series. The results of the fitting and normality tests are detailed in Table 3.
It was observed that for both series, after the outlier filtering, the mean deviations fell within the range of ±1 meters. The chi-square test was conducted with a p-value of 0.05, concluding that all components except the Y component of the REN series conformed to a normal distribution with a 95% confidence level. For the Y component that did not pass the test, additional normality tests were performed (Shapiro–Wilk, W-statistic, Z-values for skewness and kurtosis), and in all these cases, the normality of the data could be confirmed with a 95% confidence level as the resulting p-values were 0.629, 0.581, and 0.697, respectively. It was possible to conclude that the displacements were randomly distributed around the average.
Considering all the displacement observations, the obtained accuracy enables using this cartography in studies covering large areas. For instance, it can be utilized for locating lost properties, identifying place names, landmarks, and areas with imprecise boundaries, such as wetlands and forests, and for historical studies on demographics, economics, or land use, as mentioned in the introduction. Socioeconomic studies are made feasible because georeferenced cartographic series are also associated with a significant amount of alphanumeric data, which is automatically georeferenced.
For topographic purposes involving boundary demarcation, where the highest achievable precision is required, it is advisable not to use the general georeferencing approach but instead perform a specific georeferencing for the working area. This entails identifying 4–5 homologous points, near and surrounding the area, and conducting a least-squares adjustment to minimize errors in local georeferencing. The standard deviations obtained in the adjustment represent the precision with which lost boundaries are re-established, as the accuracy of current topographic equipment, typically ranging from 1 to 5 cm, is generally negligible compared to the errors in georeferencing the old map, even in small areas [14]. However, georeferencing of small areas is only applicable when studying such areas, and it requires specialized technical knowledge, typically within the purview of surveyors.
2.4. SDI Metadata Management: GeoNetwork
To facilitate access to the georeferenced maps and their metadata, an SDI was implemented. For economic reasons, only open-source software was used in this project. Most SDI services can be obtained with only two programs: GeoNetwork (catalog and metadata) and GeoServer (WMS, WMTS, WFS, WFS-T, WCS). Both programs belong to a kind of software called servlets, coded in Java. Servlets can be executed with the software Apache Tomcat. The Apache 2 HTTP server was used as the central HTTP server, using the URL proxy technique to internally redirect HTTP/HTTPS requests to the Apache Tomcat service. Apache 2 proxies allow access to GeoNetwork, GeoServer, and MapStore using URLs (Figure 7). MapStore is a geoportal generator that can also be installed as a servlet in Apache Tomcat. MapStore allows the easy generation of geoportals, with standard tools, by accessing SDI services.
Essential services of an SDI are the catalog and metadata service, as they are the primary pages users will use [42]. The catalog service allows discovering what resources exist in the SDI and its metadata. We used in our SDI the GeoNetwork servlet [43]. GeoNetwork is an internationally recognized platform based on the Open Geospatial Consortium protocols [43,44], and manages vectorial and raster spatial files and their metadata [45]. GeonetWork is usually used to store and publish the metadata of GeoServer layers [46]. The metadata can be managed according to different standards. In this research, the ISO 19115 was chosen.
The ISO 19115 standard defines how to create geographical metadata. This standard includes an element for describing the quality of cartography, known as DQ_DataQuality. The DQ_DataQuality element is an aggregate of the LI_Lineage and DQ_Element elements. The LI_Lineage element allows for the description of the data origin and the steps involved in the data acquisition process. The second element, DQ_Element, enables the description of data quality aspects, such as absolute external accuracy. This project’s DQ_DataQuality element was completed with particular attention to detail. The introduced metadata included:
- Map and series identifiers.
- Date of creation.
- Description.
- Positional accuracy: X, Y standard deviations.
- URLs to resources (original map, georeferenced map, displacement points layer, landowner data sheets, map sketches, field notes, characteristics cards).
- Raster and geographic information (number of pixels, boundaries, ground sampling distance, scale, and reference system).
- Lineage.
- Contact information of the responsible parties.
- Metadata standard.
- INSPIRE keywords.
- Usage restrictions.
Due to the significant number of individual layers included in this project, a semiautomatic approach was used to create and upload all metadata records to GeoNetwork by taking advantage of the standardized naming of the layers. A script in Python generated an XML file for each layer, modifying a template with the corresponding information. The Supplementary Materials contain all the scripts used in this research. This included layer identification (title, descriptions, and codes), georeferencing accuracy, size, resolution, and viewing and download links. Afterward, all XML files were batch imported into GeoNetwork. Figure 8 shows the available files to download for one map. Each georeferenced file has its corresponding standard metadata.
2.5. SDI Web Map Services Implementation: Geoserver
WMS is currently supported for the most used geographic information systems and by specialized JavaScript libraries, such as OpenLayers or Leaflet. Styled Layer Definition (SLD), another OGC standard, is available to style the WMS layer. SLD allows users to configure the desired symbology for the layers served through the WMS protocol as raster images.
A particular type of software, a map server, is needed to receive HTTP requests, meeting the OGC standard protocols (WMS, WMTS), generate raster images from the source geographical data, and send them over the Internet. MapServer and GeoServer are the most used open-source map servers [47]. GeoServer meets the OGC standards [48,49]. It has the advantage over MapServer that it has a useful web administration site that allows users to add SDI services and configure them through a web browser [50]. For this reason, the map server GeoServer was chosen to set up the SDI of this research.
Within GeoServer, the geographical data can be read in several formats, either vectorial or raster. The data sources are organized in Data Storages. Each Data Storage can serve multiple Layers, which can be combined into Layer Groups. These Groups behave the same way as “simple” layers would, when served through WMS. GeoServer also provides a REST API, accessible via HTTP requests.
Ultimately, the goal is to serve each map series as one layer containing the metadata information, too. To achieve that, some tools and extensions from GeoServer were used. On the one hand, the Importer extension facilitates the inclusion of multiple data sources at once into GeoServer. Each map series has been imported in different batch imports using that method.
Afterward, one layer group must be defined for each series, to combine every individual raster into only one layer. Manually defining the groups would have been time-consuming, so a different approach was taken. In this case, a simple script written in Python sends the corresponding POST requests to the GeoServer REST API. This method is easily scalable in case of dealing with large datasets.
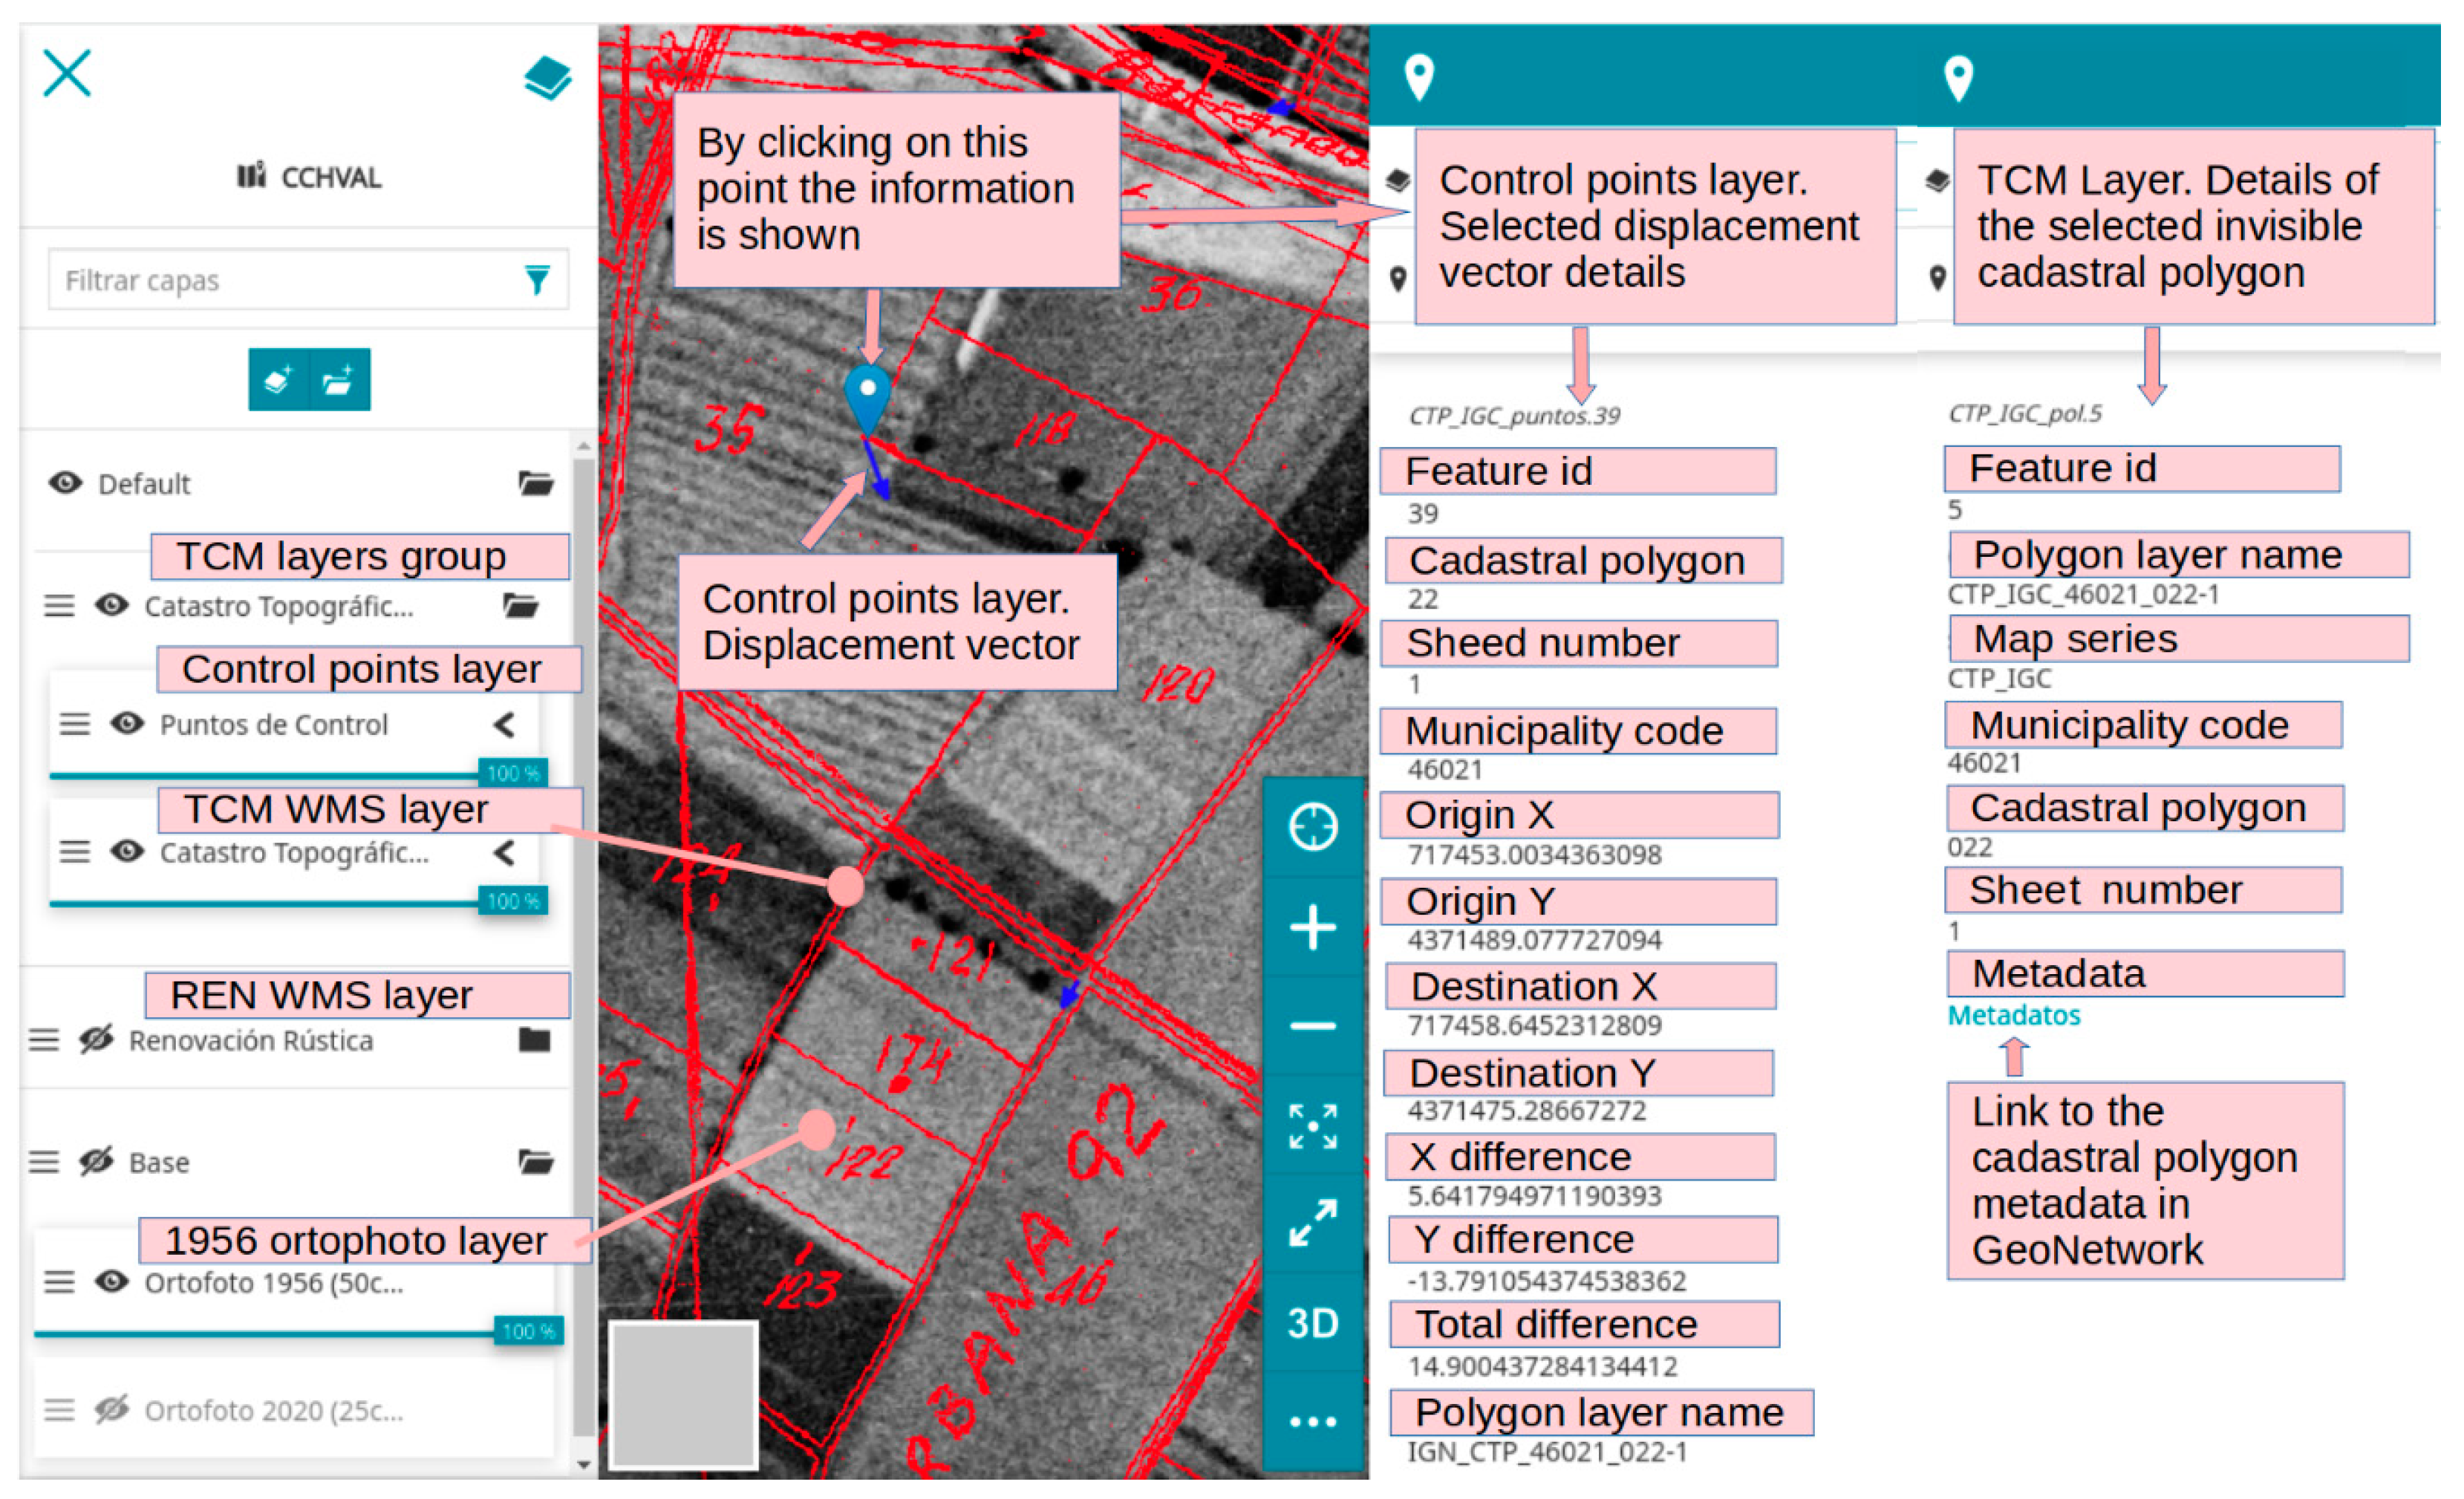
In every layer group, corresponding with each series, an invisible polygon layer was also added. These polygons provide the link to the GeoNetwork metadata page of each old cadastral polygon in their attributes. By adding this invisible vector layer to the WMS raster layer group of a map series, it is possible to obtain the attribute information of the vector layer, on requesting information on the raster layer. Figure 9 shows the attributes of the invisible old cadastral polygon that the clicked point is within. You can see that the attributes include the link to the polygon metadata. We must remark that the goal of this layer is important: to facilitate the user’s access to the GeoNetwork metadata and download page of the OCM.
Determining the boundaries of each old cadastral polygon is not trivial, even if you try to automate the process of extracting the perimeters from the raster. In addition, it is common to divide the cadastral polygons to fit in one sheet when they are too large. In these cases, the cadastral polygon is split in two parts and put together in the same sheet, however they fit best (Figure 2 presents an example). Therefore, it is also necessary to account for these situations, resulting in two georeferenced images for one map.
The adopted solution consists of five steps. In the first step, the map frame is removed by applying a simple white mask that removes it. This mask has fixed dimensions, as all maps of a certain series have approximately the same size (Figure 10a).
The second step is the most important one, and it is executed using the Model Builder feature of QGIS. The process is based on the vectorization of the pixels in the georeferenced raster, which, after rescaling for faster processing, are converted to point features (Figure 10b).
Step three applies a buffer to those point features, resulting in a single polygon feature for each set of points where the distance between them is smaller than a set value (Figure 11a). Step four removes all holes (Figure 11b).
The final step consists of cleaning the resulting polygons, applying a series of negative and positive buffers, and selecting the perimeter of the largest one (Figure 12).
A semiautomatic process was applied, where results inspection and manual editing are required, but the approach is considerably faster than manual digitizing.
To display the results in an online map viewer, the open-source package MapStore was chosen, as it provides a ready-to-use and quite complete set of tools. This includes adding layers from various OGC services, controlling their position and properties, making GetFeatureInfo requests, controlling user access and permissions, and creating separate maps with different layers, among others. The chosen raster symbology for the cadastral maps consists of a transparent background and red lines, so the layer has good visibility either on color or black and white backgrounds (Figure 7).
2.6. Qualitative Social Research about the Use of Old Cadastral Maps and SDI Services: Interviews and Focus Group
Qualitative social research methods were applied in this study to assess the usefulness of the created SDI and propose improvements. For this purpose, semi-structured interviews and focus group techniques were utilized. These techniques have been used in various studies related to territorial administration: data collection [51,52,53], assessing the use of different technologies [54], understanding needs and reviewing proposed models [55], and examining the effectiveness of territorial administration systems in post-conflict areas [56].
For the interviews and focus group sessions, various profiles of people using OCM were involved, both at the technical and specialized user levels. Participants included personnel from the DGC, local administration, professional collectives, historical archives, and the legal field.
Considering the research objective and the target population for the interviews, an appropriate number of interviews was between five and ten. Regarding focus group research, the number of participants should range from four to eight individuals. For the interviews, it was essential to sample interviewees from various fields and organizations, ensuring those were are all adequately represented. Information saturation was also considered in this case, whereafter conducting additional interviews was unnecessary. As for the focus group, it was a discussion group we sought to convene, and we wanted to ensure there were enough attendees. A meeting was scheduled with invitations extended to seven people, of whom five attended. The interviews and focus group discussions took place during May and June 2022. The focus group discussion involved five technical specialists in cartography. The participants in all sessions included six women and seven men.
Eight individuals who frequently use old cadastral maps were interviewed. Three belong to the DGC, two are technical specialists with different qualifications, and one works in public service. Additionally, interviews were conducted with a technician from the local administration, a person from the PHA of Valencia, a representative from the NGI, a property registrar, and a lawyer who is specialized in geospatial information. In total, there were six women and two men among the interviewees.
The interviews were conducted through video conferencing and in person, with an approximate duration of 1 h each. At the beginning of each interview, the objective was stated, and personal data were collected, with the session being recorded and the interviewee being informed about the recording. Part of the information about the case study was presented at the start, including examples of the two series of maps and associated cards. The geoportal created with MapStore was also shown, and its intended purpose was explained. Following this, open-ended questions related to the usefulness and usage of the old cadastral maps were asked. Questions were posed regarding the access method and the utility of having a WMS web service with digitized and georeferenced OCM. Participants were also asked about the structure and organization of the project. Their opinions were sought on whether this cartography should be freely accessible and readily available, as well as their feedback on the presented metadata and suggestions for improvement. The need for historical information, such as field notebooks, characteristic sheets, and owner records, was also discussed.
In all cases, it was considered that having this georeferenced cartography can be of great utility. While all interviewees agreed that professionals such as technicians, surveyors, or architects would benefit the most, other potential uses were mentioned, including heritage research, determining historic boundaries for the Land Registry, resolving disputes, historical research, or boundary recovery.
All interviewed users agreed on the importance of offering this service to the public free of charge, as it indirectly benefits society. However, they raised concerns about the potential misuse of the information if it is provided openly. To address this, it is considered essential to inform the public about the origin of the data and its accuracy, i.e., the metadata. The objective is to prevent misinterpretations resulting from the original cartography’s inaccuracies and its georeferencing. Despite these potential issues, users believe making this information available to the public is worthwhile.
Other possible improvements proposed by the interviewees include adding a function for printing or exporting to PDF, incorporating more historical orthophotos, and including ownership data at the parcel level. However, it is considered that including urban cadastral cartography will not be helpful since urban cadastral cartography was based on sketches without any estimable accuracy.
Following the interviews, a focus group discussion was designed with five users and two interviewers. All interviewed users have qualifications related to geomatics and surveying, three of them are self-employed professionals, one is a technician in the local administration, and another is a manager in a professional collective. All five participants are male. The focus group was conducted through a video conference with an approximate duration of 1 h and 45 min.
During the session, the objective of the focus group was presented, a brief introduction of the participants was given, and those present were informed that the session was being recorded. Similar questions as those in the individual interviews were asked but in a much more open-ended manner to encourage discussion. The following aspects were highlighted from the results of the discussion:
- From the beginning of the session, all participants generally emphasized the need to comply with data protection laws when publishing the information and the legal issues that may arise in this regard.
- It was suggested that a user profile system with different levels of access should be implemented to access the information, so that different types of users can access different information.
- It was proposed that the OCM should be available for free, or with the option of paying a minimal fee, clearly detailing the conditions of use. The interviewees agreed that charging a small fee may have a positive impact, as it could encourage users to value the service and information provided.
- Concerns were raised about providing georeferenced information freely and publicly, as it could be risky in the hands of non-experts and may lead to misuse of the cartography.
- The consequences of improper use of maps by non-experts were discussed.
- The georeferencing of the remaining OCMs of the rest of Spain is considered highly useful. However, the debate was once again related to the previous points.
- Interviewees suggested limiting the scale of visualization, imposing a maximum level of zoom on the viewing platform, and reminding users of the conditions of use with each download.
- To facilitate proper use, it is essential to evaluate the official status of the georeferencing and its positional accuracy.
- The metadata information is considered very useful.
- Regarding the urban OCMs, which are not yet available, the same approach as with the rural cartography was proposed. However, there was a consensus that there are fewer requests for urban OCMs than for countryside OCMs. Approximately 95% of requests in the professional community are for countryside OCMs.
- They mention that, in the case of urban OCMs, it could be useful to have information about the old construction sketches, known as CU-1 (abbreviation for “croquis de urbana”, urban sketches). These documents may include a general plan of the parcel, photographs of the facade, and detailed floor plans of the building(s) (Figure 13). While all of them referred to CU-1, it should be noted that currently, CU-1 is referred to as CC (abbreviation for “croquis catastral”, cadastral sketch) [57]. These sketches can be useful for obtaining information about courtyards, for example.
- Regarding the ease of obtaining information, in general, the interviewees agreed that it is becoming easier to access information if it is in the EOC. However, if the information is not available in the EOC, access depends a lot on the specific situation of each PHA.
- They all agreed that any progress in historical cadastral cartography is positive.
After analyzing the information and synthesizing the most relevant aspects, a report was prepared and emailed to the original group. The purpose was to allow the interviewees to review the ideas and conclusions drawn and provide any necessary clarifications or additional input.
Table 4 presents a summary of the main results of the social research.
3. Discussion
The findings of this research are as follows.
Georeferencing old cadastral maps is difficult to fully automate. While a significant portion of the process has been automated, human supervision is still required.
In the case of TCMs, the results of the metric analysis showed that, while the relative precision of the maps in small areas matched expectations for maps at scales of 1/2000–5000, the overall metric analysis of the complete maps yielded lower general precision, with standard deviations of 2.6 m and 3.5 m in X and Y, respectively.
For the REN series, slightly better precisions were achieved: 2.5 m and 2.3 m of standard deviation in X and Y, respectively.
In many research studies, it has been proposed that georeferenced OCMs are of utmost importance. Furthermore, other studies also emphasized that describing data quality is essential for determining the various applications of cartography. On the other hand, SDIs have been designed to facilitate the exchange of cartographic data, thus saving time and money. Consequently, providing this information through an SDI enables efficient access to OCMs, making the maps available to external users beyond the producing organizations. Additionally, SDIs help in compliance with the Spanish policy of open data and the reuse of public sector information.
The obtained accuracy enables the use of this cartography in historical socioeconomic studies. In this case, researchers will find the SDI services and the geoportal useful, where there are continuous layers of georeferenced maps, with the historical alphanumerical information already linked with its metadata, everything accessible online. For these users, the SDI will save displacements to historical archives and georeferencing the old maps. To demarcate lost boundaries, a local transformation should be applied to obtain the maximum georeferencing accuracy locally.
GeoNetwork was used to publish the files’ original map, georeferenced map, owners’ cards, field sketches, field notebooks, and the results of the metric analysis. Following a file-naming convention, the publication process was largely automated thanks to the available HTTP REST APIs in GeoServer and GeoNetwork. It was demonstrated that while human supervision is needed, a significant portion of the georeferencing, metadata, and publication processes can be automated in an SDI.
Exclusively open-source software was used and proven to be flexible, reliable, and robust. Thanks to the exhaustive documentation it has, and the examples that it is possible to find on the web of its community, it was easy to install, use, and automate processes.
Additionally, participatory social research was conducted on the old cadastral map, its utility, the need for conservation, the advantages and disadvantages of its free publication, and the services of the SDI created in this research. This technique is commonly used in cadastral studies. The research involved a small number of individuals who have regular contact with cadastral cartography and the needs of the general public. The conclusions were as follows.
It was emphasized that the conservation of cadastral cartography and its associated data is important because it serves numerous purposes, particularly when the cartography is georeferenced.
As public servants responsible for offering the publication service, they recognized that the release of this georeferenced cadastral information may lead to problems due to potential misuse. Therefore, they recommended implementing different levels of access, providing clear information about the data quality and limitations, and requiring users to accept various disclaimers before allowing data downloads.
Specific measures need to be taken before making the SDI services public. For this reason, the access to the SDI services is currently limited to internal use, available only to the DGC users. The main objective of this SDI, and the qualitative social research, is to demonstrate that these services have sufficient public utility to justify the necessary investment in creating similar SDI services at the national level. The SDI services have been presented to various officials of the DGC, and the implementation has been well received. Currently, efforts are underway to secure resources for an official implementation, similar to the one carried out in this project.
Supplementary Materials
Additional supporting information can be downloaded at: https://github.com/joamona/cchval (accessed on 1 August 2023).
Author Contributions
Conceptualization, Carmen Femenia-Ribera and Rafael Sierra-Requena; methodology, Alvaro Verdu-Candela, Gaspar Mora-Navarro, Carmen Femenia-Ribera and Rafael Sierra-Requena; software, Alvaro Verdu-Candela and Gaspar Mora-Navarro; validation, Alvaro Verdu-Candela, Gaspar Mora-Navarro, Carmen Femenia-Ribera and Rafael Sierra-Requena; investigation, Alvaro Verdu-Candela and Carmen Femenia-Ribera; resources, Carmen Femenia-Ribera and Rafael Sierra-Requena; data curation, Alvaro Verdu-Candela; writing—original draft preparation, Alvaro Verdu-Candela, Gaspar Mora-Navarro, Carmen Femenia-Ribera and Rafael Sierra-Requena; writing—review and editing, Alvaro Verdu-Candela, Gaspar Mora-Navarro, Carmen Femenia-Ribera and Rafael Sierra-Requena; funding acquisition, Carmen Femenia-Ribera and Rafael Sierra-Requena. All authors have read and agreed to the published version of the manuscript.
Funding
This work was partially funded by a collaboration grant for students of the Department of Cartographic Engineering, Geodesy and Photogrammetry, Universitat Politècnica de València, and financed by the Spanish Ministry of Education and Professional Training.
Data Availability Statement
The data presented in this study are available on request from the corresponding author.
Acknowledgments
We would like to express our gratitude for the collaboration of the Directorate General for Cadastre of Spain, and especially the Valencia Provincial Cadastre Office. We also want to extend our appreciation for the support provided by the Provincial Historical Archive of Valencia (Arxiu del Regne de València) and the Aldaia City Council. In particular, we are deeply thankful for the cooperation of the individuals who generously volunteered to participate in the interviews and group meetings, including: Victoria Andrés Gonzalez-Mora, Isabel Marqués Martín-Sacristán, Amparo Contri Sempere, Paula Chust Mares, Trinidad Cervera Linares, Antonio García Benlloch, Juan Pablo Navarro Batet, Eva Soler, Jesús Plá, Efrén Diaz, Ramón Iborra, Pau Acosta, and Antonio Blanco.
Conflicts of Interest
The authors declare no conflict of interest.
References
- Williamson, I.; Enemark, S. Understanding Cadastral Maps. Aust. Surv. 1996, 41, 38–52. [Google Scholar] [CrossRef]
- Femenia-Ribera, C.; Benítez-Aguado, E.; Mora-Navarro, G.; Martinez-Llario, J. Method of Recovering Municipal Boundary Lines in Province of Valencia (Spain) by Means of Historical Cadastral Maps. Surv. Rev. 2013, 46, 255–266. [Google Scholar] [CrossRef]
- Dušek, R.; Štumpf, P.; Vojtko, V. Geomarketing—Tool for Consumer Spending Estimation in the Czech Tourism & Hospitality Market. Glob. Bus. Financ. Rev. 2019, 24, 14–26. [Google Scholar] [CrossRef]
- Roig-Tierno, N.; Baviera-Puig, A.; Buitrago-Vera, J. Business Opportunities Analysis Using GIS: The Retail Distribution Sector. Glob. Bus. Perspect. 2013, 1, 226–238. [Google Scholar] [CrossRef]
- Khalaj, M.; Lashkari, E. Multipurpose Cadastre, Essential for Urban Development Plans in Iran. World Acad. Sci. Eng. Technol. Int. J. Humanit. Soc. Sci. 2010, 4, 486–490. [Google Scholar] [CrossRef]
- Sánchez Ondoño, I.; Cebrián Abellán, F.; Garcia-Gonzalez, J.A. The Cadastre as a Source for the Analysis of Urbanization Dynamics. Applications in Urban Areas of Medium-Sized Inland Spanish Cities. Land 2021, 10, 374. [Google Scholar] [CrossRef]
- Biba, S.; Curtin, K.M.; Manca, G. A New Method for Determining the Population with Walking Access to Transit. Int. J. Geogr. Inf. Sci. 2010, 24, 347–364. [Google Scholar] [CrossRef]
- Forejt, M.; Dolejš, M.; Raška, P. How Reliable Is My Historical Land-Use Reconstruction? Assessing Uncertainties in Old Cadastral Maps. Ecol. Indic. 2018, 94, 237–245. [Google Scholar] [CrossRef]
- Fuchs, R.; Verburg, P.H.; Clevers, J.G.P.W.; Herold, M. The Potential of Old Maps and Encyclopaedias for Reconstructing Historic European Land Cover/Use Change. Appl. Geogr. 2015, 59, 43–55. [Google Scholar] [CrossRef]
- Moya Muñoz, J.; Atanasio Guisado, A. Historical Cartography and Orthophotography in the Analysis of the Transformation of Ecija’s Olive Grove Landscapes Through GIS. In Proceedings of the XVIII International Congress of Architectural Graphic Expression, Graphical Heritage: Volume 3-Mapping, Cartography and Innovation in Education; Springer: Berlin/Heidelberg, Germany, 2020; pp. 68–81. [Google Scholar]
- Maxwell, A.E.; Bester, M.S.; Guillen, L.A.; Ramezan, C.A.; Carpinello, D.J.; Fan, Y.; Hartley, F.M.; Maynard, S.M.; Pyron, J.L. Semantic Segmentation Deep Learning for Extracting Surface Mine Extents from Historic Topographic Maps. Remote Sens. 2020, 12, 4145. [Google Scholar] [CrossRef]
- Brovelli, M.A.; Minghini, M.; Giori, G.; Beretta, M. Web Geoservices and Ancient Cadastral Maps: The Web C.A.R.T.E. Project. Trans. GIS 2012, 16, 125–142. [Google Scholar] [CrossRef]
- Mora-Navarro, G.; Femenia-Ribera, C.; Velilla Torres, J.M.; Martinez-Llario, J. Geographical Data and Metadata on Land Administration in Spain. Land 2022, 11, 1107. [Google Scholar] [CrossRef]
- Femenia-Ribera, C.; Mora-Navarro, G.; Pérez, L.J.S. Evaluating the Use of Old Cadastral Maps. Land Use Policy 2022, 114, 105984. [Google Scholar] [CrossRef]
- Ekamper, P. Using Cadastral Maps in Historical Demographic Research: Some Examples from The Netherlands. Hist. Fam. 2010, 15, 1–12. [Google Scholar] [CrossRef]
- Zaragozí, B.; Giménez-Font, P.; Belda-Antolí, A.; Ramón-Morte, A. A Graph-Based Analysis for Generating Geographical Context from a Historical Cadastre in Spain (17th and 18th Centuries). Hist. Methods 2019, 52, 228–243. [Google Scholar] [CrossRef]
- Ignjatić, J.; Nikolić, B.; Rikalović, A.; Ćulibrk, D. Deep Learning for Historical Cadastral Maps Digitization: Overview, Challenges and Potential. Comput. Sci. Res. Notes 2018, 2803, 42–47. [Google Scholar] [CrossRef]
- Kim, N.W.; Lee, J.; Lee, H.; Seo, J. Accurate Segmentation of Land Regions in Historical Cadastral Maps. J. Vis. Commun. Image Represent. 2014, 25, 1262–1274. [Google Scholar] [CrossRef]
- Gatta, G.; Arioti, E.; Bitelli, G. Geomatics Science Applied to Cartographic Heritage and Archive Sources: A New Way to Explore the XIXth Century Gregorian Cadastre of Bologna (Italy), an Ante-Litteram 3D GIS. J. Cult. Herit. 2017, 23, 68–76. [Google Scholar] [CrossRef]
- Crespo Sanz, A.; Fernández Wyttenbach, A. ¿Cartografía Antigua o Cartografía Histórica? Estud. Geogr. 2011, 72, 403–420. [Google Scholar] [CrossRef]
- Crespo, A. No Es Lo Mismo. Diferenciando Entre Mapas Antiguos y Mapas Históricos. Rev. Catalana De Geogr. 2014, 19, 1–9. [Google Scholar]
- Strain, L.; Rajabifard, A.; Williamson, I. Marine Administration and Spatial Data Infrastructure. Mar. Policy 2006, 30, 431–441. [Google Scholar] [CrossRef]
- Rajabifard, A.; Williamson, I.P. Spatial Data Infrastructures: Concept, SDI Hierarchy and Future Directions. In Proceedings of the GEOMATICS’80 Conference, Tehran, Iran, 29 April 2001. [Google Scholar]
- Masser, I.; Rajabifard, A.; Williamson, I. Spatially Enabling Governments through SDI Implementation. Int. J. Geogr. Inf. Sci. 2008, 22, 5–20. [Google Scholar] [CrossRef]
- Trystuła, A.; Dudzińska, M.; Źróbek, R. Evaluation of the Completeness of Spatial Data Infrastructure in the Context of Cadastral Data Sharing. Land 2020, 9, 272. [Google Scholar] [CrossRef]
- Jiménez-Calderón, L.; Yépez-Campoverde, J.; Vázquez-Hoehne, A. Indicadores de Desempeño Para Evaluar Las Infraestructuras de Datos Espaciales. Estud. Geogr. 2017, 78, 165. [Google Scholar] [CrossRef]
- ISO 19115; Geographic Information—Metadata. International Organization for Standardization: Geneva, Switzerland, 2014.
- ISO 15836; Dublin Core Metadata Initiative. Information and Documentation—The Dublin Core Metadata Element Set. International Organization for Standardization: Geneva, Switzerland, 2017.
- Silva, M.A.; Stubkjær, E. A Review of Methodologies Used in Research on Cadastral Development. Comput. Env. Urban Syst. 2002, 26, 403–423. [Google Scholar] [CrossRef]
- Di, L.; Shao, Y.; Kang, L. Implementation of Geospatial Data Provenance in a Web Service Workflow Environment with ISO 19115 and ISO 19115-2 Lineage Model. IEEE Trans. Geosci. Remote Sens. 2013, 51, 5082–5089. [Google Scholar] [CrossRef]
- ICSM. Cadastre 2034 Strategy, Powering Land and Property. Available online: https://www.icsm.gov.au/sites/default/files/Cadastre2034_0.pdf (accessed on 6 July 2022).
- Renteria-Agualimpia, W.; Lopez-Pellicer, F.J.; Lacasta, J.; Zarazaga-Soria, F.J.; Muro-Medrano, P.R. Improving the Geospatial Consistency of Digital Libraries Metadata. J. Inf. Sci. 2016, 42, 507–523. [Google Scholar] [CrossRef]
- Tóth, K.; Tomas, R.; De Lima, V.N.; Cetl, V. Data Quality in INSPIRE: Balancing Legal Obligations with Technical Aspects; Join Research Center Technical Reports; European Comission: Brussels, Belgium, 2013; ISBN 9789279325328. [Google Scholar]
- Blower, J.D.; Maso, J.; Diaz, D.; Roberts, C.J.; Griffiths, G.H.; Lewis, J.P.; Yang, X.; Pons, X. Communicating Thematic Data Quality with Web Map Services. ISPRS Int. J. Geoinf. 2015, 4, 1965–1981. [Google Scholar] [CrossRef]
- Panchaud, N.H.; Enescu, I.I.; Hurni, L. Smart Cartographic Functionality for Improving Data Visualization in Map Mashups. Cartographica 2017, 52, 194–211. [Google Scholar] [CrossRef]
- Ganning, J.P.; Coffin, S.L.; McCall, B.; Carson, K. Goals, Challenges, and Capacity of Regional Data Portals in the United States: An Updated Understanding of Long-Standing Discussions. J. Urban Technol. 2014, 21, 125–139. [Google Scholar] [CrossRef]
- Resch, B.; Zimmer, B. User Experience Design in Professional Map-Based Geo-Portals. ISPRS Int. J. Geoinf. 2013, 2, 1015–1037. [Google Scholar] [CrossRef]
- DGC Estadística Del Catastro Inmobiliario Rústico. Available online: http://www.catastro.meh.es/esp/estadistica_10.asp (accessed on 24 July 2023).
- Santos Pérez, L.J. Los Fondos de Cartografía Histórica de La Dirección General Del Catastro. CT Catastro 2012, 3488, 41–64. [Google Scholar]
- DGC Ayuda Descarga de Cartografía Histórica Catastral. Available online: http://www.catastro.minhap.es/ayuda/lang/castellano/ayuda_descargas_carto_historica.htm (accessed on 24 July 2023).
- DGC Consulta Histórica: Explicación de Cada Campo de Base de Datos. Available online: http://www.catastro.meh.es/esp/consulta_historica.asp (accessed on 24 July 2023).
- Grill, S.; Schneider, M. Geonetwork Opensource as an Application for SDI and Education. In Proceedings of the GIS Ostrava 2009, Ostrava, Czech Republic, 25–28 January 2009; p. 8. [Google Scholar]
- Zha, Z.; Jiang, J.; Zhou, X. Hierarchical Optimization Model on GeoNetwork. Int. Arch. Photogramm. Remote Sens. Spat. Inf. Sci. 2012, XXXIX-B4, 261–264. [Google Scholar] [CrossRef]
- Cignetti, M.; Guenzi, D.; Ardizzone, F.; Allasia, P.; Giordan, D. An Open-Source Web Platform to Share Multisource, Multisensor Geospatial Data and Measurements of Ground Deformation in Mountain Areas. ISPRS Int. J. Geoinf. 2020, 9, 4. [Google Scholar] [CrossRef]
- De Lima e Silva, P.; dos Santos, A. de P.; Lisboa Filho, J. Proposal of an Academic Spatial Data Infrastructure for the Federal of Vicosa. Int. J. Spat. Data Infrastruct. Res. 2020, 15, 88–109. [Google Scholar] [CrossRef]
- Bayat, B.; Montzka, C.; Graf, A.; Giuliani, G.; Santoro, M.; Vereecken, H. One Decade (2011–2020) of European Agricultural Water Stress monitoring by MSG-SEVIRI: Workflow Implementation on the Virtual Earth Laboratory (VLab) Platform. Int. J. Digit Earth 2022, 15, 730–747. [Google Scholar] [CrossRef]
- Guimarães, N.; Pádua, L.; Adão, T.; Hruška, J.; Peres, E.; Sousa, J.J. VisWebDrone: A Web Application for UAV Photogrammetry Based on Open-Source Software. ISPRS Int. J. Geoinf. 2020, 9, 679. [Google Scholar] [CrossRef]
- Pathak, S.; Garg, R.D.; Jato-Espino, D.; Lakshrni, V.; Ojha, C.S.P. Evaluating Hotspots for Stormwater Harvesting through Participatory. J. Env. Manag. 2019, 242, 351–361. [Google Scholar] [CrossRef]
- Yu, X.W.; Liu, H.Y.; Yang, Y.C.; Zhang, X.; Li, Y.W. GeoServer Based Forestry Spatial Data Sharing and Integration. In Proceedings of the Progress in Environmental Protection and Processing of Resource; Trans Tech Publications Ltd.: Zurich, Switzerland, 2013; Volume 295, pp. 2394–2398. [Google Scholar]
- Mazhindu, A.N.; Madamombe, H.K. Design and Implementation of a Web-GIS for the Management of Road Infrastructure in Zimbabwe. S. Afr. J. Geomat. 2022, 11, 53–64. [Google Scholar] [CrossRef]
- Todorovski, D.; Salazar, R.; Jacome, G.; Mclaren, R.; Lemmen, C. Assessment of Land Administration in Ecuador Based on the Fit-for-Purpose Approach. Land 2021, 10, 862. [Google Scholar] [CrossRef]
- Koeva, M.; Gasuku, O.; Lengoiboni, M.; Asiama, K.; Bennett, R.M.; Potel, J.; Zevenbergen, J. Remote Sensing for Property Valuation: A Data Source Comparison in Support of Fair Land Taxation in Rwanda. Remote Sens. 2021, 13, 3563. [Google Scholar] [CrossRef]
- Chekole, S.D.; de Vries, W.T.; Shibeshi, G.B. An Evaluation Framework for Urban Cadastral System Policy in Ethiopia. Land 2020, 9, 60. [Google Scholar] [CrossRef]
- Hull, S.; Liversage, H.; Rizzo, M.P.; Evtimov, V. An Overview of Frontier Technologies for Land Tenure: How to Avoid the Hype and Focus on What Matters. Land 2022, 11, 1939. [Google Scholar] [CrossRef]
- Okembo, C.; Lemmen, C.; Kuria, D.; Zevenbergen, J. Developing an Adapted Land Administration Domain Model Profile for Kenya. Land Use Policy 2022, 117, 106087. [Google Scholar] [CrossRef]
- Muthama, D.M.; Barry, M.; Ballantyne, B. Improving Land Tenure Administration Effectiveness in a Post-Conflict Peri-Urban Mombasa Settlement. Urban Forum 2020, 31, 237–253. [Google Scholar] [CrossRef]
- DGC Norma de Entrega de Actualizaciones de La Cartografía Catastral Rústica y Urbana. Formato FXCC Para Intercambio de Información Gráfica Asociada a Parcelas Catastrales. 2020, p. 64. Available online: https://www.catastro.meh.es/documentos/formatos_intercambio/formato_fx-cc_2010.pdf (accessed on 24 July 2023).
Figure 1.
Aldaia’s municipality location and limits (in red). Source: Institut Cartogràfic Valencià.
Figure 1.
Aldaia’s municipality location and limits (in red). Source: Institut Cartogràfic Valencià.

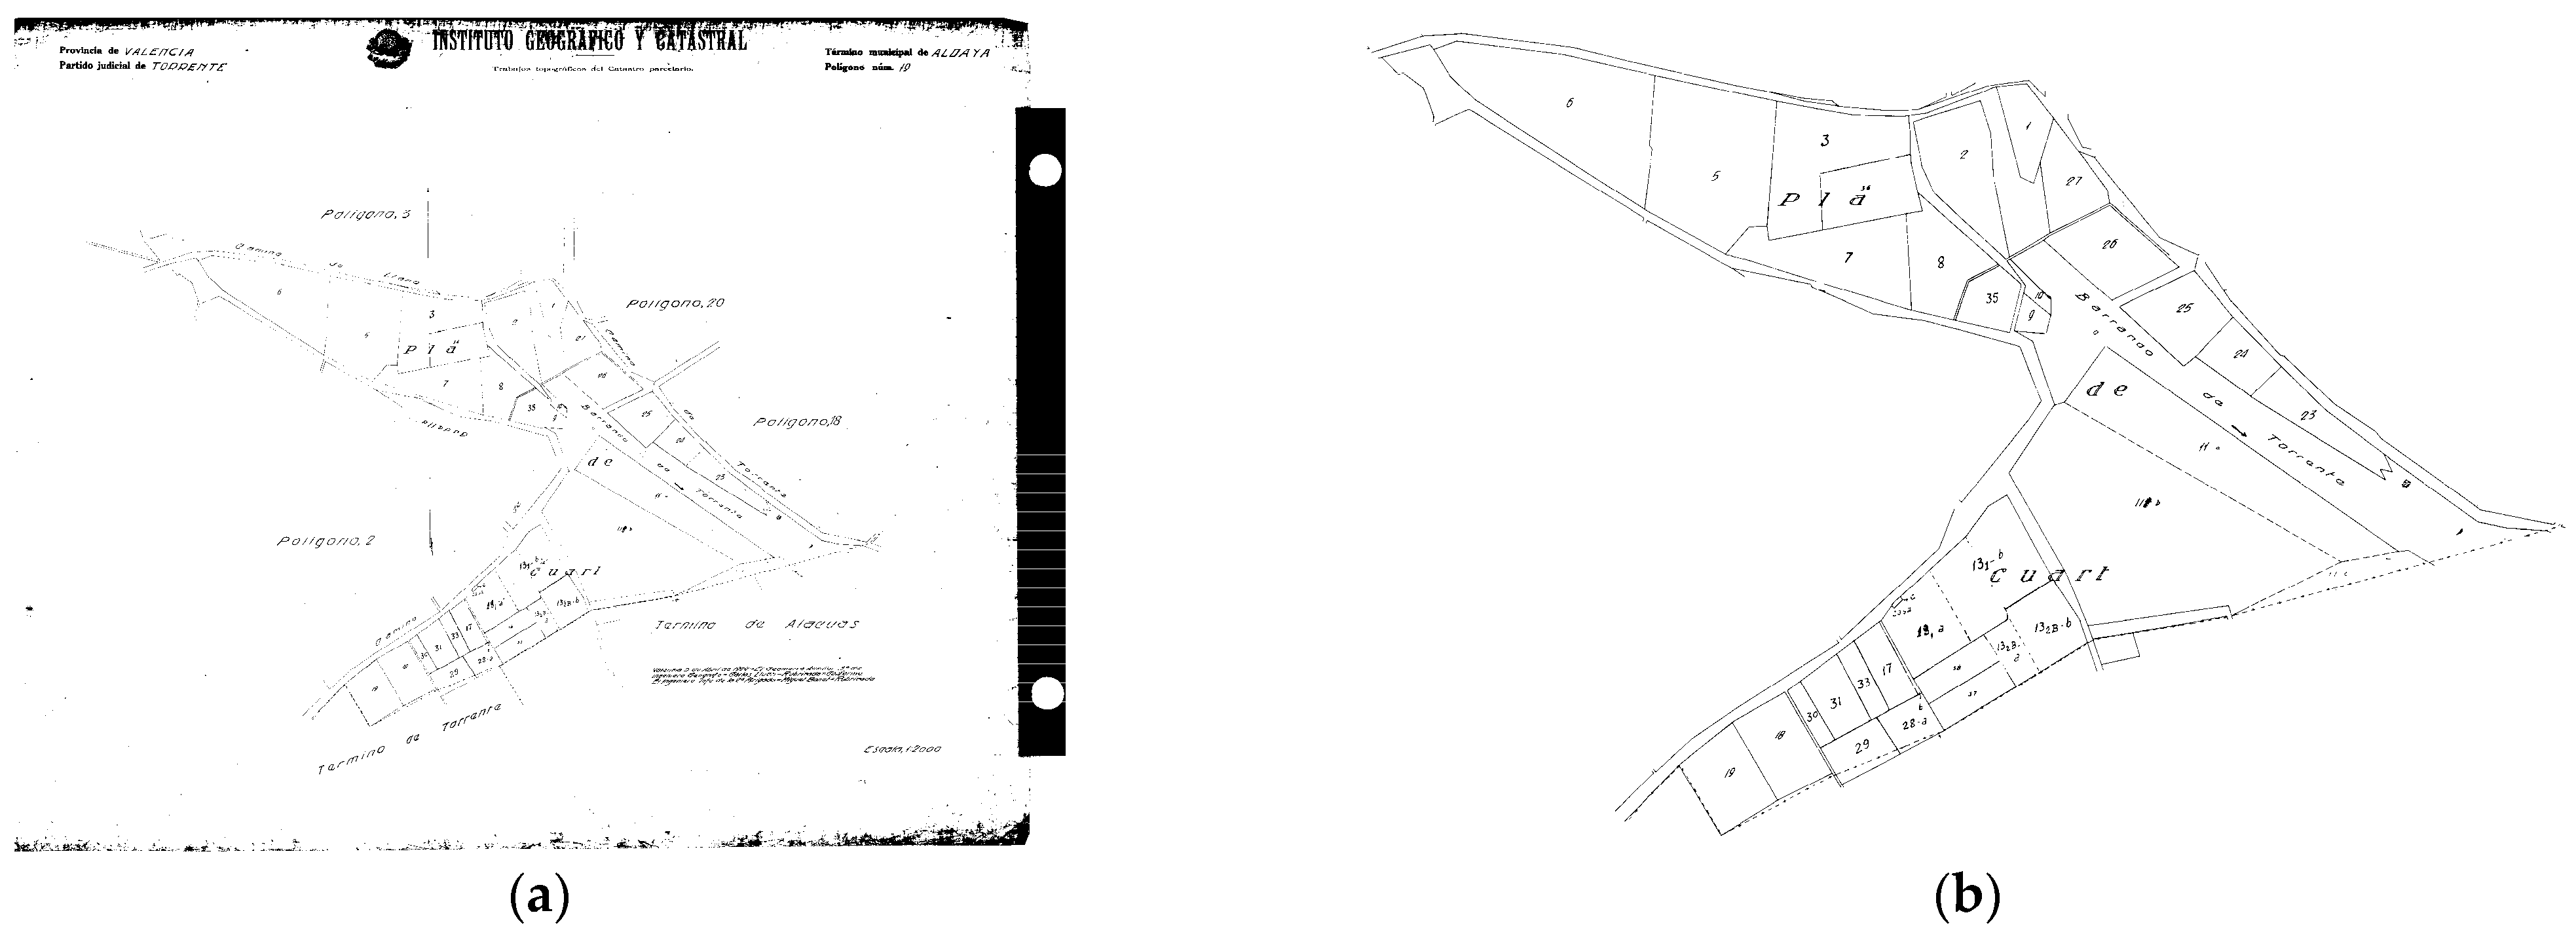
Figure 2.
Aldaia’s TCM example. Cadastral polygon 5. Scale 1/2000. Year 1928. Source EOC.

Figure 3.
Historical information example: (a) parcel owner card; (b) cadastral polygon field sketch. Source: PHA and authors.
Figure 3.
Historical information example: (a) parcel owner card; (b) cadastral polygon field sketch. Source: PHA and authors.

Figure 4.
Editing works before the map georeferencing: (a) original image; (b) final image. Source: Valencia Provincial Cadastre Office.
Figure 4.
Editing works before the map georeferencing: (a) original image; (b) final image. Source: Valencia Provincial Cadastre Office.

Figure 5.
Representation of the displacements in the TCM series. Source: Authors.

Figure 6.
Representation of the displacements in the TCM series (above) and REN series (below), obtained using Empirical Bayesian Kriging. Source: Authors.
Figure 6.
Representation of the displacements in the TCM series (above) and REN series (below), obtained using Empirical Bayesian Kriging. Source: Authors.

Figure 7.
Server components, architecture and access to the SDI services.

Figure 8.
Example of a GeoNetwork metadata page, with the available files to download for a cadastral polygon. Source: Authors.
Figure 8.
Example of a GeoNetwork metadata page, with the available files to download for a cadastral polygon. Source: Authors.

Figure 9.
Main view of the MapStore map viewer. To the (left), the layer control panel. To the (right), the attribute information of the elements located in the clicked point: a control point layer, with the displacement information, and the TCM map information. Source: Authors.
Figure 9.
Main view of the MapStore map viewer. To the (left), the layer control panel. To the (right), the attribute information of the elements located in the clicked point: a control point layer, with the displacement information, and the TCM map information. Source: Authors.

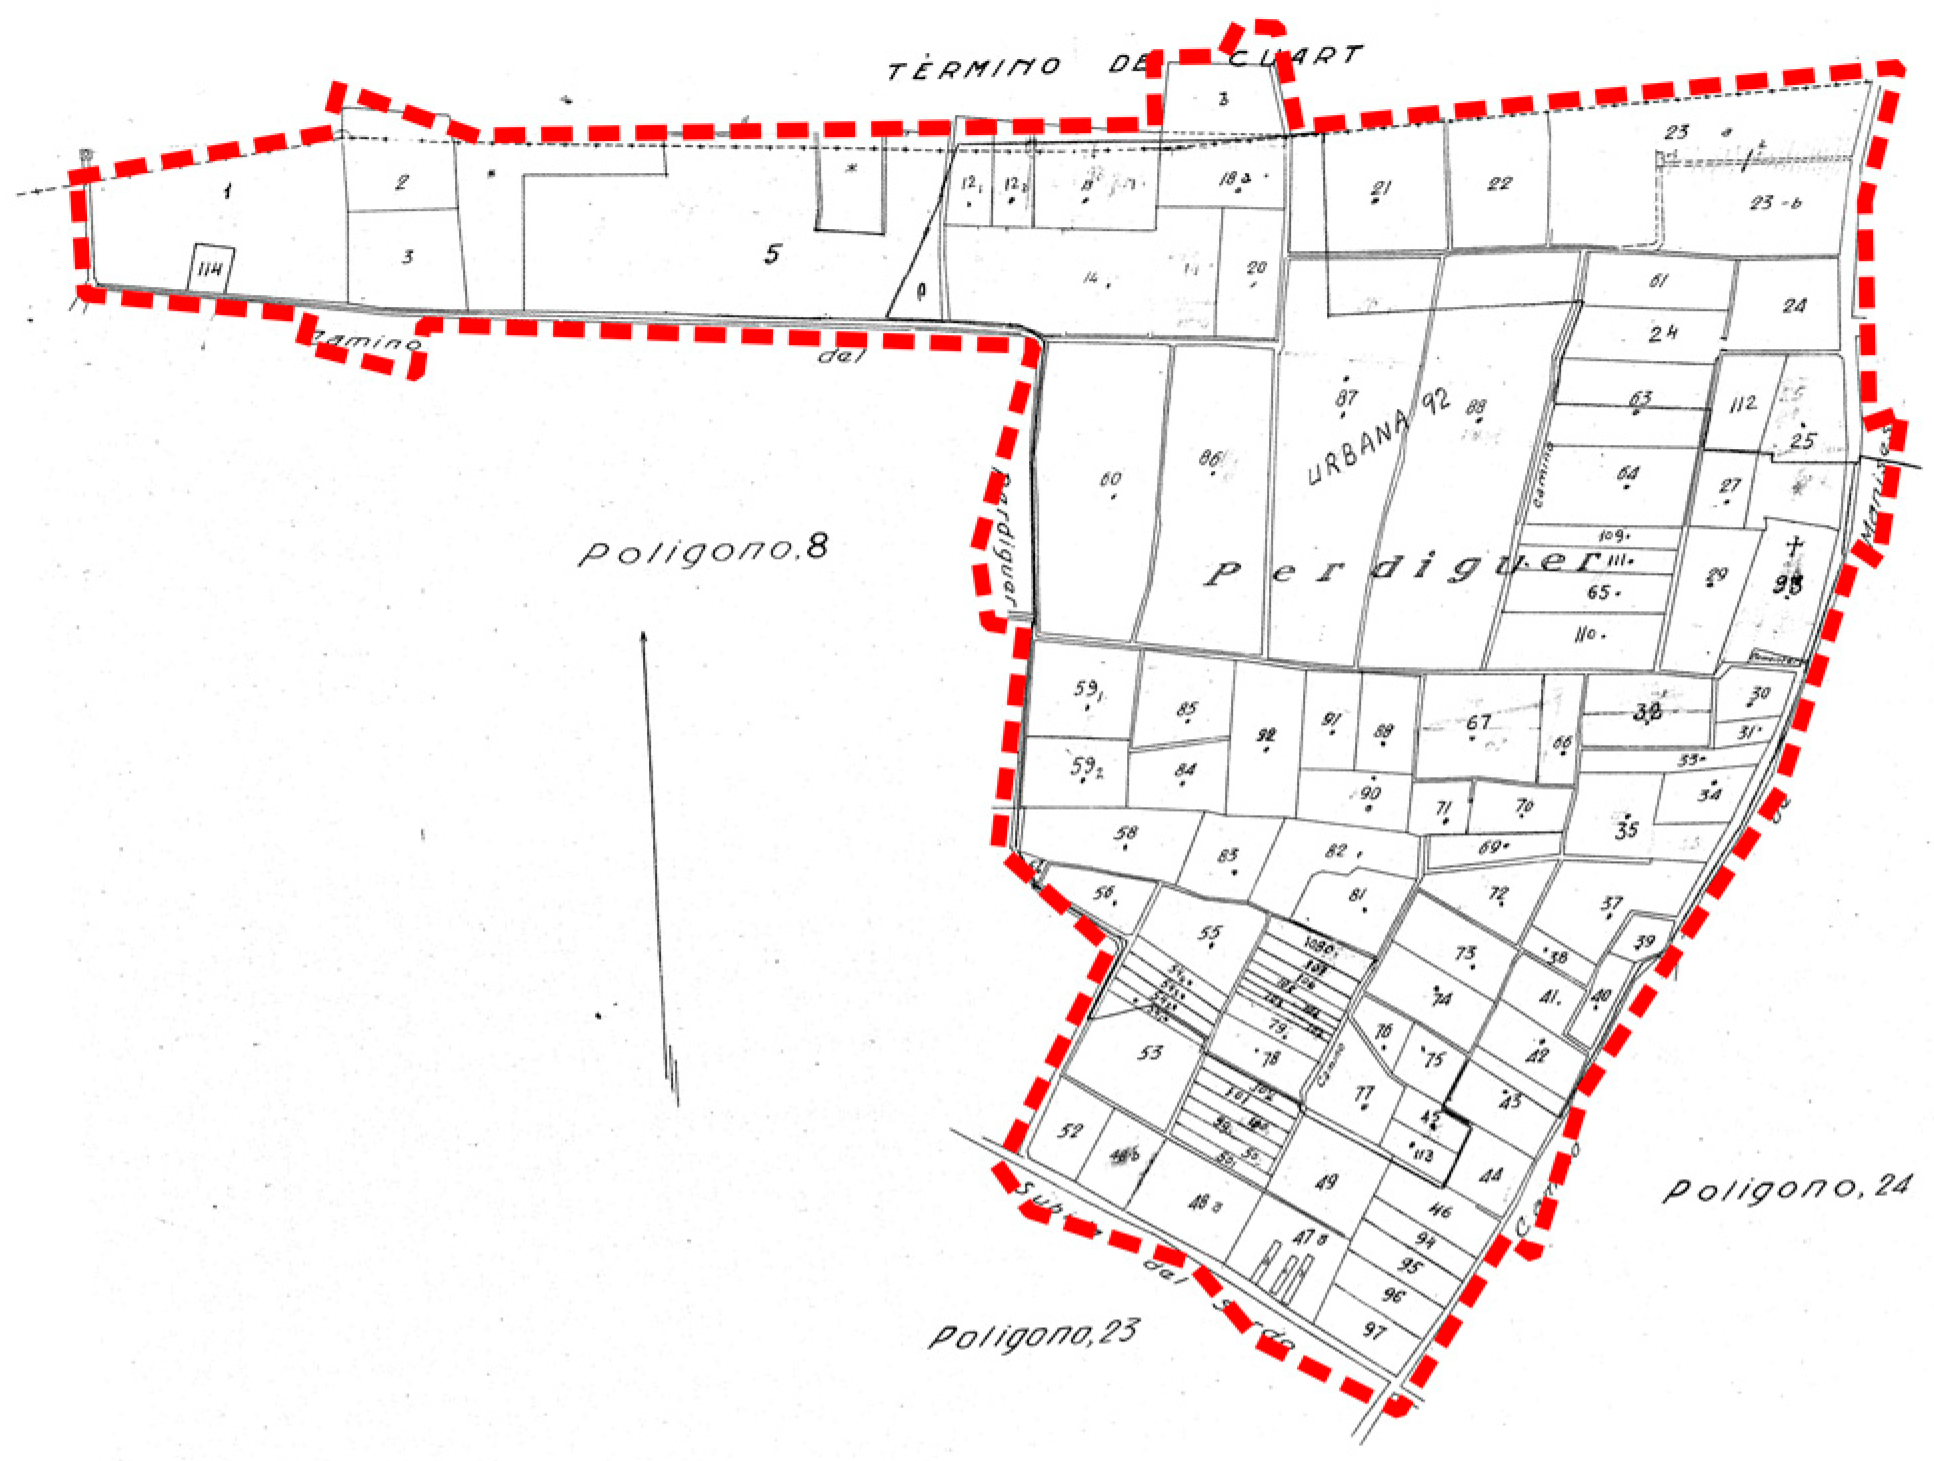
Figure 10.
OCM process to obtain the cadastral polygon perimeter. Steps one and two: (a) frame cleaning by applying a mask; (b) deriving vector points from the raster pixels. Source: Authors.
Figure 10.
OCM process to obtain the cadastral polygon perimeter. Steps one and two: (a) frame cleaning by applying a mask; (b) deriving vector points from the raster pixels. Source: Authors.

Figure 11.
OCM process to obtain the cadastral polygon perimeter. Steps three and four: (a) buffer applied to the vector points; (b) polygon layer after filling all holes. Source: Authors.
Figure 11.
OCM process to obtain the cadastral polygon perimeter. Steps three and four: (a) buffer applied to the vector points; (b) polygon layer after filling all holes. Source: Authors.

Figure 12.
OCM process to obtain the cadastral polygon perimeter. Final old cadastral polygon delimitation, after keeping only the largest polygon from the previous step and simplifying its geometry. Source: Authors.
Figure 12.
OCM process to obtain the cadastral polygon perimeter. Final old cadastral polygon delimitation, after keeping only the largest polygon from the previous step and simplifying its geometry. Source: Authors.

Figure 13.
Cadastral sketch of buildings (CU-1). Currently called CC. Source: EOC.


Table 1.
Extract of OCM inventory, 2012. Source: DGC, Valencia provincial office.
| ID | Map Type | Agency | Product Type | Production Year | Is in the Agency | Physical Format | Has Digital Format | Sheet Number | Is in the PHA 1 |
|---|---|---|---|---|---|---|---|---|---|
| 20942 | Countryside | VALENCIA | Cadastre digitized over orthophotography | 1997 | Yes | Opaque paper | Yes | 28 | No |
| 21051 | Countryside | VALENCIA | Topographical cadastral map | 1928 | Yes | Translucent paper | Yes | 27 | Yes |
| 21384 | Countryside | VALENCIA | Cadastral plan | 1993 | Yes | Translucent paper | Yes | 21 | No |
| 41385 | Countryside | VALENCIA | Implantation | 1973 | Yes | Translucent paper | Yes | 29 | Yes |
| 41386 | Countryside | VALENCIA | Other cases | 2000 | Yes | Undefined | Yes | 21 | No |
| 41387 | Countryside | VALENCIA | Other cases | 1987 | Yes | Translucent paper | Yes | 6 | No |
| 41388 | Countryside | VALENCIA | First reviews | 1987 | Yes | Translucent paper | No | 42 | No |
1 Provincial Historical Archive (PHA).
Table 2.
Absolute external positional accuracy achieved in the georeferenced maps of the series TCM and REN.
Table 2.
Absolute external positional accuracy achieved in the georeferenced maps of the series TCM and REN.
| Series | No. of Points | Deviation in X (m) | Deviation in Y (m) | Total Deviation (m) | |||||
|---|---|---|---|---|---|---|---|---|---|
| Average (Signed) | Average (Absolute) | Std. Dev. | Average (Signed) | Average (Absolute) | Std. Dev. | Average | Std. Dev. | ||
| TCM | 503 | 0.64 | 3.3817 | 2.6395 | −1.26 | 3.6375 | 3.4657 | 5.5487 | 3.5841 |
| REN | 270 | −0.32 | 2.8819 | 2.4830 | 0.07 | 2.7940 | 2.2865 | 4.5278 | 2.6473 |
Table 3.
Normality test of the displacements in series TCM and REN.
| Series | Component | Average (Signed) | Std Dev. | Chi-Square | |
|---|---|---|---|---|---|
| Statistic | p-Value | ||||
| TCM | X | 0.671 | 4.194 | 52.075 | 0.162 |
| Y | −0.989 | 4.293 | 49.659 | 0.225 | |
| REN | X | −0.163 | 3.579 | 42.780 | 0.096 |
| Y | 0.084 | 3.445 | 52.061 | 0.014 | |
Table 4.
Social research main results. Source: Authors.
| About OCM | Opinions | Proposals |
|---|---|---|
| Importance |
| |
| Concerns | Misuse of the information if it is provided openly. |
|
| Proposals for improvements |
| |
Disclaimer/Publisher’s Note: The statements, opinions and data contained in all publications are solely those of the individual author(s) and contributor(s) and not of MDPI and/or the editor(s). MDPI and/or the editor(s) disclaim responsibility for any injury to people or property resulting from any ideas, methods, instructions or products referred to in the content. |
© 2023 by the authors. Licensee MDPI, Basel, Switzerland. This article is an open access article distributed under the terms and conditions of the Creative Commons Attribution (CC BY) license (https://creativecommons.org/licenses/by/4.0/).
Share and Cite
MDPI and ACS Style
Verdu-Candela, A.; Femenia-Ribera, C.; Mora-Navarro, G.; Sierra-Requena, R. Implementation of Web Map Services for Old Cadastral Maps. ISPRS Int. J. Geo-Inf. 2023, 12, 413. https://doi.org/10.3390/ijgi12100413
AMA Style
Verdu-Candela A, Femenia-Ribera C, Mora-Navarro G, Sierra-Requena R. Implementation of Web Map Services for Old Cadastral Maps. ISPRS International Journal of Geo-Information. 2023; 12(10):413. https://doi.org/10.3390/ijgi12100413
Chicago/Turabian StyleVerdu-Candela, Alvaro, Carmen Femenia-Ribera, Gaspar Mora-Navarro, and Rafael Sierra-Requena. 2023. "Implementation of Web Map Services for Old Cadastral Maps" ISPRS International Journal of Geo-Information 12, no. 10: 413. https://doi.org/10.3390/ijgi12100413
Note that from the first issue of 2016, this journal uses article numbers instead of page numbers. See further details here.