

A GIS-Based Damage Evaluation Method for Explosives Road Transportation Accidents

1
State Key Laboratory of Precision Blasting, Jianghan University, Wuhan 430056, China
2
School of Artificial Intelligence, Jianghan University, Wuhan 430056, China
3
School of Computer and Communication Engineering, University of Science and Technology Beijing, Beijing 100083, China
*
Author to whom correspondence should be addressed.
ISPRS Int. J. Geo-Inf. 2023, 12(12), 470; https://doi.org/10.3390/ijgi12120470
Submission received: 27 September 2023
/
Revised: 15 November 2023
/
Accepted: 19 November 2023
/
Published: 21 November 2023
(This article belongs to the Special Issue Application of Geographical Information System in Urban Design, Management or Evaluation)
Abstract
:The road transportation of explosives is highly concerning due to its substantial impact on social safety. For the safety management of explosive transportation, e.g., transport route planning and emergency rescue, explosion consequence evaluation is of paramount importance. The consequence evaluation of explosion accidents is affected by many factors, especially spatial features, such as the location of transport vehicles, the distribution of buildings, and the presence of individuals around the road, etc. However, there is still a lack of quantification methods for building damage evaluation, human casualty evaluation that considers real-time population density, and efficient interactive damage evaluation methods. In this paper, we formalize three typical scenarios of damage evaluation for explosive road transportation accidents, i.e., explosion point-based, road segment-based, and route-based damage evaluation. For each scenario, we propose a Height-aware Hierarchical Building Damage (HHBD) model and a Shelter-aware Human Casualty (SHC) model for building damage evaluation and human casualty evaluation, respectively. We also develop a GIS-based interactive visualization platform that integrates multi-source geospatial data and that enables efficient geospatial computation. In addition, a case study of liquefied natural gas (LNG) transportation in Wuhan is demonstrated in order to verify the effectiveness and efficiency of the proposed system. The research results can support the decision-making process of explosive transportation safety warnings and emergency rescue.
1. Introduction
With the widespread production and use of various hazardous materials (hazmat) in modern society, the road transportation of hazmat has become an important economic activity. Hazmat road transportation is highly concerning due to its substantial impact on social safety. As a typical type of hazmat, explosives have chemical instability and explosiveness. Once an explosion occurs during transportation, which usually occurs within urban areas, it may not only cause serious damage to the surrounding environment, but may also have a serious impact on the stability of the local society. Therefore, explosion transportation safety is a critical issue that demands attention.
Explosion consequence evaluation is the basis for the safety management of explosive transportation, e.g., transport route planning and emergency rescue. Existing methods have assessed the transport risk of hazmat by estimating the human casualties and damages to environmentally sensitive areas by considering a variety of factors [1,2,3,4,5,6,7,8,9,10,11,12,13]. Wu et al. [1] proposed a quantitative approach that evaluates the consequences of individual risk and social risk, based on the explosive type, vehicle equipment, personnel quality, etc. Song et al. [2] estimated the human fatalities of explosion accidents based on the TNT (Trinitrotoluene) equivalent method, which computes the radius at which an explosion shock wave causes death at a probability of 0.5. Li et al. [3] proposed a multidimensional quantitative risk assessment framework for hazmat vehicles in dense areas of stay points. An entropy weighting method was used to quantify the weight of indicators in the overall risk assessment. Some studies also simulated the spread model of hazmat accidents and estimated the consequences of an accident [4,5,6]. Meanwhile, a growing body of research considered spatial features such as population density and environmental risks by leveraging a geographic information system (GIS) [7,8,9,10,11,12]. The population exposure was generally calculated as a moving circle along the transport route, and the radius of the circle was determined by the type of explosives. The powerful spatial data processing and analytic capabilities of GIS technology can be employed to determine the impact area and to search for particular features [9].
On the other hand, GIS-based route planning has also attracted much attention [8,9,14,15,16,17,18,19,20]. Ak and Bozkaya [8] utilized ArcMap to apply different route planning models and to visualize the hazmat transportation routes on the map. The applied route planning models belong to single-objective optimization, e.g., the shortest distance model, the minimum population exposure model, etc. Li and Leung [9] proposed a compromise programming approach to find a compromise solution among a set of conflicting objectives. The compromise solution was a multi-objective solution that was closest to the ideal solution, based on a function measuring the distance of the compromise solution from the ideal solution. With the support of GIS, a case study on Hong Kong was carried out for the hazmat transportation on the road network. Huang et al. [14] explored a novel approach for evaluating the risk of hazmat transportation by integrating GIS and genetic algorithms (GAs). GIS was used to quantify the specified routing criteria, and GA was applied to efficiently determine the weights of the factors involved in route choice. AlRukaibi et al. [15] developed an incident simulation model, and employed ArcGIS to generate impact zones based on both the dispersion model and the emergency response guide recommendations. The resulting impact zones assisted in analyzing the population exposure estimations as well as in the sensitive and emergency facilities’ proximity considerations. Goforth et al. [16] used GIS technology to propose a network-of-networks (NoN) framework to evaluate the shortest paths based on a multi-objective program for hazmat transportation. The analysis results indicated that the optimal transportation routes are different for the shortest path and the least vulnerable analyses. Other research groups [17,18,19,20] investigated GIS-based evacuation route planning during disasters, which is not the focus of this paper.
Compared to traditional hazmat route planning [21,22,23,24,25,26], which focused on network design [21,25] and route optimization [22,23,24], GIS-based hazmat route planning enables users to process geospatial data at a greater level of detail and to perform routing analysis to generate and compare alternative routes. However, there are still several issues that need to be addressed: (1) None of the existing studies have explored a quantification method for evaluating building damages during transportation, nor have they incorporated it into route planning; (2) Existing studies on population exposure evaluation are based on resident population or approximate population density, which ignores real-time changes in population density; (3) The method of leveraging GIS technology to improve the efficiency of interactive damage evaluation that involves multi-source geospatial data is in demand.
In this paper, we investigate the GIS-based damage evaluation of buildings and humans during explosive road transportation accidents. There are three objectives in this study: to evaluate building damage considering the heights of buildings, to evaluate real-time human casualties considering the impact of buildings, and to leverage GIS techniques to enable efficient damage evaluation and route planning. The rest of this paper is organized as follows: Section 2 introduces the Materials and Methods presented in this paper, with the study area and data sources detailed in Section 2.1 and Section 2.2, respectively. Furthermore, Section 2.3 describes the damage evaluation methods, while Section 2.4 explains the spatial queries relevant to the damage evaluation. The experimental results with a case study are shown in Section 3. In Section 4, we discuss the experimental results and summarize the findings. Finally, we conclude the paper in Section 5.
2. Materials and Methods
2.1. Study Area
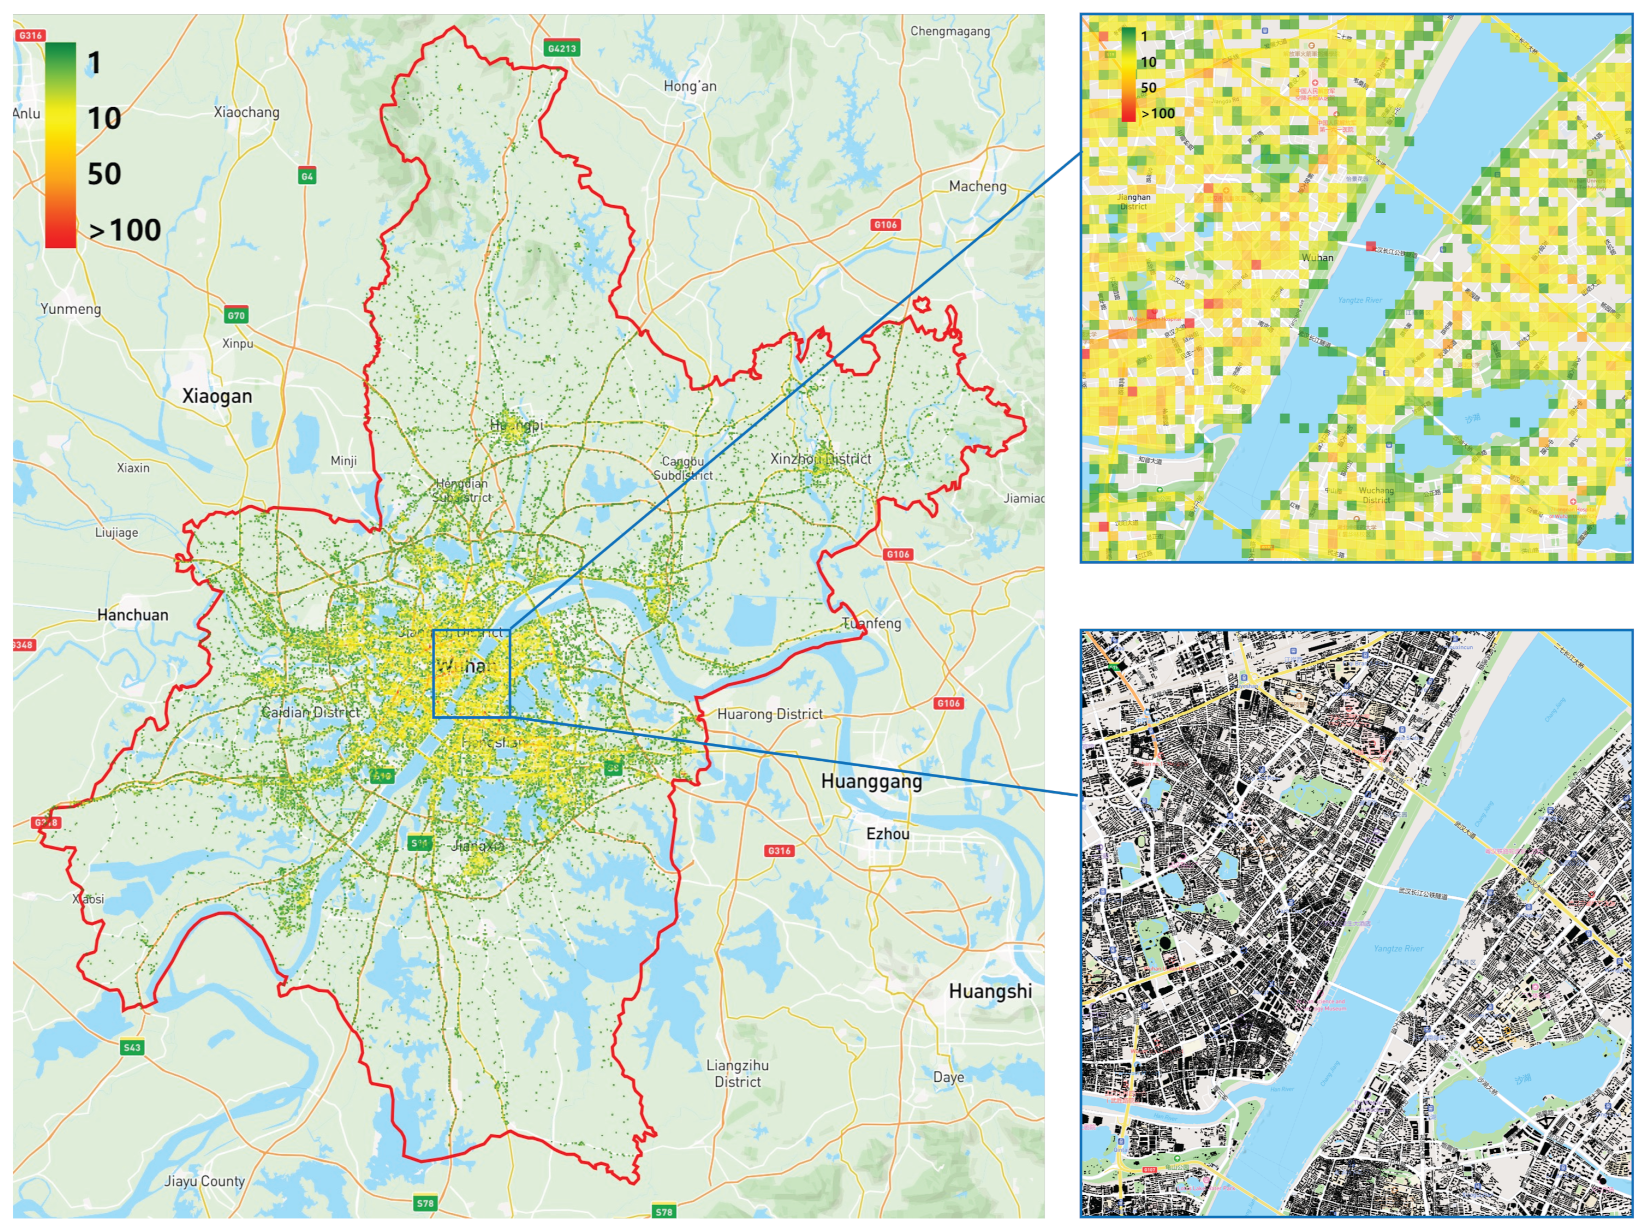
Figure 1 shows the distribution of buildings and population densities in the study area, Wuhan, which is in red boundaries. The upper right corner of Figure 1 represents the population density heatmap of the center area (highlighted in the blue square) in Wuhan during the morning peak hour (8:00–9:00) on 30 July 2022. The lower right corner of the figure shows the distribution of buildings in the center area of Wuhan, where a building is represented as a polygon in black.
2.2. Data Sources and Preprocessing
To evaluate the explosion damage to buildings and humans around the transportation roads, we have collected a series of datasets as outlined in Table 1. These datasets include road network data, geographic information of buildings, housing price data, and the population density data of Wuhan. Since the collected raw datasets are in different data types and different spatiotemporal scales, data preprocessing such as data transformation, data completion, and data integration are necessary. The details of data preprocessing are as follows.
- Data Transformation: In this step, we perform a feature transition on the road network data. The raw road network data is collected from OpenStreetMap [27] and it is provided in a spatial data format known as a shapefile, which contains geographic feature information. Because each road network edge is represented as a line string, and certain intersections of edges are omitted in the raw data, we employ a GIS tool, ArcMap [28], to convert the edge features into lines. This is achieved by splitting lines at their intersections using the Feature to Line operator in Arcmap. Following the feature transitions of edges, the original 70,723 edges have been divided into 83,727 edges to facilitate subsequent computations. It is worth noting that all of the collected datasets utilize the WGS84 coordinate system, eliminating the need for coordinate transformation.
- Data Completion and Integration: To evaluate the economic cost of building damage, the housing price data of buildings are required. The collected housing price data comprise prices for each 250 m × 250 m spatial grid, as well as the administrative districts of Wuhan. As a result, we need to associate the buildings with either the spatial grids or the administrative districts based on their locations, and supplement the building data with the housing price information. Then, we integrate the geographic data of buildings and housing price data into a building database, called Buildings. This database includes the following attributes: bid, geometry, height, and price.
After data preprocessing, three data tables are created and loaded into the spatial database, i.e., Roads, Buildings, and People. The Roads data table encompasses information regarding nodes and edges on the road network, which is essential for calculating the explosion impact area and route planning. For damage evaluation, the Buildings table includes the geographic and housing price data of buildings, while the People table comprises the population density values for each 200 m × 200 m spatial grid.

Table 1.
Data Description.
| Datasets | Description | Temporal Information | Data Type | Data Source |
|---|---|---|---|---|
| Dataset-1 | Road network data | Obtained on 1 June 2023 | Shapefile | OpenStreetMap |
| (48,637 nodes and 70,723 edges) | (https://www.openstreetmap.org/) | |||
| Dataset-2 | Geographic data of | Obtained on 24 May 2022 | Shapefile | Amap |
| buildings (166,062 buildings) | (http://ditu.amap.com/) | |||
| Dataset-3 | Housing price data of | By 24 May 2022 | Csv | Amap |
| each 250 m × 250 m grid | (http://ditu.amap.com/) | |||
| Dataset-4 | Housing price data of | By 24 May 2022 | Csv | City house |
| the administrative districts | (https://wh.cityhouse.cn/market/) | |||
| Dataset-5 | Population density of each | 24 h on 30 July 2022 | Csv | Baidu Huiyan |
| 200 m × 200 m grid | (https://huiyan.baidu.com/) |
2.3. Damage Evaluation Methods
2.3.1. Damage Evaluation Scenarios
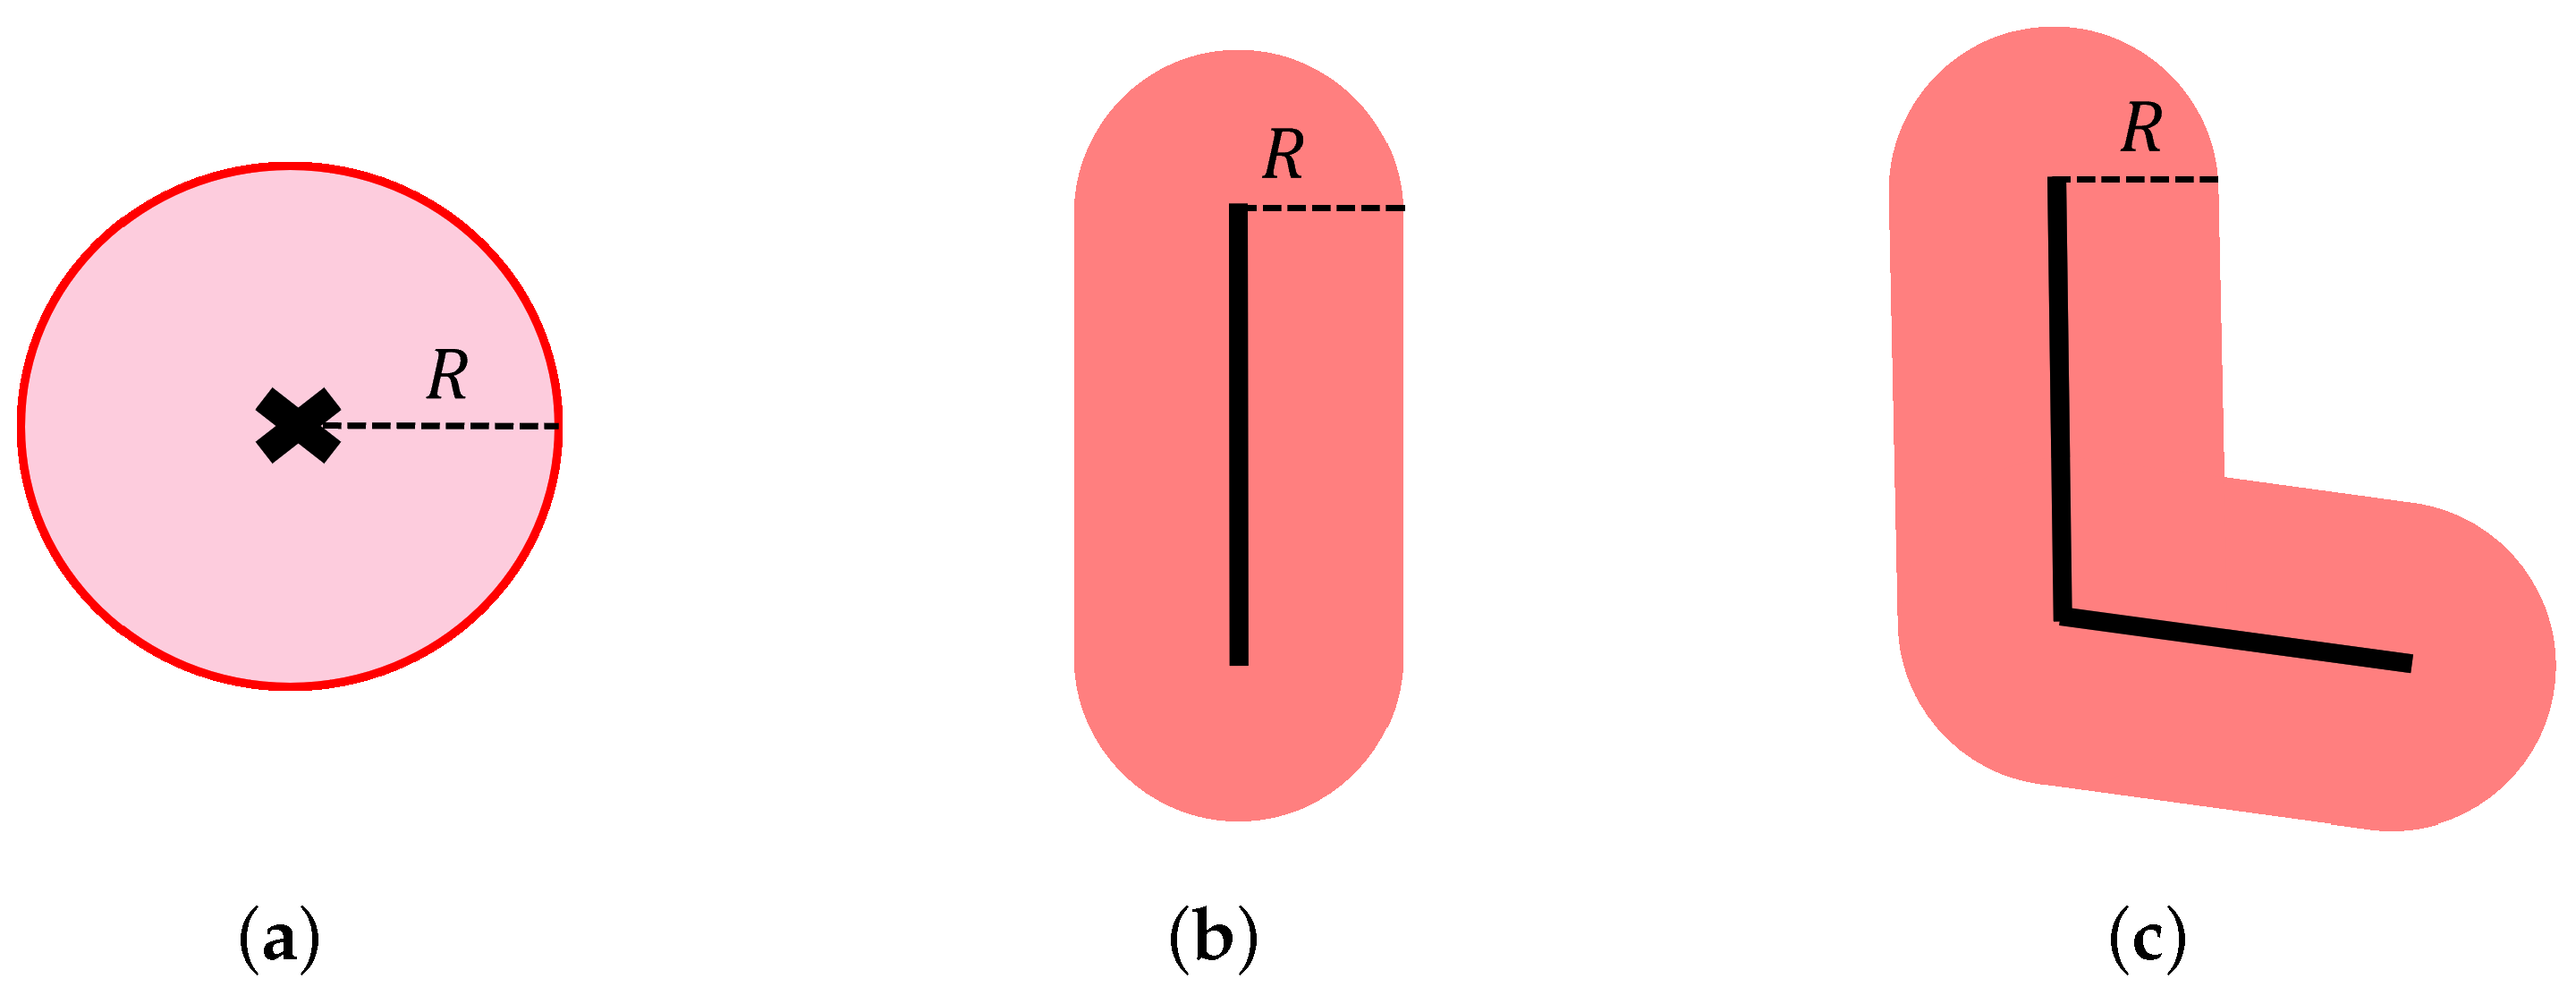
Figure 2 depicts three typical scenarios of damage evaluation, i.e., the explosion point-based, road segment-based, and route-based damage evaluation. Each of these damage evaluation scenarios aligns with specific practical application requirements and the corresponding applicable evaluation methods, which will be elaborated upon as follows.
- Explosion Point-based Damage Evaluation: In the case of a sudden explosion accident or the need to designate a mid-way parking location during explosive transportation, an explosion point-based damage evaluation model is required. As illustrated in Figure 2a, an explosion impact area is defined as a circular region with the explosion point as its center (indicated by a cross symbol), and R representing the radius of this area. The calculation of explosion consequences depends on the distribution of people and building facilities within the explosion impact area.
- Road Segment-based Damage Evaluation: Unlike the static explosion point, the road segment-based damage evaluation is designed for dynamic transportation scenarios, where the explosion consequence is evaluated by the surrounding conditions of the road segment. As depicted in Figure 2b, the explosion impact area is represented by the red region surrounding the road segment, with the minimum distance occurring between any point on the region boundary and the road segment, denoted as R.
- Route-based Damage Evaluation: The route-based damage evaluation is mainly necessary in two situations, i.e., before and after an explosion accident occurs. Pre-accident damage evaluation is crucial for route planning and the approval evaluation of the transport route, whereas post-accident is valuable for emergency response and evacuation route planning, among other applications. The route-based damage evaluation is fundamentally built upon the road segment-based damage evaluation. As Figure 2c shows, the explosion impact area in the route-based scenario encompasses multiple road segments. Furthermore, the damage evaluation result for a given route is a weighted value derived from the damage evaluation results of road segments within the route. We define the weighted function as being either Max or Avg.
Figure 2.
Damage evaluation scenarios: (a) explosion point-based damage evaluation; (b) road segment-based damage evaluation; (c) route-based damage evaluation.
Figure 2.
Damage evaluation scenarios: (a) explosion point-based damage evaluation; (b) road segment-based damage evaluation; (c) route-based damage evaluation.

2.3.2. Damage Level and Influence Radius Estimation
For the damage evaluation scenarios described in the previous section, the explosion impact area is determined by the explosion influence radius, corresponding to varying degrees of damage. In this paper, we define several damage levels for both buildings and humans, each associated with different explosion influence radii. These radii are estimated using the TNT equivalence method [2]. According to the TNT equivalence method, given the weight of any type of explosives, the corresponding TNT equivalent is calculated using the following equation:
where A is the TNT equivalence coefficient, is the explosive heat of TNT, and is the combustion value of the fuel.
Based on the computed TNT equivalent of the explosive, the simulation ratio of the explosives and the influence radius R are computed according to the following equation:
where represents the standard distance as determined in a 1000 kg TNT explosion experiment, where the corresponding explosion shock wave overpressures are detailed in Table A1 in Appendix A. Note that the above equation holds true when the explosion shock wave overpressures from the actual explosion and the 1000 kg TNT explosion are equal, i.e., .
As depicted in Table 2, we have established four damage levels for building damages and three damage levels for human casualties, respectively. For each damage level, we select the corresponding shock wave overpressure based on the extent of damage to buildings and humans, as detailed in Table A2 and Table A3 in Appendix A. Additionally, the standard distance in the 1000 kg TNT explosion experiment is determined based on the shock wave overpressure listed in Table A1.
2.3.3. Height-Aware Hierarchical Building Damage (HHBD) Model
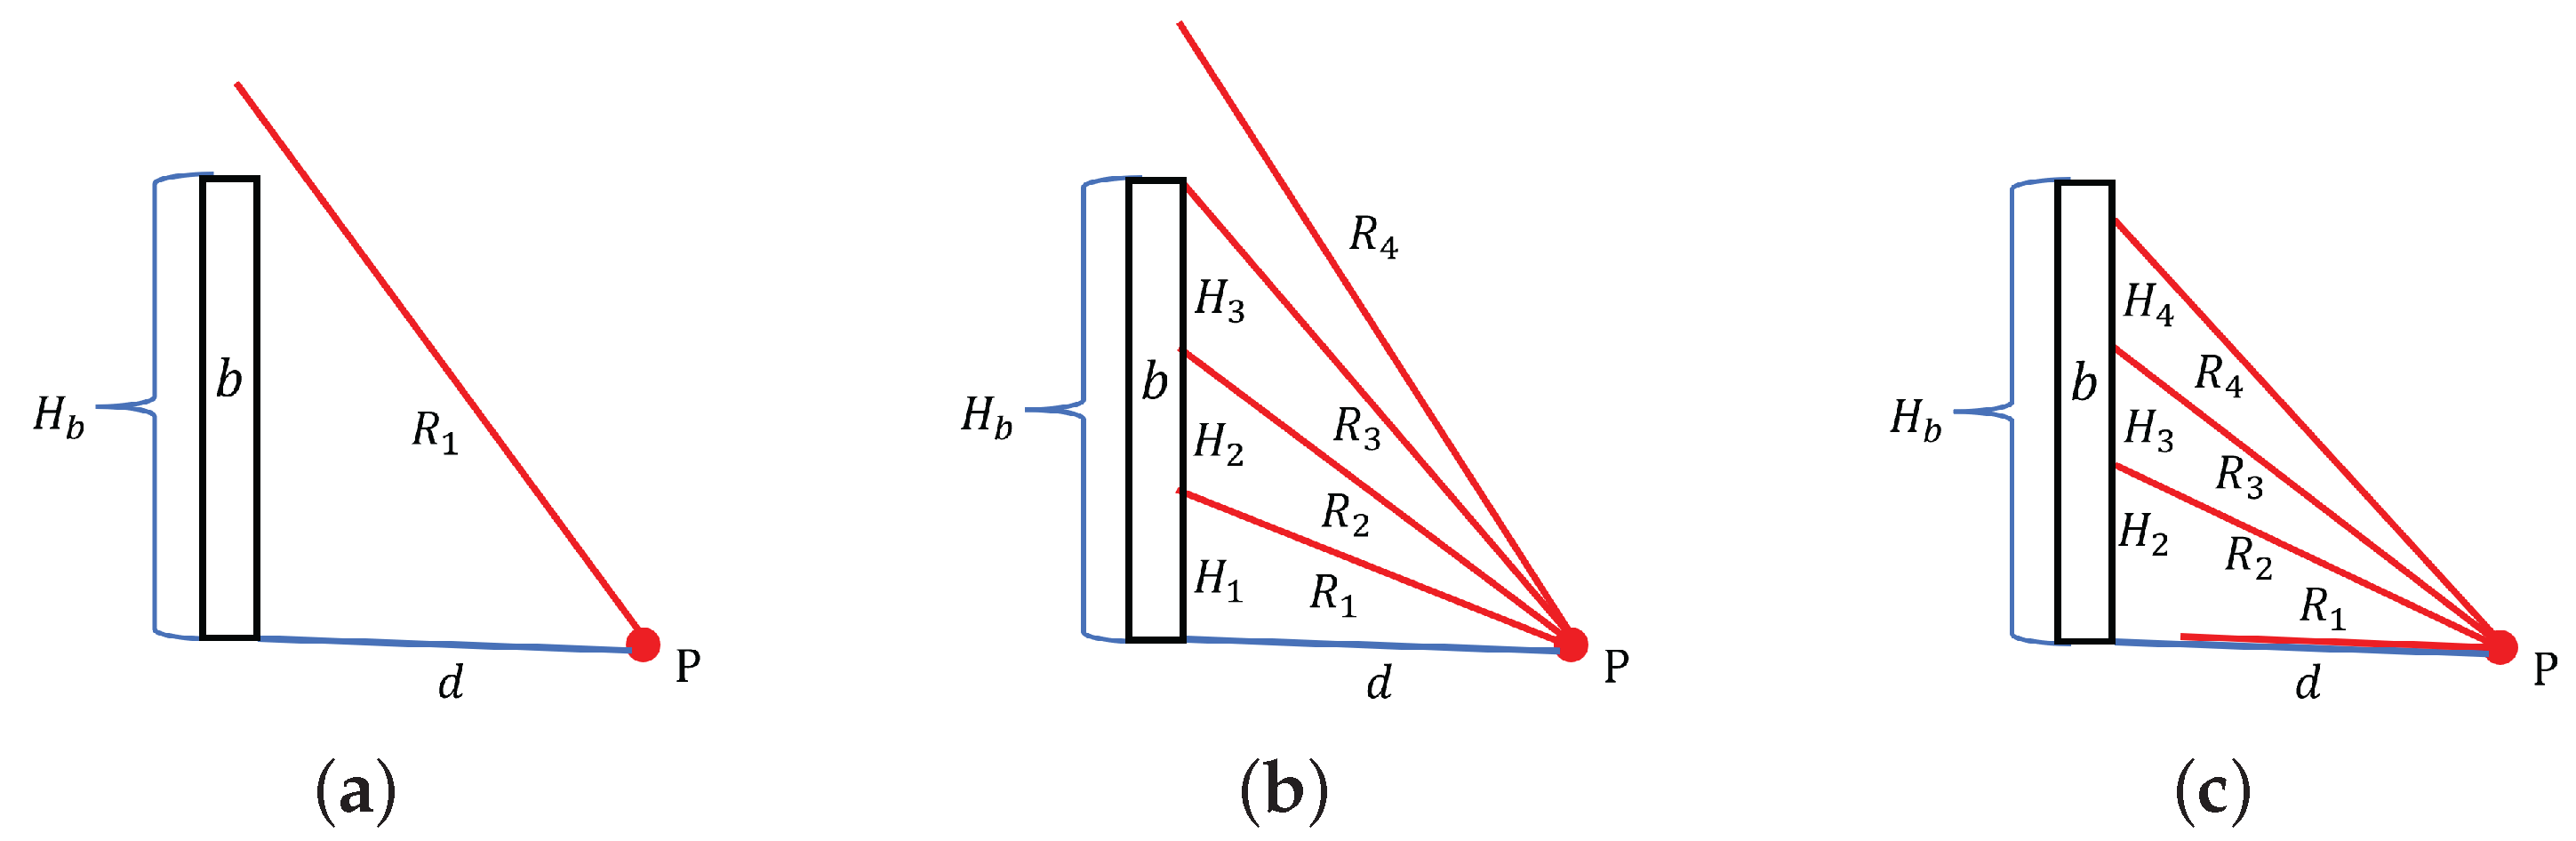
To evaluate the cost of building damage resulting from an explosion accident, we propose a Height-aware Hierarchical Building Damage (HHBD) model, which considers the damage conditions of buildings at different heights. Given an explosion point p and a building b within the explosion impact area, the damage cost of b is determined by several factors, including the distance between p and b, the height of b, the explosion influence radius, and the damage weight associated with each damage level. For instance, Figure 3 shows three general cases for the damage evaluation at different heights. Here, we simplify a building as a 2D rectangle for the convenience of illustration and computation. The proposed HHDB model is intended to compute different damage levels for different height intervals. Based on this result, it is able to calculate damage costs at different heights. The model is also extensible. For instance, in the case of a building with an irregular shape, given the areas of different floors, the damage costs are also computable, because the damage levels at different floors can be estimated using our proposed model.
In Figure 3a, the entire height of the building is within the range of , indicating that the building is affected by only one damage level, i.e., . Consequently, the damage cost of the building is computed by damage level 1. Figure 3b,c depict the cases where the building is impacted by multiple damage levels, i.e., and , respectively. Although not all possible cases are enumerated, it is a general observation that each involved damage level affects different height intervals of the building. This depends on the previous and subsequent involved damage levels. Algorithm 1 provides detailed instructions for calculating the damage cost of a given building.
The basis procedure of Algorithm 1 is that firstly, the minimum and maximum involved damage levels are calculated based on the parameters , d, and R (Lines 1–17). Then, the damage cost of each damage level is computed in ascending order (Lines 18–24). The minimum damage level for the building is established when the influence radius first exceeds d (Lines 2–8), as this is the point at which the building begins to be affected. On the other hand, the maximum damage level corresponds to the situation where the last affected height does not exceed (Line 10–16). For each damage level involved, the damage cost is calculated by the function as follows, given the damage level and the corresponding height interval :
where is the typical floor height, represents the affected area of the building in the current damage level, and denotes the housing price of the building. By default, the building damage weights are assigned as . Finally, the total damage cost for a building is calculated as the sum of the damage costs of all the damage levels involved.
| Algorithm 1: The HHBD algorithm |
|
For the three typical scenarios described in Section 2.3.1, building damage costs are computed using different methods. In the case of explosion point-based damage evaluation, the building damage cost is the total cost of all buildings within the explosion impact area. However, for road segment-based damage evaluation, the building damage cost should be adjusted by multiplying it by the ratio of the circle area with radius r to the explosion impact area. This adjustment accounts for the assumption that the explosion accident occurs only once at a single point. The formula is as follows:
where is the length of the road segment. In addition, the route-based building damage cost is defined as the or of the damage costs of road segments within the route.
2.3.4. Shelter-Aware Human Casualty (SHC) Model
According to the damage levels outlined in Table 2, there are three categories for human casualties, i.e., death, serious injury, and slight injury. Each category corresponds to an explosion impact area with an influence radius calculated using Equation (2). We propose a Shelter-aware Human Casualty (SHC) model that considers the impact of building shelters on human casualties. Based on the real-time population density data of each grid cell, the human casualty within each explosion impact area is computed as follows.
Given the total building area in the explosion impact area , and the total number of people in the explosion impact area , the number of people inside the buildings is calculated as the following equation:
As the presence of buildings can mitigate of the shock wave damage to humans, the final count of human casualties X is calculated as:
Note that the human casualties for each damage level are computed individually, and any overlapping areas are accounted for using the higher damage level. Additionally, the parameters utilized in the evaluation formula are retrieved by spatial queries from a backend spatial database to ensure efficiency, as will be discussed in the following section.
2.4. Spatial Queries
In this study, we employ the state-of-the-art spatial database, PostgreSQL [29], to integrate multi-source geospatial data and to enhance the efficiency of damage evaluation. PostgreSQL provides a spatial extension, PostGIS, which supports geospatial information services such as spatial indexing, spatial queries, and more. As described in Section 2.2, a serious of datasets are collected, including road network data, the geographic data of buildings, housing price data, and population density data. After preprocessing, the raw datasets are transformed into three datasets: Roads, Buildings, and People, which are loaded into the spatial database as data tables. We construct a spatial index for each data table based on R-tree [30], and the efficiency of these indexes will be validated in the forthcoming experiments. Furthermore, the spatial database provides a set of SQL functions for spatial computations. We outline the following spatial queries relevant to the damage evaluation process:
- Explosion point-based spatial range query: Given the explosion influence radius , the spatial query of retrieving buildings and population density values within the explosion impact area essentially involves a spatial range query as follows. Initially, we create a buffer region using the ST_Buffer function, which generates a circular region centered at point with a radius of . We subsequently check if a building or a grid containing people falls within this buffer region using the ST_Intersects function. The corresponding spatial query is detailed as follows:SELECT Buildings.*FROM Buildings, ST_Buffer(ST_MakePoint(X,Y)::geography,r_1) as bufferWHERE ST_Intersects(buildings.geom, buffer:geometry)Note that the table name of Buildings is optional; e.g., for human casualty evaluation, the table name becomes People.
- Road segment-based spatial range query: The road segment-based spatial range query is similar to the explosion point-based query, with the primary distinction being the method of buffer region generation. Given a road segment e, the explosion impact area is generated by ST_Buffer based on the geographical information of e, which is retrieved from the Roads table. The road segment-based spatial range query is structured as follows:SELECT Buildings.*FROM Buildings, RoadsWHERE Roads.rid=eAND ST_Intersects(Buildings.geom, ST_Buffer(Roads.geom::geography, r_1)::geometry)
- Human casualty region generation: Based on the defined damage levels of human casualty, i.e., death, serious injury, and slight injury, three distinct human casualty regions should be generated. The overlapping area is calculated by the higher damage level. Taking the circle region as an example, each region is generated using the ST_Buffer function as follows. The explosion influence radius for each damage level is , respectively. The ST_Difference function is used for the partition of the overlapping area.SELECT buffer_death:geometry,ST_Difference(buffer_death::geometry, buffer_serious::geometry),ST_Difference(buffer_slight::geometry, buffer_serious::geometry)FROMST_MakePoint(X, Y) as point,ST_Buffer(point::geography, r_1)as buffer_death,ST_Buffer(point::geography, r_2)as buffer_serious,ST_Buffer(point::geography, r_3)as buffer_slight
- Area computation: Area computation plays a crucial role in the damage evaluation process. For instance, in the SHC model for human casualty evaluation, we need to calculate the explosion impact area and the total building area in the explosion impact area. As an illustration of point-based explosion impact area computation, the ST_Area function is employed in the following manner:SELECT ST_Area(ST_Buffer(ST_MakePoint(X,Y)::geography,R))
In general, the explosion point-based and road segment-based spatial range queries are critical, as they acquire essential data for subsequent damage evaluation. The ST_Buffer is instrumental in generating the explosion impact area, while other spatial computation functions such as ST_Intersects, ST_Area, etc., are vital for calculating damage costs accurately.
3. Experimental Results
3.1. Case Study
For the case study, we have chosen LNG as the type of explosive material. As a typical liquid explosive, LNG may cause a large-scale explosion accident if it leaks during transportation and encounters a source of ignition. In China, there are two primary types of LNG tank cars utilized: LNG semi-trailer transport tank cars and LNG container tank cars. Different vehicles have varying transportation capacities. For instance, a 40 m3 LNG container tank car has an effective volume of 36 m3, which is equivalent to approximately 16 t in weight according to the density of LNG (0.43–0.47 kg/m3). Consequently, we have set the maximum weight of explosives at 16 t in this case study. In the subsequent sections, we demonstrate several use cases of explosion point-based damage evaluation, as well as the route planning results for explosive transportation.
The visualization results are demonstrated based on our developed GIS platform, which consists of a backend spatial database (PostgreSQL), a map server (Mapbox [31]), a Python-based query computation module, and a web-based front-end interface. According to the Report on production safety accident and regulations of investigation and treatment [32], we define four accident levels, each associated with distinct building damages and human casualties, as shown in Table 3. For visualization, different accident levels and different damage costs in buildings and humans are represented in different colors.
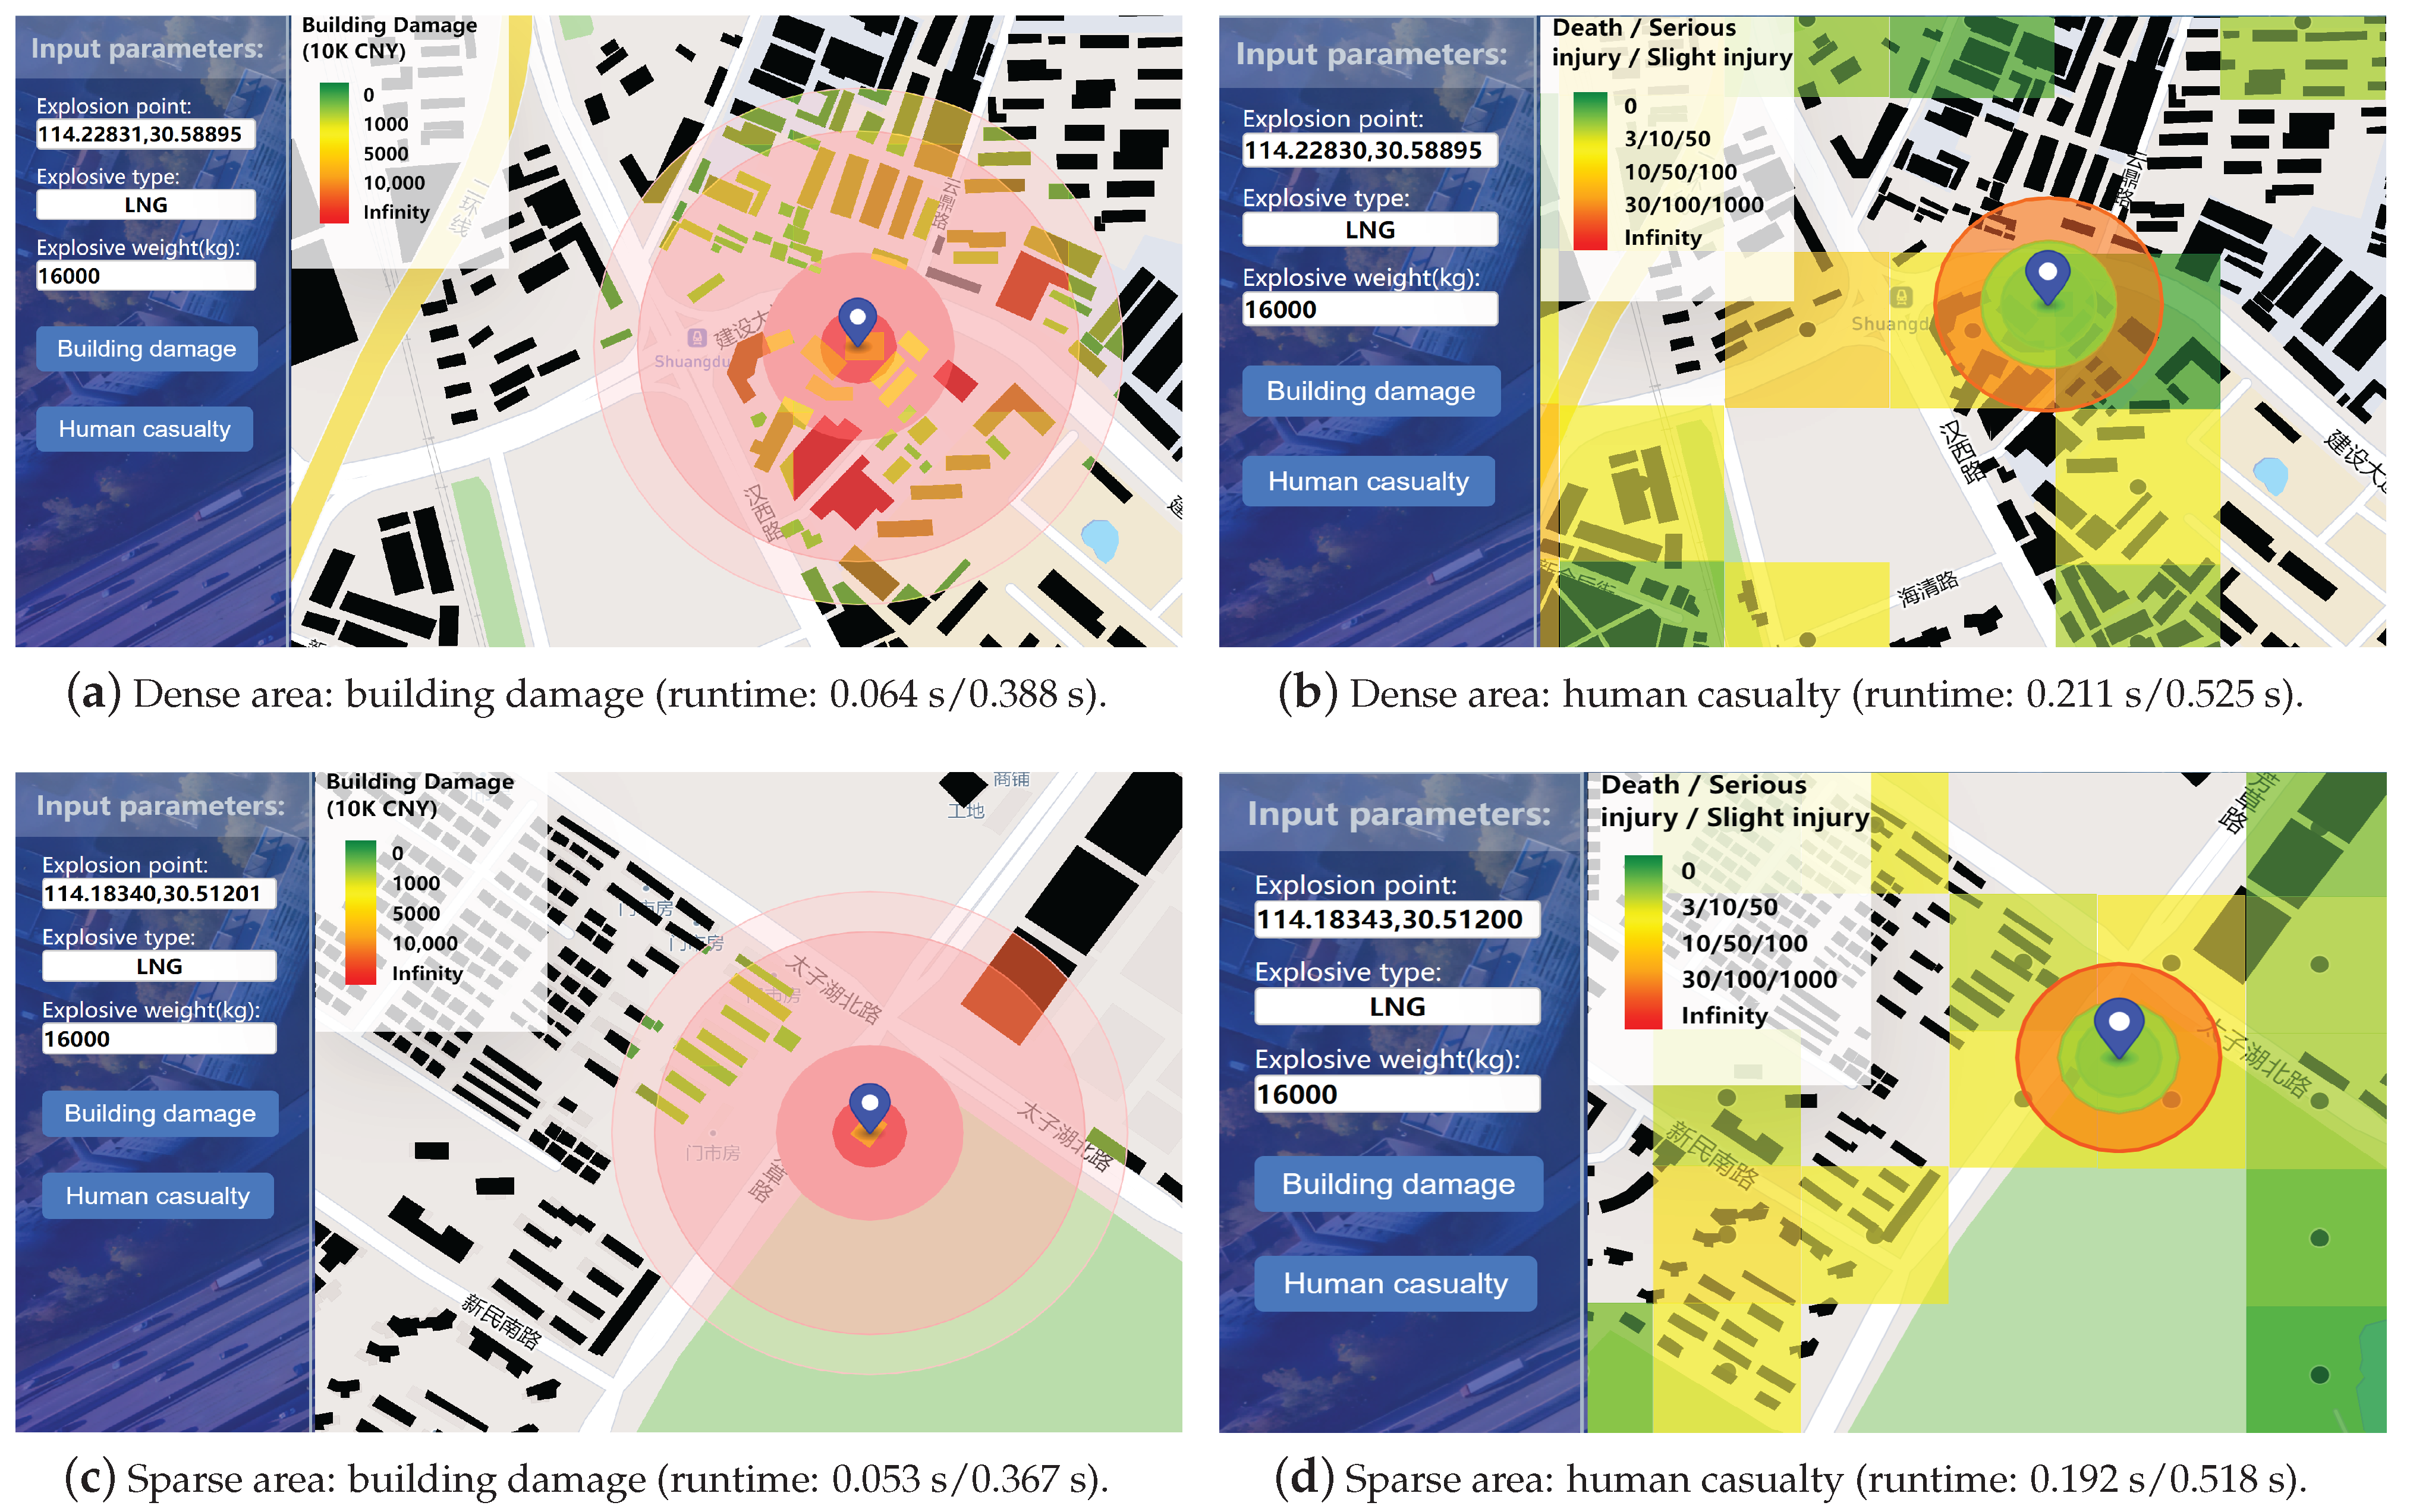
3.1.1. Explosion Point-Based Damage Visualization
Figure 4 represents the explosion point-based damage evaluation results, with the selection of an explosion point in a dense area, and a sparse area of buildings with 16 t of explosives. The colored grid on the map reflects the real-time population density within each 200 m × 200 m spatial grid. The interactive operation on the user interface is highly efficient, as verified by the execution time displayed below the figures. The total execution time includes backend computation time and visualization time, both of which are less than 1 s, with a slightly larger value for the latter.
Figure 4a,b demonstrates the building damage and human casualty results for a dense area. In Figure 4a, there are four circular regions corresponding to four building damage levels, and the colors of the buildings represent the economic costs of the buildings. The damage costs of the buildings located closer to the explosion point are generally higher than the ones that are far away from the explosion point. Besides the location, the building damage cost is also related to the height and area of the building. Compared with Figure 4c, the amount of affected buildings in a dense area is larger than the one in a sparse area, and the execution time of the dense area is slightly longer than the time of the sparse area.
Figure 4b,d shows the results for human casualties in the dense areas and the sparse areas of the buildings, respectively. In the case of thte dense areas, the human casualty results indicate [0, 0, 424], signifying the counts of deaths, serious injuries, and slight injuries, respectively. For sparse areas, the results are [0, 0, 523], illustrating the corresponding figures for each category. The higher number of slight injuries in the sparse area can be attributed to the fact that the real-time population density in this area is greater than in the dense area. Moreover, in dense areas with a high concentration of buildings, the presence of buildings acts as a shield and reduces the explosion impact on humans. In contrast, the sparse area lacks buildings within the explosion impact area, contributing to the increased casualties.
3.1.2. Route Planning for Explosives Transportation
We have designed three strategies for explosives transportation route planning: Distance-first, Building-first, and Human-first strategies. Each planning strategy utilizes a cost indicator as the weight of a road segment. To determine the route with the lowest cost, we utilize the Dijkstra algorithm [33], which finds the shortest path between two nodes in a graph. The cost indicators of the three strategies correspond to travel distance, building damage cost, and human casualties, respectively. Note that the human casualty cost is a weighted sum of the three damage levels, which is computed as follows:
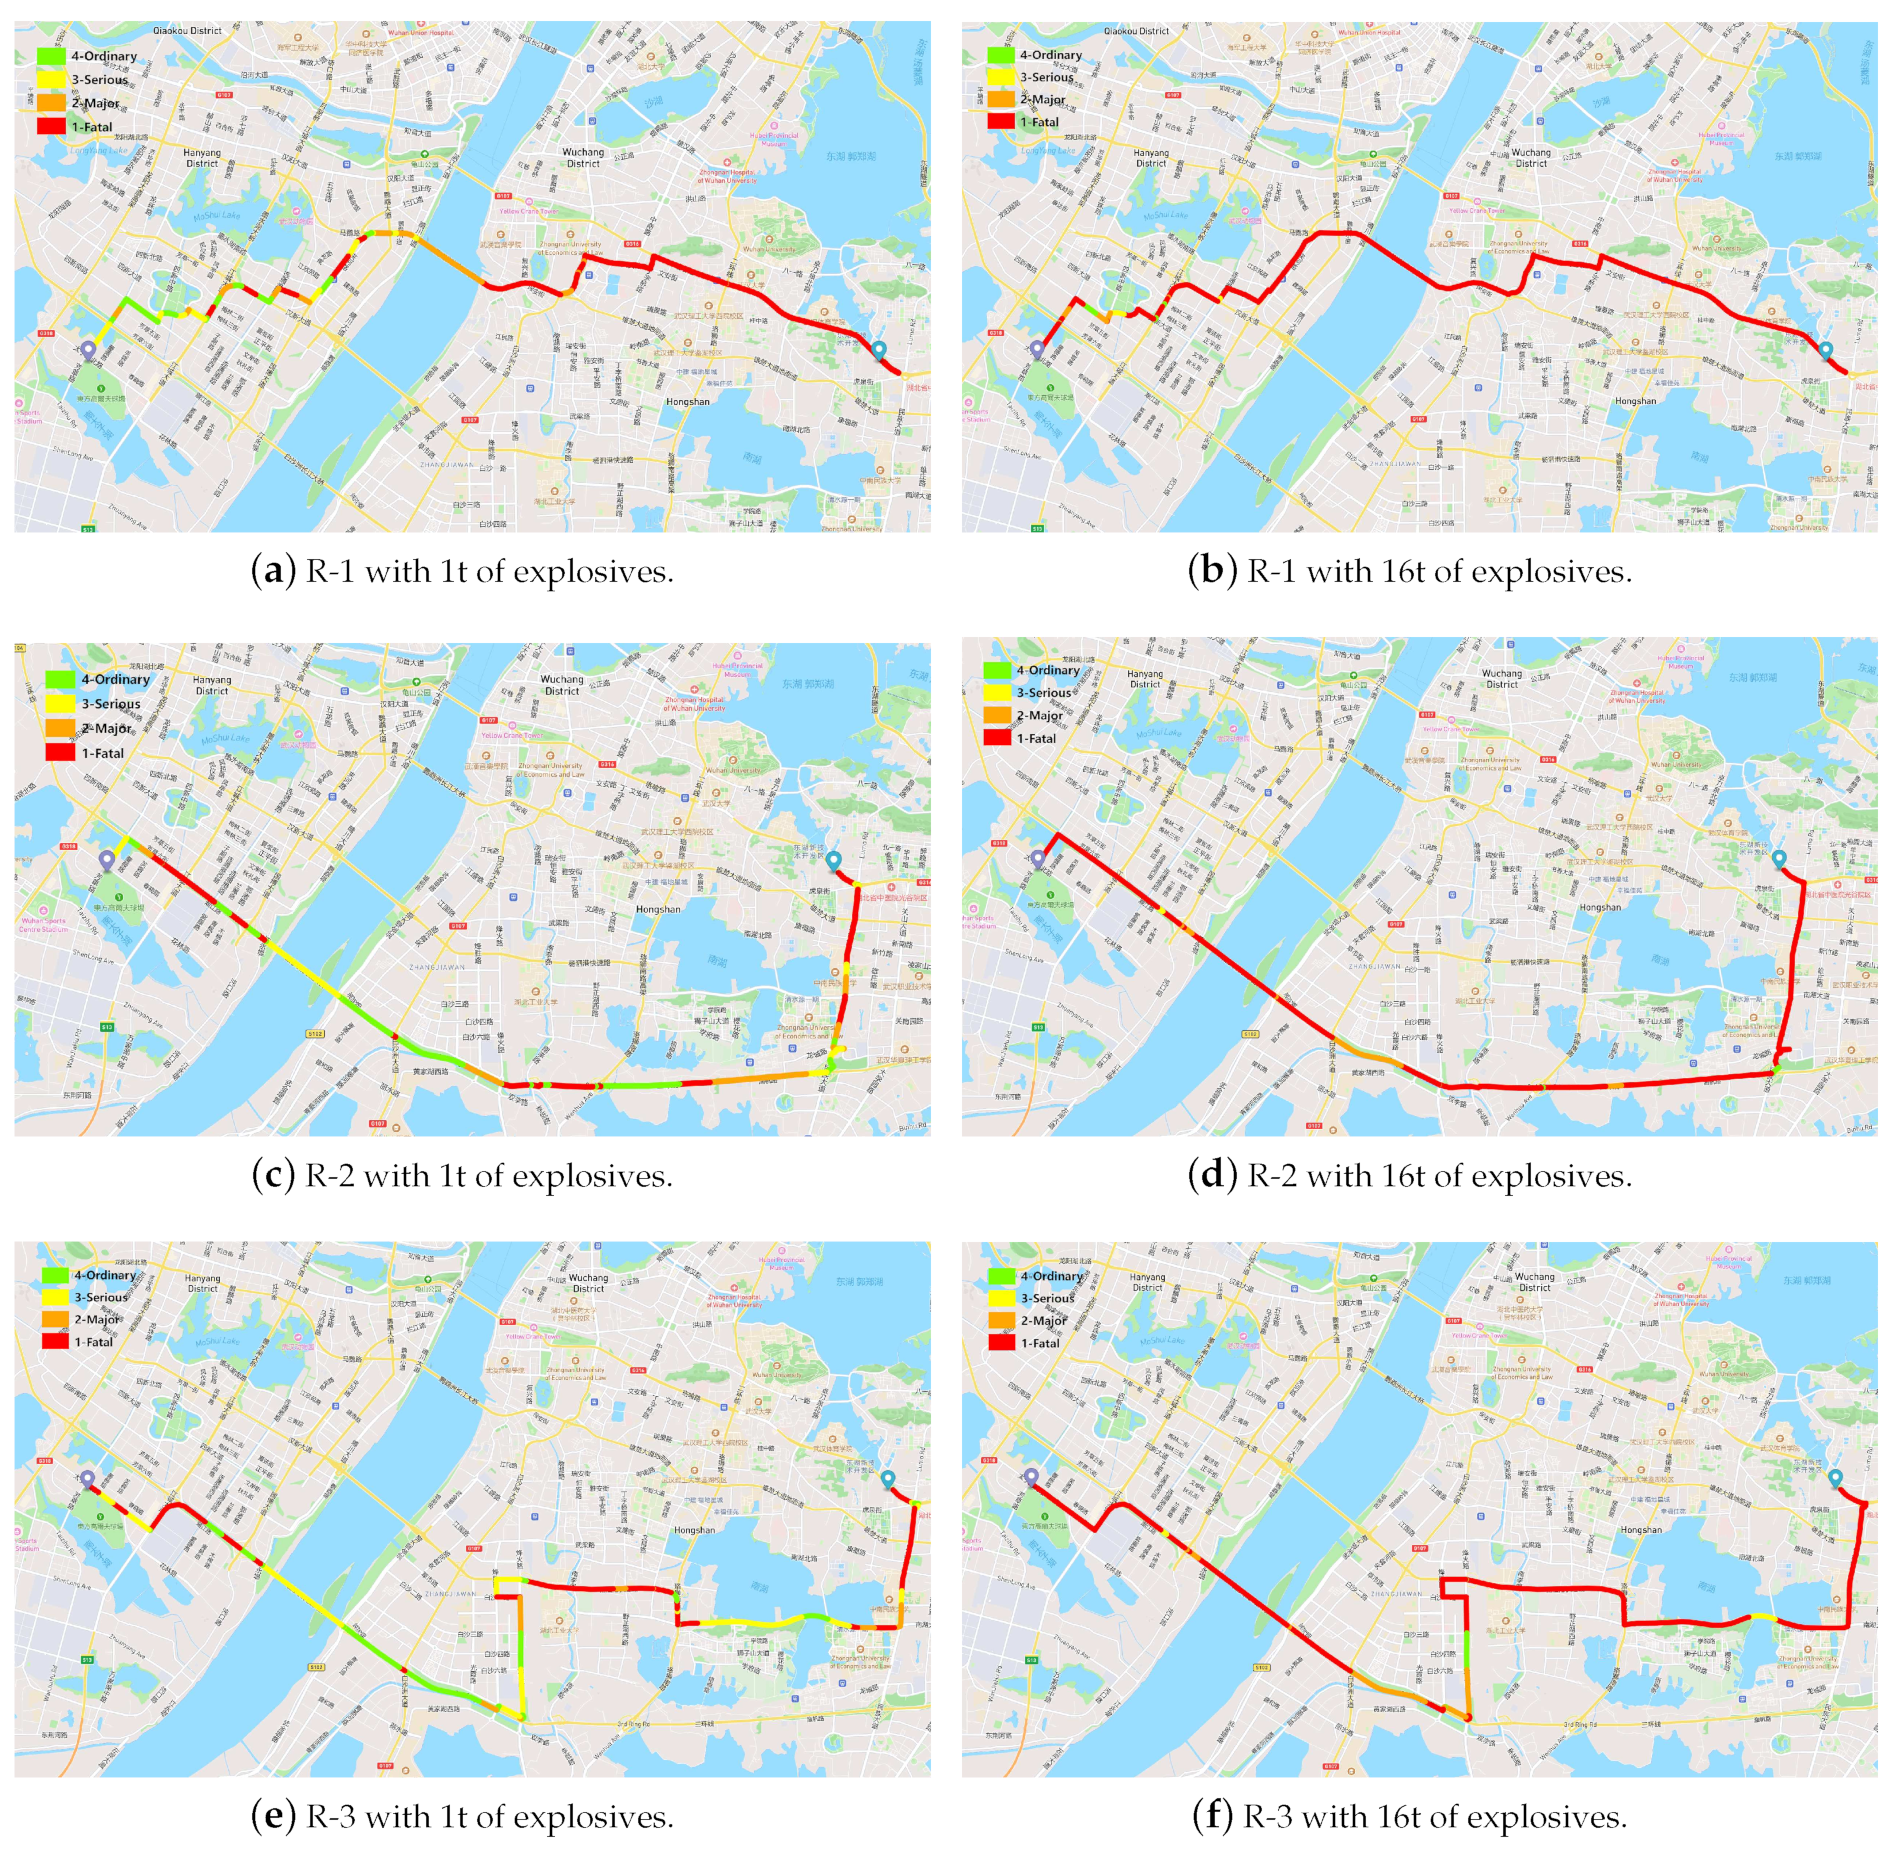
In the case study, we have established the departure time as 8 am, with the origin and destination set as Yuehua Chemical Co., Ltd. and Guotong Energy Xinxin Natural Gas Station, respectively. The weights of the explosives are configured as 1 t and 16 t for comparison. In Figure 5, R-1, R-2, and R-3 correspond to the route planning results of the Distance-first, Building-first, and Human-first strategies, respectively. The colors of the road segments indicate their respective accident levels, as indicated in the legend. It is evident that in most cases, the accident levels with 16 t explosives are more severe compared to those involving 1 t of explosives. This disparity arises because the weight of explosives directly affects the outcome of the damage evaluation.
Further details regarding the route planning results are provided in Table 4. In this context, R-1 represents the closest route with the highest building damage and human casualty costs among the options. Conversely, R-2 has the lowest building damage cost, with a slightly longer travel distance than R-1. R-3, on the other hand, encompasses the lowest rate of human casualties but the greatest travel distance. When comparing R-2 and R-3, the maximum building damage costs are identical for both routes, but the average building damage costs for R-2 are lower than those for R-3. The reason for this is that R-2 and R-3 share the road segments with the maximum building damage, while other road segments contribute varying building damage costs. It is worth highlighting that the human casualty rate varies with time as it is computed based on the real-time change in population densities. Further investigation into this aspect is conducted in the subsequent experiment.
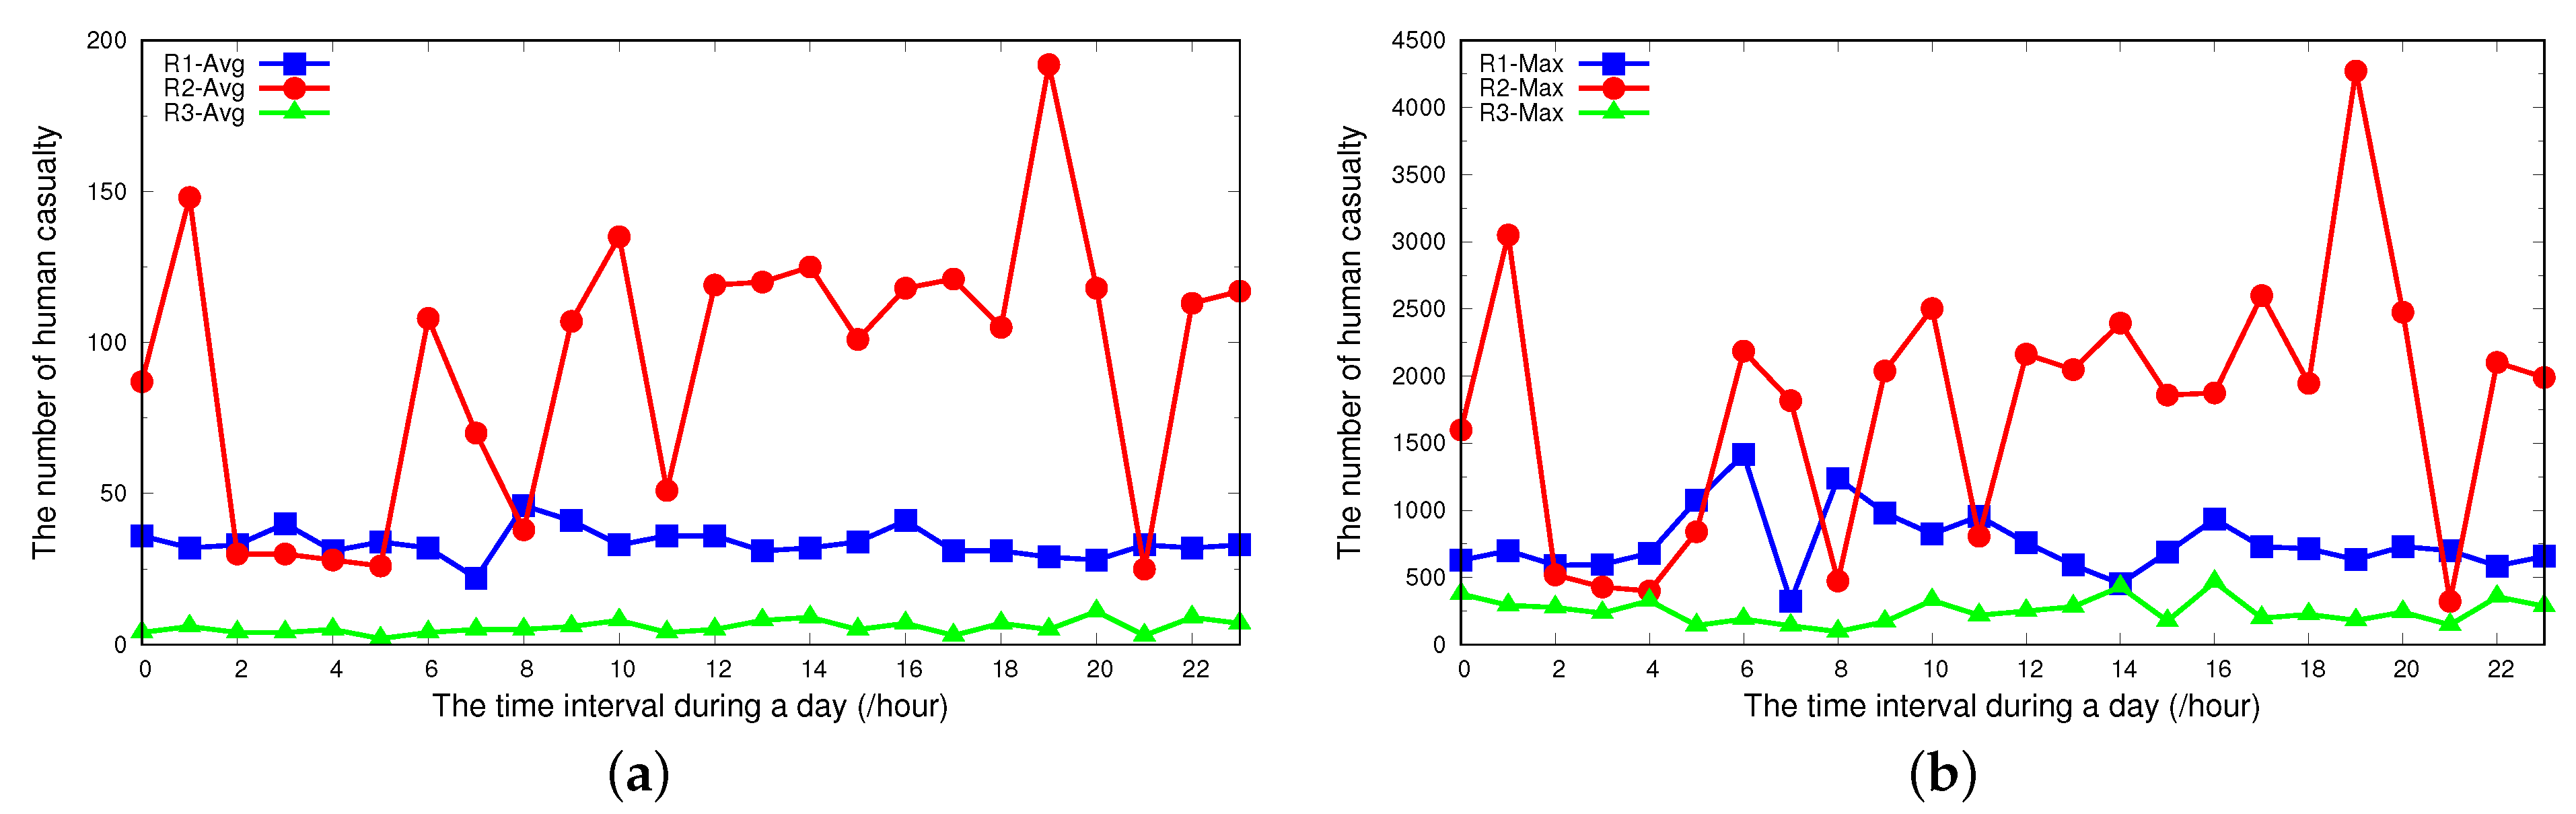
3.1.3. Human Casualties Varying over Time
Figure 6 depicts the time-dependent variations for average (left side) and maximum (right side) human casualties for the three result routes. It is shown that R-3, which employs the Human-first strategy for route planning, demonstrates remarkable stability and consistently maintains the lowest rate of human casualties. In contrast, R-1, which uses the Distance-first strategy, generally occupies the second position in terms of human casualties across most instances. Meanwhile, R-2 typically exhibits the highest rate of human casualty due to its preference for shorter distances, which inadvertently increases personnel exposure during explosion accidents. Exceptionally, during specific time intervals, namely 2:00–6:00, 8:00–9:00, and 21:00–22:00, R-2 briefly outperforms R-3. This can be attributed to the likelihood of people being concentrated indoors during these periods, reducing their exposure to potential hazards along R-2. Consequently, the Building-first strategy proves to be advantageous in scenarios where buildings hold a higher priority, or during time periods when more individuals tend to remain indoors.
3.2. Efficiency Evaluation
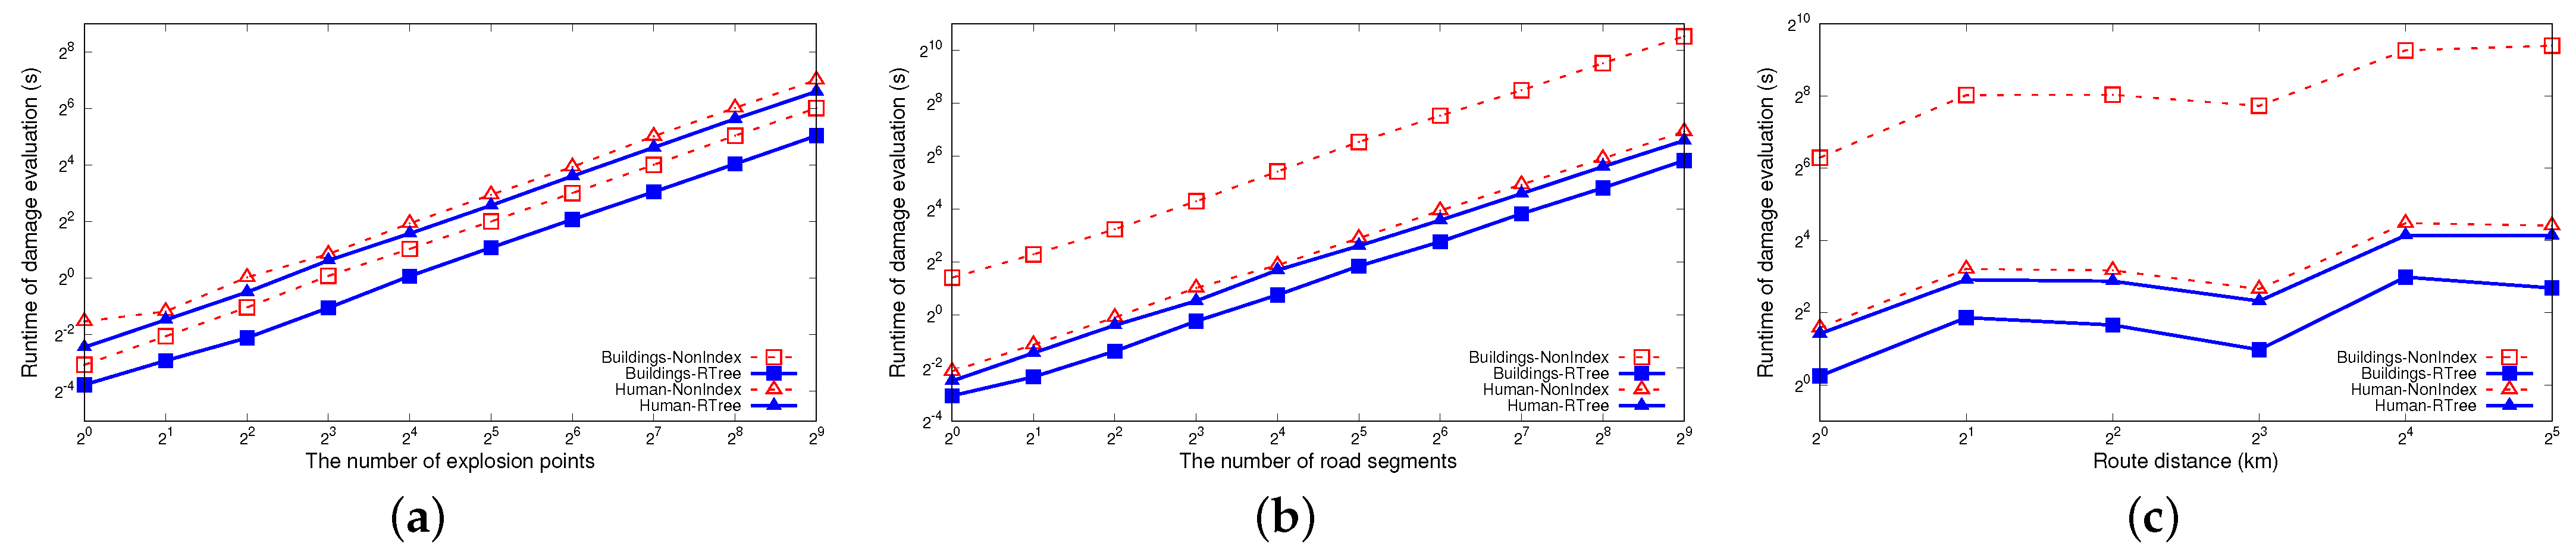
We evaluate the efficiency of the damage evaluation methods by increasing the number of explosion points and road segments, as well as the distance of a selected route. Figure 7a–c presents the execution times of the explosion point-based damage evaluation, road segment-based damage evaluation, and route-based damage evaluation, respectively. These figures clearly illustrate the advantages of employing R-Tree indexing in both building damage and human casualty evaluation methods. In Figure 7a,b, the execution time increases linearly with the growing number of explosion points and road segments. Figure 7c illustrates a gradual increase in execution time with the increase in route distance. This is caused by the variability in the road segments that constitute the selected route. Some road segments are located in bustling areas, leading to more time for damage evaluation, while others have fewer buildings and people in their vicinity, resulting in a shorter damage evaluation time.
In Figure 7b,c, the enhancement in efficiency for building damage evaluation with R-Tree indexing is more remarkable than the impact on human casualty evaluation. This disparity arises from the differing spatial distribution characteristics of buildings and people. Specifically, people density data tend to exhibit a more uniform distribution, while building data comprise irregularly distributed polygons. Consequently, when conducting spatial queries, the traversal path for accessing people density data is typically longer than that for building data. This disparity in traversal path lengths underscores the more significant impact of R-Tree indexing on building damage evaluation in comparison to human casualty evaluation.
4. Discussion
In this case study, we demonstrated the visualization results of explosion damage evaluation and damage-aware route planning based on the developed GIS platform. We summarize the findings of the experiments as follows:
- The interactive visualization of the GIS platform enables real-time explosion damage evaluation through a user-friendly interface and efficient query computation. In the case study, we observed that the execution time for the explosion point-based damage evaluation typically remained below 1 s.
- The scalabilities of the explosion point-based, road segment-based, and route-based damage evaluation methods was verified by increasing the number of explosion points, the number of road segments and the distance of a selected route. Notably, the utilization of R-Tree spatial indexing has proven instrumental in enhancing the efficiency of these damage evaluation methods. Furthermore, it is worth highlighting that the efficiency gains achieved through R-Tree indexing are more pronounced when applied to building data as compared to people density data. This discrepancy is attributed to the fact that the distribution of buildings exhibits a greater irregularity compared to the people density data.
- For route planning, it is crucial to recognize that various strategies are better suited for different scenarios. The Distance-first strategy prioritizes finding the shortest path but does not consider the associated costs of damage to buildings and human casualties. The Human-first strategy performs well on human casualties, albeit at the expense of potentially longer distances. Lastly, the Building-first strategy proves to be most effective when prioritizing the protection of buildings, or during time periods when a significant portion of people tend to remain indoors.
Based on the above findings, the main contributions of this paper are as follows:
- Firstly, we formalized three typical scenarios of damage evaluation for explosive road transportation and defined the corresponding explosion impact area for each scenario.
- Secondly, we proposed an HHBD model and an SHC model for building damage and human casualty evaluation, respectively. The HHBD model considers different building damages at different heights, while the SHC model considers the impact of building shelters based on real-time population density data.
- We also developed a GIS platform that integrates multi-source geospatial data and that enables efficient geospatial computation and map-based interactive visualization.
- Finally, a case study of liquefied natural gas (LNG) transportation in Wuhan, China, was demonstrated to verify the effectiveness and efficiency of the proposed methods.
5. Conclusions
This study introduced a GIS-based method for evaluating damage consequences resulting from accidents during the road transportation of explosives. We formalized three typical scenarios for damage evaluation, and we propose the HHBD model and the SHC models, which are designed to evaluate building damages and human casualties in the event of an explosion accident. Furthermore, a GIS platform was developed to facilitate experiments, and a case study was demonstrated to show the user-friendly and interactive interface of the system. The efficiency and scalability of our damage evaluation methods have been verified in the experiments. Regarding damage-aware route planning, experimental results indicated that different strategies are suitable for different scenarios. These research results provided valuable support for the decision-making process in the domains of explosive transportation safety warnings and emergency response procedures.
However, there are still several limitations in explosion damage evaluation and safety route planning. For explosion damage evaluation, more comprehensive evaluation models are in demand, such as damage models for buildings with complex structures and different positions, as well as real-time damage evaluation for vehicles around the transport vehicle. Moreover, traffic condition is also an important factor that must be considered in both explosion damage evaluation and safety route planning. This is because poor traffic conditions, such as traffic congestion, can increase the transportation risk and delay the arrival time of the transport vehicle.
Therefore, in the future, we plan to investigate more comprehensive damage evaluation models for the surrounding buildings and vehicles. This includes evaluation models considering how buildings with varied shapes and orientations affect the damage consequence, as well as how an explosion accident affects the surrounding vehicles. We will consider incorporating traffic conditions as a factor in both damage evaluation and route planning, as it can significantly impact upon the densities of vehicles around the transport vehicle and the transportation velocity. Understanding how traffic conditions influence the explosion consequences and how they can be leveraged to optimize safety route planning are important issues that require further exploration.
Author Contributions
Conceptualization, Jing Zhao and Jinshan Sun; methodology, Jing Zhao and Xi Guo; software, Ning Liu and Junhui Li; validation, Ning Liu and Jing Zhao; formal analysis, Jing Zhao; investigation, Jing Zhao; resources, Hongtao Deng; data curation, Ning Liu; writing—original draft preparation, Jing Zhao; writing—review and editing, Jinshan Sun and Xi Guo; visualization, Junhui Li; supervision, Jinshan Sun; project administration, Jing Zhao; funding acquisition, Jinshan Sun. All authors have read and agreed to the published version of the manuscript.
Funding
This research was funded by the Key-Area Research and Development Program of Hubei Province (Grant number: 2020BCA084); State Key Laboratory of Precision Blasting, Jianghan University (Grant number: PBSKL2022304); and the Natural Science Foundation of Hubei Province, China (Grant number: 2023AFB472).
Data Availability Statement
Data available in a publicly accessible repository that does not issue DOIs. Publicly available datasets were analyzed in this study. This data can be found from links shown in Table 1.
Conflicts of Interest
The authors declare no conflict of interest.
Appendix A
According to the 1000 kg TNT explosion experiment, varying distances from the explosion point lead to different explosion shock wave overpressures, as illustrated below.
Table A1.
The explosion shock wave overpressures of 1000 kg TNT over different distances.
| (m) | 5 | 6 | 7 | 8 | 9 | 10 | 12 | 14 | 16 | 18 | 20 |
|---|---|---|---|---|---|---|---|---|---|---|---|
| (MPa) | 2.94 | 2.06 | 1.67 | 1.27 | 0.95 | 0.76 | 0.50 | 0.33 | 0.235 | 0.17 | 0.126 |
| (m) | 25 | 30 | 35 | 40 | 45 | 50 | 55 | 60 | 65 | 70 | 75 |
| (MPa) | 0.079 | 0.057 | 0.043 | 0.033 | 0.027 | 0.0235 | 0.0205 | 0.018 | 0.016 | 0.0143 | 0.013 |
In reference to [2], Table A2 and Table A3 detail the damage degrees for buildings and humans, corresponding to different explosion shock wave overpressures.
Table A2.
The building damage degrees by the explosion shock wave overpressures.
| Shock Wave Overpressure (MPa) | Building Damage Degree |
|---|---|
| Partial crushing of door and window glass. | |
| Greatest pressure, resulting in broken door and window glass. | |
| Door frame damaged. | |
| Cracks appear on the wall. | |
| Large cracks appear on the wall or house tiles fall. | |
| Broken pillars in wooden building factory buildings | |
| or room frames loosen. | |
| Brick wall collapses. | |
| Shockproof reinforced concrete destroyed | |
| or small houses collapse. | |
| Large steel frame structures destroyed. |
Table A3.
The degrees of human casualty according to the explosion shock wave overpressures.
| Shock Wave Overpressure (MPa) | Human Casualty Degree |
|---|---|
| Slight injury | |
| Serious injury | |
| Severe visceral injury or death |
References
- Wu, Z.; Duo, Y.; Liu, M.; Gao, J.; Wei, L. A study on the methods of risk assessment of hazardous materials during road-transportation. J. Basic Sci. Eng. 2004, 12, 36–44. [Google Scholar]
- Song, Y.; Yu, L.; Li, C. TNT equivalent method predicts the consequence that some petrochemical industry equipment explodes. J. Saf. Sci. Technol. 2005, 1, 66–68. [Google Scholar]
- Li, G.; Pu, G.; Yang, J.; Jiang, X. A multidimensional quantitative risk assessment framework for dense areas of stay points for urban HazMat vehicles. Reliab. Eng. Syst. Saf. 2024, 241, 109637. [Google Scholar] [CrossRef]
- Chen, G.H.; Liang, T.; Zhang, H.; Yan, W.W.; Chen, Q.G. Quantitative Risk Assessment of Liquefied Chlorine Leakage Accident via SAFETI. J. South China Univ. Technol. Sci. Ed. 2006, 34, 103–108. [Google Scholar]
- Liu, X. Risk Assessment of Highway Transportation of Gaseous Chemicals. Master’s Thesis, Beijing Jiaotong University, Beijing, China, 2017. [Google Scholar]
- Zhang, M. Research on Accident Consequences and Risk Analysis Model of Hazardous Chemicals Transportation by Road. Ph.D. Thesis, Capital University of Economics and Business, Beijing, China, 2019. [Google Scholar]
- Zhang, J.; Hodgson, J.; Erkut, E. Using GIS to assess the risks of hazardous materials transport in networks. Eur. J. Oper. Res. 2000, 121, 316–329. [Google Scholar] [CrossRef]
- Ak, R.; Bozkaya, B. A proposed risk model and a GIS framework for hazardous materials transportation. In Proceedings of the 2008 IEEE International Engineering Management Conference, Estoril, Portugal, 28–30 June 2008; pp. 1–5. [Google Scholar]
- Li, R.; Leung, Y. Multi-objective route planning for dangerous goods using compromise programming. J. Geogr. Syst. 2011, 13, 249–271. [Google Scholar] [CrossRef]
- Cordeiro, F.G.; Bezerra, B.S.; Peixoto, A.S.P.; Ramos, R.A.R. Methodological aspects for modeling the environmental risk of transporting hazardous materials by road. Transp. Res. Part D Transp. Environ. 2016, 44, 105–121. [Google Scholar] [CrossRef]
- Noguchi, H.; Omachi, T.; Seya, H.; Fuse, M. A GIS-based risk assessment of hydrogen transport: Case study in Yokohama City. Int. J. Hydrogen Energy 2021, 46, 12420–12428. [Google Scholar] [CrossRef]
- Ak, R.; Bahrami, M.; Bozkaya, B. A time-based model and GIS framework for assessing hazardous materials transportation risk in urban areas. J. Transp. Health 2020, 19, 100943. [Google Scholar] [CrossRef]
- Guo, J.; Luo, C. Risk assessment of hazardous materials transportation: A review of research progress in the last thirty years. J. Traffic Transp. Eng. (Engl. Ed.) 2022, 9, 571–590. [Google Scholar] [CrossRef]
- Huang, B.; Cheu, R.L.; Liew, Y.S. GIS and genetic algorithms for HAZMAT route planning with security considerations. Int. J. Geogr. Inf. Sci. 2004, 18, 769–787. [Google Scholar] [CrossRef]
- AlRukaibi, F.; Alrukaibi, D.; Alkheder, S.; Alojaiman, S.; Sayed, T. Optimal route risk-based algorithm for hazardous material transport in Kuwait. J. Loss Prev. Process Ind. 2018, 52, 40–53. [Google Scholar] [CrossRef]
- Goforth, E.; Ezzeldin, M.; El-Dakhakhni, W.; Wiebe, L.; Mohamed, M. Network-of-networks framework for multimodal hazmat transportation risk mitigation: Application to used nuclear fuel in Canada. J. Hazard. Toxic Radioact. Waste 2020, 24, 04020016. [Google Scholar] [CrossRef]
- Campos, V.; Bandeira, R.; Bandeira, A. A method for evacuation route planning in disaster situations. Procedia-Soc. Behav. Sci. 2012, 54, 503–512. [Google Scholar] [CrossRef]
- Li, J.j.; Zhu, H.y. A risk-based model of evacuation route optimization under fire. Procedia Eng. 2018, 211, 365–371. [Google Scholar] [CrossRef]
- No, W.; Choi, J.; Park, S.; Lee, D. Balancing hazard exposure and walking distance in evacuation route planning during earthquake disasters. ISPRS Int. J. Geo-Inf. 2020, 9, 432. [Google Scholar] [CrossRef]
- Parajuli, G.; Neupane, S.; Kunwar, S.; Adhikari, R.; Acharya, T.D. A GIS-Based Evacuation Route Planning in Flood-Susceptible Area of Siraha Municipality, Nepal. ISPRS Int. J. Geo-Inf. 2023, 12, 286. [Google Scholar] [CrossRef]
- Verter, V.; Kara, B.Y. A path-based approach for hazmat transport network design. Manag. Sci. 2008, 54, 29–40. [Google Scholar] [CrossRef]
- Dadkar, Y.; Jones, D.; Nozick, L. Identifying geographically diverse routes for the transportation of hazardous materials. Transp. Res. Part E: Logist. Transp. Rev. 2008, 44, 333–349. [Google Scholar] [CrossRef]
- Pradhananga, R.; Taniguchi, E.; Yamada, T.; Qureshi, A.G. Bi-objective decision support system for routing and scheduling of hazardous materials. Socio-Econ. Plan. Sci. 2014, 48, 135–148. [Google Scholar] [CrossRef]
- Correia, D.; Gomes, M.C.; Gonçalves, A.B.; Shrubsall, S. Optimization of Routes for Hazardous Materials Transportation—A Case Study of Fuel Deliveries in Lisbon. In Proceedings of the International Conference on Operations Research and Enterprise Systems, Rome, Italy, 23–25 February 2016; Volume 2, pp. 357–361. [Google Scholar]
- Chiou, S.W. A risk-averse signal setting policy for regulating hazardous material transportation under uncertain travel demand. Transp. Res. Part D Transp. Environ. 2017, 50, 446–472. [Google Scholar] [CrossRef]
- Wang, N.; Zhang, M.; He, Z. A review of researches on vehicle routing optimization for hazardous materials transportation. J. Hebei Univ. Technol. 2021, 50, 60–68. [Google Scholar]
- OpenStreetMap. 2004. Available online: https://www.openstreetmap.org/ (accessed on 17 September 2023).
- ESRI ArcGIS. Arcmap. 2020. Available online: https://www.esri.com/en-us/arcgis/products/arcgis-desktop/resources (accessed on 17 September 2023).
- Momjian, B. PostgreSQL: Introduction and Concepts; Addison-Wesley: New York, NY, USA, 2001; Volume 192. [Google Scholar]
- Beckmann, N.; Kriegel, H.P.; Schneider, R.; Seeger, B. The R*-tree: An efficient and robust access method for points and rectangles. In Proceedings of the 1990 ACM SIGMOD International Conference on Management of Data, Atlantic City, NJ, USA, 23–25 May 1990; pp. 322–331. [Google Scholar]
- Mapbox. 2010. Available online: https://www.mapbox.com/ (accessed on 17 September 2023).
- The State Council of China. Report on Production Safety Accident and Regulations of Investigation and Treatment. 2007. Available online: https://www.chinacourt.org/law/detail/2007/04/id/116871.shtml (accessed on 17 August 2023).
- Dijkstra, E.W. A note on two problems in connexion with graphs. In Edsger Wybe Dijkstra: His Life, Work, and Legacy; Morgan & Claypool: San Rafael, CA, USA, 2022; pp. 287–290. [Google Scholar]
Figure 1.
The distribution of population and buildings in Wuhan using a Mapbox base map. The upper right corner represents the population distribution of the center area (highlighted in blue square) within a 200 m × 200 m grid size over 8:00–9:00 on 30 July 2022. The lower right corner shows the distribution of buildings in the center area.

Figure 3.
Instances of HHBD model: (a) the building is only affected by ; (b) the building is affected by damage levels ; (c) the building is affected by damage levels .
Figure 3.
Instances of HHBD model: (a) the building is only affected by ; (b) the building is affected by damage levels ; (c) the building is affected by damage levels .

Figure 4.
Instances of explosion point-based damage evaluation: (a,b) damage evaluation at a dense area of buildings (explosion point: PetroChina Jiangzhuan Shuangdun Natural Gas Station); (c,d) damage evaluation within a sparse area of buildings (explosion point: Guotong Energy Xinxin Natural Gas Station). (Runtime: backend time/total time).

Figure 5.
The results of route planning using different strategies with different weights of explosives: (a,b) Distance-first strategy; (c,d) Building-first strategy; (e,f) Human-first strategy.
Figure 5.
The results of route planning using different strategies with different weights of explosives: (a,b) Distance-first strategy; (c,d) Building-first strategy; (e,f) Human-first strategy.

Figure 6.
Human casualties of result routes during different time periods (per hour): (a) the average values of human casualty costs; (b) the maximum values of human casualty costs.
Figure 6.
Human casualties of result routes during different time periods (per hour): (a) the average values of human casualty costs; (b) the maximum values of human casualty costs.

Figure 7.
Execution time of damage evaluation: (a) explosion point-based damage evaluation; (b) road segment-based damage evaluation; (c) route-based damage evaluation.
Figure 7.
Execution time of damage evaluation: (a) explosion point-based damage evaluation; (b) road segment-based damage evaluation; (c) route-based damage evaluation.

Table 2.
Damage levels with corresponding shock wave overpressure.
| Damage Level | Description | Shock Wave Overpressure (MPa) | Standard Distance (m) | |
|---|---|---|---|---|
| Building damage | 1 | Complete destruction | ||
| 2 | Serious damage | |||
| 3 | Moderate damage | |||
| 4 | Minor damage | |||
| Human casualty | 1 | Death | ||
| 2 | Serious injury | |||
| 3 | Slight injury |
Table 3.
Accident levels with corresponding economic and personnel losses.
| Accident Levels | Description | Building Damages (10K) | Human Casualties |
|---|---|---|---|
| 1 | Fatal | Death: | |
| Serious injury: | |||
| 2 | Serious | [5000, 10,000) | Death: |
| Serious injury: | |||
| 3 | Major | [1000, 5000) | Death: |
| Serious injury: | |||
| 4 | Ordinary | Death: | |
| Serious injury: |
Table 4.
Route Planning Results.
| Routes | Planning Strategy | Distance (km) | Weight (t) | Building Damage (10K CNY) | Human Casualties |
|---|---|---|---|---|---|
| R-1 | Distance-first | 29.5 | 1 | Max: 93,766 | Max: 1238 |
| Avg: 16,895 | Avg: 46 | ||||
| 16 | Max: 453,287 | Max: 8227 | |||
| Avg: 148,932 | Avg: 430 | ||||
| R-2 | Building-first | 32.7 | 1 | Max: 41,162 | Max: 473 |
| Avg: 3687 | Avg: 38 | ||||
| 16 | Max: 377,479 | Max: 1127 | |||
| Avg: 55,474 | Avg: 236 | ||||
| R-3 | Human-first | 36.4 | 1 | Max: 41,162 | Max: 97 |
| Avg: 6487 | Avg: 5 | ||||
| 16 | Max: 377,479 | Max: 570 | |||
| Avg: 83,331 | Avg: 117 |
Disclaimer/Publisher’s Note: The statements, opinions and data contained in all publications are solely those of the individual author(s) and contributor(s) and not of MDPI and/or the editor(s). MDPI and/or the editor(s) disclaim responsibility for any injury to people or property resulting from any ideas, methods, instructions or products referred to in the content. |
© 2023 by the authors. Licensee MDPI, Basel, Switzerland. This article is an open access article distributed under the terms and conditions of the Creative Commons Attribution (CC BY) license (https://creativecommons.org/licenses/by/4.0/).
Share and Cite
MDPI and ACS Style
Zhao, J.; Liu, N.; Li, J.; Guo, X.; Deng, H.; Sun, J. A GIS-Based Damage Evaluation Method for Explosives Road Transportation Accidents. ISPRS Int. J. Geo-Inf. 2023, 12, 470. https://doi.org/10.3390/ijgi12120470
AMA Style
Zhao J, Liu N, Li J, Guo X, Deng H, Sun J. A GIS-Based Damage Evaluation Method for Explosives Road Transportation Accidents. ISPRS International Journal of Geo-Information. 2023; 12(12):470. https://doi.org/10.3390/ijgi12120470
Chicago/Turabian StyleZhao, Jing, Ning Liu, Junhui Li, Xi Guo, Hongtao Deng, and Jinshan Sun. 2023. "A GIS-Based Damage Evaluation Method for Explosives Road Transportation Accidents" ISPRS International Journal of Geo-Information 12, no. 12: 470. https://doi.org/10.3390/ijgi12120470
Note that from the first issue of 2016, this journal uses article numbers instead of page numbers. See further details here.