Abstract
Climate change seriously threatens human systems, properties and livelihoods. Global projections suggest a continuous increase in the frequency and severity of weather events, with severe outcomes. Although the trends and impacts are highly variable depending on location, most studies tend to concentrate on either the urban or rural areas, with little focus on peri-urban areas. Yet, in Sub-Saharan Africa, peri-urban areas display unique characteristics: inadequate infrastructure, unplanned development, weak governance, and environmental degradation, all of which exacerbate flood impact and thus need academic attention. This study contributes to filling this gap by assessing the flood vulnerability of roads in peri-urban Accra and its implications for mobility. Based on the fieldwork, the study delineated and analysed potential zones within the research locations. The researchers calculated roads’ absolute and relative lengths, using a spatial overlay (intersection) of potentially flooded roads with the total road network within the grid cells of 500 m by 500 m. These measures were adopted and used as exposure measures. The findings revealed that over 80% of roads with lengths between 100 m and 500 m were exposed to floods. Some areas had higher exposure indices, with absolute road lengths ranging from 1.5 km to 3.2 km and relative road lengths between 0.8 and 1.0. There were significant variations in road exposure between and within neighbourhoods. Depending on the depth and duration of the floodwater, residents may be unable to access their homes or carry out their daily activities. In conclusion, this study highlights the differential vulnerability of peri-urban areas to road flooding and recommends targeted provision of flood-resilient infrastructure to promote sustainable development.
1. Introduction
Climate change is today one of the most significant global risks and, therefore, calls for the immediate attention of all stakeholders [1]. There is sufficient evidence of increased incidence of extreme climatic events such as high precipitation, frequent and severe flooding, high temperatures, and droughts [2,3]. The impact of these extreme events including flooding is uneven across the globe, with developing countries receiving the gravest brunt [4]. In the year 2022, a total of 387 natural hazards and disasters were recorded worldwide, resulting in the loss of 30,704 lives and affecting approximately 185 million people. The economic impact was estimated at USD 223.8 billion [5]. It was found that Africa was significantly affected by these disasters, with 16.4% of the recorded deaths compared to 3.8% in the previous two decades. Climate change was identified as a major factor, acting as a risk multiplier and exacerbating the impact of extreme weather events, as well as making them more unpredictable and increasing vulnerabilities [6]. From January 2021 to September 2022, it was reported that 4% of the African population, equivalent to 52 million people, were severely affected by droughts or floods [7,8,9,10].
The rapid urbanisation of cities within the sub-region [11,12] has led to increased vulnerability to meteorological and hydrological events in peri-urban areas. This is due to their specific characteristics, such as the growth of urban poverty and the proliferation of informal settlements, unplanned and unregulated land use, weak environmental controls, and poor enforcement of building standards [13]. As a result, the people, property, and infrastructure in these areas are at risk. Africa, with an annual population growth rate of 3.3–3.7%, is considered the most vulnerable region in the world. The continent faces losses of USD 7–15 billion per year, which could increase to USD 50 billion per year in a business-as-usual scenario [6,14,15]. Despite scientific and technological advancements in Ghana, peri-urban areas still face high vulnerability to flooding [16] and implementing effective risk reduction strategies remains a challenge [17]. These areas are known for their extreme poverty and marginalisation [18,19,20].
Indeed, most recent studies [21] have confirmed that peri-urban Accra are experiencing uncontrolled urbanisation resulting in haphazard and unplanned developments. Some of these developments are even encroaching on sensitive lands [16]. This is often due to a lack of knowledge and understanding of the vulnerabilities, coupled with insufficient funding for mitigation plans [22]. In light of the increasing incidences of extreme climatic events, there is a pressing need to comprehensively understand the various dimensions of vulnerability. This study supports the notion that a lack of understanding in this regard poses a significant challenge [23]. While there has been some research on the resilience of transport infrastructure to multiple hazards [24,25,26], the majority of these studies have focused on the global North. In contrast, little attention has been given to the vulnerable situation in peri-urban areas, particularly in Africa, where inadequate and inefficient road networks are prevalent [27].
Furthermore, it is not enough to rely solely on road network indices like centrality measures, link importance indices, and site exposure indices to address the challenges faced by road exposure to flooding, especially in peri-urban areas of Africa. Cities are expanding rapidly as peri-urban areas have become dormitory towns and residential development is outpacing infrastructure provision, as highlighted in a study by [20]. Against this backdrop, this paper examines the spatial dynamics of road flooding and its implications on peri-urban mobility. The study utilises infrastructure-based indices and integrates findings from a field study to add the human dimension to the assessment of exposure, resulting in a comprehensive analysis of the impacts of flooding on the mobility of residents in these areas. The aim of this work is to identify the factors responsible for the differential exposure of roads to flooding and increase our understanding of the mobility challenges in cities. This will aid policymakers in designing appropriate and targeted actions for sustainable development.
This paper is structured in the following manner. It commences with an examination of the relevant literature framing urban mobility and exposure, describing academically overlooked peri-urban areas, in general, and specifically focusing on urbanising Accra. Section 3 provides contextual background on the research locations and details the research project’s mixed methods employed to capture nuances of the day-to-day realities in the peri-urban areas of the capital city of Ghana. The Section 4 discusses the findings of the fieldwork, exploring the impact of road flooding on mobility. Lastly, Section 5 delves into how the insights gathered from residents’ perspectives on liveability can aid in anticipating the future vitality of these cities.
2. Literature Review on the Concepts of Mobility and Exposure
The concept of mobility is utilised in various fields of study, ranging from social, soil science, economics, and transportation, to medicine [28,29,30,31]. Consequently, it holds divergent interpretations for different researchers. In this paper, our focus will be on transportation, and we will define mobility as the movement of people, goods, capital, and information, as well as local phenomena related to everyday livelihoods in an urban area [32]. Simply put, mobility means the ability to move from one place to another, and it is a crucial element that enables the efficient functioning of urban and peri-urban systems. The movement of people, goods, and services is essential in providing access to knowledge, information, healthcare, and other activities that promote the welfare of inhabitants [33,34,35]. To ensure that these activities can thrive and develop sustainably, good quality connections are necessary in urban and peri-urban areas.
A significant portion of the residents residing on the fringes of Accra heavily depend on transportation to access various locations and engage in activities crucial to their livelihoods, well-being, social connections, and spiritual requirements [16]. Nevertheless, flood-induced mobility disruptions caused by heavy precipitation are quite common in these areas. The road infrastructure in these emerging peripheral areas is typically fragmented and insufficient, with a limited number of rough dirt or gravel roads servicing the interior regions and lacking comprehensive roadside drainage. Road improvements are usually piecemeal and depend on the economic capacity and willingness of local landowners to invest and their collective ability to lobby municipal authorities.
In peri-urban Accra, rapid and unplanned urbanisation is causing numerous challenges. The situation is worsened by the increasing number of middle-class residents who own vehicles, exacerbating the problems due to the inadequate transportation systems. As a consequence, there are instances where floodwaters inundate a section of the road for extended periods, and in extreme cases, the road is completely cut off due to erosion and washed-away bridges [32]. The impact of such flooding on the transport system, particularly the road network, is not uniform across all cities [36,37]. Some sections of the road network may be more affected than others due to their differential exposures to flooding. The variation in some characteristics, such as the topography of the area, soil type, nature of the surface of the road, and the drainage system, contributes to the varying exposure of the roads to flooding. In addition to the economic losses incurred by cities as a result of flooding, floods on the roads also pose a significant threat to human lives [38,39].
Like mobility, there are various definitions of exposure due to the interchangeability of the concept of exposure with vulnerability, usually resulting from the varied backgrounds of scientists [40,41]. Within the vulnerability literature, exposure is sometimes conceptualised as a component of vulnerability in that, indicators of exposure, sensitivity and adaptation (or adaptive capacity) are summed to measure vulnerability [3,42,43]. According to the proponents of this concept, vulnerability is expressed as:
where V is vulnerability, E is exposure, S is sensitivity and A is adaptive capacity. The vulnerability of transport systems is commonly assessed in terms of the physical vulnerability of its components depending on the physical characteristics of the infrastructure assets, e.g., age, material, structural types, and functional vulnerability contingent on the functional characteristics of the network, e.g., speed and capacity. In flood risk analysis, the risk has been described as the product of the hazard (H), the exposure (E) of the element at risk to the hazard and the vulnerability (V) of the asset [44]. Mathematically, flood risk (R) is expressed as:
V = E + S + A
R = H * E * V
Bringing Equation (2) into transport studies, the risk analysis of a transport network includes hazard identification, vulnerability evaluation of the element at risk to a given hazard, and risk assessment in terms of economic, functional and social losses. Vulnerability is an essential component in risk analysis under any natural or climatic hazard, and its accurate estimation is essential in making reasonable predictions of losses and consequences. Both vulnerability and risk assessments rely heavily on exposure as a key component or indicator. Thus, accurate determination of exposure is crucial for these assessments.
However, the process of assessing exposure is not well-defined by these concepts. Given this ambiguity, we chose the definition of exposure provided by the United Nations Office for Disaster Risk Reduction (UNDRR) as “a situation of people, infrastructure, housing, production capacities and other tangible human assets located in hazard-prone areas” [17,18]. This definition makes it easy for exposure to be assessed in that it sets out the parameters of variables clearly. Thus, in the context of road network or transport infrastructure, exposure will be considered as the parts or segments of the road and its physical characteristics located within the flood zone. In the next section, we will discuss the methods we adopted to assess.
3. Methodology
3.1. Description of the Study Area
This paper is drafted from a study on Climate Change Resilience in Urban Mobility (CLIMACCESS) conducted in 10 neighbourhoods located in the Greater Accra Metropolitan Area (GAMA) as shown in Figure 1. GAMA is located in southern climatic zone of Ghana, which has two rainfall regimes; the major rainy season which ranges from March to July and the minor season from September to November each year [45]. Heavy and frequent rainfall events usually occur in the major rainfall season and over the last two decades have been peaking around June.
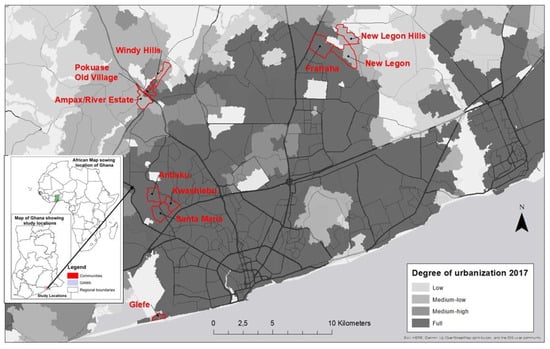
Figure 1.
Map of the study neighbourhoods. Source: Modified from [46].
In June, the average monthly rainfall is about 175 mm and the highest daily rainfall ever recorded since 2000 was 212.8 mm received on 3 June 2015 [47]. However, there have been growing concerns in the media over the last decade about the increasing occurrence of extreme rainfall events in the minor season (see [48]). This means that floods due to these extreme rainfall events are increasing in frequency and severity in Accra and hence, exacerbating the exposure of infrastructure and human livelihoods to flooding [49] modelled flooding within the Greater Accra Metropolitan Area (GAMA) and identified these neighbourhoods as some of the flood bluespots in Accra. A bluespot is the location, extent and depth of local landscape depressions (see [50]). The major factors that influenced the selection of the neighbourhoods were socioeconomic characteristics and the nature of urbanisation in GAMA and these have been described fully in [27]. As shown in Figure 1, the neighbourhoods portray varied levels of urbanisation, the majority being in the low to medium category. The degree of consolidation of a neighbou49rhood is very important, as urbanisation has a link to improved road infrastructure [51]. In the peripheral neighbourhoods within GAMA, residential developments are characterised by poor road infrastructure with limited connectivity [52].
Accra functions as Ghana’s capital and as regional capital of the capital of Accra Metropolitan Area. These functions, coupled with the commercial and industrial roles of Accra and Tema have drawn people from within and outside Ghana to the city. As a result, the city has grown to include areas outside of the Greater Accra Region such as Kasoa, Nsawam and Aburi as people live in these areas and commute daily to and fro the city for their livelihoods. However, the growth of the city has resulted in the clearing of vegetation and the development of residential buildings and other essential infrastructure in flood-prone areas. These activities have led to increased runoff and consequent flooding in the city.
Most often, the processes of urbanisation push the low-income earners to marginalised lands resulting in segregation of settlements along income lines [20]. The majority of these marginalised areas within Accra are flood-prone areas and are underserved. In the peri-urban areas also, most of these flood-prone areas are increasingly being inhabited by the emerging middle-income group [21,46] due to scarcity of land. This observation is evident in the areas selected for the present study as Glefe is a low-income community while the others are mixed. Evidence abounds that shows that areas inhabited by the high income and more vociferous people are better served with infrastructure compared to those of the underprivileged. Thus, these selected neighbourhoods drawn from low- to middle-income neighbourhoods present a perfect case for this study.
3.2. Methods
The transport system supports many livelihood activities of mankind and any effect on it affects mobility and subsequently, livelihoods. Studies on transport or road network vulnerability have often revolved around accessibility and serviceability leading to the use of several indicators [11,12,13,23,53]. Due to low connectivity of roads in the peri-urban areas, spatial intersections will be used to assess road exposure to flooding. We therefore determined the potential flood zones of the study area and overlaid the roads to measure the extent of exposure of the roads. We also conducted a field survey and integrated the results to analyse exposure. We present the methods of socioeconomic data collection and analysis followed by the delineation of the flood zones and then the exposure determination and analysis.
3.2.1. Socio-Economic Data Collection and Analysis
A survey was conducted to collect data on the mobility patterns of the residents by asking questions on how they navigate daily for their livelihoods and how flooding affects their movements. For the field survey, the respondents were selected through a random process. This involved generating random points in ArcGIS and overlaying them on Google Maps. We then navigated to these points when the house closer to the point was selected. If the occupants of the house were absent, we made a second visit to the house and if still did not meet anyone, then we excluded that one. The occupants also had to meet the criteria of being adults of 18+ years and moving out, at least, once a week to other neighbourhoods. A full description of the survey process can be found in [46]. This provided the importance or attractiveness between places. We also conducted in-depth interviews with district-level officials, opinion leaders, traditional authorities, and experienced community members. Pictures were also taken and used to describe or explain some effects of exposure. For this paper, descriptive statistics, especially frequencies and cross-tabulations were used to analyse the survey data. The qualitative data were analysed thematically, and, in some cases, quotes were used to support spatial analysis.
3.2.2. Flood Zone Delineation
A flood hotspot (bluespots) map produced by [50] using UAV-LiDAR data was obtained. However, due to the large size of the study area, the map did not encompass certain portions of parts of the Pokuase and Adenta neighbourhoods. This was because including those areas regions would have significantly increased the cost of acquiring the LIDAR image. Therefore, in this paper, the flood bluespots determined by [50] were extended by overlaying them on the results of Topographic Wetness Index (TWI) to determine flooded areas in the parts that were not covered by the bluespots. Manual classification in ArcGIS was employed and the limits were adjusted until boundaries of the TWI were close to the flood bluespots. Then we set this limit as threshold to divide the TWI into potential flood zones and no flood zones and, extract the potential flood zones as our layer of interest. In addition, the locations of respondents who reported having experienced flooding of their homes between 9 and 50 times in the last 5 years were overlaid to ensure that our potential flood zone layer represents flooded areas. Our analysis revealed that more than 90% of the respondents’ locations fell within the potential flood zones, giving us confidence in the accuracy of our data processing. Consequently, we utilised this to process our data.
The calculation of the TWI requires slope and flow accumulation as shown in Equation (3) (Beven and Kirkby, 1979, cited in [54]).
where ln is the natural logarithm, a is scaled flow accumulation and tanβ is the local slope in radians.
TWI = ln(a/tanβ)
These parameters were calculated using a Shuttle Radar Topographic Mission Digital Elevation Model (DEM) downloaded and resampled to 30 m by 30 m resolution. Even though a DEM of 30 m by 30 m is coarse, it was suitable because GAMA is largely plain with very little variation in elevation. Similar resolutions have been used to map flood zones in other jurisdictions [55,56]. A subset of the DEM was created using the upper left coordinates of latitude 5°48′57″ N and longitude 0° 20′ 37″ W and lower right coordinates of latitude 5°30′25″ N and longitude 0°05′56″ W. This area contained the full lengths of almost all the rivers and streams that drain through the urban area of Accra. The DEM (subset) was processed using the fill tool in ArcGIS to remove all possible sinks in it. The daily travel routine of residents was estimated from a field survey involving 1053 respondents conducted in 2021.
3.2.3. Assessment of Exposure
There are several methods of assessment of exposure. A classical method of assessment relies on network science [41]. However, network science is based on the topology of the network, that is, the structures such as the road junctions or intersections and the road segments [57]. Given the unplanned nature of development, the roads in the peri-urban areas are disjointed. Performing network analysis using these indices may pose a serious challenge as network indices such as betweenness centrality require a properly connected road network. We therefore relied on spatial overlay, particularly spatial intersection for this study. Spatial intersection requires the availability of explicit geographical data for well-delineated flood zones as well as assets. These datasets were obtained from the flood zone delineation described above, open street map (OSM) data on road networks, and the interviews as well as personal observations from the field. A further analysis of the impact of flooding on the exposed road infrastructure as well as mobility of residents was conducted from the survey.
3.2.4. Spatial Intersection
We determined the absolute length and relative road length of the potentially flooded roads. This was adopted as opposed to the absolute area and relative area methods proposed in [41] because the road data downloaded from open street maps were lines. It is worth noting that, except in few cases, the widths of the roads do not vary significantly as almost all are single carriage roads within the neighbourhoods. We intersected the flooded zones determined from the TWI with the road data to obtain the roads that are within the flood zones in the study area. The lengths of these roads were calculated. We used a 500 m by 500 m grid to perform the intersection with the roads within the flood zone and all roads within the study area. This grid size was selected because according to [41], smaller grid sizes represent road surfaces much closer. Also, considering the scale at which this was conducted, smaller grid sizes will bring out the spatial difference clearly. The intersections produced the total length of roads within flood zones and the total length of all roads in the study area in each square grid. These were then used to compute the absolute road and relative road lengths of potentially flooded roads.
4. Results and Discussions
The TWI values shown in Figure 2 ranged between 3.4 and 19.6. These values were classified into three classes using natural breaks: areas with low, medium and high potential for flooding during rainfall events.
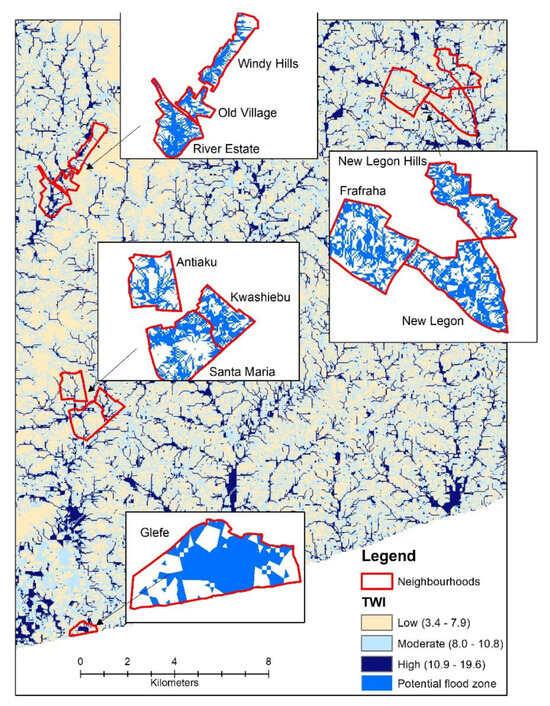
Figure 2.
Topographic Wetness Index Map.
The results reveal that the neighbourhoods are susceptible to flood as much of their surface areas are within the potential flood zones. As indicated in Figure 2, Glefe is a low-lying neighbourhood sandwiched between the Atlantic Ocean and a lagoon. The lagoon is constantly contaminated with waste, significantly decreasing its capacity to contain excess water that flows in from the upland. Thus, anytime it rains, there is spillover from the lagoon thus flooding the neighbourhood. The other neighbourhoods have rivers/streams flowing through them and due to increased runoff resulting from factors such as increasing land surface ceiling, and building on waterways among others, they overflow breaching their banks, causing flooding in the neighbourhoods. The roads within the neighbourhoods that lie in the potential flood zones are shown in Figure 3.
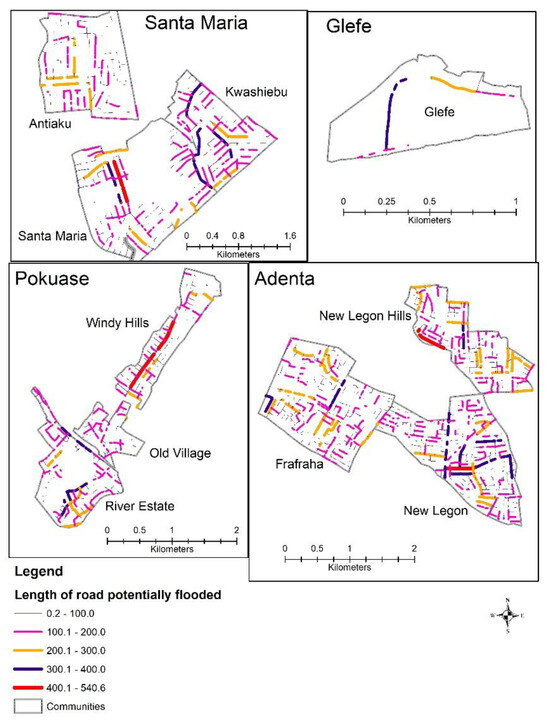
Figure 3.
Exposure of roads to floods. Source: Authors.
From Figure 3, Glefe is the only neighbourhood with two roads traversing it. All other neighbourhoods have some good road provisioning with most of them within the potential flood zones. It is clear in Figure 3 that some areas have a higher concentration of roads in potential flood zones than others. More than 80% of the roads in the neighbourhoods have lengths between 100 m and 540 m within the flood zones. This means that if all these roads are flooded, residents will most likely have no alternative routes to and from their homes. Thus, residents whose main routes to and from their homes are those with longer lengths within the flood zones and these are more exposed to flooding, both in magnitude and frequency. In an interview with an opinion leader in Frafraha, he conveyed: “When we get torrential rains lasting about an hour or more, some roads in our neighbourhoods are completely submerged and no one can use them because of the speed and depth of water. Sometimes, some cars remain in the water when they attempt to pass through”. In a regrettable turn of events, a member of the research team personally encountered some flooding in the area and captured the incident as in Figure 4, aligning with the interviewee’s observation. For the duration the water stays on the roads, they become unmotorable, especially when the water level is high and is moving at high speed. Our field observations indicate that most of the roads with potentially flooded lengths above 155 m serve as main links and are used to some extent by almost all residents in the neighbourhoods. This means that disruptions on these links in terms of temporarily blocking vehicles and pedestrians constitute major disruptions to the mobility of the residents in these neighbourhoods. It was reported in many neighbourhoods that floods often result in heavy traffic. As Figure 4 clearly illustrates, traffic is building up because of the flooding on the road. The white car made a U-turn to move to safety as the water levels continued to rise.
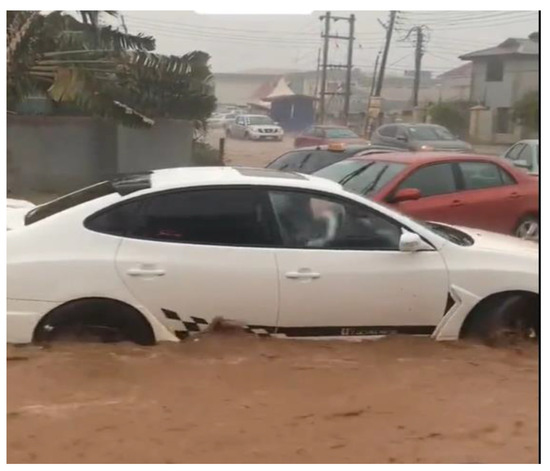
Figure 4.
Traffic building up in Antiaku neighbourhood due to flood. Courtesy Stephen Fiatornu, a Ph.D. student.
This means that vehicles plying this road will have to turn back or stay at that point until the water recedes and this could cause heavy traffic jams there. As captured in Figure 4, the water level on the road that the white car is on is higher than the one it is advancing towards. This means that roads can be exposed but the exposure would not be the same. Some places on the same road will be more exposed than others due to topographic factors. The routes with longer lengths are thus more exposed and this is similar to the findings of [40] in France who found a high and statistically significant correlation (coefficient of 0.78) between road length and exposure to flooding.
In delving deeper into the spatial variation in road exposure to flooding in the neighbourhoods, we examined both the absolute road and relative lengths indices in the potentially flooded areas. The results of the exposure of roads to flooding are shown in Figure 5. Figure 5A highlights the absolute road length (total length of roads within a grid cell) index, which expresses the total length of roads in a grid cell exposed to floods. The map depicts spatial variation in road exposure and as can be seen, the roads in the Adenta neighbourhoods are more exposed to floods because they have more grids with higher total road lengths (covered with darker colours) than the other neighbourhoods.
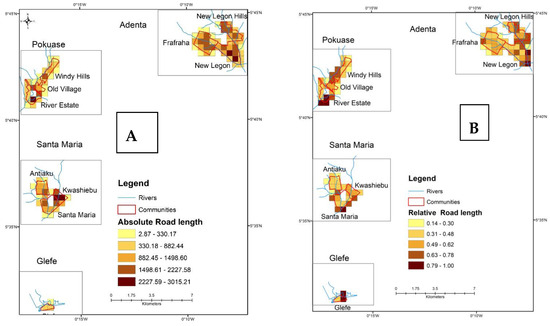
Figure 5.
Road exposure indices in potentially flooded zones.
According to the findings of this study, neighbourhoods in Adenta have the greatest likelihood of experiencing exposure to flooding with Santa Maria, Pokuase and Glefe following closely behind. The Adenta neighbourhoods have more roads exposed to flooding, with a total length between 1.5 km and 3.2 km per grid. This implies that almost all or all roads within the grid are exposed to flooding. There exists a variation in exposure within the locations. For instance, in Adenta, New Legon has a higher exposure value than other neighbourhoods. Glefe, on the other hand, has only two roads and is considered the least exposed to flooding. The grids with high total road lengths exposed to floods are also closer to the rivers or streams that drain the area. This means that proximity to rivers, especially intersections, increases exposure to road flooding.
However, the relative road length (Figure 5B), which is the ratio of total road length exposed to the total road length in each grid, reveals a slightly different perspective. The grid cells with higher ratios have all or almost all road segments within the cells exposed to flooding. This index could be considered as a measure of the severity of exposure. This indicates that the severity of exposure is higher in those areas. These grid cells with higher values are mainly situated near the confluence of the streams or rivers, where there could be a large overflow of water to the surrounding areas. Even though the Adenta neighbourhoods still exhibit higher exposure, the location of the higher exposed grid cells has changed a bit. More grid cells with higher ratios appear at New Legon Hills.
The majority of these cells with high ratio values correspond to the ones with few road segments. This explains why Glefe, with only two roads, is the most exposed in the study area. During the field survey, a resident mentioned that their area has few motorable roads, and these are prone to flooding during heavy rains. He further indicated that they have no alternative routes to use to and from their homes. It was observed during the field survey that most of the roads in the peri-urban areas lack drainage infrastructure, such as gutters and culverts/bridges, to channel runoff away as vividly illustrated in Figure 6. Therefore, the roads with higher exposure require urgent attention from authorities to provide gutters and culverts to redirect flood water and minimise road damage.
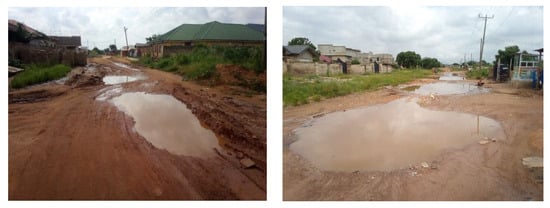
Figure 6.
Nature of roads in peri-urban Accra. Source: Stephen Fiatornu, a Ph.D. student.
According to [40], a higher correlation exists between exposure to flooding and commuter trips. Therefore, the study attempted to determine the number of trips made by residents for their primary income-generating activities. Table 1 shows that most respondents (233) travel five days a week, corresponding to the number of official working days in Ghana. Additionally, 178 respondents work six days a week, including Saturdays. These people travel to work daily and are at a greater risk of experiencing road flooding. Although there is a slight spatial variation, it can be inferred from Table 1 that some areas, such as Windy Hills, Santa Maria, Glefe, and Frafraha, may serve as dormitory areas for those with official employment. People living in these peri-urban areas commute daily to the city for work, as evidenced by the frequency of trips for their primary income-generating activities. More than 87% of respondents in all neighbourhoods leave their homes at least once weekly for their primary livelihoods [21]. It can be concluded that the higher the trip frequency of a resident, the higher their exposure to road flooding, as there is a high chance that they will encounter multiple incidences of floods on their routes.

Table 1.
Frequency of trips to primary income-generating activity.
The flooding also induces mobility challenges. When the road is flooded, the water can sometimes stay on the road for weeks (Figure 7a) or run off on the surface of the road with high speed/force (Figure 7b). In these instances, pedestrians, passengers and vehicles get stuck on the road, which may lead to high fatalities [58].
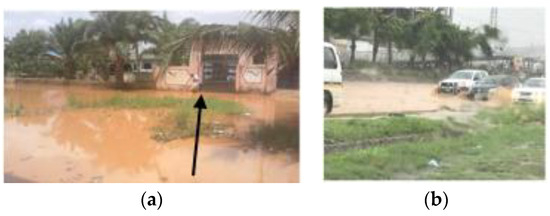
Figure 7.
Mobility challenges due to road flooding. (a) A man trying to wade through water on the road in front of his house; (b) Flooded Road used by vehicles.
This causes disruption to both vehicular and pedestrian mobility with a greater toll on the livelihoods of the residents. However, depending on the depth and length of the inundated section, the recession might take a long time or days in some cases. Many respondents indicated that the roads leading to their homes are often impassable each time they flood (Table 2). As shown in Table 2, the Adenta neighbourhoods of New Legon and New Legon Hills have a higher number of respondents with this challenge.
Table 2.
Roads leading to homes not passable.
Residents in flood-prone areas often have no choice but to walk or drive through the water, which can result in casualties. As shown earlier, several lives have also been lost and others injured on the roads during flooding [8,10]. When the flooded road lengths exceed 100 m, pedestrians are unable to wade through the water, and some vehicles get stuck or experience engine failure. In such cases, it can be dangerous for users to pass through the water, as the speed and strength of the water pose a serious threat to those attempting to pass through. This disruption to mobility patterns can have severe implications for the daily livelihood activities of residents in flood-prone communities, especially those who work in the informal economy [45]. Most of these residents earn a living on a daily basis and need to commute daily to work. Thus, disruptions caused by flooding could lead to deepening poverty and increase the vulnerability of these city dwellers.
During the COVID-19 lockdown, the informal sector suffered a significant economic impact due to restrictions on movement [59,60]. Similarly, restrictions on mobility during floods can prevent people from accessing their workplaces and have consequences on their livelihoods. Areas with high road exposure, particularly those with little to no alternative routes, are highly vulnerable to floods. This vulnerability is even more pronounced in low-income neighbourhoods like Glefe and peri-urban areas like New Legon Hills [61]. Slums and peri-urban areas are home to the poor in cities, and their vulnerabilities are elevated due to their economic status [62,63,64].
5. Conclusions
The study was conducted to evaluate the vulnerability of roads to flooding in certain neighbourhoods in Accra, both urban and peri-urban. To achieve this, the researchers delineated potential flood zones in the neighbourhoods. They then overlaid these potential flood zones with the roads, using a spatial overlay operation whilst estimating the level of exposure of the roads in these neighbourhoods to floods within a grid of 0.5 km by 0.5 km, using exposure indices. The results of this study showed that all the neighbourhoods experienced some level of exposure to road flooding, but the degree of exposure varied spatially both within and between the neighbourhoods. The Adenta neighbourhoods were found to be more exposed than the others. Areas around the confluence of rivers were also identified to be more exposed to road flooding. The study concludes that there is a spatial variation in the vulnerability of roads to flooding in the neighbourhoods and that the degree of vulnerability also varies within the same neighbourhood. The study highlights highly vulnerable areas for rerouting for vehicles and pedestrians and suggests routes that could be planned for infrastructural upliftment. Flooding is a significant threat to road infrastructure, and most roads in many peri-urban areas, especially in Sub-Saharan African countries, are untarred and are, therefore, frequently exposed to flooding, causing massive destruction. Location-specific information can help city authorities plan to reduce or avoid the impacts of floods. Armed with this information, decision-makers can zoom into highly exposed areas, assess infrastructure and other socio-economic factors that could be impacted, and put in measures to reduce or avoid the impacts. We, therefore, recommend that targeted measures be taken to reduce exposure to road flooding and that flood-resilient infrastructure, such as gutters, culverts, and bridges, be constructed on roads with high exposure, to ensure the safety of road users and emergency services. Providing this road infrastructure can contribute to achieving sustainable development goals.
Author Contributions
Conceptualization, Gerald Albert Baeribameng Yiran and Martin Oteng Ababio; Methodology, Gerald Albert Baeribameng Yiran; Software, Gerald Albert Baeribameng Yiran; Validation, Martin Oteng Ababio, Lasse Møller-Jensen, Nii Moe Allotey and Richard Yao Kofie; Formal analysis, Gerald Albert Baeribameng Yiran; Investigation, Gerald Albert Baeribameng Yiran, Martin Oteng Ababio, Albert Nii More Allotey and Richard Yao Kofie; Resources, Lasse Møller-Jensen and Martin Oteng Ababio; Data curation, Gerald Albert Baeribameng Yiran, Albert Nii Moe Allotey and Richard Yao Kofie; Writing—original draft preparation, Gerlad Albert Baeribameng Yiran; Writing—review and editing, Martin Oteng Ababio, Lasse Møller-Jensen, Nii Moe Allotey and Richard Yao Kofie; visualization, Gerald Albert Baeribameng Yiran, Lasse Møller-Jensen, Albert Nii More Alloteya and Richard Yao Kofie; Supervision, Martin Oteng Ababio and Lasse Møller-Jensen; Project administration, Martin Oteng Ababio and Lasse Møller-Jensen; Funding acquisition, Gerald Albert Baeribameng Yiran, Martin Oteng Ababio, Albert Nii More Allotey, Richard Yao Kofie and Lasse Møller-Jensen. All authors have read and agreed to the published version of the manuscript.
Funding
This research was funded by a grant awarded by the Danish Ministry of Foreign Affairs (Danida/DFC/FFU under Grant Number—R445-A31-887/170/01-KU).
Data Availability Statement
The data used is in the paper. No additional data available to be published.
Conflicts of Interest
The authors declare no conflict of interest. The funders had no role in the design of the study; in the collection, analyses, or interpretation of data; in the writing of the manuscript, or in the decision to publish the results.
References
- Torres, P. Facing disaster: The great challenges framework. Foresight 2018, 21, 4–34. [Google Scholar] [CrossRef]
- Dobraszczyk, P. Sunken cities: Climate change, urban futures and the imagination of submergence. Int. J. Urban Reg. Res. 2017, 41, 868–887. [Google Scholar] [CrossRef]
- IPCC. Synthesis Report. Contribution of Working Groups I, II and III to the Fifth Assessment Report of the Intergovernmental Panel on Climate Change; IPCC: Geneva, Switzerland, 2014; Volume 151. [Google Scholar]
- CRED; UNISDR. The Human Cost of Weather-Related Disasters, 1995–2015; United Nations: Geneva, Switzerland, 2015; Available online: https://www.unisdr.org/2015/docs/climatechange/COP21_WeatherDisastersReport_2015_FINAL.pdf (accessed on 14 May 2022).
- CRED; UNISDR. 2022 Disasters in Numbers. 2023. Available online: https://cred.be/sites/default/files/2022_EMDAT_report.pdf (accessed on 28 November 2023).
- Tramblay, Y.; Villarini, G.; Zhang, W. Observed changes in flood hazard in Africa. Environ. Res. Lett. 2020, 15, 1040b5. [Google Scholar] [CrossRef]
- Douglas, I. Flooding in African cities, scales of causes, teleconnections, risks, vulnerability and impacts. Int. J. Disaster Risk Reduct. 2017, 26, 34–42. [Google Scholar] [CrossRef]
- Chatzichristaki, C.; Stefanidis, S.; Stefanidis, P.; Stathis, D. Analysis of the flash flood in Rhodes Island (South Greece) on 22 November 2013. Silva 2015, 16, 76–86. [Google Scholar]
- Diakakis, M.; Deligiannakis, G. Vehicle-related flood fatalities in Greece. Environ. Hazards 2013, 12, 278–290. [Google Scholar] [CrossRef]
- Petrucci, O. Factors leading to the occurrence of flood fatalities: A systematic review of research papers published between 2010 and 2020. Nat. Hazards Earth Syst. Sci. 2022, 22, 71–83. [Google Scholar] [CrossRef]
- Chen, X.-Z.; Lu, Q.-C.; Peng, Z.-R.; Ash, J.E. Analysis of transportation network vulnerability under flooding disasters. Transp. Res. Rec. 2015, 2532, 37–44. [Google Scholar] [CrossRef]
- da Mata Martins, M.C.; da Silva, A.N.R.; Pinto, N. An indicator-based methodology for assessing resilience in urban mobility. Transp. Res. Part D Transp. Environ. 2019, 77, 352–363. [Google Scholar] [CrossRef]
- Diakakis, M.; Boufidis, N.; Grau, J.M.S.; Andreadakis, E.; Stamos, I. A systematic assessment of the effects of extreme flash floods on transportation infrastructure and circulation: The example of the 2017 Mandra flood. Int. J. Disaster Risk Reduct. 2020, 47, 101542. [Google Scholar] [CrossRef]
- Di Baldassarre, G.; Montanari, A.; Lins, H.; Koutsoyiannis, D.; Brandimarte, L.; Blöschl, G. Flood fatalities in Africa: From diagnosis to mitigation. Geophys. Res. Lett. 2010, 37, L22402. [Google Scholar] [CrossRef]
- Dottori, F.; Figueiredo, R.; Martina, M.L.; Molinari, D.; Scorzini, A.R. INSYDE: A synthetic, probabilistic flood damage model based on explicit cost analysis. Nat. Hazards Earth Syst. Sci. 2016, 16, 2577–2591. [Google Scholar] [CrossRef]
- Oteng-Ababio, M.; Agergaard, J.; Møller-Jensen, L.; Andreasen, M.H. Flood risk reduction and resilient city growth in Sub-Saharan Africa: Searching for coherence in Accra’s urban planning. Front. Sustain. Cities 2024, 6, 1118896. [Google Scholar] [CrossRef]
- UNISDR. Sustainable Development: Risk Reduction Report of the Open-Ended Intergovernmental Expert Working Group on Indicators and Terminology Relating to Disaster Risk Reduction; UN A/71/644, 16-21184 (E); UNISDR: Geneva, Switzerland, 2017. [Google Scholar]
- Gencer, E.A. The Interplay between Urban Development, Vulnerability, and Risk Management: A Case Study of the Istanbul Metropolitan Area; Springer Science & Business Media: Berlin/Heidelberg, Germany, 2013; Volume 7. [Google Scholar]
- Møller-Jensen, L.; Allotey, A.N.; Kofie, R.Y.; Yankson, P.W. A comparison of satellite-based estimates of urban agglomeration size for the Accra area. ISPRS Int. J. Geo-Inf. 2020, 9, 79. [Google Scholar] [CrossRef]
- Yiran, G.A.B. Urban sprawl and sustainability: A comparative Analysis of Accra and Kumasi urban regions. Ghana Soc. Sci. J. 2020, 17, 20. [Google Scholar]
- Møller-Jensen, L.; Agergaard, J.; Andreasen, M.H.; Kofie, R.Y.; Yiran, G.A.; Oteng-Ababio, M. Probing political paradox: Urban expansion, floods risk vulnerability and social justice in urban Africa. J. Urban Aff. 2023, 45, 505–521. [Google Scholar] [CrossRef]
- Twigg, J. Characteristics of a Disaster-Resilient Community: A Guidance Note, 2nd ed.; DFID Disaster Risk Reduction NGO Interagency Group: Teddington, UK, 2009. [Google Scholar]
- Morelli, A.B.; Cunha, A.L. Measuring urban road network vulnerability to extreme events: An application for urban floods. Transp. Res. Part D Transp. Environ. 2021, 93, 102770. [Google Scholar] [CrossRef]
- Achillopoulou, D.V.; Mitoulis, S.A.; Argyroudis, S.A.; Wang, Y. Monitoring of transport infrastructure exposed to multiple hazards: A roadmap for building resilience. Sci. Total Environ. 2020, 746, 141001. [Google Scholar] [CrossRef] [PubMed]
- Argyroudis, S.A.; Mitoulis, S.A.; Hofer, L.; Zanini, M.A.; Tubaldi, E.; Frangopol, D.M. Resilience assessment framework for critical infrastructure in a multi-hazard environment: Case study on transport assets. Sci. Total Environ. 2020, 714, 136854. [Google Scholar] [CrossRef] [PubMed]
- Yang, D.Y.; Frangopol, D.M. Bridging the gap between sustainability and resilience of civil infrastructure using lifetime resilience. In Routledge Handbook of Sustainable and Resilient Infrastructure; Routledge: Oxfordshire, UK, 2018; pp. 419–442. [Google Scholar]
- Moller-Jensen, L.; Allotey, A.N.; Kofie, R.Y.; Yiran, G.A. How Does Flooding Influence Intra-Urban Mobility? The Case of Accra. Sustainability 2023, 15, 14997. [Google Scholar] [CrossRef]
- Aminoshariae, A.; Mackey, S.A.; Palomo, L.; Kulild, J.C. Declassifying mobility classification. J. Endod. 2020, 46, 1539–1544. [Google Scholar] [CrossRef]
- Domergue, F.-L.; Vedy, J.-C. Mobility of heavy metals in soil profiles. Int. J. Environ. Anal. Chem. 1992, 46, 13–23. [Google Scholar] [CrossRef]
- Nikitas, A.; Michalakopoulou, K.; Njoya, E.T.; Karampatzakis, D. Artificial intelligence, transport and the smart city: Definitions and dimensions of a new mobility era. Sustainability 2020, 12, 2789. [Google Scholar] [CrossRef]
- Van den Berg, M. Subjective social mobility: Definitions and expectations of ‘moving up’of poor Moroccan women in the Netherlands. Int. Sociol. 2011, 26, 503–523. [Google Scholar] [CrossRef]
- Hoffmann, R. Contextualizing climate change impacts on human mobility in African drylands. Earth’s Future 2022, 10, e2021EF002591. [Google Scholar] [CrossRef]
- Bertolini, L. Integrating mobility and urban development agendas: A manifesto. disP-Plan. Rev. 2012, 48, 16–26. [Google Scholar] [CrossRef]
- Brčić, D.; Slavulj, M.; Šojat, D.; Jurak, J. The role of smart mobility in smart cities. In Proceedings of the Fifth International Conference on Road and Rail Infrastructure (CETRA 2018), Zadar, Croatia, 17–19 May 2018. [Google Scholar]
- NEMÞANU, F.; Schlingensiepen, J.; Buretea, D.; Iordache, V. Mobility as a service in smart cities. Responsible entrepreneurship vision, development and ethics. In Proceedings of the 9th International Conference for Entrepreneurship, Innovation and Regional Development, Bucharest, Romania, 23–24 June 2016; p. 425. [Google Scholar]
- Adams, I.; Ghosh, S.; Runeson, G. Perceived differential vulnerability and climate change-related hazards in informal settlements in Accra, Ghana: Re-thinking vulnerability to climate change in urban areas. Local Environ. 2022, 28, 433–458. [Google Scholar] [CrossRef]
- Finch, C.; Emrich, C.T.; Cutter, S.L. Disaster disparities and differential recovery in New Orleans. Popul. Environ. 2010, 31, 179–202. [Google Scholar] [CrossRef]
- Abubakari, M.; Twum, K.O. Cities and floods: A pragmatic insight into the determinants of households’ coping strategies to floods in informal Accra, Ghana. Jàmbá J. Disaster Risk Stud. 2019, 11, a608. [Google Scholar]
- Croitoru, L.; Miranda, J.J.; Sarraf, M. The Cost of Coastal Zone Degradation in West Africa; World Bank: Washington, DC, USA, 2019. [Google Scholar]
- Debionne, S.; Ruin, I.; Shabou, S.; Lutoff, C.; Creutin, J.-D. Assessment of commuters’ daily exposure to flash flooding over the roads of the Gard region, France. J. Hydrol. 2016, 541, 636–648. [Google Scholar] [CrossRef]
- Papilloud, T.; Röthlisberger, V.; Loreti, S.; Keiler, M. Flood exposure analysis of road infrastructure–Comparison of different methods at national level. Int. J. Disaster Risk Reduct. 2020, 47, 101548. [Google Scholar] [CrossRef]
- Gbetibouo, G.A.; Ringler, C.; Hassan, R. Vulnerability of the South African farming sector to climate change and variability: An indicator approach. Nat. Resour. Forum 2010, 34, 175–187. [Google Scholar] [CrossRef]
- Yiran, G.A.; Stringer, L.C.; Attua, E.M.; Evans, A.J.; Challinor, A.J.; Gyasi, E.A. Mapping vulnerability to multiple hazards in the savannah Ecosystem in Ghana. Reg. Environ. Chang. 2017, 17, 665–676. [Google Scholar] [CrossRef]
- Birkmann, J.; Welle, T. Assessing the risk of loss and damage: Exposure, vulnerability and risk to climate-related hazards for different country classifications. Int. J. Glob. Warm. 2015, 8, 191–212. [Google Scholar] [CrossRef]
- Asumadu-Sarkodie, S.; Owusu, P.A.; Jayaweera, M. Flood risk management in Ghana: A case study in Accra. J. Contrib. 2015, 6, 196–201. [Google Scholar]
- Andreasen, M.H.; Agergaard, J.; Møller-Jensen, L.; Oteng-Ababio, M.; Yiran, G.A.B. Mobility disruptions in Accra: Recurrent flooding, fragile infrastructure and climate change. Sustainability 2022, 14, 13790. [Google Scholar] [CrossRef]
- Padi, M.; Foli, B.A.K.; Nyadjro, E.S.; Owusu, K.; Wiafe, G. Extreme rainfall events over Accra, Ghana, in recent years. Remote Sens. Earth Syst. Sci. 2021, 5, 71–82. [Google Scholar] [CrossRef]
- Braimah, M.; Asante, V.A.; Ahiataku, M.A.; Ansah, S.O.; Otu-Larbi, F.; Yahaya, B.; Ayabilah, J.B.; Nkrumah, F. Variability of the minor season rainfall over southern Ghana (1981–2018). Adv. Meteorol. 2022, 2022, 1861130. [Google Scholar] [CrossRef]
- Balstrom, T.; Crawford, D. Arc-Malstrøm: A 1D hydrologic screening method for stormwater assessments based on geometric networks. Comput. Geosci. 2018, 116, 64–73. [Google Scholar] [CrossRef]
- Trepekli, K.; Balstrøm, T.; Friborg, T.; Fog, B.; Allotey, A.N.; Kofie, R.Y.; Møller-Jensen, L. UAV-borne, LiDAR-based elevation modelling: A method for improving local-scale urban flood risk assessment. Nat. Hazards 2022, 113, 423–451. [Google Scholar] [CrossRef]
- Adugbila, E.J.; Martinez, J.A.; Pfeffer, K. Road infrastructure expansion and socio-spatial fragmentation in the peri-urban zone in Accra, Ghana. Cities 2023, 133, 104154. [Google Scholar] [CrossRef]
- Møller-Jensen, L.; Kofie, R.Y.; Allotey, A.N. Measuring accessibility and congestion in Accra. Nor. Geogr. Tidsskr.-Nor. J. Geogr. 2012, 66, 52–60. [Google Scholar] [CrossRef]
- Liu, J.; Shi, Z.; Tan, X. Measuring the dynamic evolution of road network vulnerability to floods: A case study of Wuhan, China. Travel Behav. Soc. 2021, 23, 13–24. [Google Scholar] [CrossRef]
- Pourali, S.; Arrowsmith, C.; Chrisman, N.; Matkan, A.; Mitchell, D. Topography wetness index application in flood-risk-based land use planning. Appl. Spat. Anal. Policy 2016, 9, 39–54. [Google Scholar] [CrossRef]
- Masood, M.; Takeuchi, K. Assessment of flood hazard, vulnerability and risk of mid-eastern Dhaka using DEM and 1D hydrodynamic model. Nat. Hazards 2012, 61, 757–770. [Google Scholar] [CrossRef]
- Qi, S.; Brown, D.G.; Tian, Q.; Jiang, L.; Zhao, T.; Bergen, K.M. Inundation extent and flood frequency mapping using LANDSAT imagery and digital elevation models. GISci. Remote Sens. 2009, 46, 101–127. [Google Scholar] [CrossRef]
- Costa, L.D.F.; Rodrigues, F.A.; Travieso, G.; Villas Boas, P.R. Characterization of complex networks: A survey of measurements. Adv. Phys. 2007, 56, 167–242. [Google Scholar] [CrossRef]
- Bocanegra, R.A.; Francés, F. Assessing the risk of vehicle instability due to flooding. J. Flood Risk Manag. 2021, 14, e12738. [Google Scholar] [CrossRef]
- Chen, M.; Grapsa, E.; Ismail, G.; Rogan, M.; Valdivia, M. COVID-19 and Informal Work: Distinct Pathways of Impact and Recovery in 11 Cities around the World; WIEGO: Manchester, UK, 2021. [Google Scholar]
- Durizzo, K.; Asiedu, E.; Van der Merwe, A.; Van Niekerk, A.; Günther, I. Managing the COVID-19 pandemic in poor urban neighborhoods: The case of Accra and Johannesburg. World Dev. 2021, 137, 105175. [Google Scholar] [CrossRef]
- Glaeser, E.L.; Kahn, M.E.; Rappaport, J. Why do the poor live in cities? The role of public transportation. J. Urban Econ. 2008, 63, 1–24. [Google Scholar] [CrossRef]
- Ingwani, E.; Thynell, M.; Gurure, L.; Ekelund, N.G.; Gumbo, T.; Schubert, P.; Nel, V. The Impacts of Peri-Urban Expansion on Municipal and Ecosystem Services: Experiences from Makhado Biaba Town, South Africa. In Urban Forum; Springer: Dordrecht, The Netherlands, 2023. [Google Scholar]
- Lasisi, M.; Popoola, A.; Adediji, A.; Adedeji, O.; Babalola, K. City expansion and agricultural land loss within the peri-urban area of Osun State, Nigeria. Ghana J. Geogr. 2017, 9, 132–163. [Google Scholar]
- Voumard, J.; Caspar, O.; Derron, M.-H.; Jaboyedoff, M. Dynamic risk simulation to assess natural hazards risk along roads. Nat. Hazards Earth Syst. Sci. 2013, 13, 2763–2777. [Google Scholar] [CrossRef]
Disclaimer/Publisher’s Note: The statements, opinions and data contained in all publications are solely those of the individual author(s) and contributor(s) and not of MDPI and/or the editor(s). MDPI and/or the editor(s) disclaim responsibility for any injury to people or property resulting from any ideas, methods, instructions or products referred to in the content. |
© 2024 by the authors. Licensee MDPI, Basel, Switzerland. This article is an open access article distributed under the terms and conditions of the Creative Commons Attribution (CC BY) license (https://creativecommons.org/licenses/by/4.0/).