

Analyzing the Influence of Visitor Types on Location Choices and Revisit Intentions in Urban Heritage Destinations


Abstract
1. Introduction
2. Related Work
2.1. Visitor Segmentation
2.2. POI Definition with Location-Based Data
2.3. Revisit Intention
3. Methodology
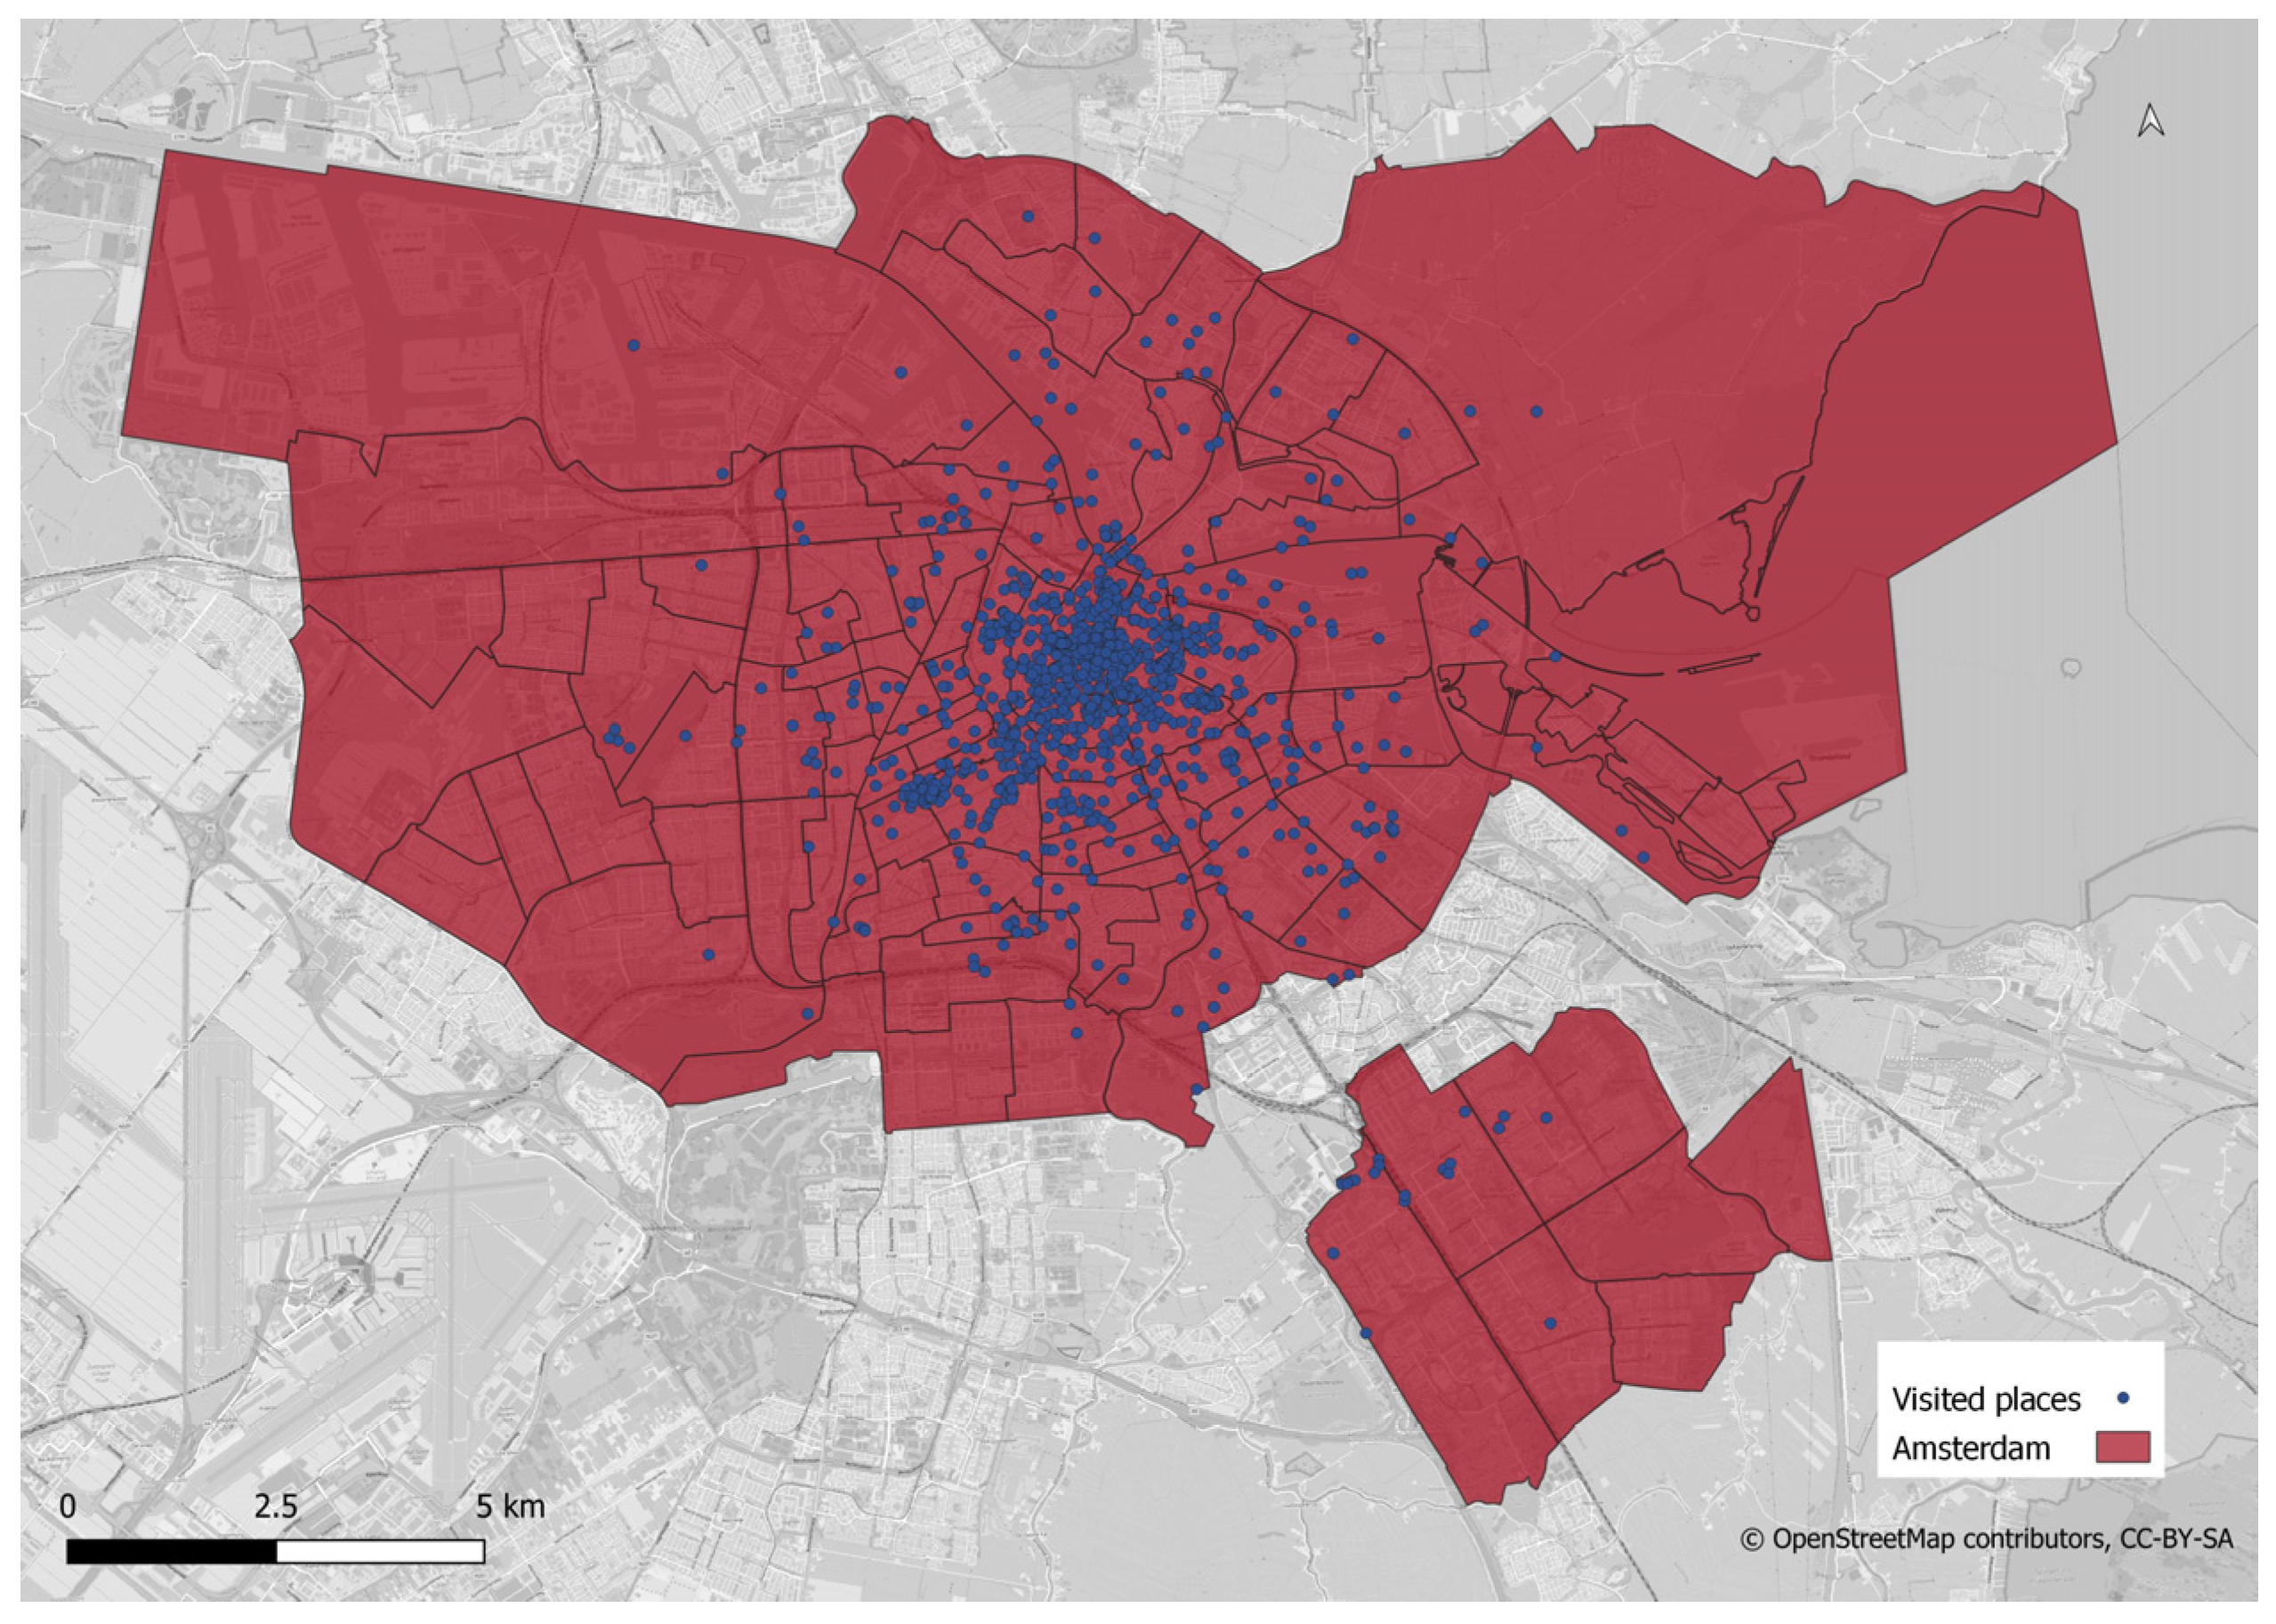
3.1. Case Area
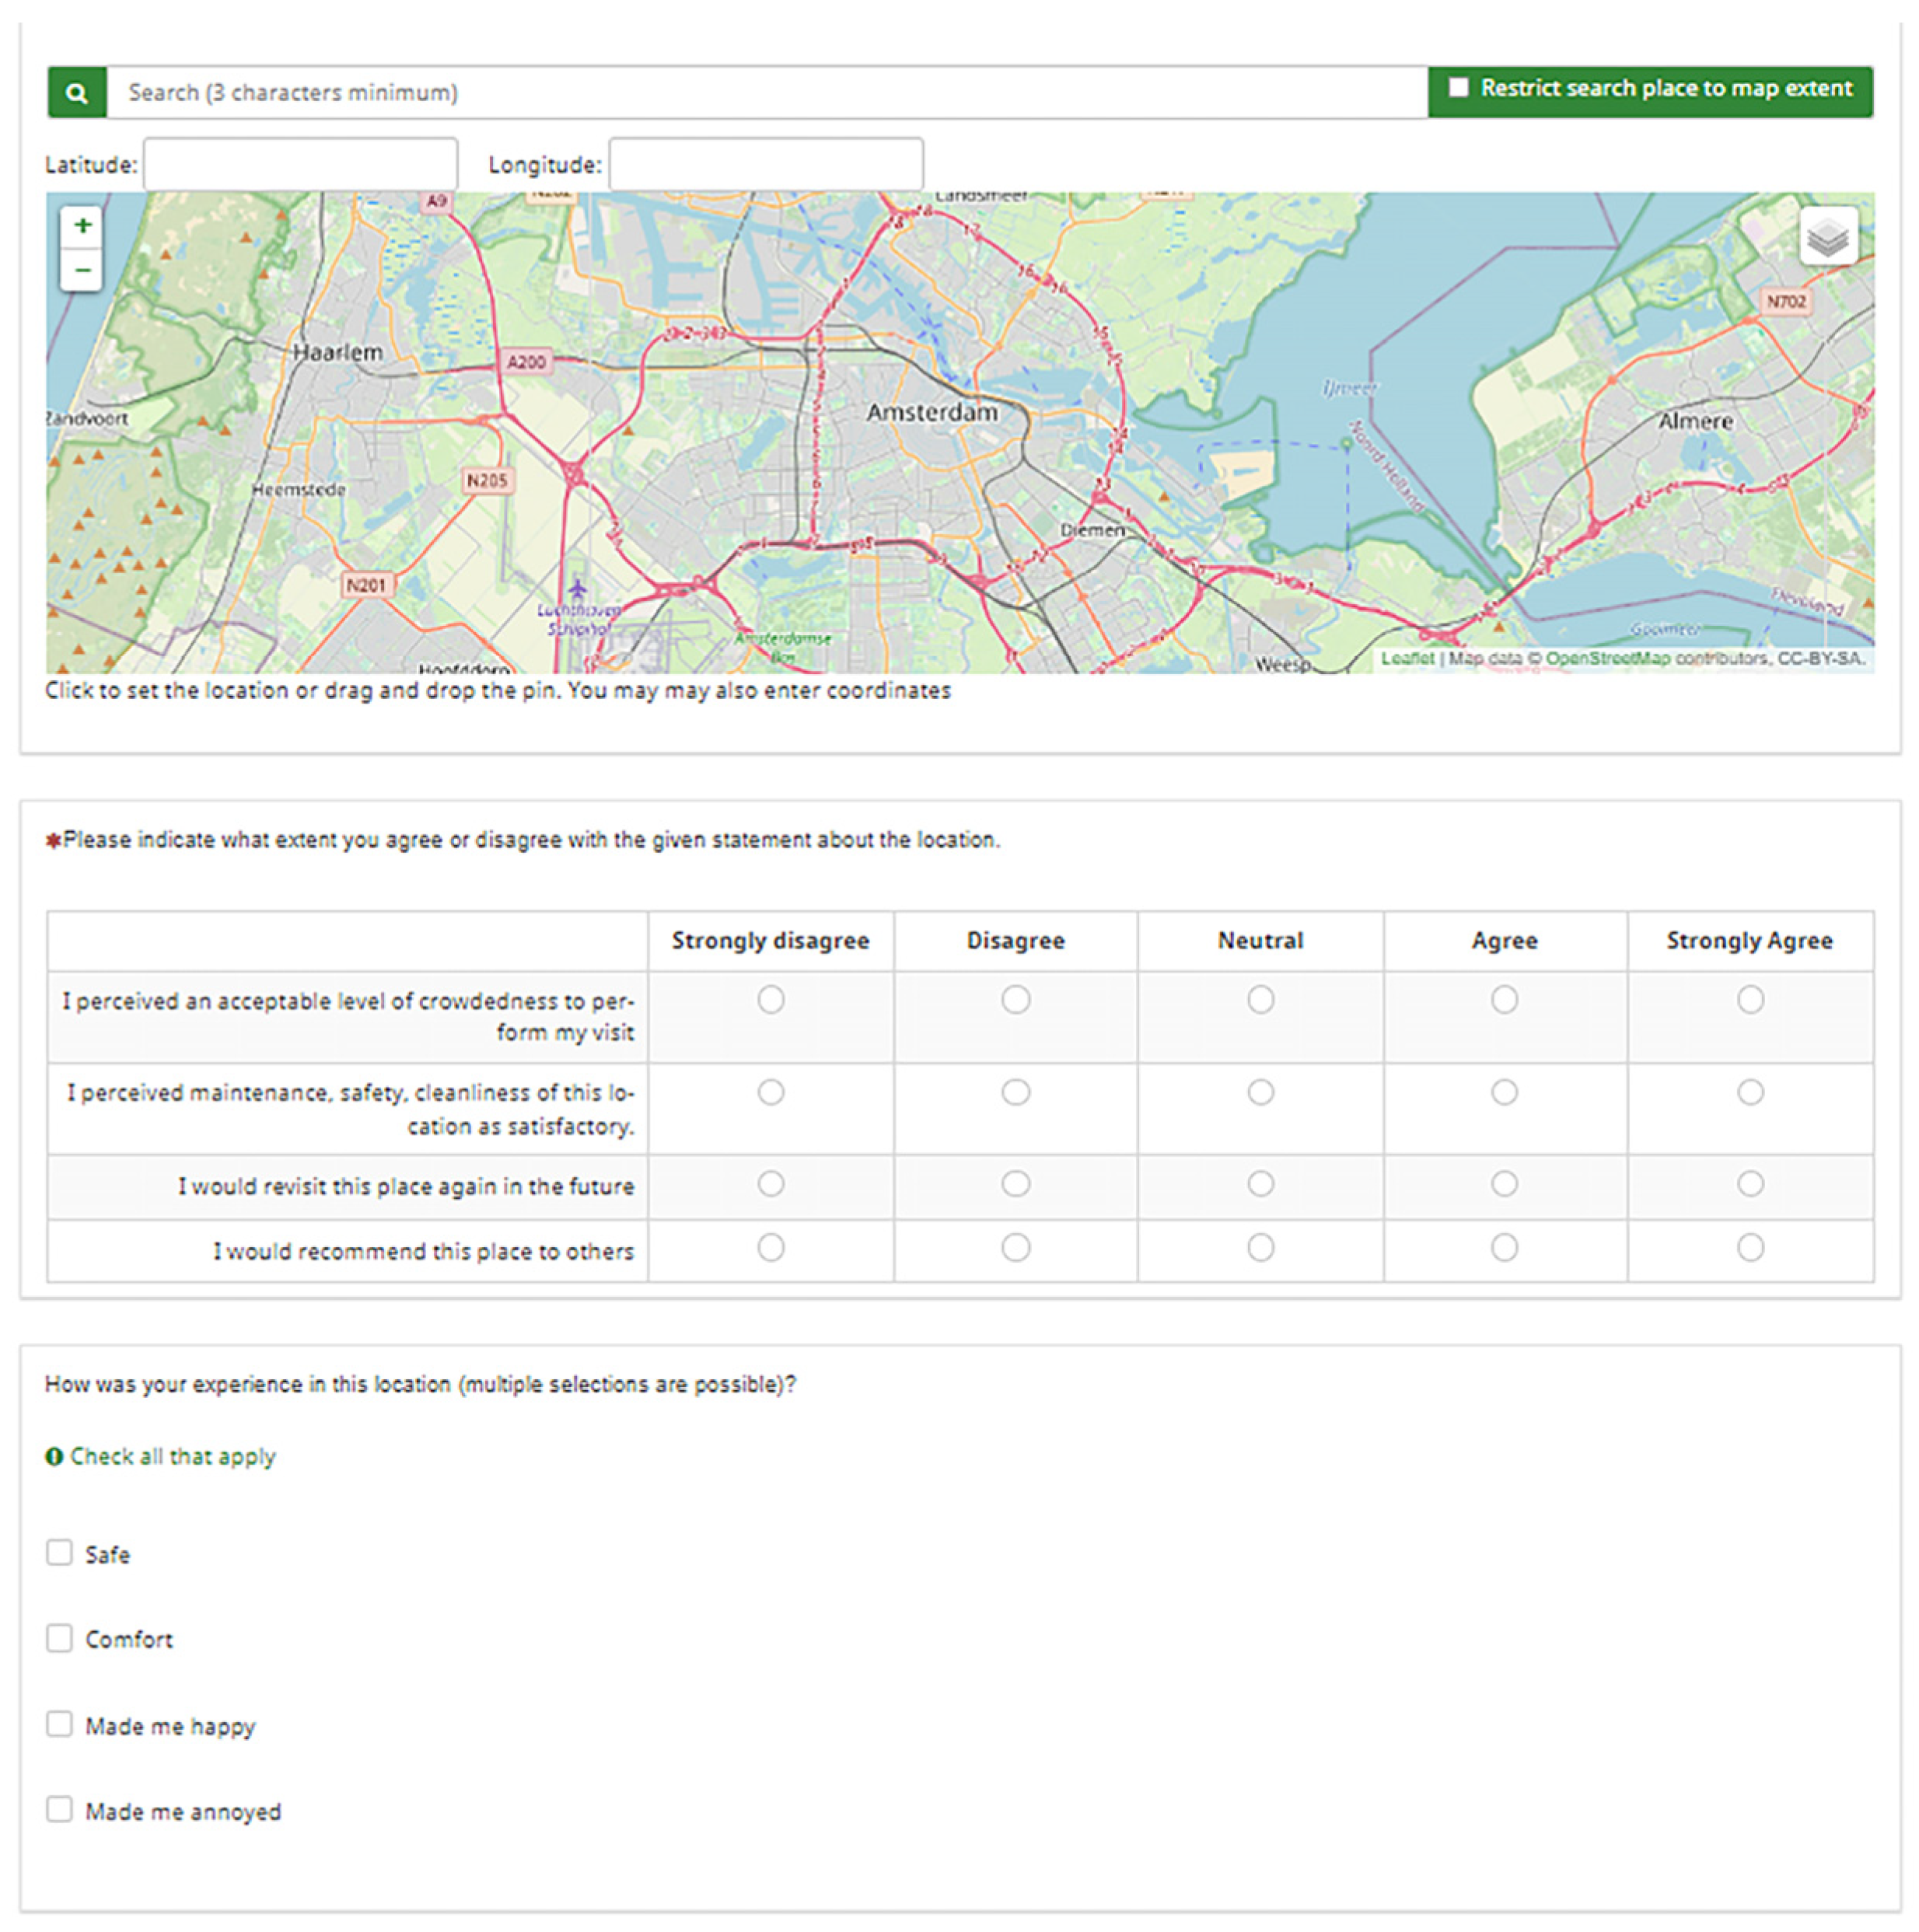
3.2. Survey Design
3.3. Latent Class Analysis of Stated Choice Experiment Data
3.4. Revealed Data Structure and the Characterization of Spatial Segments
4. Results
4.1. Data Collection and Sample
4.2. Descriptive Statistics of Class
4.3. Association Rules
4.4. The Influence of Visitors’ Experiences on Their Revisit Intentions
5. Conclusions and Discussion
Author Contributions
Funding
Data Availability Statement
Acknowledgments
Conflicts of Interest
Appendix A

| ID | POI | ID | POI | ID | POI | ID | POI |
|---|---|---|---|---|---|---|---|
| 1 | Anne Frank House | 26 | OBA Library of Amsterdam | 51 | St. Nicholas Basilica | 76 | Our House Museum |
| 2 | Van Gogh Museum | 27 | Amsterdam Canal Ring | 52 | De Poezonboot | 77 | Haarlemmerstraat |
| 3 | Rijksmuseum | 28 | Molen van Sloten | 53 | Singel | 78 | Amsterdam Tulip Museum |
| 4 | Vondelpark | 29 | Rembrants Amsterdam Experience | 54 | Leidseplein | 79 | Rtxp Amsterdam |
| 5 | The Jordaan | 30 | Portuguese Synagogue | 55 | Wondr Experience | 80 | Magere Brug |
| 6 | Centraal Station | 31 | De 9 Straatjes | 56 | De Hallen Amsterdam | 81 | The Cat Cabinet |
| 7 | Heineken Experience | 32 | Albert Cuyp Market | 57 | Tropenmuseum | 82 | Amsterdam Tourist Ferry |
| 8 | Museum Ons’ Lieve Heer Op Solder | 33 | Dutch National Opera Ballet | 58 | Koninklijk Theater Carre | 83 | Damrak |
| 9 | Body Worlds | 34 | The Amstel | 59 | Fabrique des Lumieres | 84 | Westerpark |
| 10 | Red Light District | 35 | Amsterdamse Bos | 60 | Eye Film Institute | 85 | Foam-Photography Museum Amsterdam |
| 11 | Artis Zoo | 36 | De Duif | 61 | Hash Marihauna and Hemp Museum | 86 | Nieuwmarkt |
| 12 | Museum Het Rembrandthuis | 37 | Tour de BonTon | 62 | Museum van Loon | 87 | Ge Gooyer Windmill |
| 13 | Verzetsmuseum Amsterdam | 38 | Stadelijk Museum | 63 | Amsterdam Pipe Museum | 88 | Vincent Meets Rembrandt |
| 14 | A’dam Lookout | 39 | Rembrandtplein | 64 | De Bijenkorf | 89 | RAI Amsterdam |
| 15 | Dam Square | 40 | Hermitage Amsterdam | 65 | Amsterdam Museum | 90 | Buiksloterweg Ferry |
| 16 | Moco Museum Amsterdam | 41 | Ripley’s Believe It or Not | 66 | Westerkerk | 91 | Anne Frank, Her Diary on Stage |
| 17 | Museum Quarter | 42 | Joods Historic Museum | 67 | Brouwersgracht | 92 | Brouwerij de Prael |
| 18 | Royal Palace Amsterdam | 43 | Johan Cruyff Arena | 68 | Museum Vrolik | 93 | Bridge of 15 Bridges |
| 19 | Begijnhof | 44 | Keizergracht | 69 | Amstelpark | 94 | Huis Bartolotti |
| 20 | The National Maritime Museum | 45 | Museum of the Canals | 70 | Museum Hep Schip | 95 | Munttoren |
| 21 | Micropia | 46 | Hortus Botanicus | 71 | Noordermarkt | 96 | Cannabis College |
| 22 | Nemo Science Museum | 47 | Willet-Holthuysen Museum | 72 | Houseboat Museum | 97 | Zeedijk |
| 23 | Madame Tusseauds | 48 | Youseum Amsterdam | 73 | De Krijtberg | 98 | King’s day |
| 24 | GWB | 49 | Ziggo Dome | 74 | STRAAT/International straat art museum | 99 | Theater Amsterdam |
| 25 | Herengracht | 50 | Museum of Prostitution | 75 | Hema | 100 | Concertgebouw |
Appendix B
| Rules_ID | Rules | Support | Confidence | Lift |
|---|---|---|---|---|
| 29 | {X4_POI_name=Dutch National Opera Ballet} => {Class=LC3} | 0.02 | 0.71 | 2.75 |
| 27 | {X3_POI_name=Rijksmuseum} => {Class=LC2} | 0.02 | 0.71 | 2.66 |
| 39 | {X3_POI_name=Museum Het Rembrandthuis} => {Class=LC3} | 0.02 | 0.63 | 2.41 |
| 1 | {X3_POI_name=Molen van Sloten} => {Class=LC1} | 0.01 | 1.00 | 2.12 |
| 7 | {X2_POI_name=Museum Het Rembrandthuis} => {Class=LC1} | 0.02 | 1.00 | 2.12 |
| 15 | {X2_POI_name=Begijnhof} => {Class=LC1} | 0.02 | 1.00 | 2.12 |
| 33 | {X4_POI_name=Artis Zoo} => {Class=LC3} | 0.01 | 0.50 | 1.93 |
| 97 | {X3_POI_name=Youseum Amsterdam} => {Class=LC3} | 0.02 | 0.50 | 1.93 |
| 37 | {X1_POI_name=Tropenmuseum} => {Class=LC2} | 0.01 | 0.50 | 1.86 |
| 43 | {X2_POI_name=Ge Gooyer Windmill} => {Class=LC2} | 0.01 | 0.50 | 1.86 |
| 95 | {X2_POI_name=Ripley’s Believe It or Not} => {Class=LC2} | 0.02 | 0.50 | 1.86 |
| 139 | {X4_POI_name=Tropenmuseum} => {Class=LC3} | 0.02 | 0.47 | 1.80 |
| 13 | {X1_POI_name=St. Nicholas Basilica} => {Class=LC1} | 0.02 | 0.83 | 1.77 |
| 109 | {X4_POI_name=Centraal Station} => {Class=LC2} | 0.02 | 0.46 | 1.72 |
| 69 | {X3_POI_name=Centraal Station} => {Class=LC3} | 0.01 | 0.44 | 1.71 |
| 3 | {X4_POI_name=De Bijenkorf} => {Class=LC1} | 0.01 | 0.80 | 1.70 |
| 5 | {X2_POI_name=Youseum Amsterdam} => {Class=LC1} | 0.01 | 0.80 | 1.70 |
| 9 | {X1_POI_name=The Cat Cabinet} => {Class=LC1} | 0.01 | 0.80 | 1.70 |
| 59 | {X4_POI_name=STRAAT/International straat art museum} => {Class=LC1} | 0.02 | 0.78 | 1.65 |
| 113 | {X1_POI_name=Nemo Science Museum} => {Class=LC2} | 0.02 | 0.43 | 1.59 |
| 123 | {X1_POI_name=Madame Tusseauds} => {Class=LC2} | 0.02 | 0.43 | 1.59 |
| 41 | {X3_POI_name=Albert Cuyp Market} => {Class=LC1} | 0.02 | 0.75 | 1.59 |
| 151 | {X1_POI_name=Artis Zoo} => {Class=LC2} | 0.03 | 0.42 | 1.57 |
| 83 | {X1_POI_name=The National Maritime Museum} => {Class=LC3} | 0.01 | 0.40 | 1.54 |
| 85 | {X4_POI_name=Ripley’s Believe It or Not} => {Class=LC3} | 0.01 | 0.40 | 1.54 |
| 25 | {X4_POI_name=Museum Quarter} => {Class=LC1} | 0.02 | 0.71 | 1.51 |
| 111 | {X4_POI_name=Wondr Experience} => {Class=LC1} | 0.03 | 0.71 | 1.51 |
| 75 | {X3_POI_name=Ge Gooyer Windmill} => {Class=LC2} | 0.01 | 0.40 | 1.49 |
| 145 | {X1_POI_name=Ripley’s Believe It or Not} => {Class=LC1} | 0.03 | 0.69 | 1.46 |
| 11 | {X1_POI_name=Begijnhof} => {Class=LC1} | 0.01 | 0.67 | 1.41 |
| 17 | {X4_POI_name=Madame Tusseauds} => {Class=LC1} | 0.01 | 0.67 | 1.41 |
| 19 | {X2_POI_name=OBA Library of Amsterdam} => {Class=LC1} | 0.01 | 0.67 | 1.41 |
| 49 | {X1_POI_name=Museum Het Rembrandthuis} => {Class=LC1} | 0.02 | 0.67 | 1.41 |
| 55 | {X3_POI_name=Tropenmuseum} => {Class=LC1} | 0.02 | 0.67 | 1.41 |
| 57 | {X3_POI_name=The National Maritime Museum} => {Class=LC1} | 0.02 | 0.67 | 1.41 |
| 63 | {X1_POI_name=Bridge of 15 Bridges} => {Class=LC1} | 0.02 | 0.67 | 1.41 |
| 121 | {X1_POI_name=Madame Tusseauds} => {Class=LC3} | 0.02 | 0.36 | 1.38 |
| 91 | {X3_POI_name=Madame Tusseauds} => {Class=LC2} | 0.01 | 0.36 | 1.35 |
| 47 | {X3_POI_name=Dutch National Opera Ballet} => {Class=LC1} | 0.02 | 0.63 | 1.32 |
| 163 | {X4_POI_name=Vondelpark} => {Class=LC3} | 0.02 | 0.33 | 1.29 |
| 71 | {X2_POI_name=Verzetsmuseum Amsterdam} => {Class=LC1} | 0.02 | 0.60 | 1.27 |
| 73 | {X3_POI_name=RAI Amsterdam} => {Class=LC1} | 0.02 | 0.60 | 1.27 |
| 81 | {X3_POI_name=Fabrique des Lumieres} => {Class=LC1} | 0.02 | 0.60 | 1.27 |
| 99 | {X1_POI_name=Nieuwmarkt} => {Class=LC1} | 0.02 | 0.58 | 1.24 |
| 21 | {X1_POI_name=Hash Marihauna and Hemp Museum} => {Class=LC1} | 0.01 | 0.57 | 1.21 |
| 23 | {X1_POI_name=Wondr Experience} => {Class=LC1} | 0.01 | 0.57 | 1.21 |
| 31 | {X4_POI_name=Albert Cuyp Market} => {Class=LC1} | 0.01 | 0.57 | 1.21 |
| 101 | {X2_POI_name=Tropenmuseum} => {Class=LC3} | 0.01 | 0.31 | 1.19 |
| 107 | {X4_POI_name=Centraal Station} => {Class=LC3} | 0.01 | 0.31 | 1.19 |
| 51 | {X2_POI_name=The Jordaan} => {Class=LC1} | 0.02 | 0.56 | 1.18 |
| 61 | {X3_POI_name=Nemo Science Museum} => {Class=LC1} | 0.02 | 0.56 | 1.18 |
| 65 | {X3_POI_name=De Hallen Amsterdam} => {Class=LC1} | 0.02 | 0.56 | 1.18 |
| 67 | {X2_POI_name=The National Maritime Museum} => {Class=LC1} | 0.02 | 0.56 | 1.18 |
| 173 | {X2_POI_name=Vondelpark} => {Class=LC1} | 0.05 | 0.56 | 1.18 |
| 103 | {X2_POI_name=Tropenmuseum} => {Class=LC2} | 0.01 | 0.31 | 1.14 |
| 149 | {X3_POI_name=Artis Zoo} => {Class=LC1} | 0.03 | 0.53 | 1.12 |
| 153 | {X1_POI_name=Artis Zoo} => {Class=LC1} | 0.03 | 0.53 | 1.12 |
| 157 | {X2_POI_name=Artis Zoo} => {Class=LC3} | 0.02 | 0.29 | 1.10 |
| 147 | {X3_POI_name=Artis Zoo} => {Class=LC2} | 0.02 | 0.29 | 1.09 |
| 117 | {X4_POI_name=De Hallen Amsterdam} => {Class=LC2} | 0.01 | 0.29 | 1.06 |
| 45 | {X2_POI_name=Madame Tusseauds} => {Class=LC1} | 0.01 | 0.50 | 1.06 |
| 77 | {X3_POI_name=Ge Gooyer Windmill} => {Class=LC1} | 0.02 | 0.50 | 1.06 |
| 79 | {X4_POI_name=Youseum Amsterdam} => {Class=LC1} | 0.02 | 0.50 | 1.06 |
| 87 | {X4_POI_name=Ripley’s Believe It or Not} => {Class=LC1} | 0.02 | 0.50 | 1.06 |
| 119 | {X4_POI_name=De Hallen Amsterdam} => {Class=LC1} | 0.02 | 0.50 | 1.06 |
| 127 | {X1_POI_name=Vondelpark} => {Class=LC3} | 0.01 | 0.27 | 1.03 |
| 133 | {X3_POI_name=Vondelpark} => {Class=LC3} | 0.01 | 0.27 | 1.03 |
| 161 | {X2_POI_name=Artis Zoo} => {Class=LC1} | 0.03 | 0.48 | 1.01 |
| 129 | {X1_POI_name=Vondelpark} => {Class=LC2} | 0.01 | 0.27 | 0.99 |
| 135 | {X3_POI_name=Vondelpark} => {Class=LC2} | 0.01 | 0.27 | 0.99 |
| 131 | {X1_POI_name=Vondelpark} => {Class=LC1} | 0.02 | 0.47 | 0.99 |
| 137 | {X3_POI_name=Vondelpark} => {Class=LC1} | 0.02 | 0.47 | 0.99 |
| 115 | {X1_POI_name=Nemo Science Museum} => {Class=LC1} | 0.02 | 0.43 | 0.91 |
| 167 | {X4_POI_name=Vondelpark} => {Class=LC1} | 0.03 | 0.43 | 0.91 |
| 159 | {X2_POI_name=Artis Zoo} => {Class=LC2} | 0.02 | 0.24 | 0.89 |
| 165 | {X4_POI_name=Vondelpark} => {Class=LC2} | 0.02 | 0.24 | 0.89 |
| 169 | {X2_POI_name=Vondelpark} => {Class=LC3} | 0.02 | 0.22 | 0.86 |
| 141 | {X4_POI_name=Tropenmuseum} => {Class=LC1} | 0.02 | 0.40 | 0.85 |
| 171 | {X2_POI_name=Vondelpark} => {Class=LC2} | 0.02 | 0.22 | 0.83 |
| 105 | {X2_POI_name=Tropenmuseum} => {Class=LC1} | 0.02 | 0.38 | 0.82 |
| 93 | {X3_POI_name=Madame Tusseauds} => {Class=LC1} | 0.01 | 0.36 | 0.77 |
References
- Adie, B.A.; Hall, C.M. Who Visits World Heritage? A Comparative Analysis of Three Cultural Sites. J. Herit. Tour. 2017, 12, 67–80. [Google Scholar] [CrossRef]
- Calle-Vaquero, M.D.L.; Garcia-Hernandez, M.; Mendoza de Miguel, S. Urban Planning Regulations for Tourism in the Context of Overtourism. Applications in Historic Centres. Sustainability 2020, 13, 70. [Google Scholar] [CrossRef]
- Neuts, B.; Nijkamp, P. Tourist Crowding Perception and Acceptability in Cities: An Applied Modelling Study on Bruges. Ann. Tour. Res. 2012, 39, 2133–2153. [Google Scholar] [CrossRef]
- Mirzaalian, F.; Halpenny, E. Exploring Destination Loyalty: Application of Social Media Analytics in a Nature-Based Tourism Setting. J. Destin. Mark. Manag. 2021, 20, 100598. [Google Scholar] [CrossRef]
- Oppermann, M. Tourism Destination Loyalty. J. Travel Res. 2000, 39, 78–84. [Google Scholar] [CrossRef]
- Pan, X.; Rasouli, S.; Timmermans, H. Investigating Tourist Destination Choice: Effect of Destination Image from Social Network Members. Tour. Manag. 2021, 83, 104217. [Google Scholar] [CrossRef]
- Zhang, H.; Wu, Y.; Buhalis, D. A Model of Perceived Image, Memorable Tourism Experiences and Revisit Intention. J. Destin. Mark. Manag. 2018, 8, 326–336. [Google Scholar] [CrossRef]
- Battour, M.; Ismail, M.N.; Battor, M.; Awais, M. Islamic Tourism: An Empirical Examination of Travel Motivation and Satisfaction in Malaysia. Curr. Issues Tour. 2017, 20, 50–67. [Google Scholar] [CrossRef]
- Jang, S.; Cai, L.A. Travel Motivations and Destination Choice: A Study of British Outbound Market. J. Travel Tour. Mark. 2002, 13, 111–133. [Google Scholar] [CrossRef]
- Martínez Suárez, R.; Castañeda García, J.A.; Rodríguez Molina, M.Á. Identifying Tourist Profiles to Reduce Overtourism: The Case of a Cultural Destination. Int. J. Tour. Cities 2021, 7, 962–985. [Google Scholar] [CrossRef]
- Tchetchik, A.; Fleischer, A.; Shoval, N. Segmentation of Visitors to a Heritage Site Using High-Resolution Time-Space Data. J. Travel Res. 2009, 48, 216–229. [Google Scholar] [CrossRef]
- Poria, Y.; Butler, R.; Airey, D. Links between Tourists, Heritage, and Reasons for Visiting Heritage Sites. J. Travel Res. 2004, 43, 19–28. [Google Scholar] [CrossRef]
- Su, D.N.; Nguyen, N.A.N.; Nguyen, Q.N.T.; Tran, T.P. The Link between Travel Motivation and Satisfaction towards a Heritage Destination: The Role of Visitor Engagement, Visitor Experience and Heritage Destination Image. Tour. Manag. Perspect. 2020, 34, 100634. [Google Scholar] [CrossRef]
- Scott, N.; Baggio, R.; Cooper, C. Network Analysis Methods for Modeling Tourism Inter-Organizational Systems. In Tourism Sensemaking: Strategies to Give Meaning to Experience; Emerald Group Publishing Limited: Bingley, UK, 2011; Volume 5, pp. 177–221. ISBN 0-85724-853-7. [Google Scholar]
- Espelt, N.G.; Benito, J.A.D. Visitors’ Behavior in Heritage Cities: The Case of Girona. J. Travel Res. 2006, 44, 442–448. [Google Scholar] [CrossRef]
- Lau, G.; McKercher, B. Understanding Tourist Movement Patterns in a Destination: A GIS Approach. Tour. Hosp. Res. 2006, 7, 39–49. [Google Scholar] [CrossRef]
- Oppermann, M. Intranational Tourist Flows in Malaysia. Ann. Tour. Res. 1992, 19, 482–500. [Google Scholar] [CrossRef]
- Silberberg, T. Cultural Tourism and Business Opportunities for Museums and Heritage Sites. Tour. Manag. 1995, 16, 361–365. [Google Scholar] [CrossRef]
- Simancas Cruz, M.; Peñarrubia Zaragoza, M.P.; Hernández-Martín, R.; Rodríguez Rodríguez, Y. The Territorial Segmentation of Coastal Tourism Areas. J. Place Manag. Dev. 2022, 15, 423–441. [Google Scholar] [CrossRef]
- Dolnicar, S. A Review of Data-Driven Market Segmentation in Tourism. J. Travel Tour. Mark. 2002, 12, 1–22. [Google Scholar] [CrossRef]
- Bigné, J.E.; Andreu, L. Emotions in Segmentation: An Empirical Study. Ann. Tour. Res. 2004, 31, 682–696. [Google Scholar] [CrossRef]
- Campo-Martinez, S.; Garau-Vadell, J.B.; Martinez-Ruiz, M.P. Factors Influencing Repeat Visits to a Destination: The Influence of Group Composition. Tour. Manag. 2010, 31, 862–870. [Google Scholar] [CrossRef]
- Lee, S.Y.; Petrick, J.F.; Crompton, J. The Roles of Quality and Intermediary Constructs in Determining Festival Attendees’ Behavioral Intention. J. Travel Res. 2007, 45, 402–412. [Google Scholar]
- Kaval, P.; Baskaran, R. Key Ideas and Concepts from Economics for Understanding the Roles and Value of Ecosystem Services. In Ecosystem Services in Agricultural and Urban Landscapes; John Wiley & Sons, Ltd.: Hoboken, NJ, USA, 2013; pp. 28–41. [Google Scholar]
- Kemperman, A. A Review of Research into Discrete Choice Experiments in Tourism: Launching the Annals of Tourism Research Curated Collection on Discrete Choice Experiments in Tourism. Ann. Tour. Res. 2021, 87, 103137. [Google Scholar] [CrossRef]
- Dane, G.; Borgers, A.; Kaya, D.I.; Feng, T. Visitor Flows at a Large-Scale Cultural Event: GPS Tracking at Dutch Design Week. ISPRS Int. J. Geo-Inf. 2020, 9, 661. [Google Scholar] [CrossRef]
- McKercher, B.; Shoval, N.; Ng, E.; Birenboim, A. First and Repeat Visitor Behaviour: GPS Tracking and GIS Analysis in Hong Kong. Tour. Geogr. 2012, 14, 147–161. [Google Scholar] [CrossRef]
- Shoval, N.; Ahas, R. The Use of Tracking Technologies in Tourism Research: The First Decade. Tour. Geogr. 2016, 18, 587–606. [Google Scholar] [CrossRef]
- Devkota, B.; Miyazaki, H.; Pahari, N. Utilizing User Generated Contents to Describe Tourism Areas of Interest. In Proceedings of the 2019 First International Conference on Smart Technology & Urban Development (STUD), Chiang Mai, Thailand, 13–14 December 2019; pp. 1–6. [Google Scholar]
- Gong, V.X.; Daamen, W.; Bozzon, A.; Hoogendoorn, S.P. Crowd Characterization for Crowd Management Using Social Media Data in City Events. Travel Behav. Soc. 2020, 20, 192–212. [Google Scholar] [CrossRef]
- Kádár, B. Measuring Tourist Activities in Cities Using Geotagged Photography. Tour. Geogr. 2014, 16, 88–104. [Google Scholar] [CrossRef]
- van der Zee, E.; Bertocchi, D.; Vanneste, D. Distribution of Tourists within Urban Heritage Destinations: A Hot Spot/Cold Spot Analysis of TripAdvisor Data as Support for Destination Management. Curr. Issues Tour. 2020, 23, 175–196. [Google Scholar] [CrossRef]
- Wang, J.; Chow, Y.S.; Biljecki, F. Insights in a City through the Eyes of Airbnb Reviews: Sensing Urban Characteristics from Homestay Guest Experiences. Cities 2023, 140, 104399. [Google Scholar] [CrossRef]
- Karayazi, S.S.; Dane, G.; de Vries, B. Utilizing Urban Geospatial Data to Understand Heritage Attractiveness in Amsterdam. ISPRS Int. J. Geo-Inf. 2021, 10, 198. [Google Scholar] [CrossRef]
- García-Palomares, J.C.; Gutiérrez, J.; Mínguez, C. Identification of Tourist Hot Spots Based on Social Networks: A Comparative Analysis of European Metropolises Using Photo-Sharing Services and GIS. Appl. Geogr. 2015, 63, 408–417. [Google Scholar] [CrossRef]
- Gede, M.; Kádár, B. Analysing Tourism Movements along the Danube River Based on Geotagged Flickr Photography. Proc. Int. Cartogr. Assoc. 2019, 2, 37. [Google Scholar] [CrossRef]
- Koutras, A.; Nikas, I.A.; Panagopoulos, A. Towards Developing Smart Cities: Evidence from GIS Analysis on Tourists’ Behavior Using Social Network Data in the City of Athens. In Smart Tourism as a Driver for Culture and Sustainability; Katsoni, V., Segarra-Oña, M., Eds.; Springer International Publishing: Cham, Switzerland, 2019; pp. 407–418. ISBN 978-3-030-03909-7. [Google Scholar]
- Karayazi, S.S.; Dane, G.; Arentze, T. An Exploration of Interactions between Urban Heritages and Tourist’s Digital Footprint: Network and Textual Analysis via Geotagged Flickr Data in Amsterdam. ISPRS Ann. Photogramm. Remote Sens. Spat. Inf. Sci. 2022, X-4/W3-2022, 105–112. [Google Scholar] [CrossRef]
- Yin, J.; Cheng, Y.; Bi, Y.; Ni, Y. Tourists Perceived Crowding and Destination Attractiveness: The Moderating Effects of Perceived Risk and Experience Quality. J. Destin. Mark. Manag. 2020, 18, 100489. [Google Scholar] [CrossRef]
- Petrick, J.F.; Backman, S.J. An Examination of the Determinants of Golf Travelers’ Satisfaction. J. Travel Res. 2002, 40, 252–258. [Google Scholar] [CrossRef]
- Vareiro, L.; Ribeiro, J.C.; Remoaldo, P.C. What Influences a Tourist to Return to a Cultural Destination? J. Tour. Res. 2019, 21, 280–290. [Google Scholar] [CrossRef]
- Zhang, H.; Fu, X.; Cai, L.A.; Lu, L. Destination Image and Tourist Loyalty: A Meta-Analysis. Tour. Manag. 2014, 40, 213–223. [Google Scholar] [CrossRef]
- Lord, G.D. The Power of Cultural Tourism. In Proceedings of the Wisconsin Heritage Tourism Conference, Lac du Flambeau, WI, USA, 17 September 1999; Volume 17. [Google Scholar]
- Gao, S.; Liu, Y.; Kang, Y.; Zhang, F. User-Generated Content: A Promising Data Source for Urban Informatics. In Urban Informatics; Shi, W., Goodchild, M.F., Batty, M., Kwan, M.-P., Zhang, A., Eds.; Springer: Singapore, 2021; pp. 503–522. ISBN 978-981-15-8983-6. [Google Scholar]
- Ilieva, R.T.; McPhearson, T. Social-Media Data for Urban Sustainability. Nat. Sustain. 2018, 1, 553–565. [Google Scholar] [CrossRef]
- Song, H.; Liu, H. Predicting Tourist Demand Using Big Data. In Analytics in Smart Tourism Design; Xiang, Z., Fesenmaier, D.R., Eds.; Springer International Publishing: Cham, Switzerland, 2017; pp. 13–29. ISBN 978-3-319-44262-4. [Google Scholar]
- Li, J.; Xu, L.; Tang, L.; Wang, S.; Li, L. Big Data in Tourism Research: A Literature Review. Tour. Manag. 2018, 68, 301–323. [Google Scholar] [CrossRef]
- Ganzaroli, A.; De Noni, I.; van Baalen, P. Vicious Advice: Analyzing the Impact of TripAdvisor on the Quality of Restaurants as Part of the Cultural Heritage of Venice. Tour. Manag. 2017, 61, 501–510. [Google Scholar] [CrossRef]
- Grimaldi, D.; Collins, C.; Acosta, S.G. Dynamic Restaurants Quality Mapping Using Online User Reviews. Smart Cities 2021, 4, 1104–1112. [Google Scholar] [CrossRef]
- Xu, X.; Li, Y. The Antecedents of Customer Satisfaction and Dissatisfaction toward Various Types of Hotels: A Text Mining Approach. Int. J. Hosp. Manag. 2016, 55, 57–69. [Google Scholar] [CrossRef]
- Xiang, Z.; Schwartz, Z.; Gerdes Jr, J.H.; Uysal, M. What Can Big Data and Text Analytics Tell Us about Hotel Guest Experience and Satisfaction? Int. J. Hosp. Manag. 2015, 44, 120–130. [Google Scholar] [CrossRef]
- Swarbrooke, J.; Horner, S. Consumer Behaviour in Tourism; Routledge: London, UK, 2007; ISBN 1-136-41473-8. [Google Scholar]
- Hui, T.K.; Wan, D.; Ho, A. Tourists’ Satisfaction, Recommendation and Revisiting Singapore. Tour. Manag. 2007, 28, 965–975. [Google Scholar] [CrossRef]
- Pizam, A.; Ellis, T. Customer Satisfaction and Its Measurement in Hospitality Enterprises. Int. J. Contemp. Hosp. Manag. 1999, 11, 326–339. [Google Scholar] [CrossRef]
- Nuñez, S.; Borbon, N.M.D. Destination Attributes and Tourist Behavior Intention in Visiting Attraction in the Province of Camarines Sur: Inputs for Action Plan. Int. J. Res. Stud. Manag 2022, 10, 9–24. [Google Scholar] [CrossRef]
- Beerli, A.; Martin, J.D. Factors Influencing Destination Image. Ann. Tour. Res. 2004, 31, 657–681. [Google Scholar] [CrossRef]
- Kozak, M. Repeaters’ Behavior at Two Distinct Destinations. Ann. Tour. Res. 2001, 28, 784–807. [Google Scholar] [CrossRef]
- Petrick, J.F.; Morais, D.D.; Norman, W.C. An Examination of the Determinants of Entertainment Vacationers’ Intentions to Revisit. J. Travel Res. 2001, 40, 41–48. [Google Scholar] [CrossRef]
- Baloglu, S.; McCleary, K.W. A Model of Destination Image Formation. Ann. Tour. Res. 1999, 26, 868–897. [Google Scholar] [CrossRef]
- Hosany, S.; Prayag, G.; Van Der Veen, R.; Huang, S.; Deesilatham, S. Mediating Effects of Place Attachment and Satisfaction on the Relationship between Tourists’ Emotions and Intention to Recommend. J. Travel Res. 2017, 56, 1079–1093. [Google Scholar] [CrossRef]
- Su, L.; Hsu, M.K. Service Fairness, Consumption Emotions, Satisfaction, and Behavioral Intentions: The Experience of Chinese Heritage Tourists. J. Travel Tour. Mark. 2013, 30, 786–805. [Google Scholar] [CrossRef]
- Wiskulski, T. The Impact of the Number of Visits and the Level of Satisfaction on the Intention to Recommend a Tourist Destination. The Example of Gdańsk. J. Geogr. Politics Soc. 2021, 11, 37–43. [Google Scholar] [CrossRef]
- Lee, I.S.; Lee, T.J.; Arcodia, C. The Effect of Community Attachment on Cultural Festival Visitors’ Satisfaction and Future Intentions. Curr. Issues Tour. 2014, 17, 800–812. [Google Scholar] [CrossRef]
- CBS (Centraal Bureau voor de Statistiek). Available online: https://longreads.cbs.nl/the-netherlands-in-numbers-2021/how-many-tourists-stay-overnight-in-the-netherlands (accessed on 10 February 2022).
- UNESCO World Heritage Center. Seventeenth-Century Canal Ring Area of Amsterdam inside the Singelgracht. Available online: https://whc.unesco.org/en/list/1349/ (accessed on 26 December 2020).
- Rey-Pérez, J.; Pereira Roders, A. Historic Urban Landscape: A Systematic Review, Eight Years after the Adoption of the HUL Approach. JCHMSD 2020, 10, 233–258. [Google Scholar] [CrossRef]
- Karayazi, S.S.; Dane, G.; Arentze, T. Visitors’ Heritage Location Choices in Amsterdam in Times of Mass Tourism: A Latent Class Analysis. J. Herit. Tour. 2024; accepted/in press. [Google Scholar]
- Things to Do in Amsterdam—2023. Available online: https://www.tripadvisor.com/Attractions-g188590-Activities-a_allAttractions.true-a_sort.TRAVELER__5F__FAVORITE__5F__V2-Amsterdam_North_Holland_Province.html (accessed on 4 September 2023).
- Agrawal, R.; Srikant, R. Fast Algorithms for Mining Association Rules; Morgan Kaufmann Publishers Inc.: Santiago, Chile, 1994; Volume 1215, pp. 487–499. [Google Scholar]
- Arreeras, T.; Arimura, M.; Asada, T.; Arreeras, S. Association Rule Mining Tourist-Attractive Destinations for the Sustainable Development of a Large Tourism Area in Hokkaido Using Wi-Fi Tracking Data. Sustainability 2019, 11, 3967. [Google Scholar] [CrossRef]
- Gopikaramanan, R.; Rameshkumar, T.; Senthil Kumaran, B.; Ilangovan, G. Novel Control Methodology for H-Bridge Cascaded Multi Level Converter Using Predictive Control Methodology. Glob. J. Pure Appl. Math 2015, 11, 3053–3071. [Google Scholar]
- Grigolon, A.; Kemperman, A.; Timmermans, H. Exploring Interdependencies in Students’ Vacation Portfolios Using Association Rules. Eur. J. Tour. Res. 2012, 5, 93–105. [Google Scholar] [CrossRef]
- Versichele, M.; De Groote, L.; Bouuaert, M.C.; Neutens, T.; Moerman, I.; Van de Weghe, N. Pattern Mining in Tourist Attraction Visits through Association Rule Learning on Bluetooth Tracking Data: A Case Study of Ghent, Belgium. Tour. Manag. 2014, 44, 67–81. [Google Scholar] [CrossRef]
- Tan, P.-N.; Kumar, V.; Srivastava, J. Selecting the Right Objective Measure for Association Analysis. Inf. Syst. 2004, 29, 293–313. [Google Scholar] [CrossRef]
- Hahsler, M.; Karpienko, R. Visualizing Association Rules in Hierarchical Groups. J. Bus. Econ. 2017, 87, 317–335. [Google Scholar] [CrossRef]
- Ju, C.; Bao, F.; Xu, C.; Fu, X. A Novel Method of Interestingness Measures for Association Rules Mining Based on Profit. Discret. Dyn. Nat. Soc. 2015, 2015, 868634. [Google Scholar] [CrossRef]
- Girardin, F.; Vaccari, A.; Gerber, A.; Biderman, A. Quantifying Urban Attractiveness from the Distribution and Density of Digital Footprints. Int. J. Spat. Data Infrastruct. Res. 2009, 4, 26. [Google Scholar]

| Attributes | All Classes (Base) | LC1 | LC2 | LC3 |
|---|---|---|---|---|
| Constant | 1.159 | 2.480 | 0.532 | 2.918 |
| Heritage category | 0.352 | 0.373 | 0.555 | 0.432 |
| Historical urban landscape values | 0.159 | 0.187 | 0.257 | 0.550 |
| Entrance fee | 1.477 | 0.445 | 2.970 | 5.065 |
| Availability of pre-visit information | 0.071 | 0.125 | 0.218 | 0.275 |
| The availability of other heritages and facilities within walking distance | 0.290 | 0.228 | 0.364 | 1.031 |
| Perceived heritage attractiveness by other visitors | 0.440 | 0.450 | 0.905 | 0.299 |
| Overall evaluation of other visitors | 0.175 | 0.171 | 0.275 | 0.595 |
| Perceived average crowdedness level by other visitors | 0.523 | 0.427 | 1.086 | 0.332 |
| Variable | Category | All Classes (%) | LC1 (%) | LC2 (%) | LC3 (%) |
|---|---|---|---|---|---|
| Gender | Male | 48.1 | 48.3 | 57.0 | 51.9 |
| Female | 51.9 | 51.7 | 43.0 | 48.1 | |
| Age | 18–34 years | 33.4 | 33.8 | 32.6 | 33.7 |
| 35–54 years | 37.8 | 36.4 | 33.7 | 46.6 | |
| 55 years or older | 28.7 | 29.8 | 33.7 | 21.7 | |
| Education | Low education | 8.8 | 8.6 | 5.8 | 12.0 |
| Middle education | 41.6 | 43.0 | 44.2 | 36.1 | |
| High education | 49.7 | 48.3 | 50.0 | 51.8 | |
| Income | <EUR 20.000 | 9.4 | 7.3 | 12.8 | 9.6 |
| EUR 20.000–50.000 | 48.1 | 49.7 | 48.8 | 44.6 | |
| >EUR 50.000 | 34.1 | 33.1 | 31.4 | 38.6 | |
| Prefer not to answer | 8.4 | 9.9 | 7.0 | 7.2 | |
| Occupation | Full-time (>32 h) | 50.0 | 47.7 | 48.8 | 55.4 |
| Part-time (<32 h) | 21.9 | 22.5 | 23.3 | 19.3 | |
| Other | 28.1 | 29.8 | 27.9 | 25.3 |
| Variable | Category | All Classes (%) | LC1 (%) | LC2 (%) | LC3 (%) |
|---|---|---|---|---|---|
| Number of day(s) | Multiple days | 24.1 | 33.1 | 10.5 | 21.7 |
| One day | 75.9 | 66.9 | 89.5 | 78.3 | |
| Purpose | City trip | 84.4 | 86.8 | 82.6 | 81.9 |
| Other | 15.6 | 13.2 | 17.4 | 18.1 | |
| Travel party (alone) | No | 87.5 | 88.7 | 89.5 | 83.1 |
| Yes | 12.5 | 11.3 | 10.5 | 16.9 | |
| Travel party (family-only adult) | No | 50.3 | 45.0 | 54.7 | 55.4 |
| Yes | 49.7 | 55.0 | 45.3 | 44.6 | |
| Travel party (family including children) | No | 79.1 | 76.8 | 76.7 | 85.5 |
| Yes | 20.9 | 23.2 | 23.3 | 14.5 | |
| Travel party (colleagues) | No | 96.3 | 97.4 | 94.2 | 96.4 |
| Yes | 3.8 | 2.6 | 5.8 | 3.6 | |
| Travel party (friends) | No | 71.9 | 74.2 | 75.6 | 63.9 |
| Yes | 28.1 | 25.8 | 24.4 | 36.1 | |
| Travel party (others) | No | 96.6 | 97.4 | 95.3 | 96.4 |
| Yes | 3.4 | 2.6 | 4.7 | 3.6 | |
| Number of people (including respondent) | Alone | 8.8 | 7.3 | 9.3 | 10.8 |
| 2 | 52.2 | 55.0 | 48.8 | 50.6 | |
| 3 | 15.3 | 16.6 | 20.9 | 7.2 | |
| 4+ | 23.8 | 21.2 | 20.9 | 31.3 | |
| Travel days | Full week | 4.1 | 6.0 | 0.0 | 4.8 |
| Weekdays | 44.1 | 43.7 | 50.0 | 38.6 | |
| Weekends | 51.9 | 50.3 | 50.0 | 56.6 | |
| Travel season | Fall | 21.9 | 17.9 | 26.7 | 24.1 |
| Spring | 28.1 | 30.5 | 29.1 | 22.9 | |
| Summer | 40.6 | 43.0 | 37.2 | 39.8 | |
| Winter | 9.4 | 8.6 | 7.0 | 13.3 | |
| Initial travel mode to Amsterdam | Car | 54.7 | 64.2 | 40.7 | 51.8 |
| Other | 1.6 | 1.3 | 3.5 | 0.0 | |
| Public transportation | 43.8 | 34.4 | 55.8 | 48.2 | |
| Travel mode within Amsterdam | Car | 10.3 | 13.2 | 4.7 | 10.8 |
| Other | 3.4 | 2.6 | 7.0 | 1.2 | |
| Public transportation | 25.6 | 28.5 | 20.9 | 25.3 | |
| Walking | 60.6 | 55.6 | 67.4 | 62.7 | |
| Heritage awareness | Did not visit (no aware) | 27.5 | 20.5 | 32.6 | 34.9 |
| No (aware but did not visit) | 24.7 | 23.8 | 25.6 | 25.3 | |
| Yes (aware and visit) | 47.8 | 55.6 | 41.9 | 39.8 |
| Rules_ID | Rules | Support | Confidence | Lift |
|---|---|---|---|---|
| 1 | {X3_POI_name=Molen van Sloten} => {Class=LC1} | 0.01 | 1.00 | 2.12 |
| 7 | {X2_POI_name=Museum Het Rembrandthuis} => {Class=LC1} | 0.02 | 1.00 | 2.12 |
| 15 | {X2_POI_name=Begijnhof} => {Class=LC1} | 0.02 | 1.00 | 2.12 |
| 13 | {X1_POI_name=St. Nicholas Basilica} => {Class=LC1} | 0.02 | 0.83 | 1.77 |
| 3 | {X4_POI_name=De Bijenkorf} => {Class=LC1} | 0.01 | 0.80 | 1.70 |
| 27 | {X3_POI_name=Rijksmuseum} => {Class=LC2} | 0.02 | 0.71 | 2.66 |
| 37 | {X1_POI_name=Tropenmuseum} => {Class=LC2} | 0.01 | 0.50 | 1.86 |
| 43 | {X2_POI_name=Ge Gooyer Windmill} => {Class=LC2} | 0.01 | 0.50 | 1.86 |
| 95 | {X2_POI_name=Ripley’s Believe It or Not} => {Class=LC2} | 0.02 | 0.50 | 1.86 |
| 109 | {X4_POI_name=Centraal Station} => {Class=LC2} | 0.02 | 0.46 | 1.72 |
| 29 | {X4_POI_name=Dutch National Opera Ballet} => {Class=LC3} | 0.02 | 0.71 | 2.75 |
| 39 | {X3_POI_name=Museum Het Rembrandthuis} => {Class=LC3} | 0.02 | 0.63 | 2.41 |
| 33 | {X4_POI_name=Artis Zoo} => {Class=LC3} | 0.01 | 0.50 | 1.93 |
| 97 | {X3_POI_name=Youseum Amsterdam} => {Class=LC3} | 0.02 | 0.50 | 1.93 |
| 139 | {X4_POI_name=Tropenmuseum} => {Class=LC3} | 0.02 | 0.47 | 1.80 |
| The Distribution of Revisit Intention | |||||
|---|---|---|---|---|---|
| ordinal | 1 | 2 | 3 | 4 | 5 |
| 16 | 75 | 338 | 632 | 219 | |
| binary | 0 | 0 | 0 | 1 | 1 |
| 429 | 851 | ||||
| β | p-Value | Exp (β) | |
|---|---|---|---|
| safe | 0.269 | 0.135 | 1.309 |
| comfort | 0.479 | 0.006 | 1.615 |
| happy | 0.743 | <0.001 | 2.102 |
| annoyed | 1.271 | <0.001 | 3.566 |
| crowdedness | 0.195 | 0.092 | 1.215 |
| satisfaction | 0.515 | <0.001 | 1.674 |
| recommend | 1.843 | <0.001 | 6.317 |
| city-life lovers | 0 | 0.118 | 0 |
| cultural attraction seekers | 0.328 | 0.070 | 1.389 |
| selective sightseers | 0.382 | 0.073 | 1.465 |
| Constant | −9.502 | <0.001 | 0.000 |
Disclaimer/Publisher’s Note: The statements, opinions and data contained in all publications are solely those of the individual author(s) and contributor(s) and not of MDPI and/or the editor(s). MDPI and/or the editor(s) disclaim responsibility for any injury to people or property resulting from any ideas, methods, instructions or products referred to in the content. |
© 2024 by the authors. Licensee MDPI, Basel, Switzerland. This article is an open access article distributed under the terms and conditions of the Creative Commons Attribution (CC BY) license (https://creativecommons.org/licenses/by/4.0/).
Share and Cite
Karayazi, S.S.; Dane, G.; Arentze, T. Analyzing the Influence of Visitor Types on Location Choices and Revisit Intentions in Urban Heritage Destinations. ISPRS Int. J. Geo-Inf. 2024, 13, 115. https://doi.org/10.3390/ijgi13040115
Karayazi SS, Dane G, Arentze T. Analyzing the Influence of Visitor Types on Location Choices and Revisit Intentions in Urban Heritage Destinations. ISPRS International Journal of Geo-Information. 2024; 13(4):115. https://doi.org/10.3390/ijgi13040115
Chicago/Turabian StyleKarayazi, Sevim Sezi, Gamze Dane, and Theo Arentze. 2024. "Analyzing the Influence of Visitor Types on Location Choices and Revisit Intentions in Urban Heritage Destinations" ISPRS International Journal of Geo-Information 13, no. 4: 115. https://doi.org/10.3390/ijgi13040115
APA StyleKarayazi, S. S., Dane, G., & Arentze, T. (2024). Analyzing the Influence of Visitor Types on Location Choices and Revisit Intentions in Urban Heritage Destinations. ISPRS International Journal of Geo-Information, 13(4), 115. https://doi.org/10.3390/ijgi13040115