Exploratory Spatial Data Analysis of Congenital Malformations (CM) in Israel, 2000–2006

Abstract
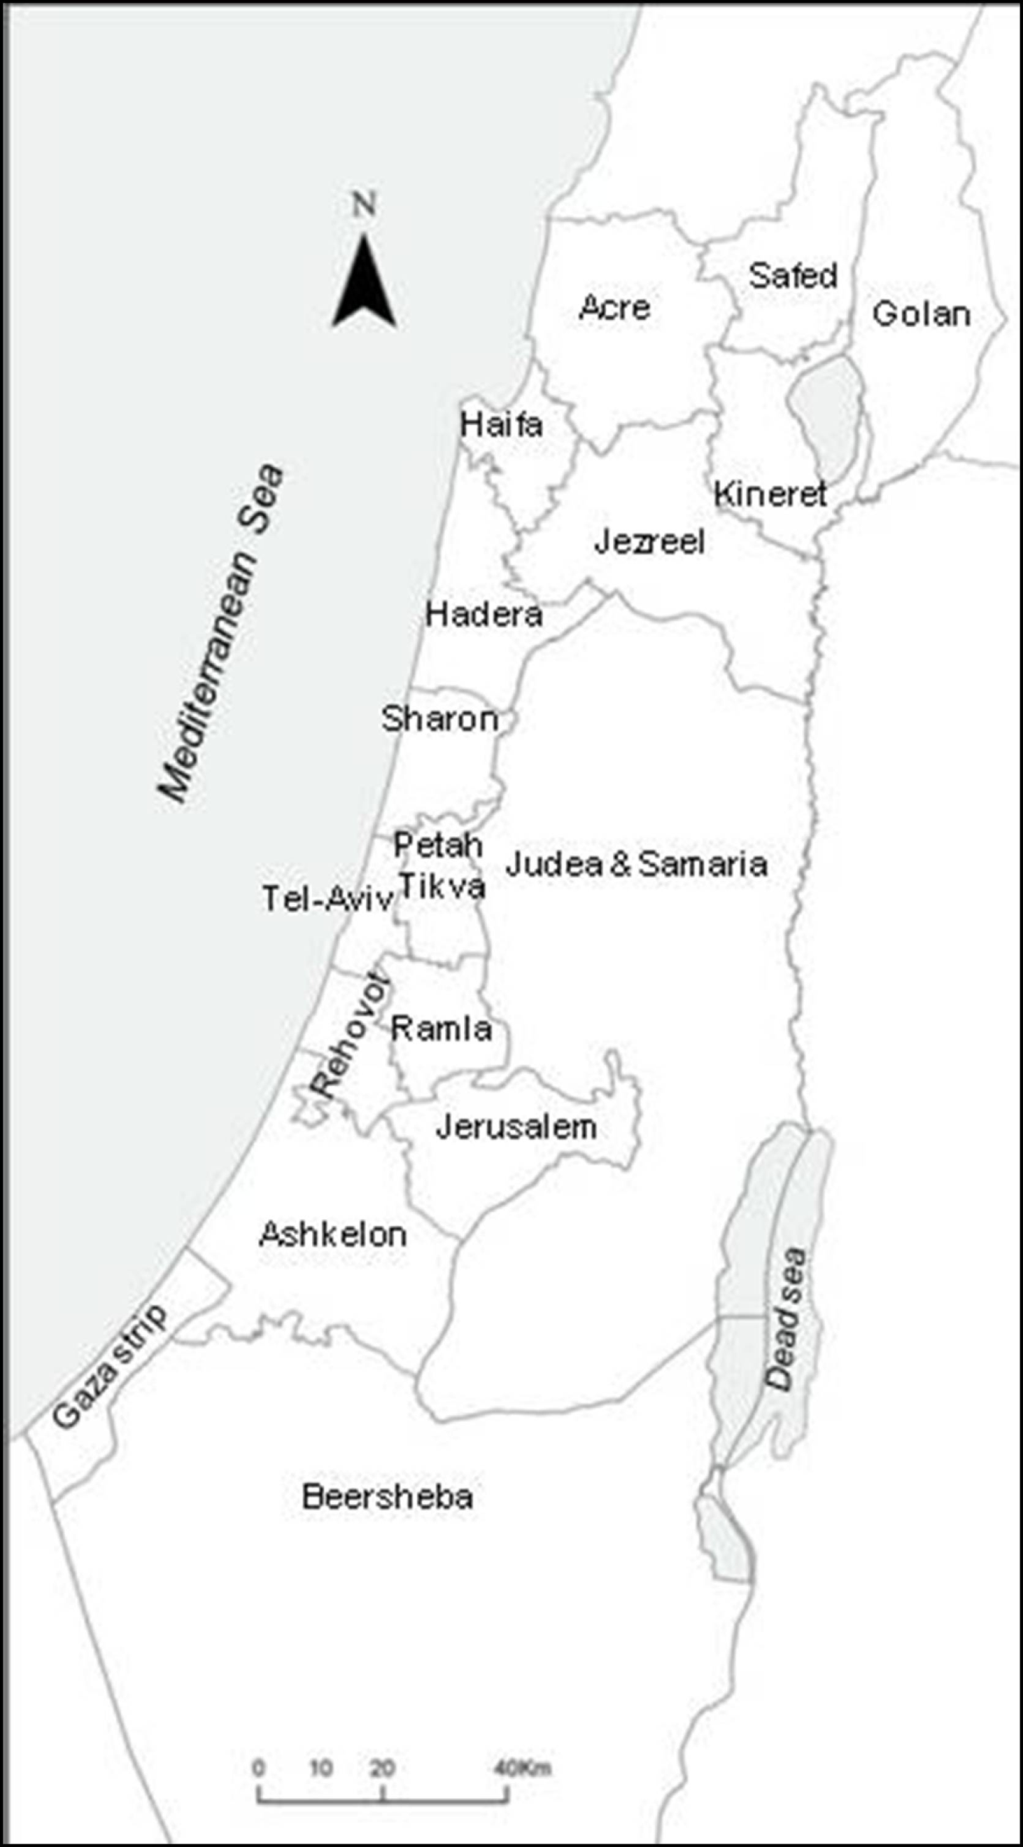
:1. Introduction

| Reference Name | CM Subtypes | Statistical Method | Cluster Analysis Unit | N Cases | Covariates/Complimentary Data to Live Births |
|---|---|---|---|---|---|
| Armstrong et al. 2007 [16] | Combined chromosomal (n = 3) and non-chromosomal (n = 27) anomaliesA total of 31 classifications as “subtypes” | Spatial scan statistics. Negative binomial model adjustment. | Residential addresses of mothers classified into areas at 4 hierarchical levels using their postcode of address at delivery. From the smallest, these were census enumeration districts, electoral ward, hospital catchment area, and register | 10,722 cases | Maternal age, Carstairs index for deprivation |
| Chi et al. 2008 [17] | Total CM | Spatial scan statistic, Poisson-based model | Centroid of the village | 127 cases | - |
| Forand et al. 2002 [18] | Surveillance malformations (Total CM well diagnosed) | Spatial scanning analysis SaTScan, Poisson-based model | Centroids of the ZIP codes | 24,394 cases included only singleton births | - |
| Kuehl and Loffredo, 2006 [19] | Hypoplastic left heart syndrome | Spatial scanning analysis SaTScan, Poisson-based model | A census block group address- the address of the mother conception was the address used | 77 Hypoplastic left heart syndrome cases | Maternal diabetes, medications, number of previous pregnancies, pre-pregnancy weight, weight gain, infant birth weight and gestational age, family income and parental education, Maternal/Paternal solvent exposure |
| Liao et al. 2011 [20] | Neural tube defects | Hierarchical Bayesian model, and Comparison between methods spatial filtering method | The location of 326 villages. | 97 Neural tube defects cases | Not specified |
| Moris et al. 1998 [21] | Down Syndrome | Knox Methods | Non spatial statistical analysis. Regional Health Authority level | 8,000 cases | Maternal age, prenatal care, Abortions |
| Poletta et al. 2007 [22] | Cleft lip with/without, and Cleft palate only | Spatial scanning analysis SaTScan | Hospital, country. | 5,128 Cleft lip with/without, 1,745 Cleft palate only | Maternal, Paternal age, maternal and paternal education, gravidity, parental consanguinity |
| Root et al. 2007 [23] | Gastroschisis | Spatial scan statistic | Residential address at birth-aggregation by blocks, block groups and tracts. | 242 cases- excluded multiple births | Maternal age, Race, Parity, Medicaid status, maternal smoking |
| Rushton and Lolonis 1996 [24] | CM, all births in the area | Spatial filtering Spatial scan, Punctual Kriging | Specific Street and number address Control address in a town address. | 2,406 cases | Maternal age |
| Siffel et al. 2006 [25] | CM | Automated Spatial Surveillance Program, kernel smoothing | Specific address | 49 cases | Not specified |
2. Results and Discussion
2.1. Global Moran I
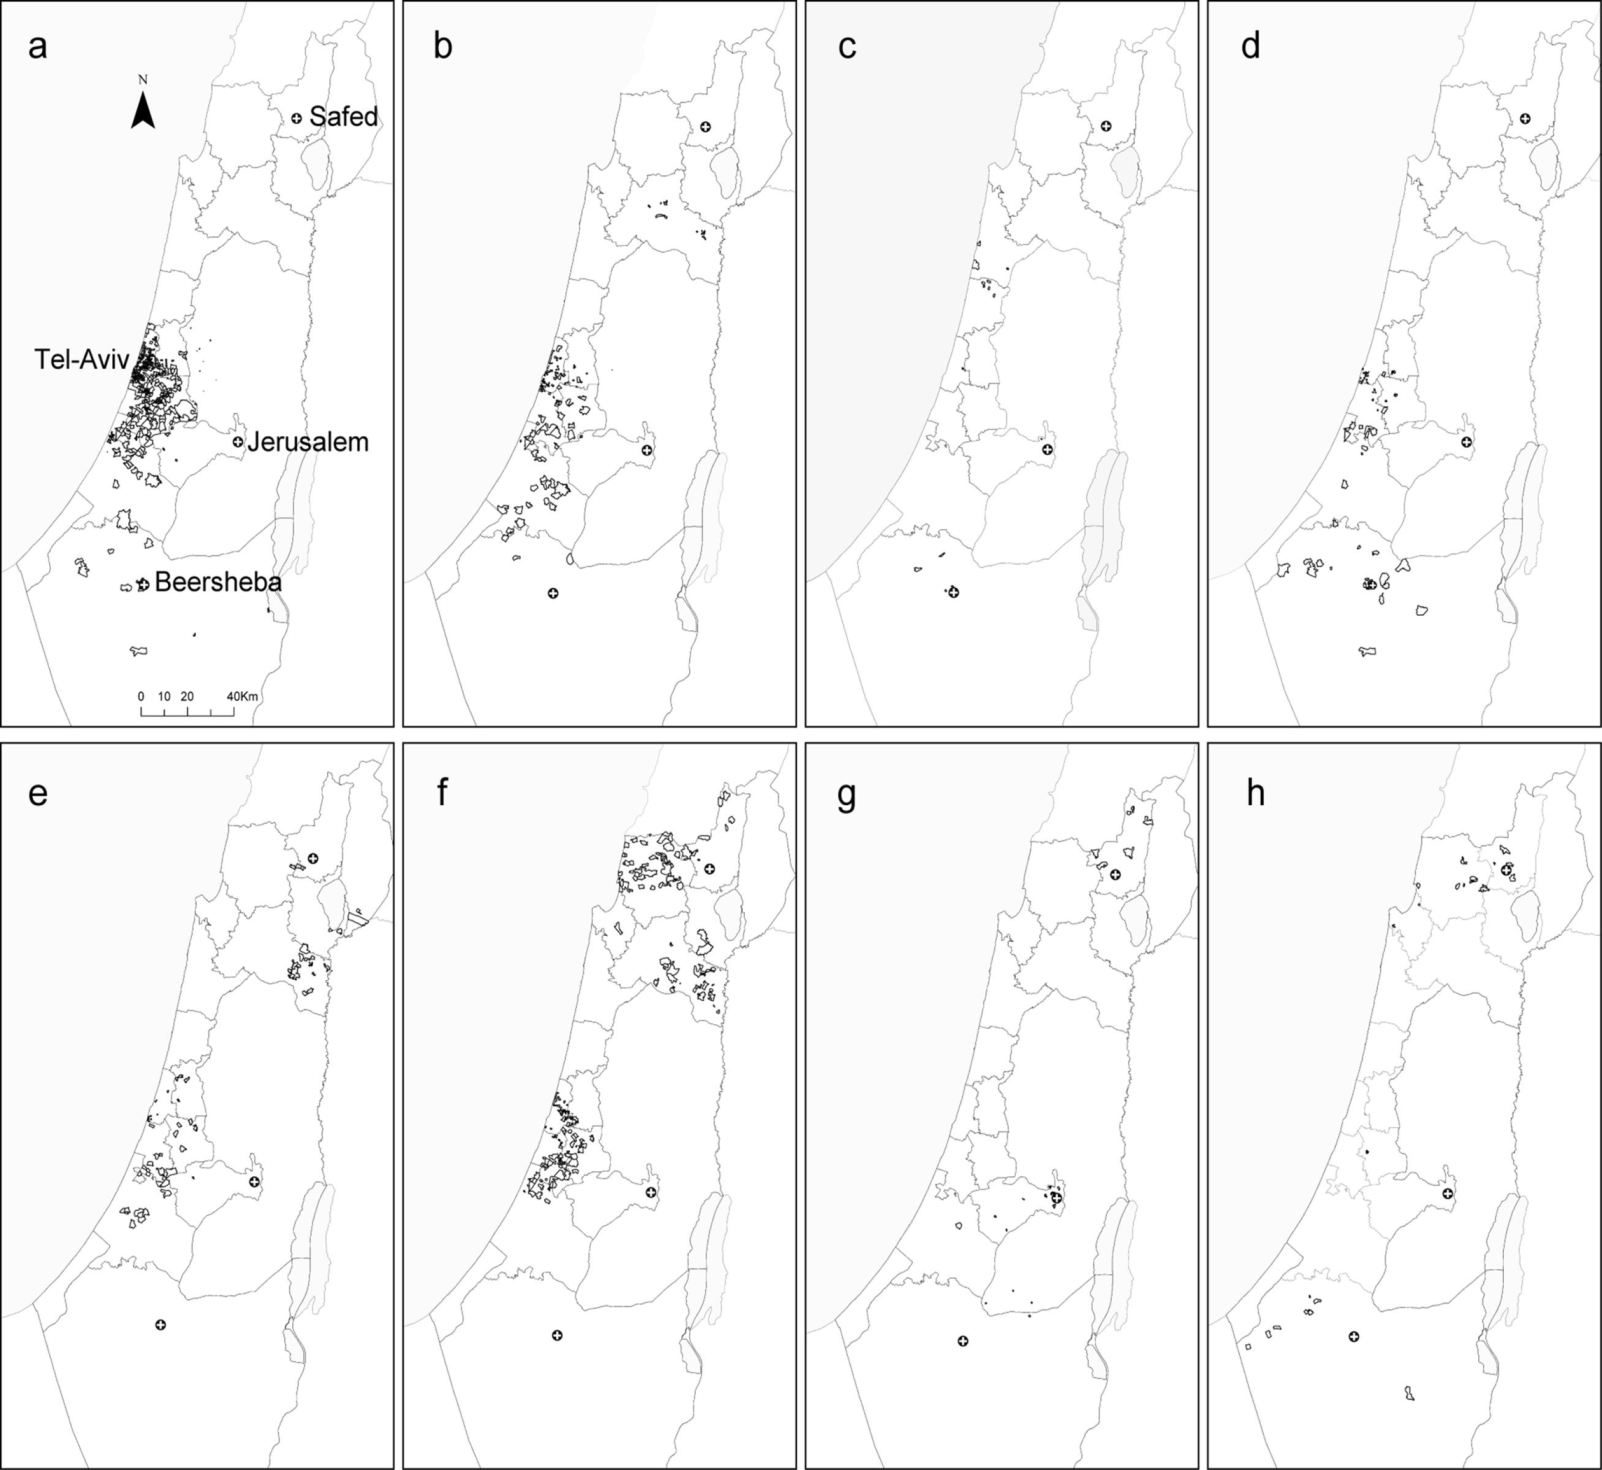
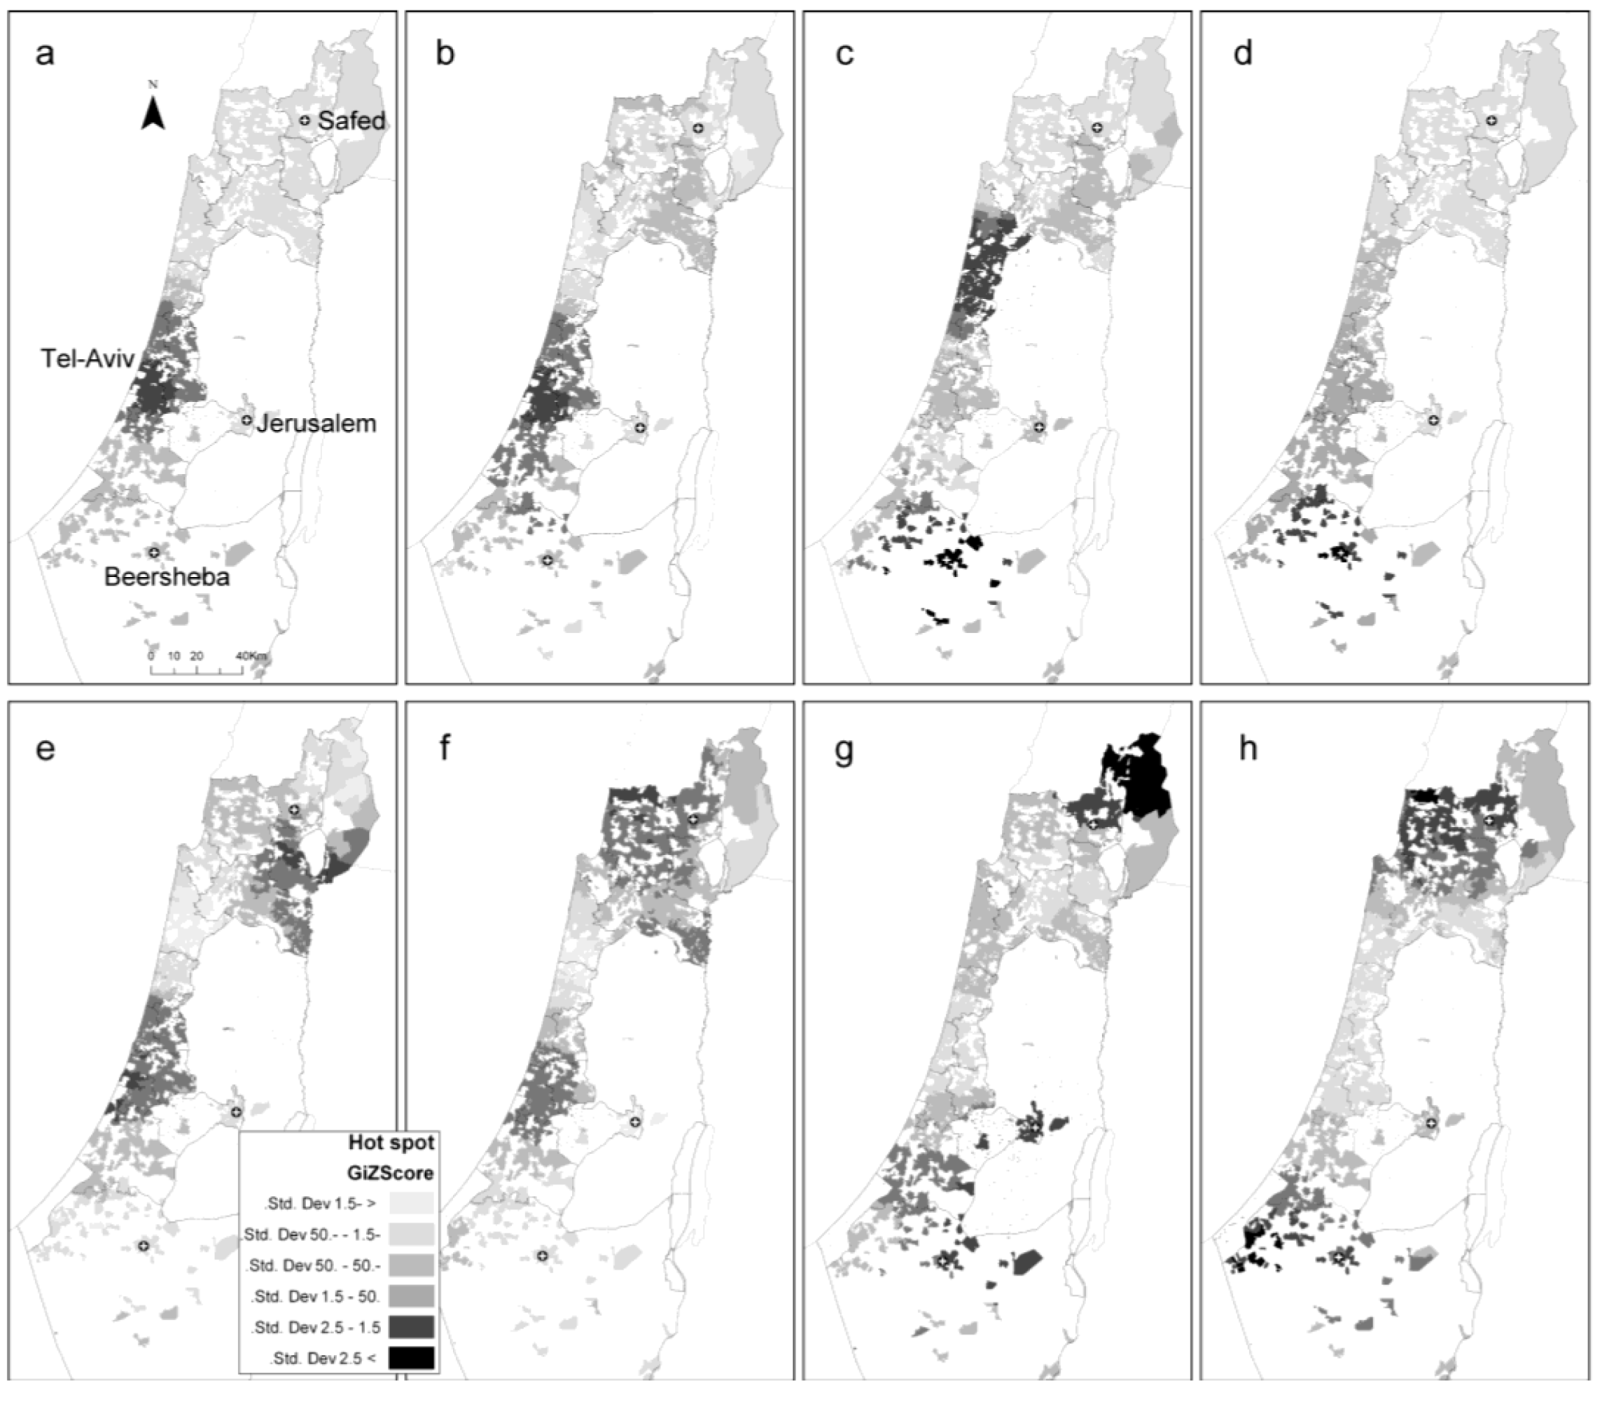
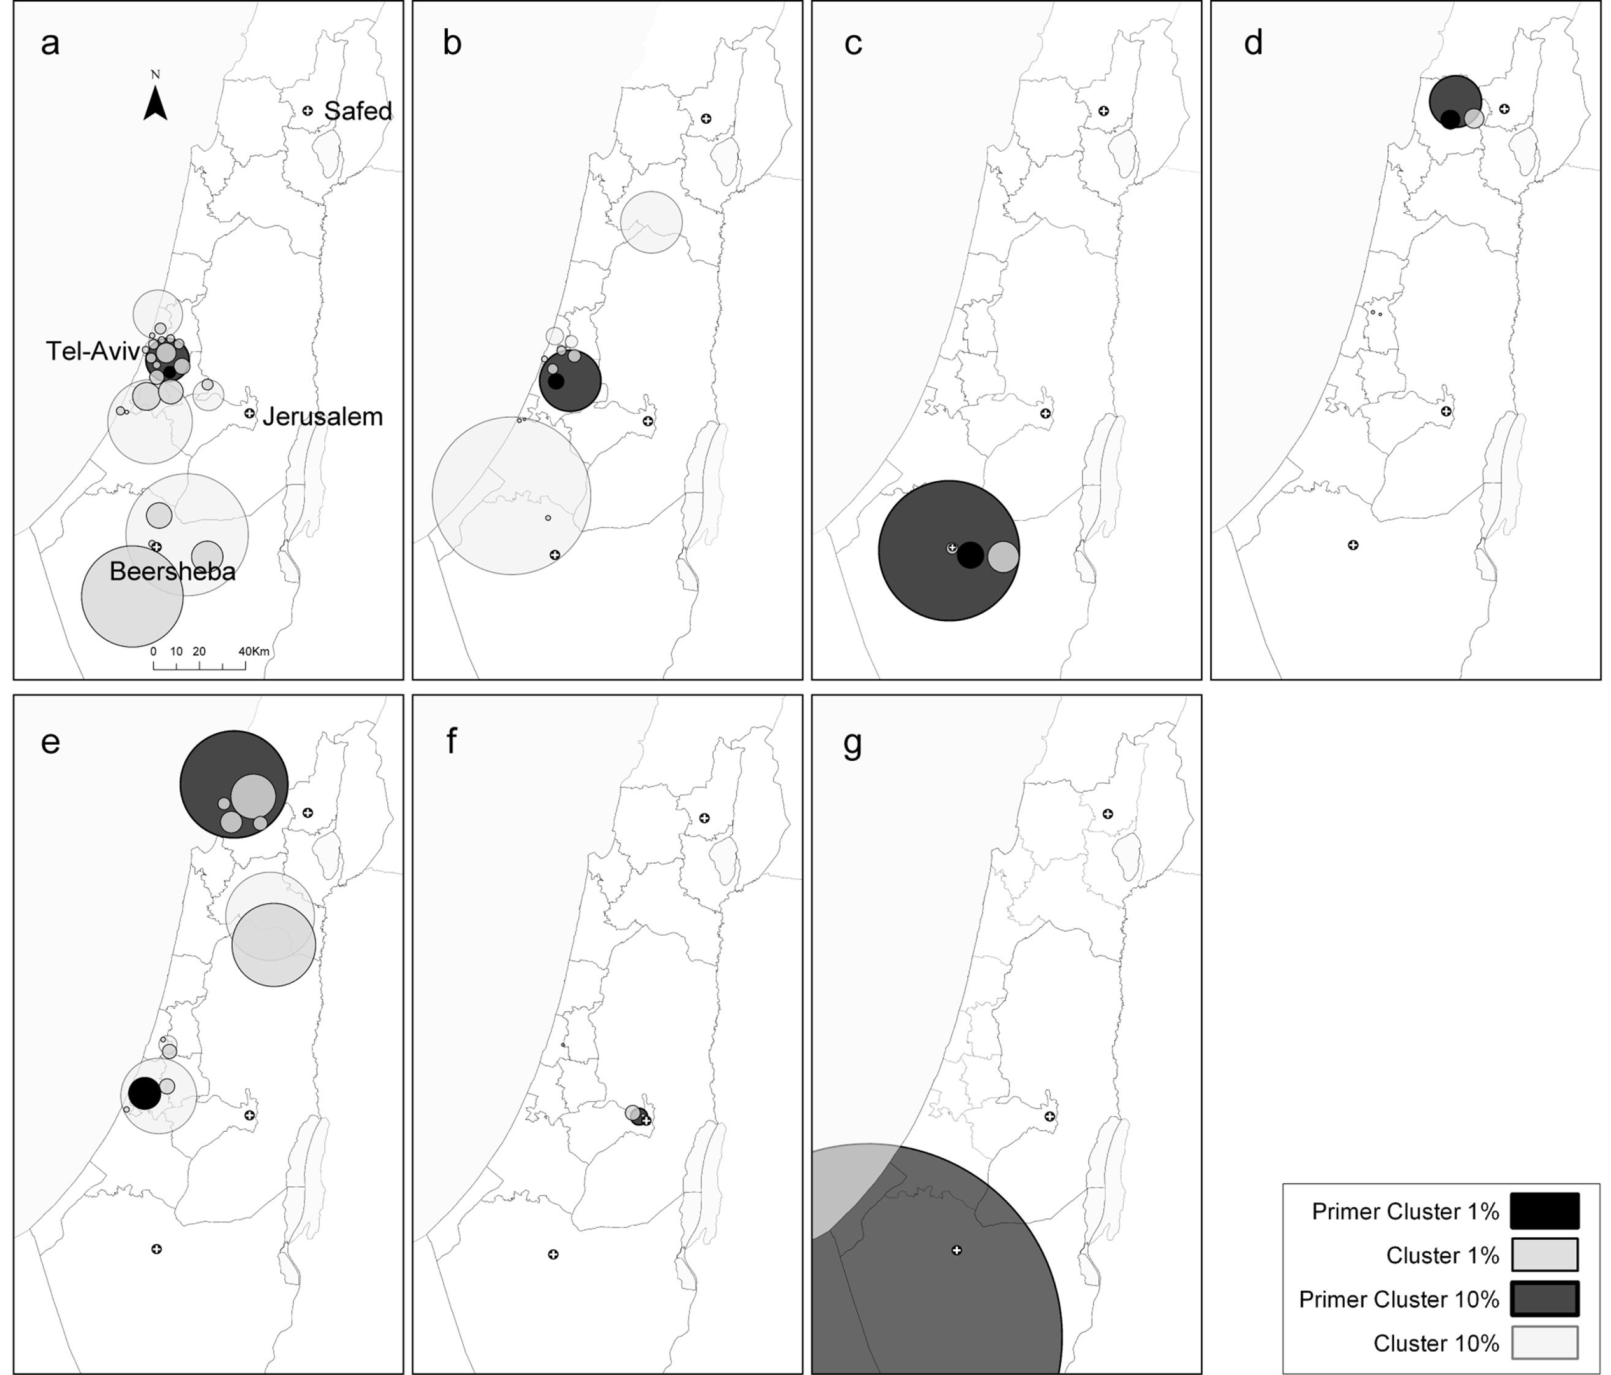
2.2. Local Clustering Analyses
| Census Tract Based Address | Global Moran I | |||||||||
|---|---|---|---|---|---|---|---|---|---|---|
| Anatomic System | CM Included | ICD-10 | Street Based Address-Total Counts | Total Counts | Mean Unadjusted Rate Ratio (* 10,000 Births) | Standard Division Unadjusted Rate Ratio (* 10,000 Births) | Maximum Unadjusted Rate Ratio (* 10,000 Births) | Moran’s Index | Z Score | p-value |
| Circulatory system | Tricuspid anomalies | Q22.8, Q22.4, Q22.9, Q22.5 | 365 | 275 | 4 | 20 | 303 | 0.01 | 6.41 | 0 |
| Atrial and atrial septal defects | Q21.1, Q24.2, Q26.2 | 4,651 | 3,334 | 48 | 110 | 3,333 | 0.16 | 74.53 | 0 | |
| Hypoplastic left heart syndrome | Q23.4 | 136 | 98 | 1 | 7 | 2,200 | 0.01 | 2.81 | 0.005 | |
| Ventricular septal defect not included in the conotruncal category | Q21, Q21.0, Q21.2 | 5,266 | 3,824 | 57 | 146 | 3,333 | 0.02 | 10.79 | 0 | |
| All Heart CM | Q20–Q25 | 17,294 | 12,929 | 187 | 301 | 6,667 | 0.09 | 41.52 | 0 | |
| Male-genital organs | Cryptorchidism | Q53, Q53.0, Q53.1, Q53.2, Q53.9 | 2,485 | 1,905 | 25 | 65 | 1,052 | 0.03 | 11.99 | 0 |
| Hypospadias | Q54, Q54.0, Q54.1,Q54.2, Q54.3, Q54.8, Q54.9 | 2,593 | 1,937 | 26 | 71 | 2,000 | 0.01 | 3.05 | 0.002 | |
| Chromosomal CM | Down syndrome | Q90.0, Q90.2, Q90.9 | 1,048 | 726 | 9 | 67 | 2,500 | 0.01 | 2.93 | 0.003 |
| Musculo-skeletal system | Polydactyly | Q69.0, Q69.1, Q69.2, Q69.9, | 760 | 578 | 6.5 | 29.7 | 526.3 | 0.01 | 2.51 | 0.012 |
| TOTAL BIRTHS | 1,000,470 | 740,899 | 283 | 596 | 9,090 | |||||


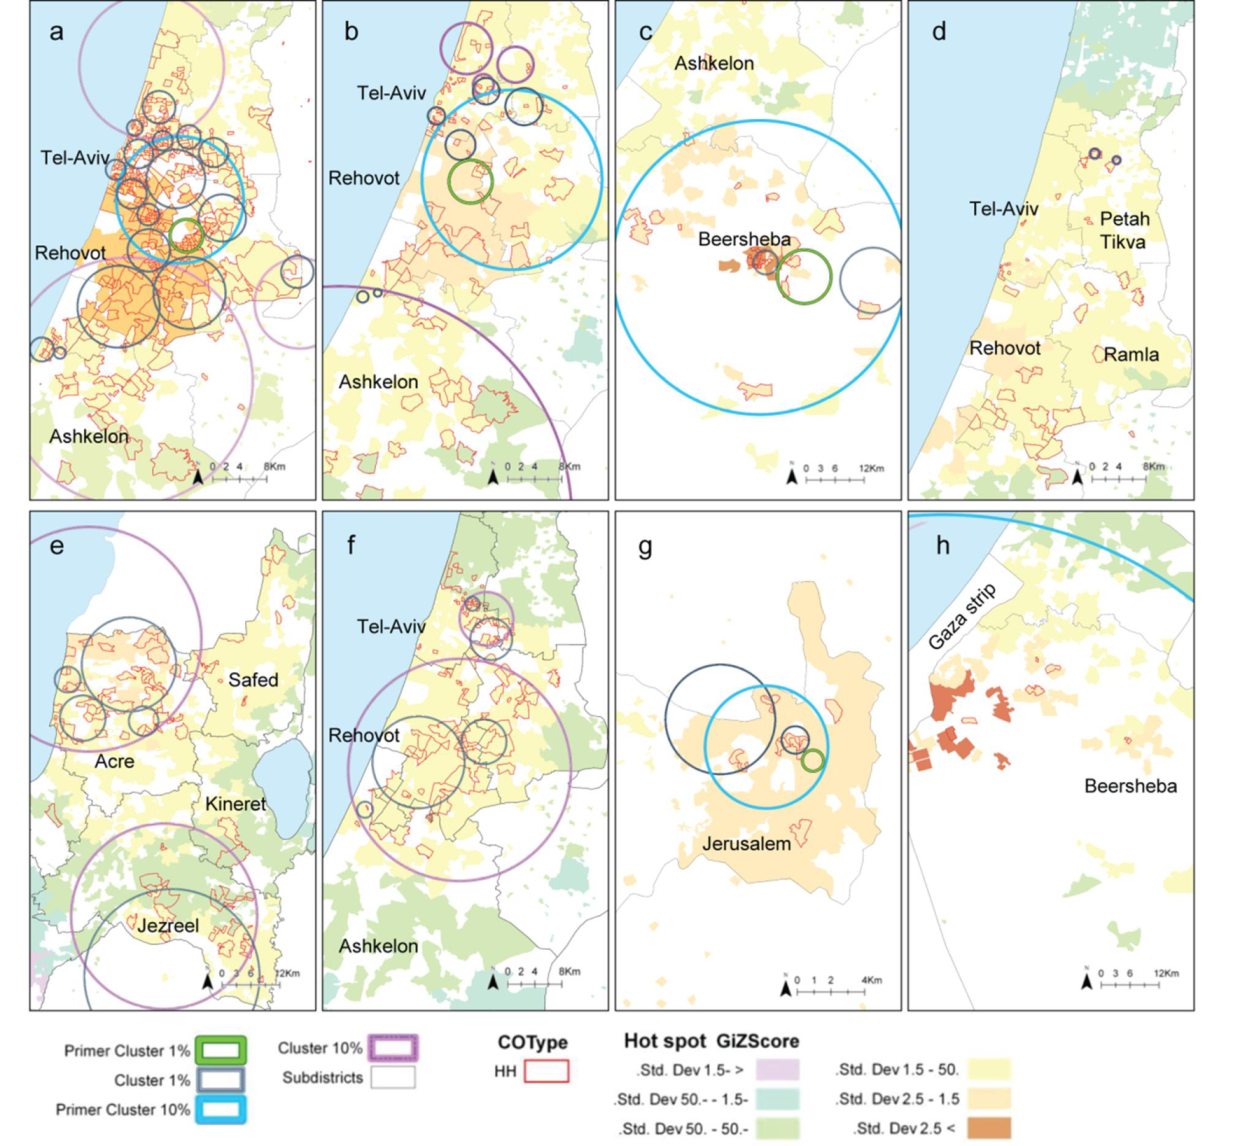
2.3. Comparison between the Local Clustering Methods
2.4. Discussion
3. Experimental Section
3.1. Data Source and Study Population
3.2. Ethics in Publishing
3.3. Study Design
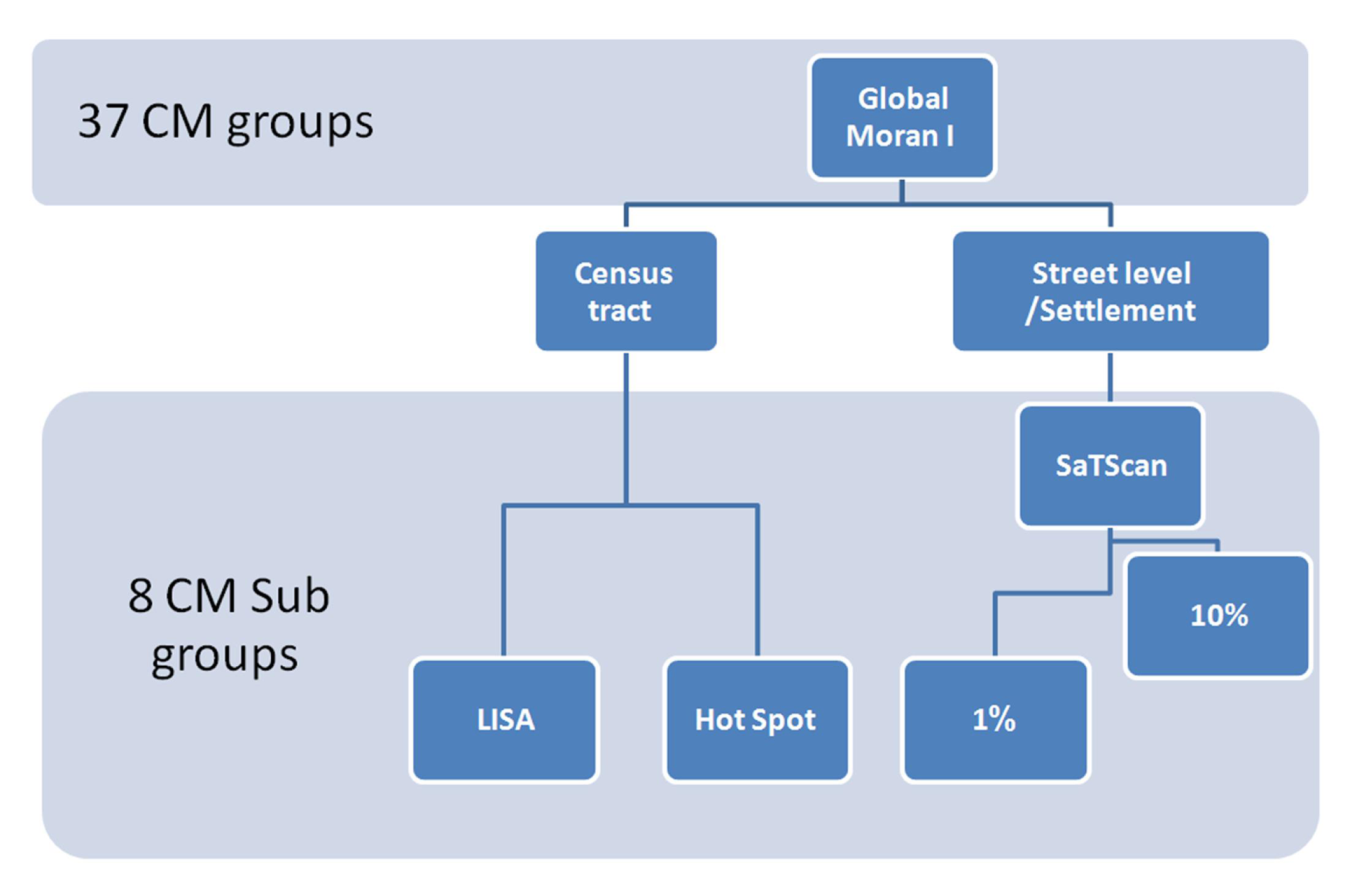
3.4. Geospatial Analyses
3.4.1. Global Moran I
3.4.2. Local Indicator of Spatial Association (LISA)
3.4.3. Hot Spot Analysis
3.4.4. Spatial Scan Statistics (SaTScan)
3.5. Research Process
4. Conclusions
Acknowledgments
References
- Christianson, A.; Howson, C.P.; Modell, B. March of Dimes—Global Report on Birth Defects; White Plains: New York, NY, USA, 2006. [Google Scholar]
- Davies, K. Economic costs of childhood diseases and disabilities attributable to environmental contaminants in Washington State, USA. Ecohealth 2006, 3, 86–94. [Google Scholar] [CrossRef]
- Anselin, L. Local indicators of spatial association—Lisa. Geogr. Anal. 1995, 27, 93–115. [Google Scholar] [CrossRef]
- Crighton, E.J.; Elliott, S.J.; Moineddin, R.; Kanaroglou, P.; Upshur, R.E.G. An exploratory spatial analysis of pneumonia and influenza hospitalizations in Ontario by age and gender. Epidemiol. Infect. 2007, 135, 253–261. [Google Scholar] [CrossRef]
- Kieffer, E.; Alexander, G.; Lewis, N.; Mor, J. Geographic patterns of low-birth-weight in Hawaii. Soc. Sci. Med. 1993, 36, 557–564. [Google Scholar] [CrossRef]
- Pouliou, T.; Elliott, S.J. An exploratory spatial analysis of overweight and obesity in Canada. Prev. Med. 2009, 48, 362–367. [Google Scholar] [CrossRef]
- Auchincloss, A.H.; Gebreab, S.Y.; Mair, C.; Diez Roux, A.V. Review of spatial methods in epidemiology, 2000-2010. Annu. Rev. Public Health 2012. [Google Scholar] [CrossRef]
- Curtis, A.; Leitner, M. Geographic Information Systems and Public Health: Eliminating Perinatal Disparity; IRM Press: Hershey, PA, USA, 2006. [Google Scholar]
- Besag, J.; Newell, J. The detection of clusters in rare diseases. J. Roy. Statist. Soc. Ser. A Stat. 1991, 154, 143–155. [Google Scholar] [CrossRef]
- Moran, P.A. Notes on continuous stochastic phenomena. Biometrika 1950, 37, 17–23. [Google Scholar]
- Getis, A.; Ord, J. The analysis of spatial association by use of distance statistics. Geogr. Anal. 1992, 24, 189–206. [Google Scholar] [CrossRef]
- Kulldorff, M. A spatial scan statistic. Commun. Stat. Theor. Method. 1997, 26, 1481–1496. [Google Scholar] [CrossRef]
- Barchana, M.; Liptshitz, I.; Fishler, Y.; Green, M. Geographical Mapping of Malignant Diseases in Israel 2001-2005; Israel National Cancer Registry: Jerusalem, Israel, 2007. [Google Scholar]
- Eitan, O.; Yuval; Barchana, M.; Dubnov, J.; Linn, S.; Carmel, Y.; Broday, D.M. Spatial analysis of air pollution and cancer incidence rates in Haifa Bay, Israel. Sci. Total Environ. 2010, 408, 4429–4439. [Google Scholar] [CrossRef]
- Bentov, Y.; Kordysh, E.; Hershkovitz, R.; Belmaker, I.; Polyakov, M.; Bilenko, N.; Sarov, B. Major congenital malformations and residential proximity to a regional industrial park including a national toxic waste site: An ecological study. Environ. Health 2006. [Google Scholar] [CrossRef]
- Armstrong, B.G.; Dolk, H.; Pattenden, S.; Vrijheid, M.; Loane, M.; Rankin, J.; Dunn, C.E.; Grundy, C.; Abramsky, L.; Boyd, P.A.; et al. Geographic variation and localised clustering of congenital anomalies in Great Britain. Emerg. Themes Epidemiol. 2007. [Google Scholar] [CrossRef] [Green Version]
- Chi, W.; Wang, J.; Li, X.; Zheng, X.; Liao, Y. Analysis of geographical clustering of birth defects in Heshun county, Shanxi province. Int. J. Environ. Health Res. 2008, 18, 243–252. [Google Scholar] [CrossRef]
- Forand, S.P.; Talbot, T.O.; Druschel, C.; Cross, P.K. Data quality and the spatial analysis of disease rates: Congenital malformations in New York State. Health Place 2002, 8, 191–199. [Google Scholar] [CrossRef]
- Kuehl, K.S.; Loffredo, C.A. A cluster of hypoplastic left heart malformation in Baltimore, Maryland. Pediatr. Cardiol. 2006, 27, 25–31. [Google Scholar] [CrossRef]
- Liao, Y.; Wang, J.; Wu, J.; Wang, J.; Zheng, X. A comparison of methods for spatial relative risk mapping of human neural tube defects. Stoch. Environ. Res. Risk Assess. 2011, 25, 99–106. [Google Scholar] [CrossRef]
- Morris, J.K.; Alberman, E.; Mutton, D. Is there evidence of clustering in Down syndrome? Int. J. Epidemiol. 1998, 27, 495–498. [Google Scholar] [CrossRef]
- Poletta, F.A.; Castilla, E.E.; Orioli, I.M.; Lopez-Camelo, J.S. Regional analysis on the occurrence of oral clefts in South America. Amer. J. Med. Genet. A 2007, 143A, 3216–3227. [Google Scholar] [CrossRef]
- Root, E.D.; Meyer, R.E.; Emch, M.E. Evidence of localized clustering of gastroschisis births in North Carolina, 1999–2004. Soc. Sci. Med. 2009, 68, 1361–1367. [Google Scholar] [CrossRef]
- Rushton, G.; Lolonis, P. Exploratory spatial analysis of birth defect rates in an urban population. Stat. Med. 1996, 15, 717–726. [Google Scholar] [CrossRef]
- Siffel, C.; Strickland, M.J.; Gardner, B.R.; Kirby, R.S.; Correa, A. Role of geographic information systems in birth defects surveillance and research. Birth Defects Res. A. Clin. Mol. Teratol. 2006, 76, 825–833. [Google Scholar] [CrossRef]
- Canaku, D.; Tulchinsky, T.H.; Neumark, Y. Regional Analysis of Congenital Malformation in Israel, 2001 and 2005. Master Thesis, Hebrew University, Jerusalem, Israel, 2007. [Google Scholar]
- Agay-Shay, K.; Peretz, C.; Friger, M.; Peled, A.; Amitai, Y.; Linn, S. Congenital Malformation and Air Pollution in Israel, 2000–2006. Ph.D. Thesis, Haifa University, Haifa, Israel, 2013. [Google Scholar]
- Zlotogora, J.; Haklai, Z.; Rotem, N.; Georgi, M.; Rubin, L. The impact of prenatal diagnosis and termination of pregnancy on the relative incidence of malformations at birth among Jews and Muslim Arabs in Israel. Isr. Med. Assoc. J. 2010, 12, 539–542. [Google Scholar]
- Apple, A. Pre-Natal Diagnostic of CM and Pregnancy Termination among Orthodox Women; Knesset Research and Information Center: Jerusalem, Israel, 2003. [Google Scholar]
- Gurrieri, F.; Kjaer, K.; Sangiorgi, E.; Neri, G. Limb anomalies: Developmental and evolutionary aspects. Am. J. Med. Genet. 2002, 115, 231–244. [Google Scholar] [CrossRef]
- Engel, L.S.; O’Meara, E.S.; Schwartz, S.M. Maternal occupation in agriculture and risk of limb defects in Washington State, 1980–1993. Scand. J. Work Environ. Health 2000, 26, 193–198. [Google Scholar] [CrossRef]
- Elliott, P.; Richardson, S.; Abellan, J.J.; Thomson, A.; de Hoogh, C.; Jarup, L.; Briggs, D.J. Geographic density of landfill sites and risk of congenital anomalies in England. Occup. Environ. Med. 2009, 66, 81–89. [Google Scholar]
- Dolk, H.; Vrijheid, M.; Armstrong, B.; Abramsky, L.; Bianchi, F.; Garne, E.; Nelen, V.; Robert, E.; Scott, J.E.; Stone, D.; et al. Risk of congenital anomalies near hazardous-waste landfill sites in Europe: The EUROHAZCON study. Lancet 1998, 352, 423–427. [Google Scholar]
- Dummer, T.J.; Dickinson, H.O.; Parker, L. Adverse pregnancy outcomes near landfill sites in Cumbria, northwest England, 1950–1993. Arch. Environ. Health 2003, 58, 692–698. [Google Scholar] [CrossRef]
- Yiee, J.H.; Baskin, L.S. Environmental factors in genitourinary development. J. Urol. 2010, 184, 34–41. [Google Scholar] [CrossRef]
- Reuters Israel to phase out civilian atomic reactor by 2018. Ynetnews 20/3/2012. Available online: http://www.ynetnews.com/articles/0,7340,L-4205587,00.html (accessed on 16 July 2012).
- Elliott, P. Spatial Epidemiology: Methods and Applications; Oxford University Press: Oxford, UK, 2000. [Google Scholar]
- Mazumdar, S.; King, M.; Liu, K.; Zerubavel, N.; Bearman, P. The spatial structure of autism in California, 1993–2001. Health Place 2010, 16, 539–546. [Google Scholar] [CrossRef]
- Main, K.M.; Skakkebaek, N.E.; Virtanen, H.E.; Toppari, J. Genital anomalies in boys and the environment. Best Pract. Res. Clin. Endoc. Metab. 2010, 24, 279–289. [Google Scholar]
- Garcia, L. Escaping the Bonferroni iron claw in ecological studies. Oikos 2004, 105, 657–663. [Google Scholar] [CrossRef]
- Ord, J.K.; Getis, A. Local spatial autocorrelation statistics—Distributional issues and an application. Geogr. Anal. 1995, 27, 286–306. [Google Scholar]
- Getis, A.; Morrison, A.; Gray, K.; Scott, T. Characteristics of the spatial pattern of the dengue vector, Aedes aegypti, in Iquitos, Peru. Amer. J. Trop. Med. Hyg. 2003, 69, 494–505. [Google Scholar]
© 2013 by the authors; licensee MDPI, Basel, Switzerland. This article is an open access article distributed under the terms and conditions of the Creative Commons Attribution license (http://creativecommons.org/licenses/by/3.0/).
Share and Cite
Agay-Shay, K.; Amitai, Y.; Peretz, C.; Linn, S.; Friger, M.; Peled, A. Exploratory Spatial Data Analysis of Congenital Malformations (CM) in Israel, 2000–2006. ISPRS Int. J. Geo-Inf. 2013, 2, 237-255. https://doi.org/10.3390/ijgi2010237
Agay-Shay K, Amitai Y, Peretz C, Linn S, Friger M, Peled A. Exploratory Spatial Data Analysis of Congenital Malformations (CM) in Israel, 2000–2006. ISPRS International Journal of Geo-Information. 2013; 2(1):237-255. https://doi.org/10.3390/ijgi2010237
Chicago/Turabian StyleAgay-Shay, Keren, Yona Amitai, Chava Peretz, Shai Linn, Michael Friger, and Ammatzia Peled. 2013. "Exploratory Spatial Data Analysis of Congenital Malformations (CM) in Israel, 2000–2006" ISPRS International Journal of Geo-Information 2, no. 1: 237-255. https://doi.org/10.3390/ijgi2010237