Article

The Application of WebGIS Tools for Visualizing Coastal Flooding Vulnerability and Planning for Resiliency: The New Jersey Experience

1
Center for Remote Sensing & Spatial Analysis, Rutgers University, New Brunswick, NJ 08901, USA
2
Jacques Cousteau National Estuarine Research Reserve, Tuckerton, NJ 08087, USA
*
Author to whom correspondence should be addressed.
ISPRS Int. J. Geo-Inf. 2014, 3(2), 408-429; https://doi.org/10.3390/ijgi3020408
Submission received: 2 October 2013 / Revised: 5 March 2014 / Accepted: 10 March 2014 / Published: 26 March 2014
(This article belongs to the Special Issue Coastal GIS)

Abstract

:
While sea level rise is a world-wide phenomenon, mitigating its impacts is a local decision-making challenge that is going to require site-specific remedies. Faced with a variety of conflicting mandates and uncertainty as to appropriate responses, local land use planners and managers need place-based decision support tools. With the increasing availability of high-resolution digital elevation models and the advancing speed and sophistication of web-based mapping, a number of web geographic information systems (GIS) tools have been developed to map and visualize what areas of a coastal landscape will potentially be flooded under different scenarios of sea level rise. This paper presents a case study of one such WebGIS application, NJFloodMapper (www.NJFloodMapper.org), with a focus on the user-centered design process employed to help our target audience of coastal decision-makers in the state of New Jersey, USA, access and understand relevant geographic information concerning sea level rise and exposure to coastal inundation, as well as assess the vulnerability of key infrastructure, populations and natural resources within their communities. We discuss the success of this approach amidst the broader context of the application of WebGIS tools in this arena. Due to its flexible design and user-friendly interface, NJFloodMapper has been widely adopted by government and non-governmental agencies in the state to assess coastal flooding exposure and vulnerability in the aftermath of a recent destructive coastal storm. However, additional decision support tools are needed to help coastal decision-makers translate the place-based information into concrete action plans aimed at promoting more resilient coastal land use decisions.

1. Introduction

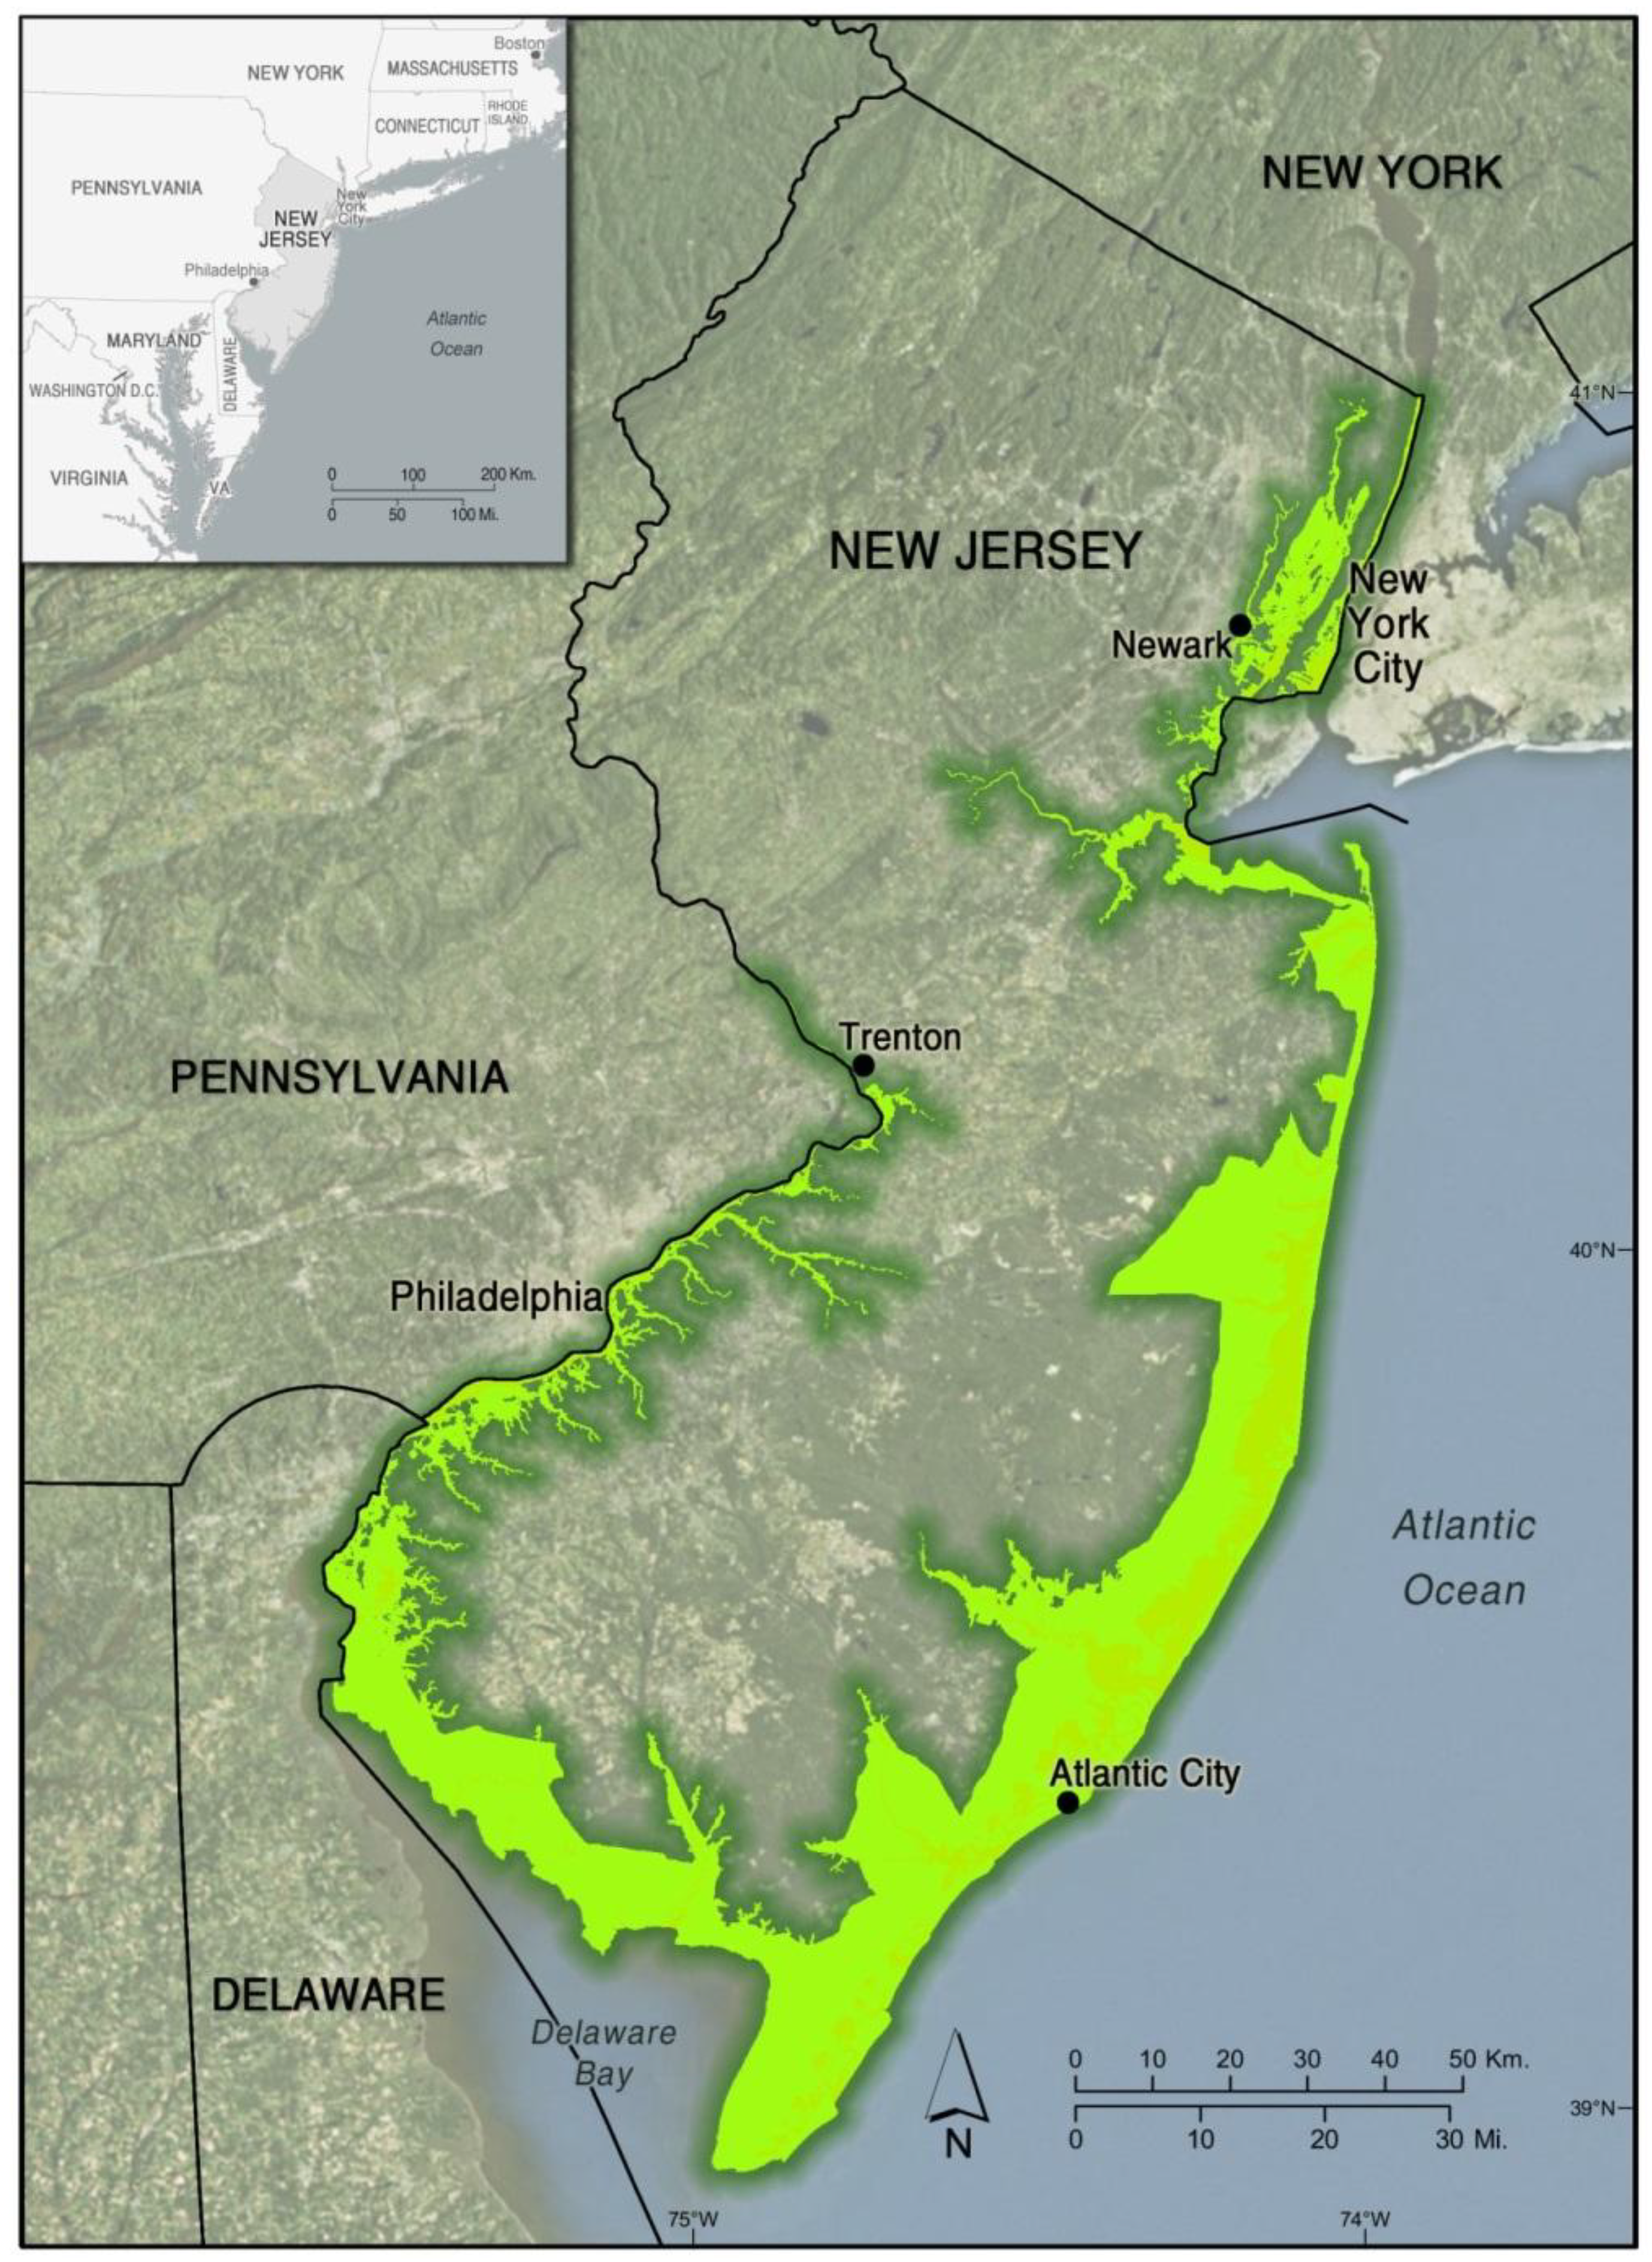
Sea level rise is a physical reality that is impacting the New Jersey and the entire Mid-Atlantic United States (New Jersey, Delaware, Pennsylvania and New York) coastline. The historical rate of sea level rise along the New Jersey coast is 3–4 mm/yr, while predicted future rates are expected to increase to 6 mm/yr [1,2,3]. The hazards posed by both sea level rise and severe coastal weather events have fostered a number of regional studies [4,5,6,7,8,9,10,11]. Subsequent to Superstorm Sandy devastating the densely populated Mid-Atlantic coastline in late October 2013, there has been an overwhelming call for the need to increase the resiliency of coastal human communities and natural ecosystems. We suggest that future adaptation to sea level rise should not only be an engineering issue, but rather primarily a land use issue. Through their land use planning, development and management decisions, local decision-makers will greatly influence future impacts of sea level rise and global climate change. While sea level rise is a world-wide phenomenon, mitigating its impacts is a local decision-making challenge and is going to require site-specific remedies. Increasingly, it is being recognized that engineered shoreline stabilization (sometimes labeled “hard” approaches) is an expensive, short-term solution. Instead, flexible adaptation strategies (sometimes labeled “soft” or “strategic adjustment” approaches) that recognize and plan for the dynamic nature of coastal areas are being promoted [8,10,12]. Faced with a variety of conflicting mandates and uncertainty as to the appropriate responses, local land use planners and managers would greatly benefit from place-based decision support system tools that outline a range of geographically targeted management options.
The nationwide National Estuarine Research Reserve (NERR) network has identified sea level change as the focus of a system-wide NERR initiative [13]. Climate change and sea level rise issues are also forefront priorities for the Jacques Cousteau NERR (JC NERR) on the New Jersey Atlantic coastline. The JC NERR in collaboration with NERR networks in Maryland and Virginia held a one-day workshop to provide background information related to climate change and sea level rise, as well as to assess the knowledge level and needs of the local coastal decision-making community (How Prepared Are you For Rising Waters? Planning for Sea Level Rise Regional and Local Considerations for Coastal Areas, December 2008). The audience of coastal decision-makers highlighted their perceived need for place-based information and decision support tools to inform land use planning, floodplain management and emergency management in the face of accelerating sea level rise. In thinking about decision support tools related to sea level rise and climate change, a 2007 NOAA workshop [14] examining this issue provides useful guidance:
  • Tools should incorporate information ascertained through scientific research and modeling that can be easily applied by state and local governments and large landowners when planning future land use and deciding on policy and regulations that affect coastal resources;
  • Tools should forecast expected habitat changes, especially the potential loss of habitats important for ecological services;
  • Tools should be easy to translate to decision-makers;
  • Tools should enable easy understanding of potential risks to people and development due to future flooding and related hazards.
With this in mind, researchers from the Rutgers University Center for Remote Sensing collaborated with the JC NERR Coastal Training Program to examine how geospatial decision-making tools could be developed and implemented to promote coastal resilience in the face of sea level rise and extreme storm events. Our goal was to provide a diverse community of concerned parties interested in coastal management and conservation greater access to relevant spatial information to make more informed decisions. In some respects, our interest falls within the broader rubric of Public Participation Geographic Information Systems (PPGIS). PPGIS pertains to the use of geographic information systems (GIS) to broaden public involvement in policymaking and implicitly assumes that extending the use of geospatial information to all relevant stakeholders will lead to better policy and decision-making [15]. Our project was not designed to specifically increase public participation in coastal decision-making per se, but rather, to facilitate “decision-makers” (i.e., government agency and non-governmental organization personnel) in accessing and understanding relevant geographic information concerning sea level rise and exposure to coastal inundation.
As our target audiences of coastal decision-makers were non-expert GIS users without ready access to GIS software and data, we opted for a web-based GIS or WebGIS approach. WebGIS (or sometimes referred to as the Geo Web) is a GIS that uses web technology to communicate between the web application server and the end user client [16,17]. While incredibly powerful, the adoption of desktop GIS software has often lagged, due to a number of reasons: the expense of site licenses and higher-end computer hardware and the complexity of GIS software requiring high levels of training and expertise. Consequently, GIS tools and data are often beyond the reach of ordinary citizens with an interest in a particular place-based decision problem [18]. The advent of web-based information technology has presaged greater accessibility to spatial information and the potential to place all stakeholders on a more equal footing [18,19]. While WebGIS presently does not provide the full functionality of a typical desktop GIS, it holds the potential for wider access to vital geospatial information, as well as lowering the bar on the technical ability needed to perform simple geospatial analysis. In developing our WebGIS application (NJFloodMapper), we proposed to employ a user-centered design approach, i.e., a system that involved the target users to a great extent to influence the design of the system [20]. We discuss the success of this approach amidst the broader context of the application of WebGIS tools to assess coastal vulnerability and inundation exposure.

2. Methods

2.1. ISD Model Approach

As part of our user-centered design process, we employed an instructional systems design (ISD) model to address the identified needs of our target audience of coastal decision-makers. ISD is commonly used for the development of programs and products and employs a “systems approach” that matches the products and programs to users’ needs to ensure that program/product development is effective and efficient [21] (Figure 1).
The target audience was loosely defined to include a broad suite of coastal decision-makers, i.e., people representing government agencies or non-governmental organizations that were involved in land use planning, emergency management and natural resource management. This included municipal and county appointed officials from municipal emergency management, public health, building code, transportation, engineering and planning departments, state and federal organization agency officials, municipal elected representatives, environmental commission members and nonprofit representatives. The target audience was largely drawn from the JC NERR Coastal Training Program (CTP) database. The CTP database includes approximately 2200 coastal decision-makers from that state of New Jersey.
Figure 1. The instructional systems design process as adopted for our project.
Ijgi 03 00408 g001

2.2. Front-End Evaluation

2.2.1. Needs Assessment

A series of workshops were held prior to and during the early stages of the project as part of the front-end evaluation to analyze the intended users’ needs and desires for improved decision-making (Figure 1). The sponsoring partners viewed these workshops as critical first steps towards assessing decision-makers’ needs around sea level rise and coastal hazards information. After being presented science-based information about the local impacts of climate change and strategies to start planning for adaptation, participants were asked to identify the vulnerabilities of their communities, their information needs and the barriers to adapting to climate change.
A second type of needs assessment was administered after the initiation of the project to collect information on a broad array of intended users. An online survey was undertaken to assess the parameters and applications that our target audience deems as essential for a web-based vulnerability assessment website. The survey was sent to coastal decision-makers in the JC NERR CTP database.
The survey asked, “Please review the following topics related to climate change and rate them by importance of information you need to perform your work” and “Please review the same topics and rate the amount of information you currently have:”
  • Changes in flood elevations
  • Shoreline erosion and beach width
  • Effects of sea level rise on existing shoreline protective structures
  • Climate change effects on community infrastructure: water systems sewer streets/road, bridges and public buildings)
  • Changes in rainfall
  • Climate change effects on coastal weather
  • Changes in the frequency and intensity of storms
  • Construction and landscape design standards
  • Sea level rise predications
  • Location-specific effects of climate change
  • Projected economic costs and benefits of climate change.
A three-point scale was provided for question responses. Choices for the first question included, “not important, somewhat important, very important”. Choices provided for the second question included, “no information, some information, all necessary information”. Responses were coded from a low of 1 for “not important” and “no information” and a high of 3 for “very important” and “all necessary information”. The topics that fell above the overall mean for information importance and below the mean for information possessed are areas that were highlighted for further consideration.

2.2.2. Usability Testing

As a preliminary step in shaping the design phase for the web-based mapping application, a focus group format was used to evaluate several existing coastal inundation web-based applications (Figure 1). Five websites were chosen that illustrated sea level rise inundation, but that differed in their inundation visualization, complementary data visualization and functionality (Table 1). The focus group was recruited from the JC NERR CTP database. Participation in the usability testing was limited to around 20 people, due to the limited amount of Internet bandwidth available at the JC NERR Coastal Education Center. Participants were not “selected”, but rather volunteered their time and feedback to help the development process of the website.
Table 1. Listing of sea level rise viewers included in the initial usability testing.
OrganizationStudy AreaURL
NOAA Coastal Services CenterGalveston, TXhttp://www.csc.noaa.gov/digitalcoast/tools/slrviewer/ [22]
The Nature ConservancyLong Island Soundhttp://maps.coastalresilience.org/nyct/# [23]
NOAA Coastal Services CenterSea Level Rise for Wilmington, Delawarehttp://csc-s-web-p.csc.noaa.gov/de_slr/ [24]
State of CaliforniaCaliforniahttp://www.climatechange.ca.gov/visualization/sealevel.html [25]
Pacific InstituteCalifornia Coasthttp://www.pacinst.org/reports/sea_level_rise/gmap.html [26]
Focus group participants were instructed to review each of the web-based tools from the perspective of a user visiting the site for the first time. Feedback forms with a consistent set of evaluation questions were provided to the evaluators for each of the websites. Evaluators were instructed to fill out the feedback forms to the best of their ability and to provide any additional comments. A total of two and a half hours were provided for the individual review. Users were asked to note any challenges they had, parts of the website they found especially useful, and website capabilities they would want replicated on the site to be developed for NJ coastal areas. Facilitated discussion was employed to allow time for evaluators to collectively review and share thoughts about the “tested” websites. All worksheets and evaluation forms were collected after the feedback sessions and later compiled into collective results.

2.3. Formative Evaluation

A series of smaller focus groups were held at the JC NERR Coastal Education Center to test and provide feedback on alpha and beta versions of the sea level rise WebGIS application (Figure 1). These focus groups were recruited from the initial usability testing focus group (described in Section 2.2.2), as well as the JC NERR CTP database. Participation in the focus groups was limited to around 20 people.
An alpha version of the WebGIS application was developed using data for a small section of the study area in southern New Jersey. A beta version was developed based on focus group feedback and once full statewide data were available. The focus group format consisted of two parts: (1) individuals working on their own or in groups of two on fictitious website “quests” or quester testing scenarios on the five coastal inundation websites; and (2) a facilitated group discussion reviewing the feedback from the website “quest” assignments along with overall impressions and suggestions for further website refinement. In “quester testing”, potential users are introduced to the product, then given a set of decisions they must make (quests) and asked to use the product to help them make the decisions. Each of the quests is a typical decision-making scenario. During the quests, users engage with the product, find the information they need, note each decision on a quest sheet and then provide feedback on successes and/or frustrations. After individual review was completed, a group “report out” was led and facilitated by the principal investigators (PIs). This was done to get a sense of the collective thoughts and garner reactions on website improvement ideas. Note-takers were present in each report session to capture the groups’ thoughts and comments. Project PIs and staff were also present at all evaluation sessions. This was done purposefully, so that all project leads could hear the feedback first hand and ask for clarification on any comments and/or suggestions made by the end users. All worksheets and evaluation forms were collected after the feedback sessions and later complied into collective results.

2.4. Summative Evaluation

A summative evaluation was conducted six months post-launch of the sea level rise WebGIS application to allow adequate time for the target audience to evaluate and use the application for operational planning purposes. The objective of the summative evaluation was to assess if the final products work and are useful for the target audience. Respondents were invited to participate in the online survey via an email sent to individuals on the JC NERR CTP database. The email also encouraged individuals to forward the email to extend the reach of the survey beyond the Coastal Training Program database.

2.5. Mapping and Visualization Tool Design and Development

Due to the iterative nature of the instructional systems design process, it is difficult to completely separate out the WebGIS applications design and development process from the needs assessment and formative evaluation process (Figure 1). Based on the results of the usability testing, a decision was made to adapt the NOAA Coastal Services Center’s (CSC) WebGIS application [22] to meet the New Jersey target audience’s needs and preferences. The NOAA CSC viewer has a variable SLR slider bar and user-selected tabs to display various aspects of coastal vulnerability (e.g., social vulnerability, flood risk). The focus groups appreciated the simple design and the treatment of potential levels of sea level rise and coastal inundation in straight-forward, 1-foot increments rather than as 50- or 100-year high-medium-low probability scenarios. In mid-May 2011, the NOAA Coastal Services Center provided us with the ESRI ARCFLEX coding template for their sea level rise viewer. We adapted the NOAA CSC viewer template to add additional data layers and to program new functionality based on the results of a series of focus group evaluations (which will be discussed later in the Results section).

2.6. GIS Database Development

Our study area included the entirety of New Jersey’s designated coastal zone (Figure 2). High spatial resolution LiDAR imagery acquisition for the state of New Jersey has been a cooperative effort between the U.S. Geological Survey, the Federal Emergency Management Agency (FEMA) and the state government. LiDAR acquisition was completed in stages over a period of years from 2006 to 2010. The NOAA Coastal Services Center (CSC) provided the LiDAR-derived digital elevation model (DEM) corrected to a standard vertical datum of NAVD88 and a standard tidal datum of mean higher high water (MHHW) with a grid cell resolution of 25 feet. All data sets produced for this project are consistent with NOAA methodology and using the National Geodetic Survey’s vertical datum transformation software tool (VDatum). The process involves the use of NOAA VDatum software to calculate tidal variability. The VDatum software generates an ASCII file output with the same format (X, Y, Z). However, in the output, the Z value represents the difference/variability of the selected tidal datum. Most variation occurs in the immediate coastal and shoreline regions; little to no change is observed inland. The final MHHW surfaces were then used to generate sea level rise inundation water surface grids for 1 to 6 foot sea level rise scenarios. Further spatial analysis was undertaken to determine hydrologically connected vs. unconnected areas. Using NOAA methodology, an 80% confidence layer was calculated for each sea level rise scenario. These final data layers were provided by NOAA (CSC) for input to the NJFloodMapper application (Table 2).
Figure 2. NJFloodMapper study area; the designated coastal zone shown is in shades of green. Imagery backdrop courtesy of ESRI web services.
Ijgi 03 00408 g002
Table 2. Summary of the geographic information systems (GIS) data employed in NJFloodMapper.
Data TypeSource
ElevationNOAA Coastal Services Center
Water Surface (1–6 foot of sea level rise)NOAA Coastal Services Center
Coastal Evacuation RoutesNJ Department of Transportation
Critical FacilitiesFEMA HAZUS and NJ Office of Information Technology
Tidal Salt Marsh NJ Department of Environmental Protection Land Use/Land Cover
Social Vulnerability IndexNOAA Coastal Services Center
In support of this effort, we compiled a GIS database of the relevant environmental and socio-demographic data sets for the study area (Table 2). GIS data produced by FEMA and the New Jersey Office of Information Technology (NJOIT), focusing on various institutional facilities and infrastructure, were quality controlled by project staff at CRSSA. The facilities and infrastructure data originate from FEMA’s published HAZUS-MH data set. However, for FEMA themes where NJOIT state-produced data exist, the NJOIT data have been used, due to higher resolution content and spatial accuracy. The data are organized by FEMA HAZUS data themes: essential facilities, high potential loss facilities, transportation systems and utility systems. Over 1250 locations were quality controlled, checked for locational accuracy and moved to their correct geographical position, if needed. Working with the New Jersey Department of Transportation and the Transportation Planning Authority, we acquired GIS data on other critical infrastructure, including: causeways, evacuation routes and all roadways by road type. Under the Social Vulnerability tab, GIS data for the Social Vulnerability Index (SOVI) to Environmental Hazards developed by the University of South Carolina Hazards and Vulnerability Institute was included [4,27]. The SOVI data was derived from 2000 U.S. Census data and mapped to the block group level.
We developed GIS data sets on coastal salt marsh wetlands and adjacent vegetated uplands for the entire study area are based on newly updated and released 2007 land use/land cover data (produced under contract by a third party for the NJ Department of Environmental Protection). We updated and quality checked an “impediment” layer that included bulkheading, shoreline armoring, roads/causeways and other coastal development. Using GIS raster modeling techniques, we modeled unimpeded vs. impeded salt marsh retreat zones across the study area for the 1–6 foot sea level rise increments. In addition, we incorporated outputs from the Sea Level Affecting Marshes Model (SLAMM) [28,29]. We included a category of “potential marsh loss zones”, where the SLAMM model suggested a conversion from marsh to either Open Water or Unconsolidated Shore (i.e., mud flat) by the year 2050 under a medium accretion scenario (i.e., a vertical accretion rate of 4 mm/yr).

3. Results

3.1. Needs Assessment

3.1.1. Climate Change/Sea Level Rise Workshops

A one-day workshop held before the initiation of the project (December 2008) was used as an opportunity to garner preliminary front-end input from the intended users and relevant stakeholders (Figure 1). Sixty-three coastal decision-makers attended the workshop at the JC NERR Coastal Center, and an equal number joined via videoconference from locations in Maryland and Virginia. Subsequent to the initiation of the project, the JC NERR and other coastal non-governmental organizations co-sponsored a one-day workshop entitled “Preparing Your Community in the Face of a Changing Climate” (on 1 April 2010), with more than 120 participants from a variety of New Jersey coastal communities [30]. The sponsoring partners viewed these workshops as critical first steps towards assessing decision-makers’ needs around sea level rise and coastal hazards information.
After being presented science-based information about local impacts of climate change and strategies to start planning for adaptation, participants were asked to identify the vulnerabilities of their communities, their information needs and the barriers to adapting to climate change. It was clear that local municipalities need professional assistance in identifying their specific vulnerabilities. They expressed a need for mapping expertise, especially in light of scarce financial resources and limited staff, which hampered their capability to undertake customized geospatial analyses and modeling studies. A majority of the target audience was not experienced GIS users and did not have ready access to standard desk-top GIS work stations.

3.1.2. Online Survey

An online survey was administered in November 2010, after the initiation of the project to collect needs assessment information from a broader array of intended users beyond the initial focus group (Figure 1). An email, with a link to the online survey, was sent in early November 2010, to approximately 890 individuals in the JC NERR Coastal Training Program (CTP) database. The survey remained active for approximately three weeks. There were 61 respondents. Emailed individuals were encouraged to forward the email to other interested colleagues. Since there is no way to track how many emails were forwarded, there is no way to accurately calculate the response rate.
The results of this assessment confirmed the audience’s willingness and desire to employ online mapping tools and provided further input to guide the overall structure, functionality and display of the NJFloodMapper. The survey topics that had the highest level of importance to respondents, as well as where they had the least amount of information (Table 3) were:
  • The effects of sea level rise on existing shoreline protective structures;
  • The effects on community infrastructure; and,
  • Location effects of climate change.
In addition, respondents clearly wanted sea level rise to be mapped in feet instead of meters, and greater than 99% of respondents felt that illustrating storm surge was also important or very important. Respondents thought the important data layers to be included were flood zones, high hazard zones, roads and bridges, contaminated sites, wastewater treatment facilities, elevations, shoreline exposure to wave energy, population density by square mile, evacuation routes, housing units per square mile, parcel data, power plants, evacuation centers and marsh migration retreat zones, including impediments (hardened shorelines, road, etc.).
Table 3. Survey topics where the weighted responses were above the mean for “importance” and below the mean for “information currently possessed”.
TopicsRating was Above Average for ImportanceRating was Below Average for Information Currently Possessed
Changes in flood elevationsX
Shoreline erosion and beach widthX
Effects of sea level rise on existing shoreline protective structuresXX
Climate change effects on community infrastructure: water systems sewer streets/road, bridges and public buildingsXX
Changes in rainfall
Climate change effects on coastal weatherX
Changes in the frequency and intensity of stormsX
Construction and landscape design standardsX
Sea level rise predictionsX
Location-specific effects of climate changeXX
Projected economic costs and benefits of climate changeX
Climate change impacts on energy resources X
Changes in climate which may introduce new diseases and pests to the area X

3.1.3. Sea Level Rise Vulnerability Website Usability Testing

As a preliminary step in shaping the design phase for the web-based mapping application, a focus group was held at the JC NERR Coastal Center on 29 September 2010 to evaluate several existing coastal inundation web-based applications. This evaluation included 12 “end users” working through fictitious scenarios on five coastal inundation websites (Table 1). By comparing across sites, users gave feedback on what parts or functions of each site they liked best or least, what was the right amount of information, what was too much information, what was “user friendly” and what was not intuitive.
The recommendations from the usability included defining terminology and avoiding jargon. End users thought that the information provided on the websites was extremely useful, but the lack of a clear meaning for the terminology hindered the connection between why this information was presented and why it is important. End users liked the usability of the websites, which displayed information using a “Google Maps-type” platform. They indicated that they were comfortable with this type of website and also liked having the ability to switch between the “map, satellite and hybrid” map types. Websites that required “plug-ins” or had a long download time to show the data were not as well reviewed for usability.
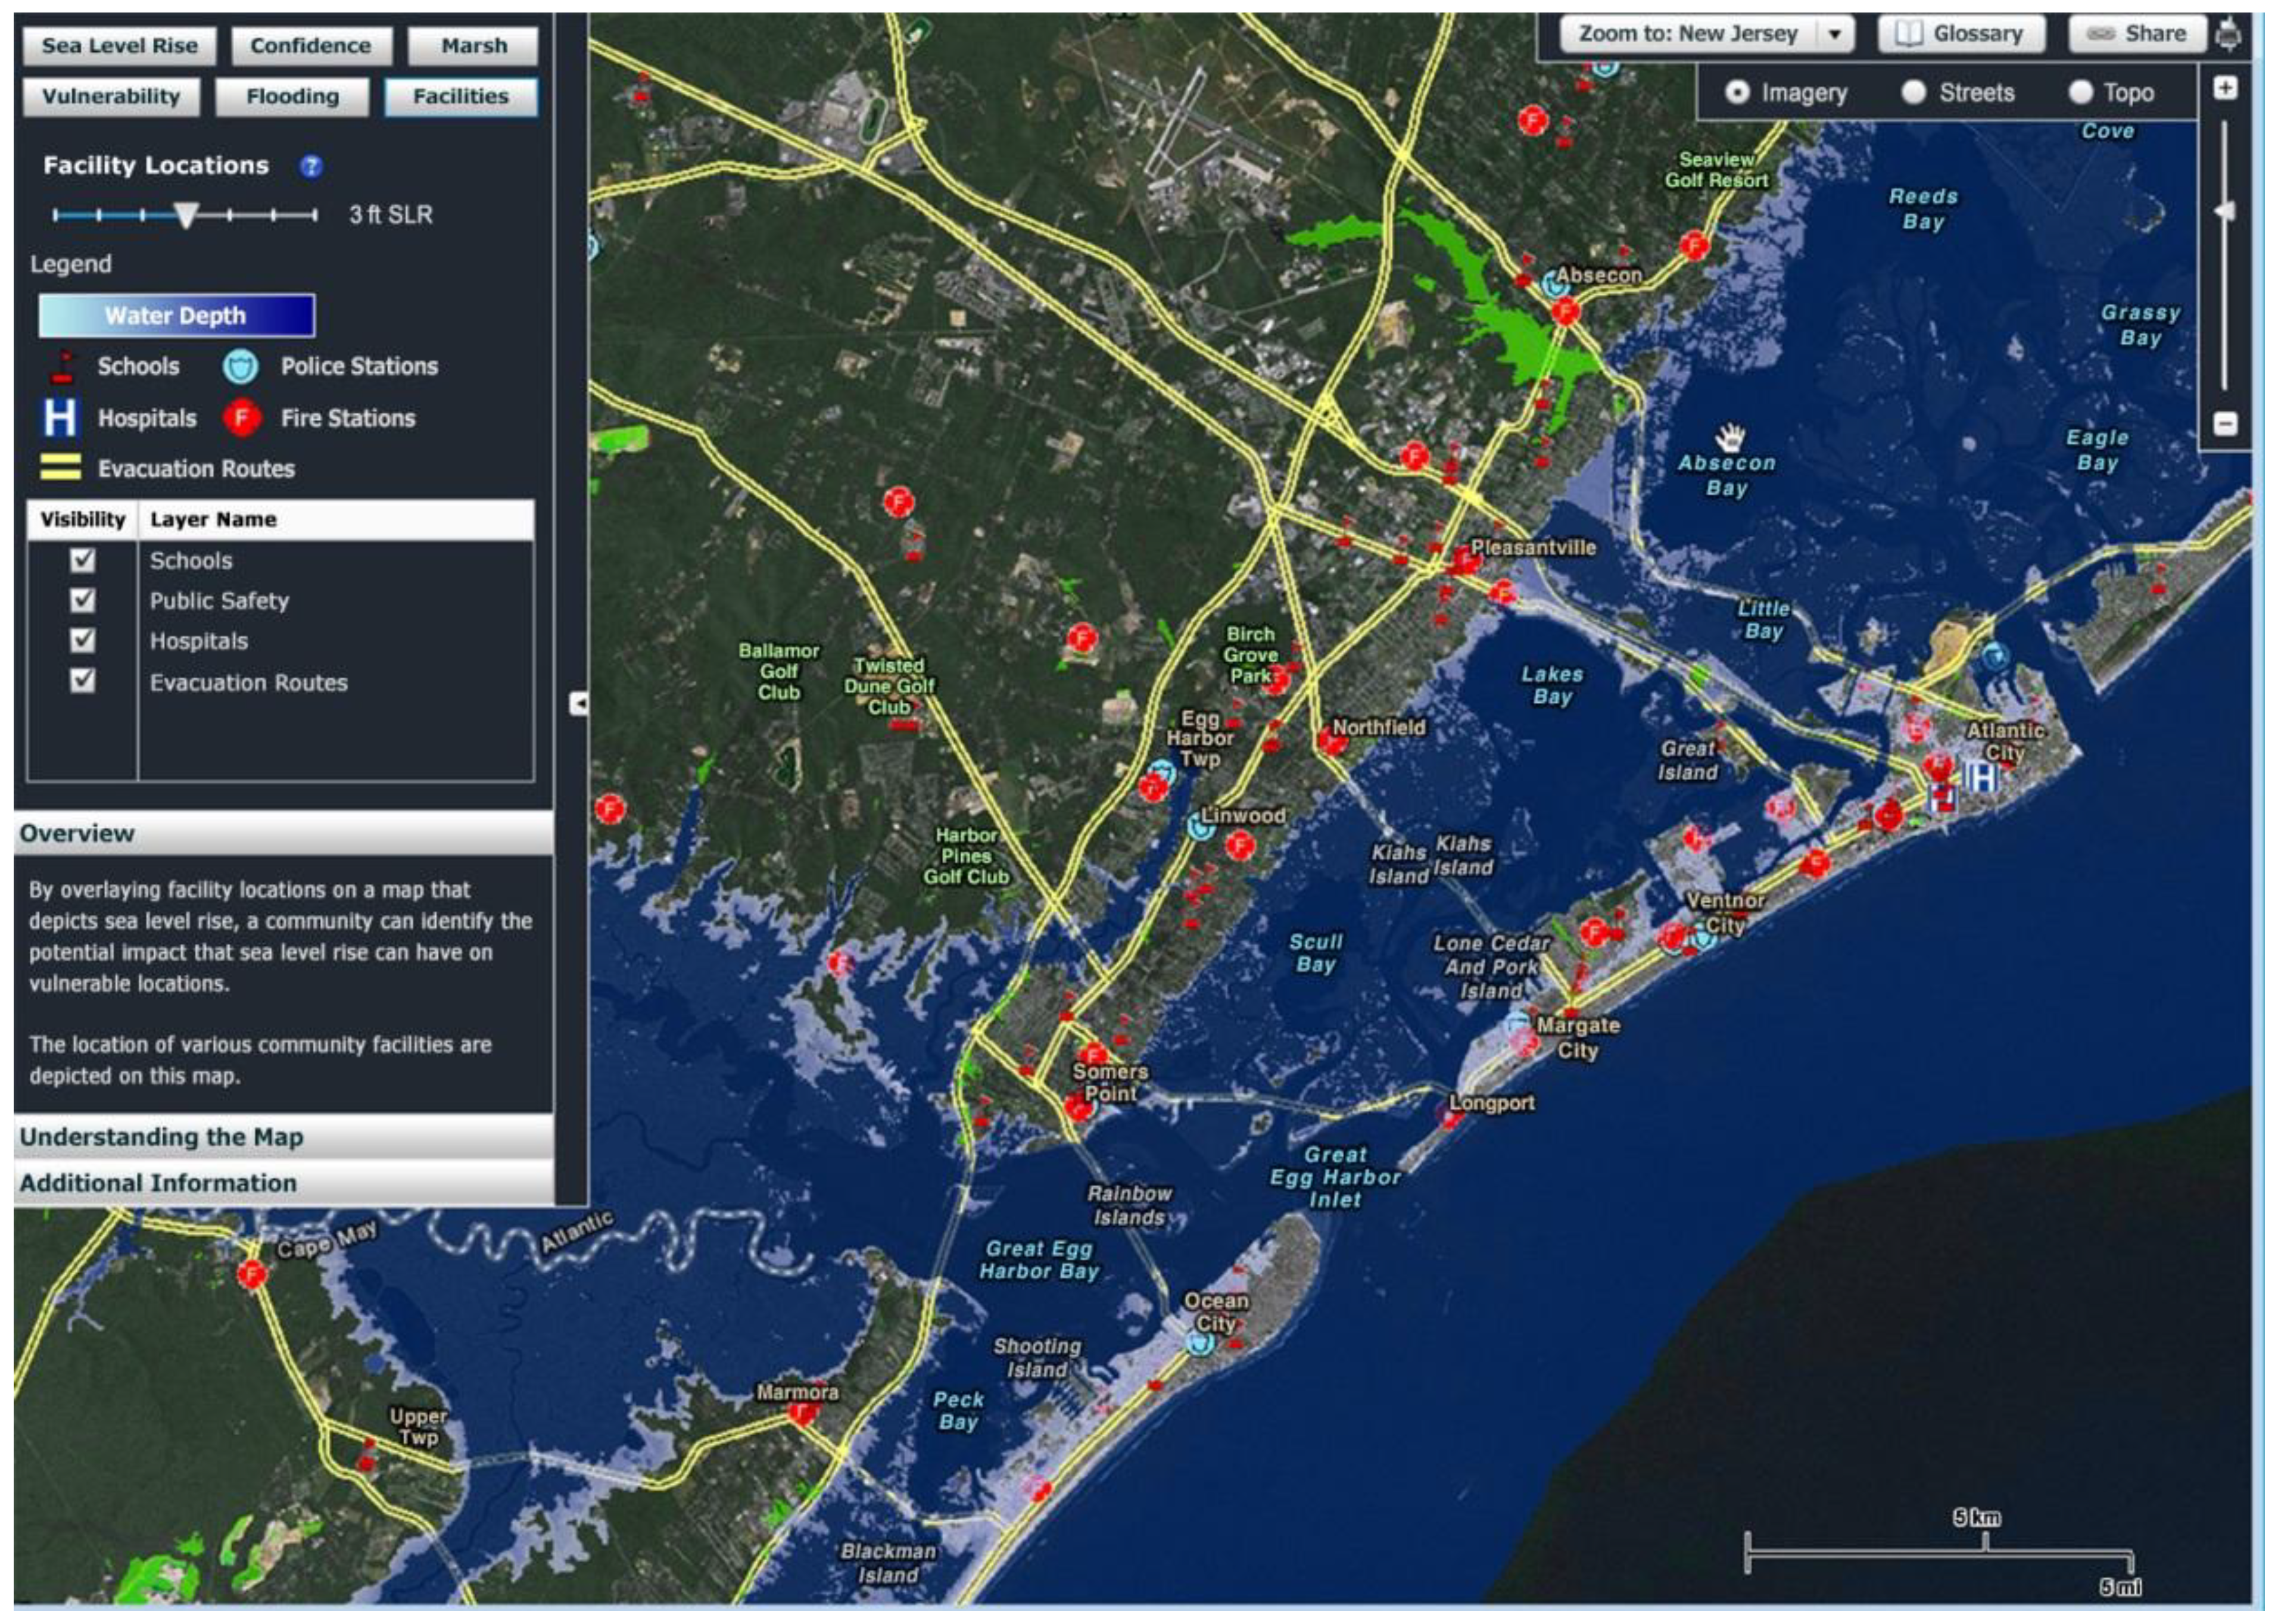
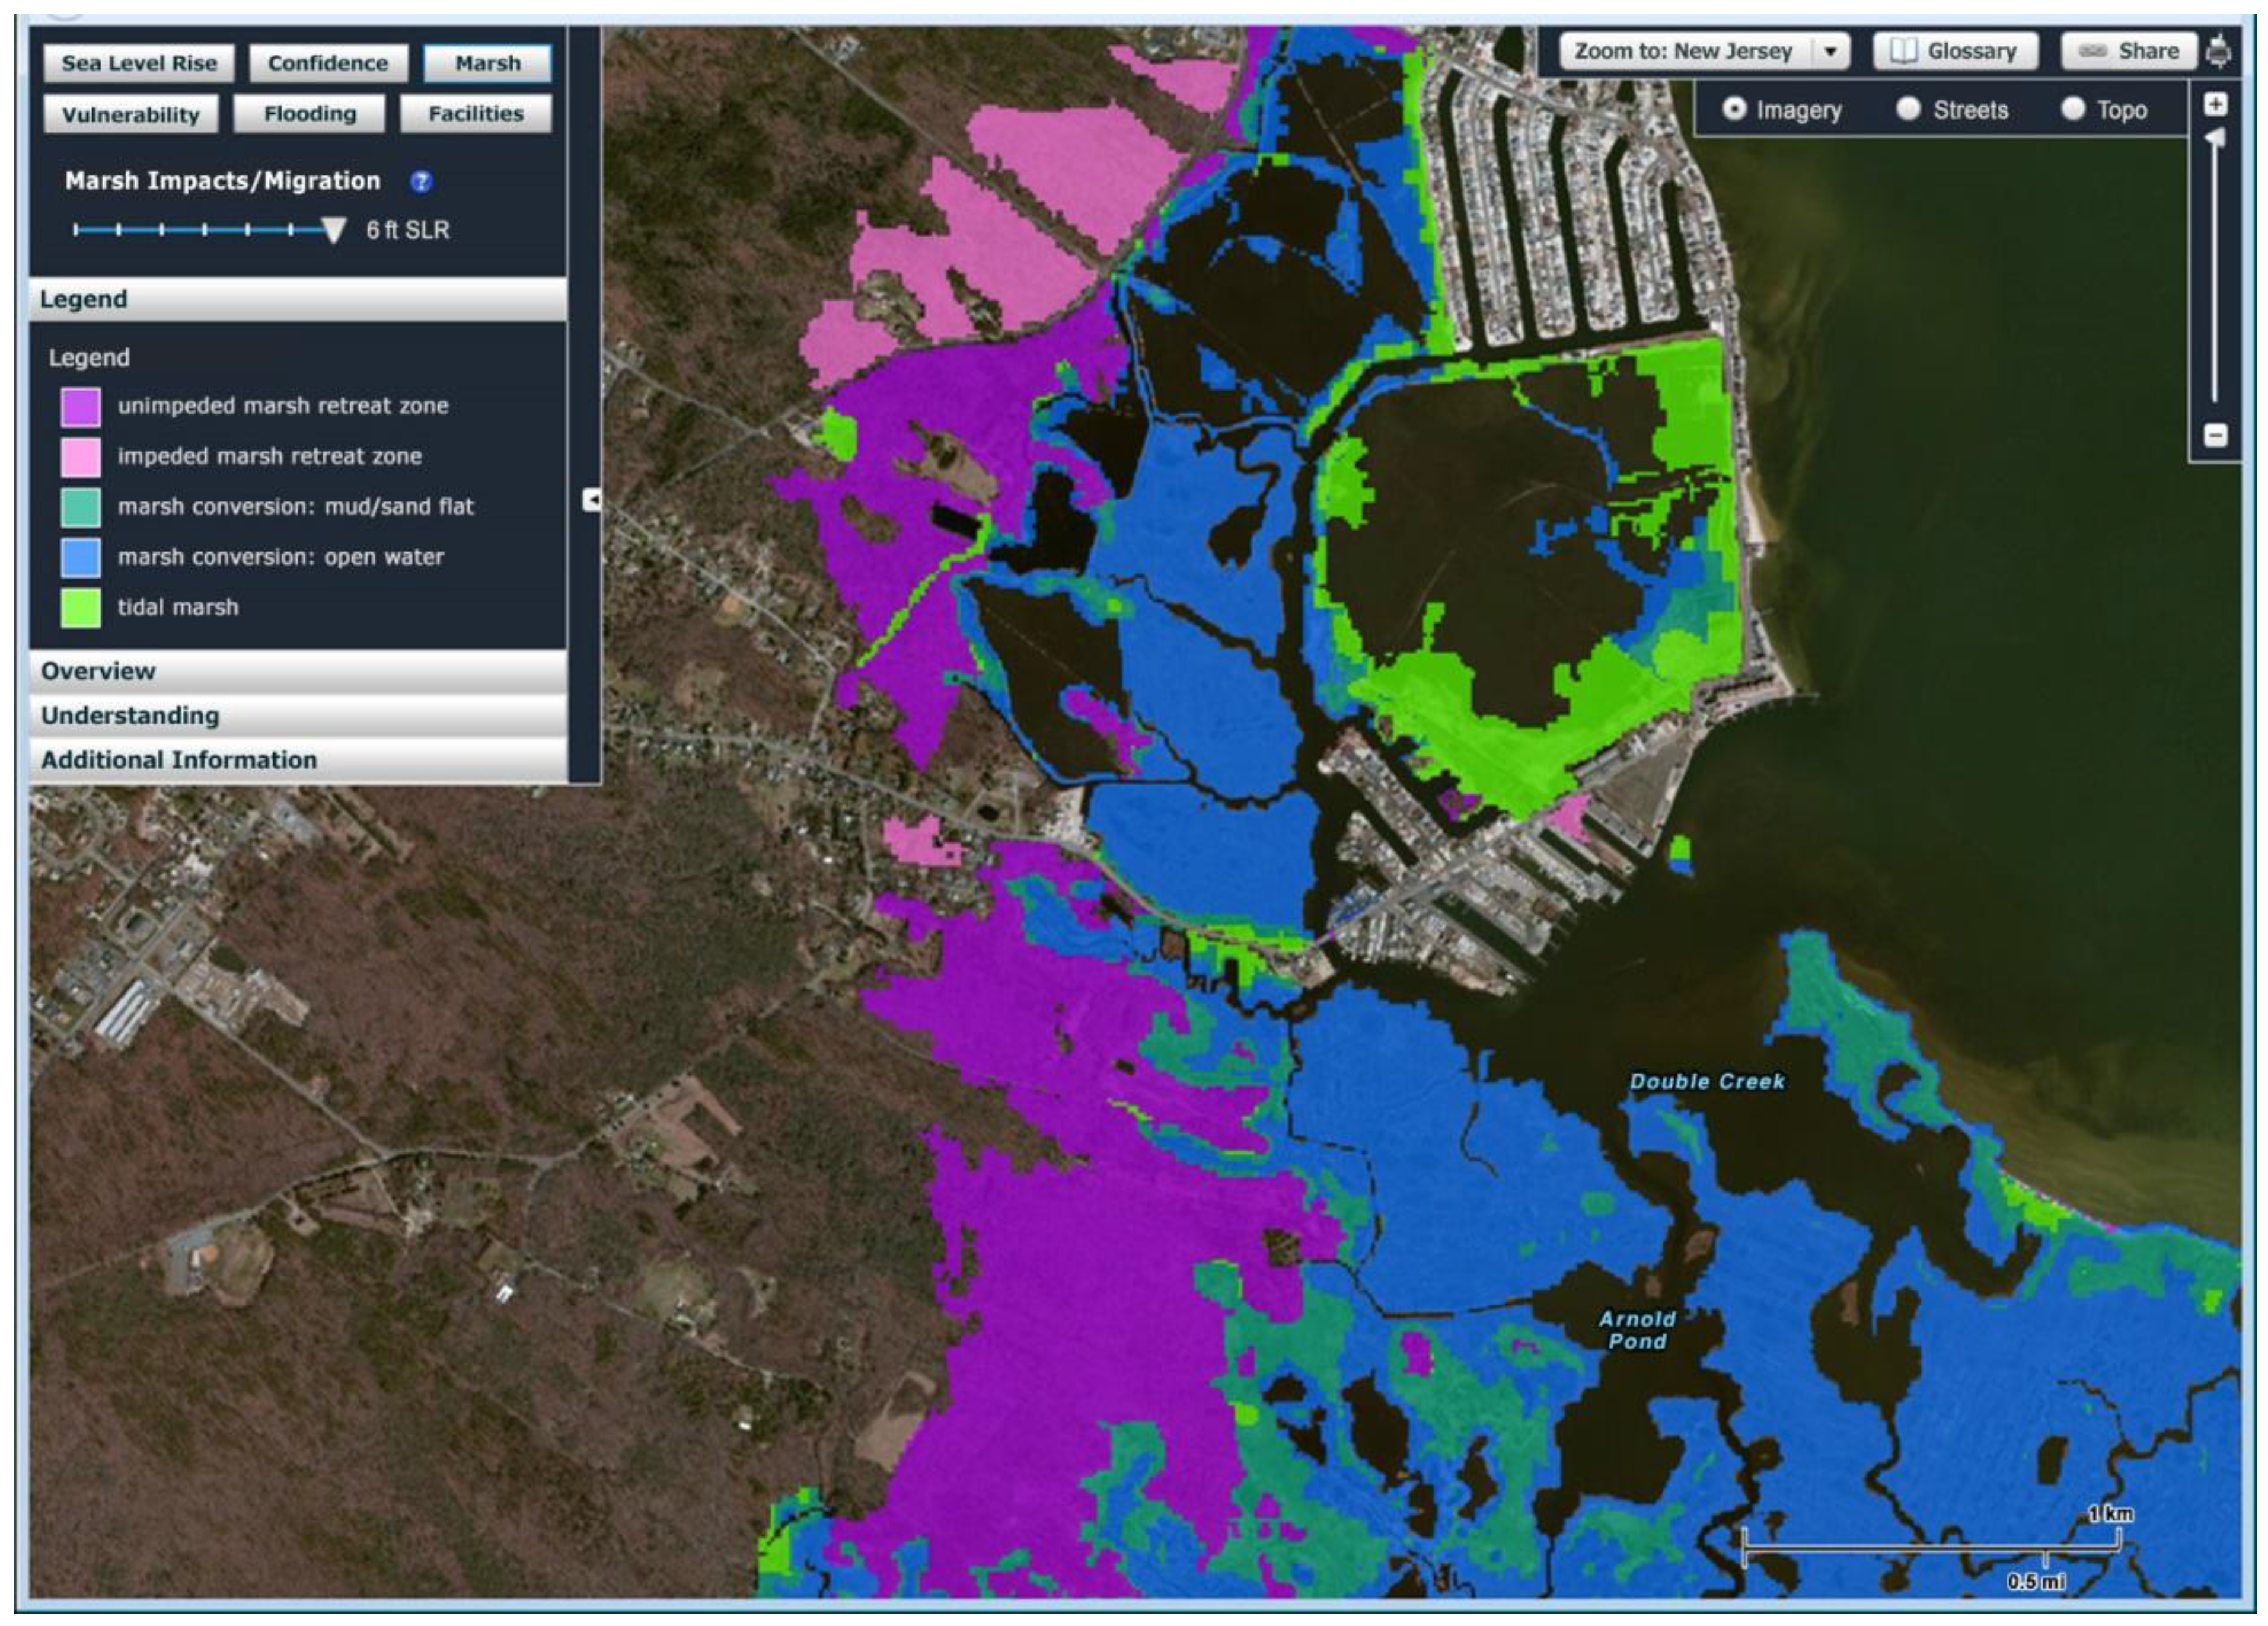
End users liked the ability to use a slider bar to manipulate the sea level rise and storm surge scenarios. They liked the idea of viewing many different types of data layers, with the ability to turn on and off layers to view all, some or none at their discretion. Layers that were found to be most useful were demographics/social vulnerability, evacuation routes, vulnerable infrastructure, population density (including seasonal population density), marsh information and emergency response layers (i.e., shelters, schools, police and fire stations, hospitals, etc.). Finally, end users wanted the ability to download and save the maps/analyses that they viewed.

3.2. Formative Evaluation

3.2.1. Alpha-Testing

Using data for Cape May County, an alpha version of the sea level rise viewer was tested with a focus group of twenty-one potential users on 14 December 2011. The focus group confirmed their appreciation for the simple design and the treatment of potential levels of sea level rise and coastal inundation in straight-forward one-foot increments. The group also confirmed their support for modifications that were made to the “standard” NOAA CSC sea level rise viewer. These modifications consisted of the inclusion of critical facilities (i.e., schools, police and fire stations, hospitals), evacuation routes and designated FEMA flood zones.

3.2.2. Beta-Testing of the Revised SLRViewer Website

A focus group evaluation of the beta version of the SLR WebGIS was completed on 20 August 2012, by a total of 26 individuals. These individuals volunteered to participate in the testing after receiving an email invitation sent to over 2040 individuals on the JC NERR Coastal Training Program (CTP) email list serve. The beta testing followed our standard focus group quester testing and facilitated discussion format. In addition to having wider geographic coverage of the state’s coastal zone, the beta version included improvements made as a result of feedback received from the alpha testing, as well as the “marsh retreat zone” data (i.e., the “Marsh” tab). Opinions were collected to gather feedback on the WebGIS design, functionality and the display and were used to guide this final “tweaking” of the website development.

3.3. WebGIS Tool Design and Development

Significant modifications were made to the initial NOAA CSC’s WebGIS application [22] based on our initial needs assessment, alpha and beta testing (Figure 1). The alpha and beta versions of the WebGIS application were dubbed the NJSLRViewer with the final release renamed NJFloodMapper [31].
The initial needs assessment identified the inclusion of geospatial information on critical facilities and evacuation routes as a priority need. This required modification over the NOAA CSC template was the inclusion of point- and line-based infrastructure (Figure 3). We modified the “Facilities” tab in the NOAA SLR viewer flex code. There are two problems that we dealt with. The first is managing and organizing the large amount of point location information. The second is how best to handle the display of the point information in the viewer. While the target audience expressed the desire to have inquire access to the attribute information at each point, unfortunately, the ArcFlex configuration of the viewer did not allow for this capability.
Figure 3. Example of the inclusion of critical facilities and evacuation routes in the NJFloodMapper viewer for the Atlantic City, New Jersey area under three feet of projected sea level rise.
Ijgi 03 00408 g003
Tidal salt marshes are a characteristic landscape feature of New Jersey’s coastal bays, fringing both the back side of the barrier islands, as well as the mainland. However, this key component of coastal “green” infrastructure is vulnerable to sea level rise. During the alpha and beta testing, a design decision was made to modify the “Marsh” tab. This involved improvements to the definition and quality of the visualizations of the potential for future marsh change and loss and constituted an alteration of the functionality originally supported by the NOAA CSC viewer. We undertook GIS-based modeling (Section 2.6) to map potential changes in salt marsh under different sea level rise increments. Maps of those areas susceptible to conversion to open water or tidal mud flat and those areas that are free to retreat inland as part of the natural landward migration process (i.e., “tidal marsh retreat zones”, where coastal wetlands are blocked by developed uplands or other coastal protection structures or roads) were included in the viewer application (Figure 4).
To provide an alternative to the visualization of different levels of sea level rise (or storm surge) from the more traditional overhead planimetric map view, we also provided oblique ground-views from a series of selected locations. At these photo visualization locations, users can see a recent picture of a coastal location and then see how the shoreline changes as the sea level rise slider bar is increased. These visualizations were done using software called CanVIZ, a user-friendly product made available by NOAA’s Coastal Services Center.
Originally, we had proposed to include a parcel-based query system to allow users to query the identity of land ownership parcels in coastal inundation zones. However, our focus groups, which included state and municipal officials, provided feedback that they were concerned with the NJFloodMapper having a parcel-specific query capability. They brought up issues of the possible negative the effect on individual property values. In addition, we had concerns about the spatial accuracy of the LiDAR-based elevations and the consequent sea level rise water surface layers. We decided to not include an ownership parcel layer in the present iteration of the tool.
Figure 4. Example of unimpeded vs. impeded horizontal tidal marsh retreat zones in the NJFloodMapper viewer under six feet of projected sea level rise.
Ijgi 03 00408 g004

3.4. Launch Product and Summative Evaluation

Subsequent to the website going live in February 2013, the user community was informed through press releases and targeted mailings (Figure 1). A postcard was created to advertise the website going “live” and mailed to 2500 JC NERR CTP mailing list members. The postcard provides an overview of the intended audience for the website, the types of data that can be accessed using the website, management applications for the website content and the website address. An additional 2000 CTP members received an emailed version of the postcard.
A summative evaluation was conducted in July and August 2013. Respondents were invited to participate in the online survey via an email sent to 2276 individuals on the JC NERR CTP database. The email invitation was opened by 592 individuals, resulting in a 26% “open rate”. The email also encouraged individuals to forward the email to extend the reach of the survey beyond the Coastal Training Program database. A total of 68 individuals participated in the survey, representing coastal community positions, such as municipal, county, state and federal employees, planners and board members, consultants, emergency and floodplain managers and local residents. Over seventy percent of the respondents had visited the website prior to taking the survey. Ninety-two percent of the respondents indicated that they would return to the website in the future, because it is “useful”, “a good data source” and is a “general planning tool”. Respondents indicated they would be enticed to return with “updated data”, “new modeling”, “new LiDAR data”, “revised FEMA mapping” and “more definition and depth of information”. Ninety-two percent of the respondents indicated that they would recommend this website to a colleague/friend, and over 84% of the respondents “agreed” or “strongly agreed” that the site “has a clear purpose”.
When asked to give the website a “grade”, 57% of respondents gave it a “B”, and 32% gave it an “A”. Reasons for the grades included ease of use and concise and relevant information. Areas for improvement to the “grade” included a beginner’s learning curve, lack of detail/resolution and a need for clarification of what is actually depicted (i.e., high tide inundation, not mean sea level). Respondents were asked to rate their level of agreement with a variety of statements regarding the website. Over 80% of the respondents “agreed” or “strongly agreed” that it easy to find their “way around the site”, and over 84% of respondents “agreed” or “strongly agreed” that they “can get information quickly”. Over 65% of respondents “agreed” or “strongly agreed” that the “site effectively communicates risk information”; over 73% of respondents “agreed” or “strongly agreed” that the site is relevant to their needs, and over 85% “agreed” or “strongly agreed” that the site’s content interested them.
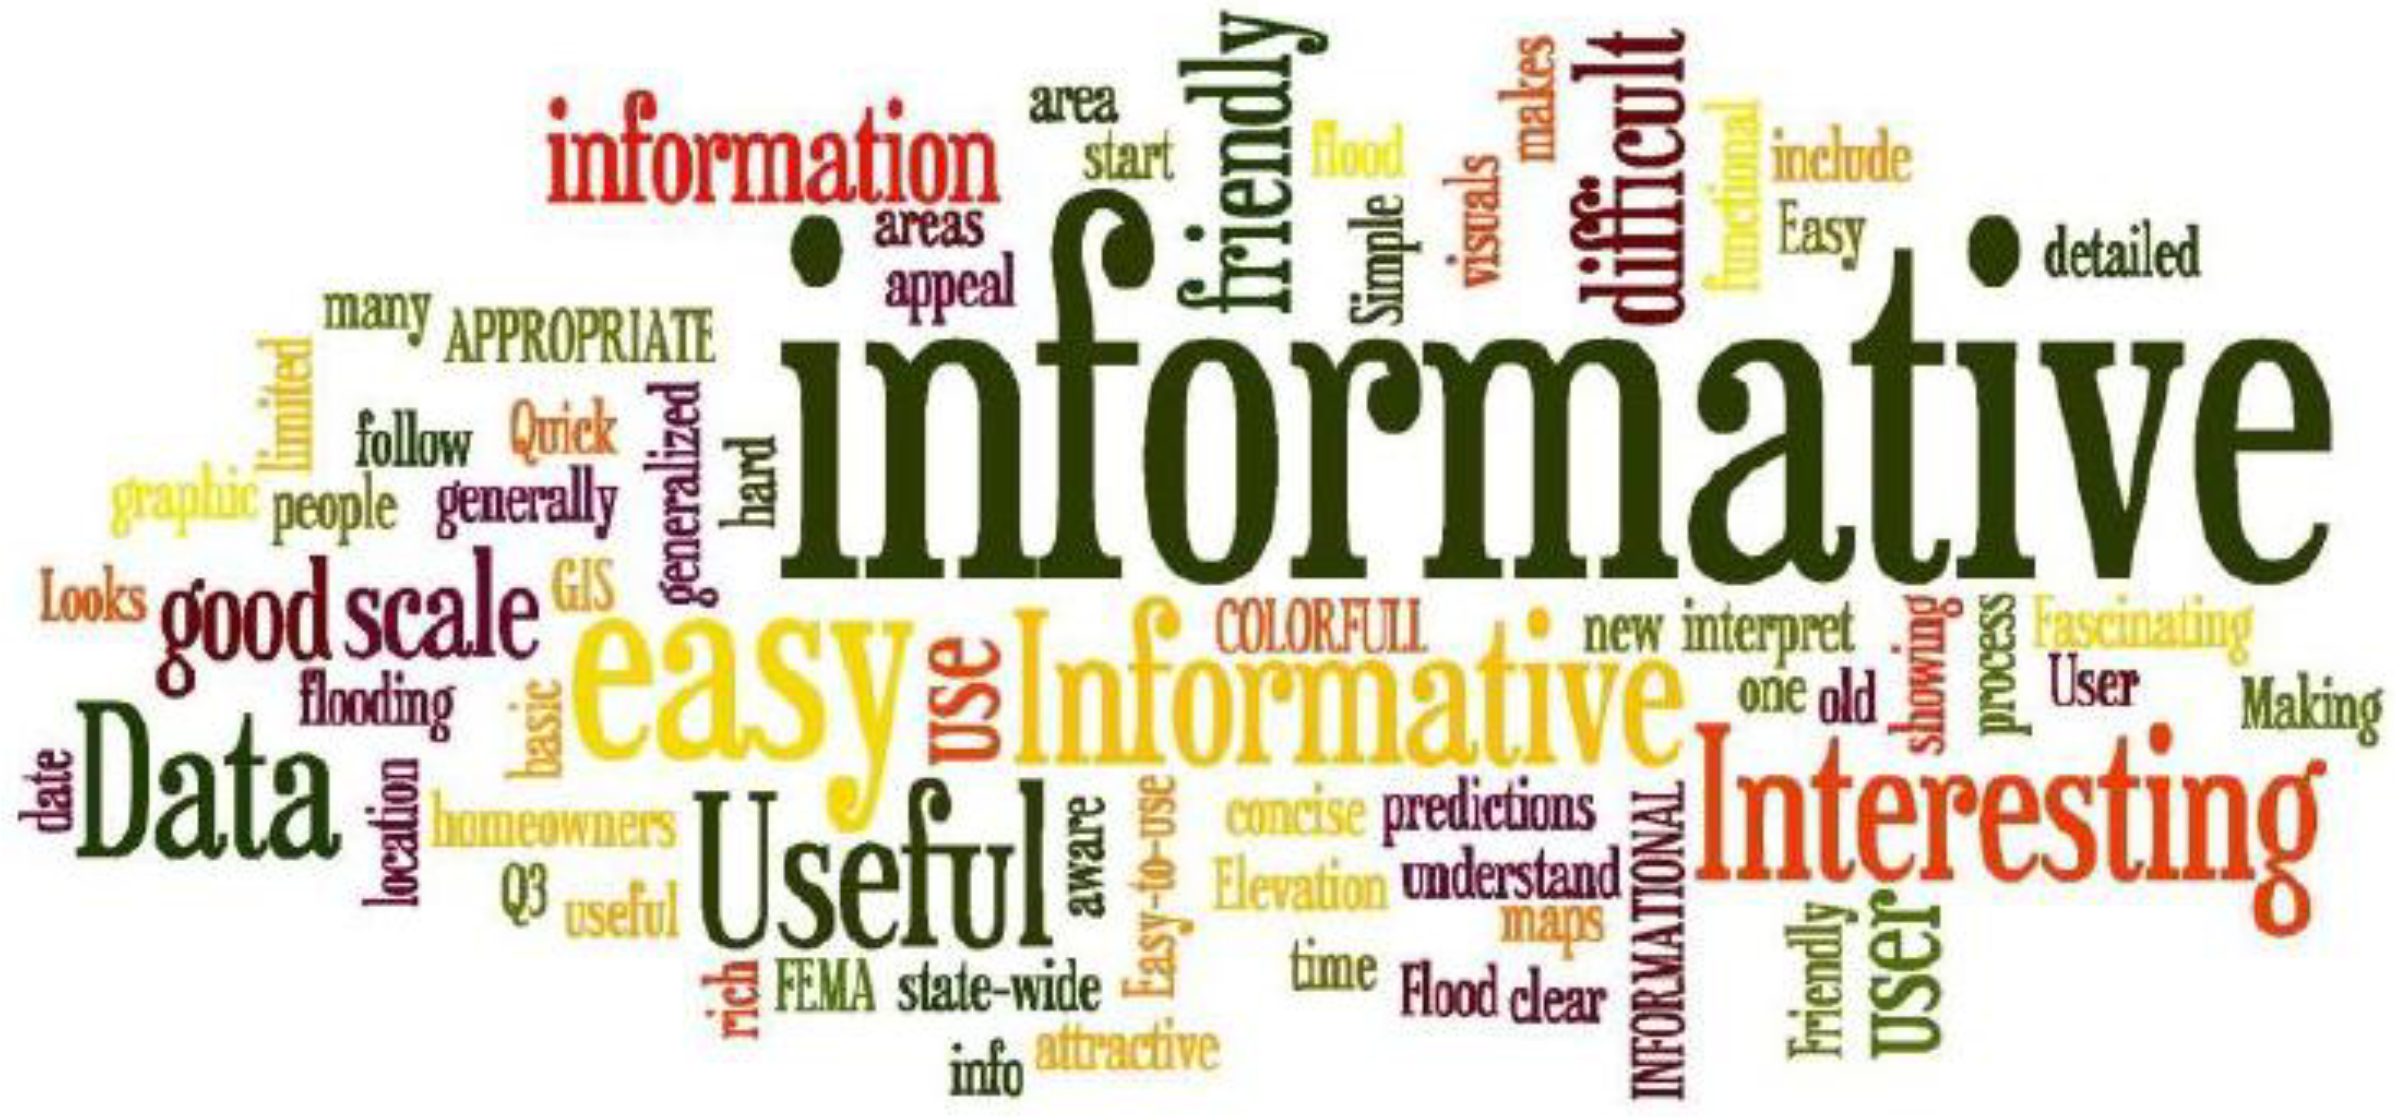
Respondents were asked to provide three words to describe the website. Figure 5 represents a word cloud generated from words respondents provided five or more times. The most commonly used words included “informative”, “interesting”, and “useful”. When asked for three things that respondents liked best about the website, commonly used phrases again included “easy to use”, “user friendly”, “current information/content” and “one stop shop”. Respondents were asked to provide an “overview” of the ways the website has been used, including any decisions made based on the information provided in the website. Respondents’ answers included the utility of the site for planning and communications purposes. Specific planning examples included comparing Superstorm Sandy surge and various levels of sea level rise, looking at future flood zones, looking at potential marsh restoration projects, reviewing elevations and the necessity for raising and/or rebuilding homes to higher standards, community level emergency planning, flood mitigation and disaster and preparedness planning. The utility for communication purposes included the provision of future flood information for concerned residents, a better understanding of properties affected by high water, information for residents considering raising or selling homes and comparing present and future views.
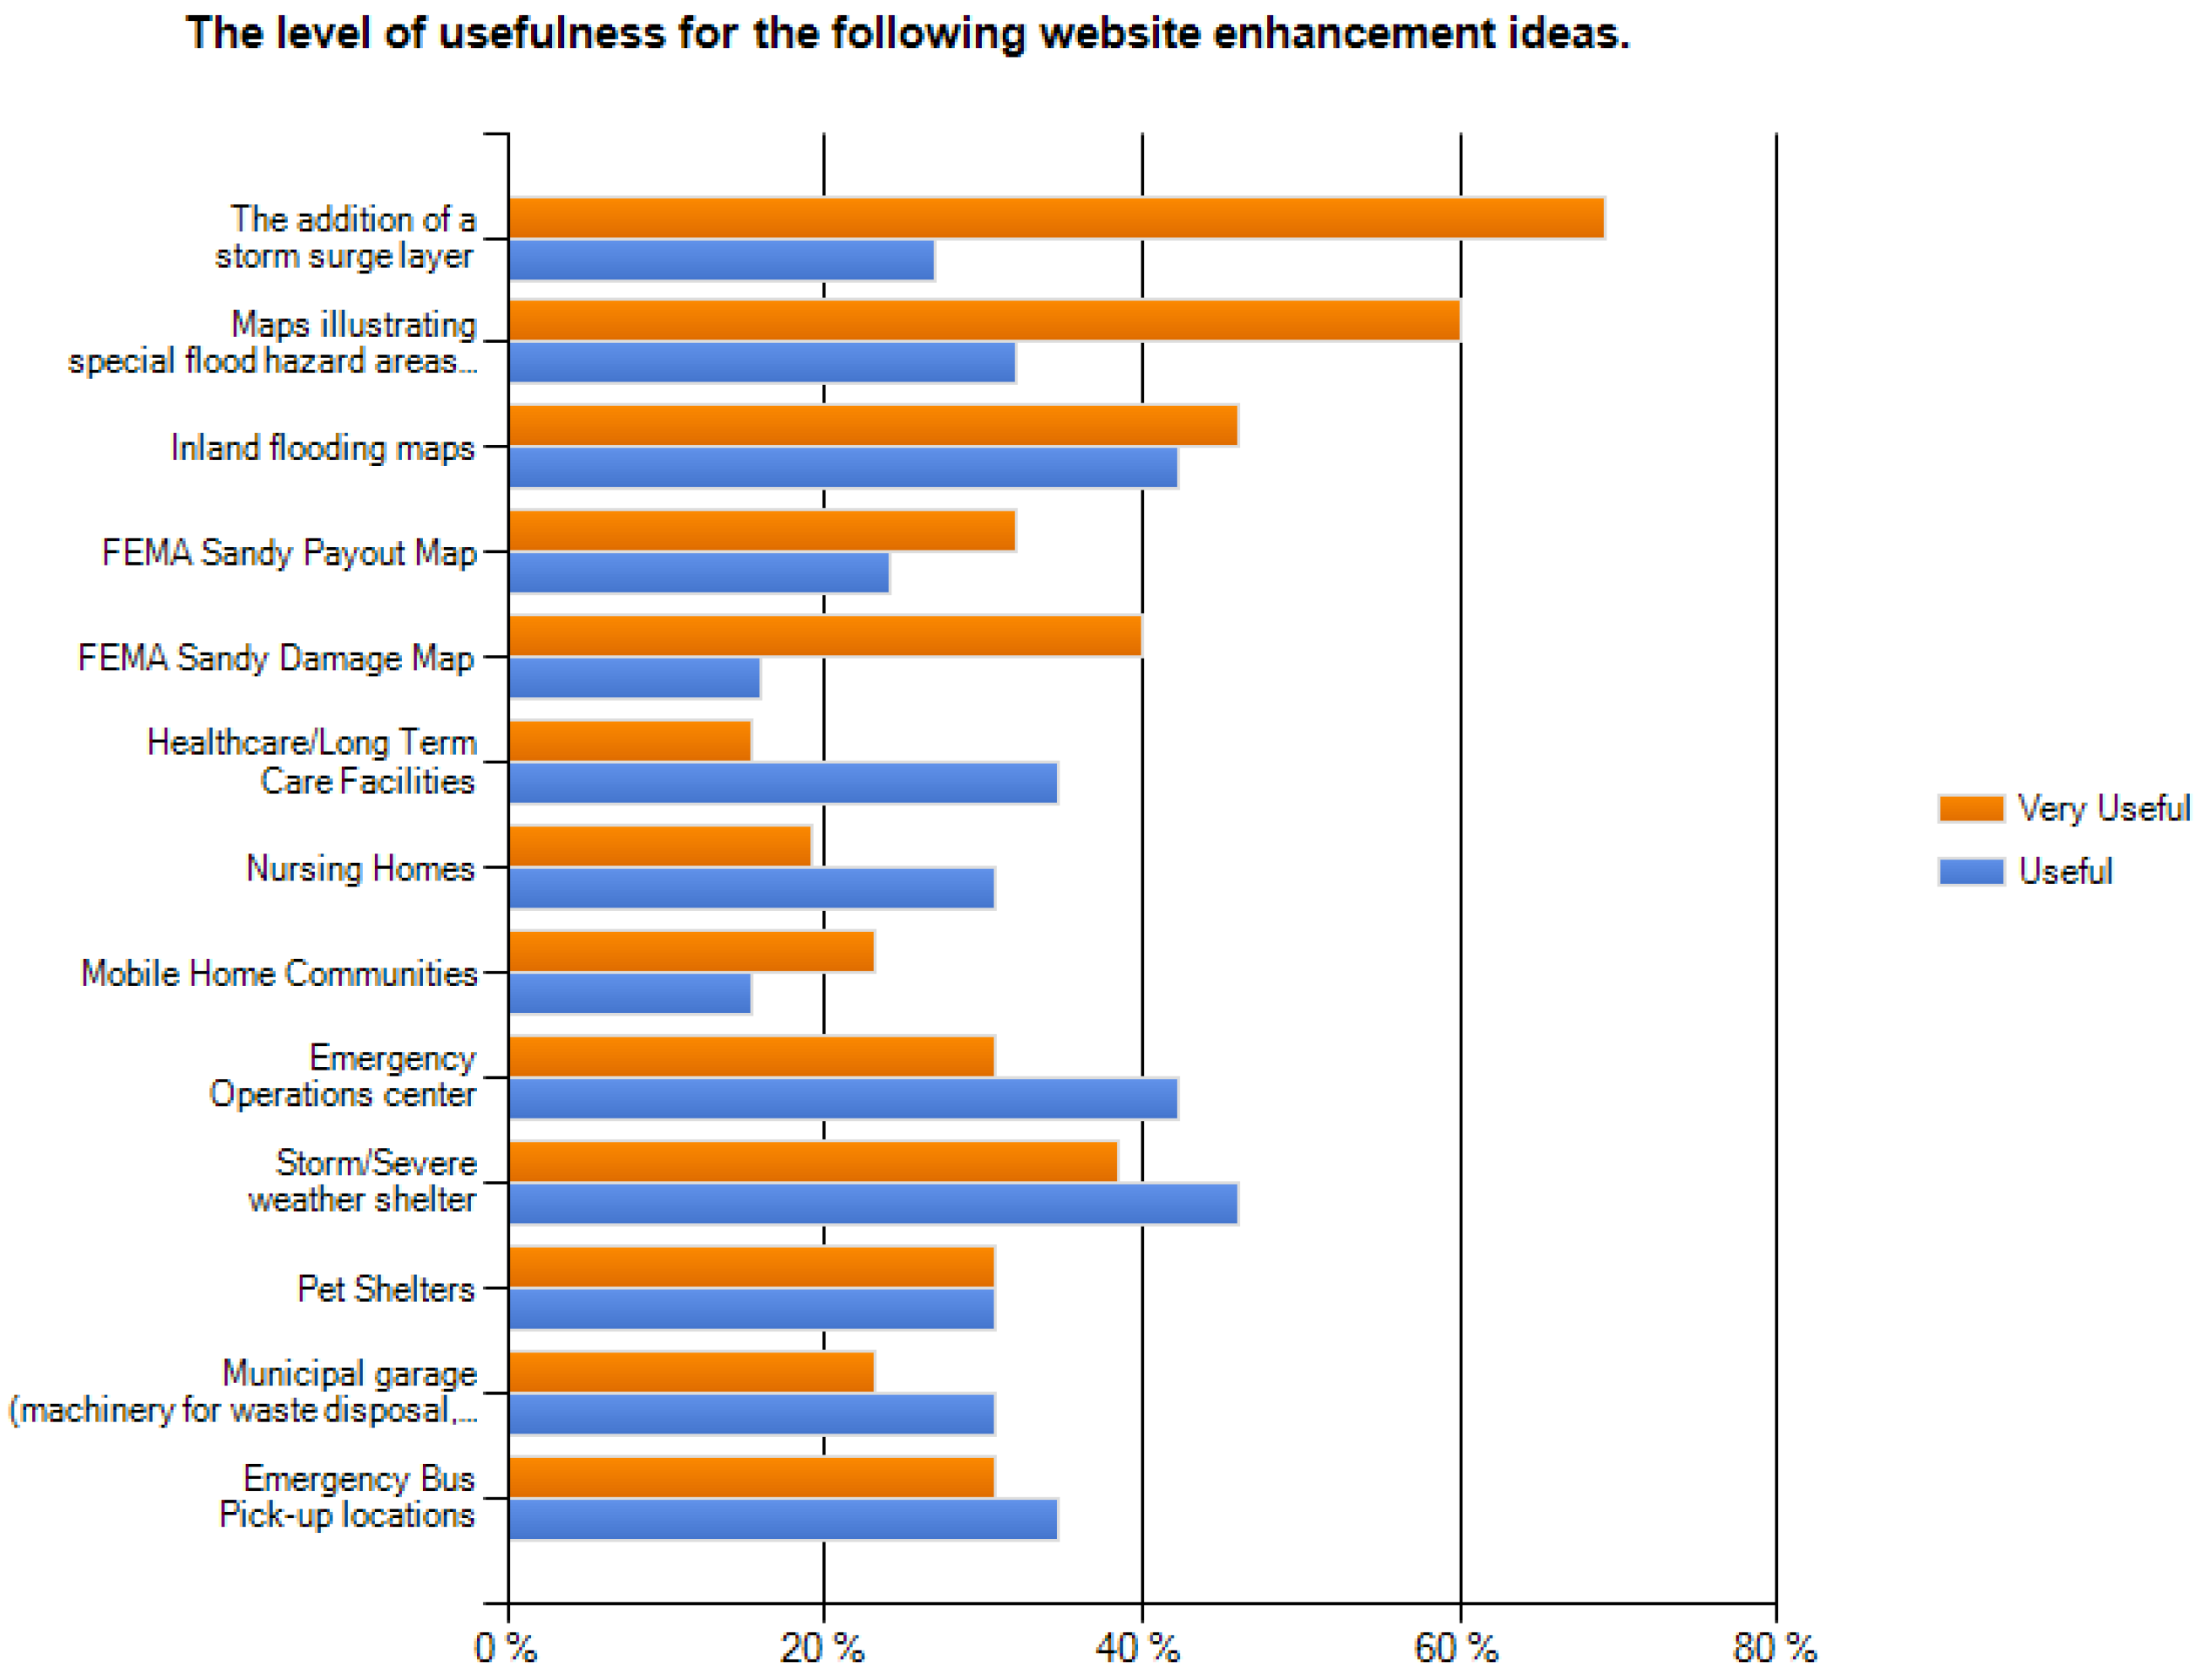
When asked for three things people liked least about the website, responses included the limitation on the zoom, a lack of clarity for legends and a need for better descriptions as to what each tab is depicting. When asked specifically about website enhancements for the future, respondents thought that the addition of a storm surge layer, maps illustrating special flood hazard areas plus sea level rise and inland flooding maps were the most useful enhancements of the choices given (Figure 6). These suggestions have informed our prioritization of continuing improvements to the NJFloodMapper WebGIS tool.
Figure 5. The word cloud created from the most commonly used answers to a summative evaluation question asking for “characteristics that describe” NJFloodMapper.
Ijgi 03 00408 g005
Figure 6. A bar chart indicating the level of usefulness for a variety of proposed NJFloodMapper website enhancements. Choices given to respondents included “very non-useful”, “non-useful”, “I don’t feel strongly either way”, “useful” and “very useful”.
Ijgi 03 00408 g006

4. Discussion

Adapting to sea level rise is a local decision-making challenge requiring site-specific remedies. A necessary first step is a better understanding of the scope of future sea level rise and the exposure of key infrastructure and vulnerable populations to inundation, whether due to sea level rise alone or to the combined effects of storm surge-related flooding. A number of groups have responded to this challenge by developing WebGIS applications to visualize what geographic locations and key assets are vulnerable to areas’ differing levels of inundation. This visualization has taken two general forms, either set increments of inundation (e.g., at one-foot intervals as implemented in the NJFloodMapper) or specific sea level rise scenarios for a specified time horizon (e.g., high, medium and low scenarios for 2050). In addition to the WebGIS applications highlighted in Table 1, several other notable sea level rise WebGIS applications include Climate Central’s Surging Seas [32] and the Natural Capital Project’s Coastal Vulnerability Model [33]. Subsequent to the devastation of the U.S. Mid-Atlantic coast caused by Superstorm Sandy, a number of federal government agencies have released updated geospatial information on coastal flooding exposure, erosion and sea level rise on various targeted WebGIS applications. Some example include FEMAS’s Best Available Flood Hazard Data GeoPortal [34], NOAA’s Sea Level Rise Planning Tool [35] and the U.S. Geological Survey’s Assessment of Hurricane-Induced Coastal Erosion Hazards [36]. In some respects, Mid-Atlantic coastal communities are being deluged with a flood of geospatial information.
As stated in the Introduction, the NJFloodMapper project started well before Superstorm Sandy and before there were any high resolution sea level rise WebGIS tools (i.e., LiDAR-based) available for the state of New Jersey. NJFloodMapper was framed to fulfill the four requirements posed by the NOAA Center for Sponsored Coastal Ocean Research [14] for sea level rise and climate change decision support tools. Our target audience was loosely defined to include a broad suite of coastal decision-makers, i.e., people representing government agencies or non-governmental organizations that were involved in land use planning, emergency management and natural resource management. Even though NJFloodMapper was not designed to specifically increase public participation in coastal decision-making per se, but rather, to facilitate our identified decision-makers in accessing and understanding relevant geographic information concerning sea level rise and exposure to coastal inundation, we submit that our work still falls within the broader scope of PPGIS. Haklay and Tobón [20] propose that PPGIS settings usually call for an open-ended exploration in which non-expert users experiment with GIS and examine various issues that relate to their community. Our WebGIS application, NJFloodMapper, was designed to facilitate just such an open-ended exploration of a locality’s vulnerability to sea level rise and coastal inundation by a target audience largely composed of non-expert GIS users.
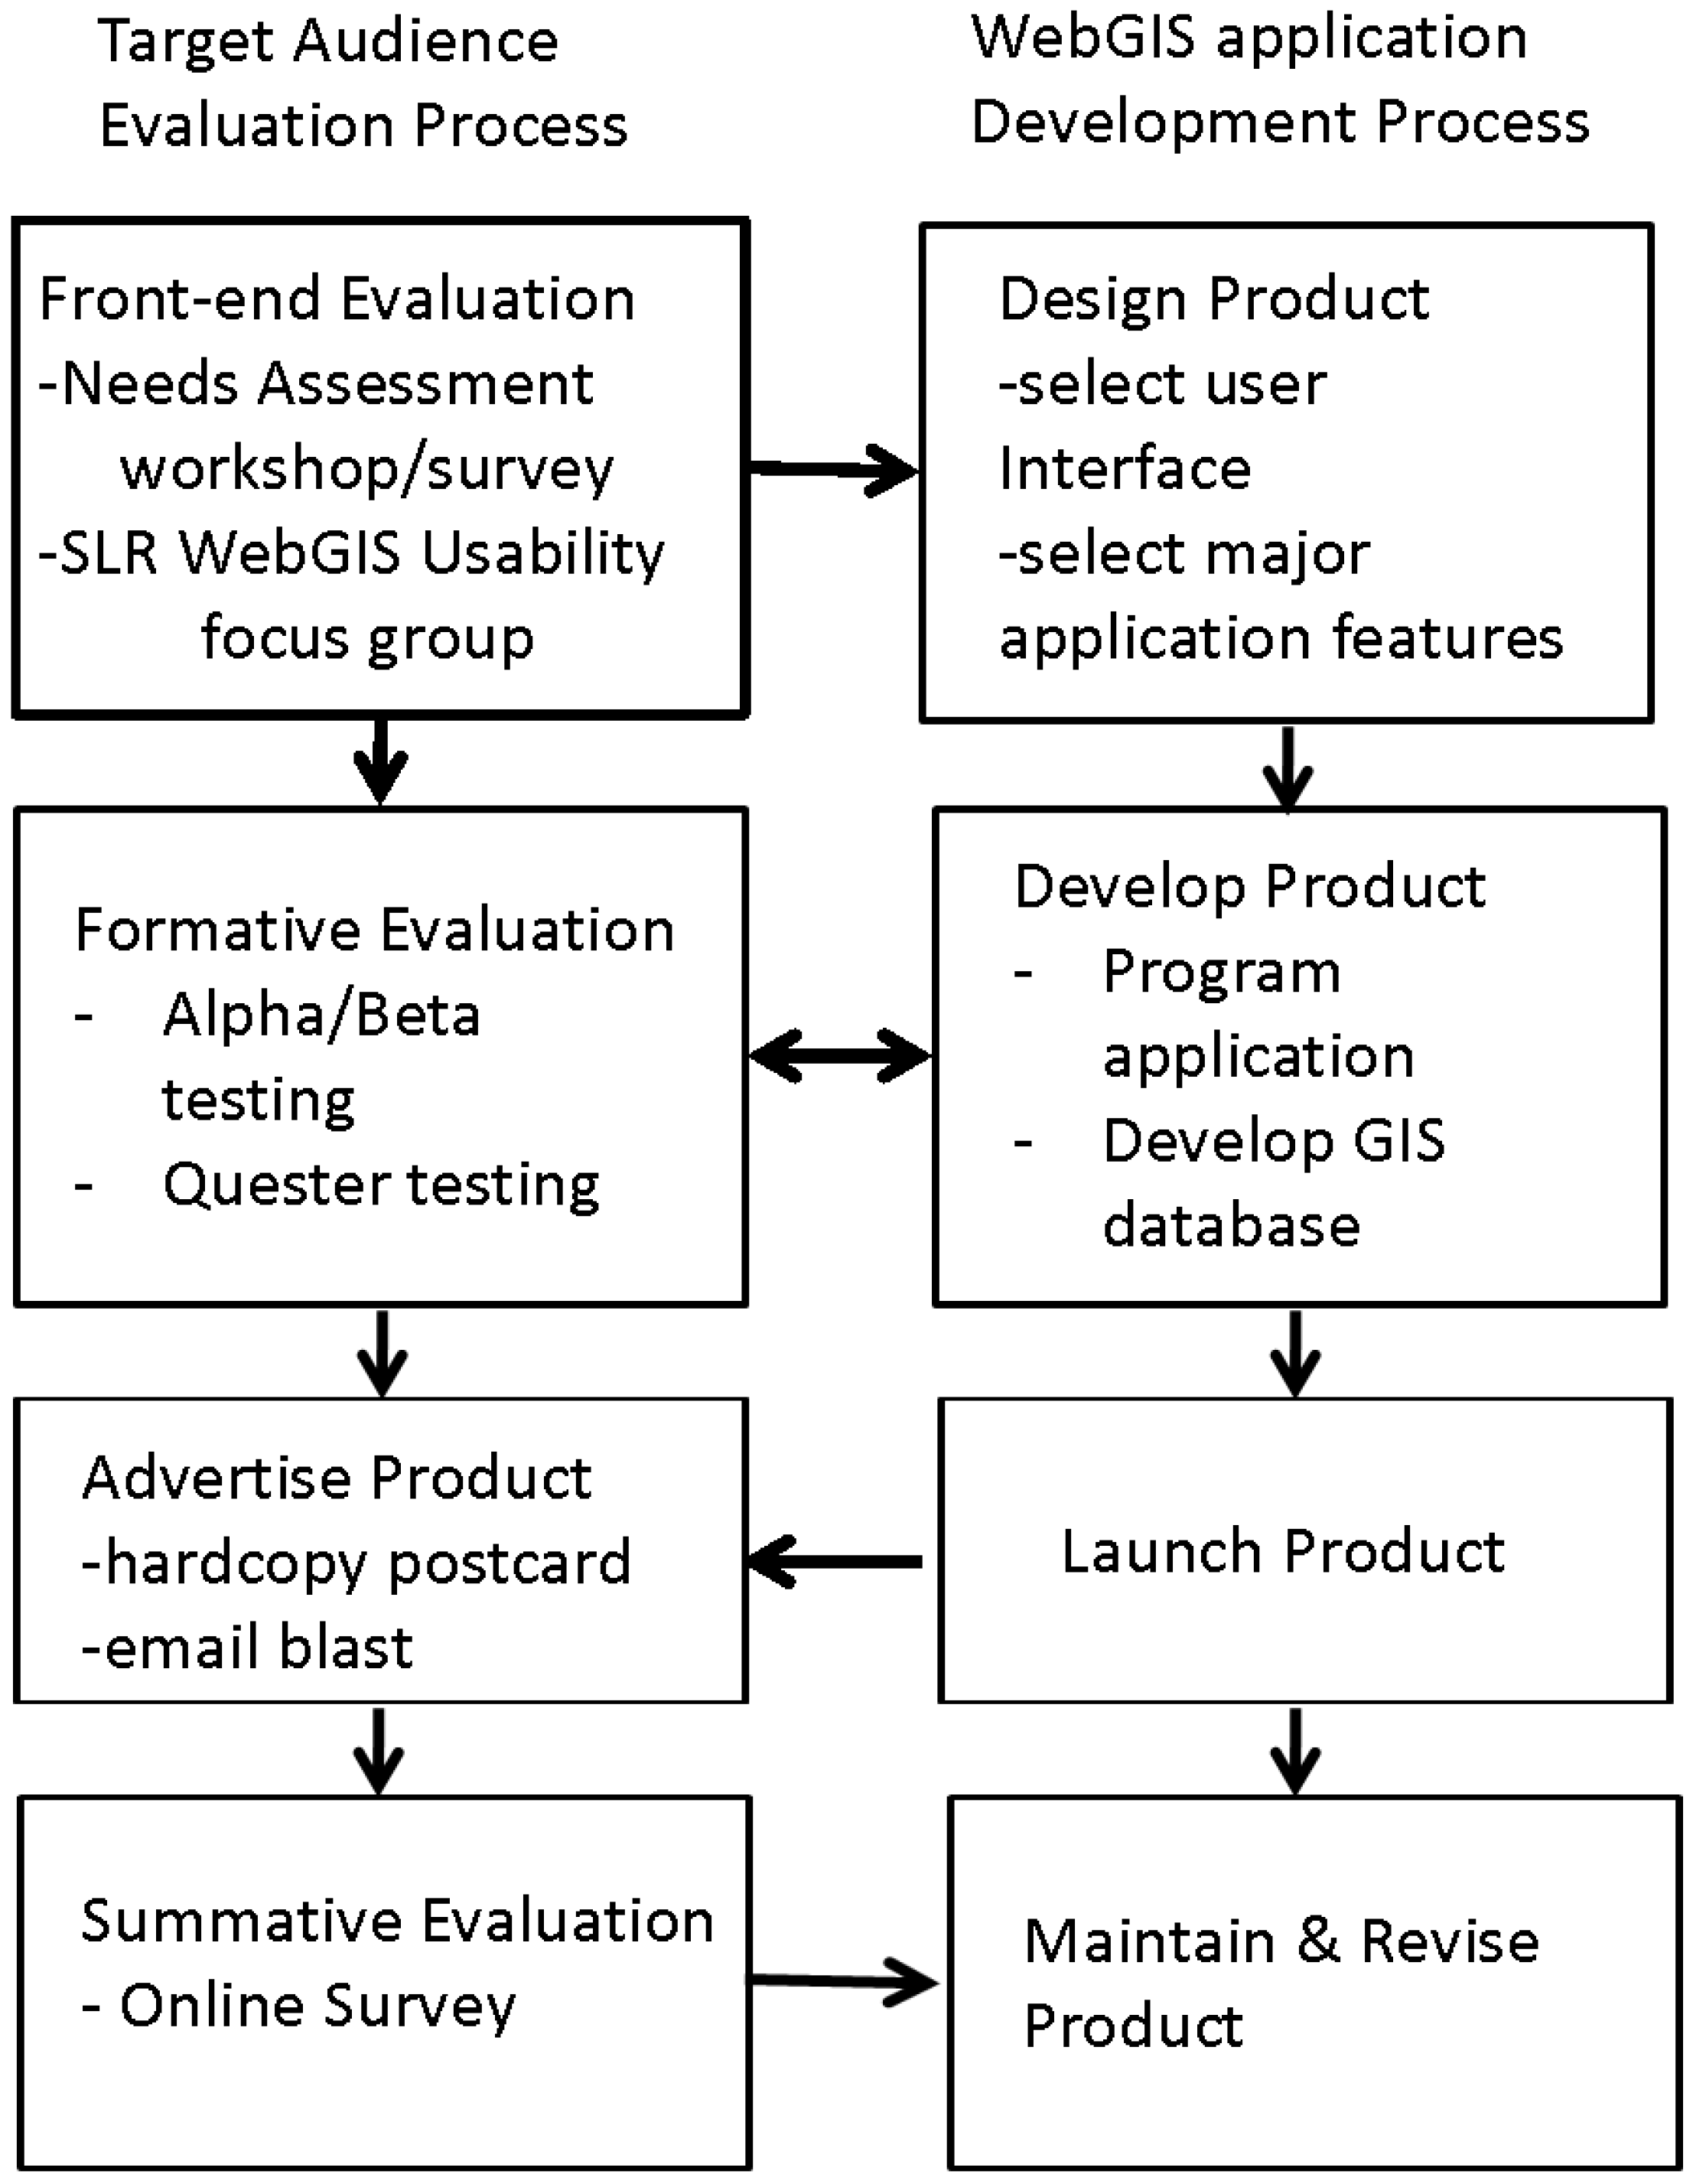
The user-centered design approach that we adopted was time intensive, but appeared to result in an end-product that was largely successful in meeting the target audiences’ needs. The instructional systems design (ISD) model (Table 1) called for extensive front-end evaluation to assess the users’ needs, formative evaluation to provide for iterative feedback during the development stage and a summative evaluation to assess the usefulness of the final product. As posited by Haklay and Tobón [20], we found the usability testing of the WebGIS application as central to a user-centered design process and critical to meeting our objective of a final system interface that enabled non-expert users to use the NJFloodMapper application efficiently and purposefully. Our results show that a strong majority of the summative evaluators “agreed” or “strongly agreed” that it easy to find their “way around the site” and that they “can get information quickly”. When asked for three words to describe NJFloodMapper, respondents’ most commonly used words included “informative”, “interesting” and “useful”. Most importantly, the respondents have used the NJFloodMapper tool in the six month period since its launch in February 2013, to meet their specific geospatial information needs. Superstorm Sandy generated intense interest in issues related to storm surge and sea level rise. While NJFloodMapper was designed with long-term sea level rise in mind, due to its flexible design and the ability to visualize coastal inundation more broadly, our summative evaluation, as well as the feedback from various state, county and municipal government agencies and non-profit organizations suggest that NJFloodMapper has been widely adopted in Sandy’s aftermath in assessing coastal vulnerability to storm surge and planning for more resilient rebuilding efforts.
In considering access and participatory approaches in using geographic information, De Man [37] posited that access to geographic information is both a necessary and, possibly, an enabling condition for participation in its use; but not a sufficient condition. Niles and Hanson [19] expand this notion that accessibility to geospatial information is not simply making information available online, but that “Virtual accessibility requires that people be able to find, make sense of, and apply information on the Internet: considering access to information as good in its own right overlooks the importance of the context within which that information is received and the reason for which it is sought.” By employing a user-centered design approach and stressing the usability of the tool by the target audience, we have attempted to partially address these concerns. When asked for three things that respondents liked best about NJFloodMapper, commonly used phrases again included “easy to use”, “user friendly”, “current information/content” and “one stop shop”. These last two phrases, “current information/content” and “one stop shop” are important, in that the NJFloodMapper has attempted to bring together relevant geospatial data from a variety of trusted federal sources (e.g., FEMA, NOAA, Army Corps of Engineers) to meet the identified needs of our target audience. In addition, we have provided information explaining the GIS data displayed, the sources and accuracy directly adjacent to the map viewer. Skarlatidou et al. [38] suggest that these and other elements of the application’s user interface are important to establishing end-user trust in WebGIS. As part of the larger project website, we included a background on the issues of sea level rise and coastal inundation, as well as links to resources to assist in interpreting and applying the information for land use planning purposes.
As a next step, we are linking the NJFloodMapper WebGIS application with a web-based decision support tool, Getting to Resilience (www.prepareyourcommunityNJ.org) [39], to provide the target audience with the requisite context for the geospatial information and the rationale for why it is useful. Users of the Getting to Resilience (GTR) web tool will use the NJFloodMapper as the first step to educate themselves about their exposure to sea level rise and flooding conditions. The core of the GTR web tool is a questionnaire that was developed as a non-regulatory tool to assist local decision-makers in the collaborative identification of planning, mitigation and adaptation opportunities to reduce vulnerability to coastal storms and sea level rise, thus building capacity for coastal community resilience. The GTR tool will inform users about how vulnerability planning is “rewarded” by programs like FEMA’s Community Rating System, FEMA’s Hazard Mitigation Planning processes and Sustainable Jersey’s voluntary municipal points system [40].

5. Conclusions

WebGIS sea level rise and coastal inundation viewers, such as NJFloodMapper, can provide critical place-based information on coastal flooding exposure and potential vulnerability. Based on the software template originally developed for NOAA’s Digital Coast initiative [22], the NJFloodMapper tool leverages this national-scale effort with enhanced functionality and locally-refined geospatial data and visualization examples. The user-centered design process, while time consuming, was central to moving us towards that elusive goal of “virtual accessibility” [19]. The process fostered a connection with our target audience, resulting in a final product that met most of their self-identified needs as well as promoting a greater acceptance on their part to use the tool once it was released. While visualization of flood exposure is a critical first step, it became clear through this project that additional decision support tools are needed to help coastal decision-makers translate the place-based information into concrete action plans. It is our hope that linking NJFloodMapper with Getting to Resilience web decision support tools will meet this need and support local communities in enhancing their emergency preparedness and promoting more resilient coastal land use planning decisions.

Acknowledgments

We gratefully acknowledge the critical contributions of Doug Marcy, Keil Schmid, William Brooks and Kyle Draganov of the Digital Coast Program of the NOAA Coastal Services Center (CSC), Charleston, South Carolina. NOAA CSC provided the viewer template and a number of important data sets. Darlene Finch, NOAA CSC’s Mid-Atlantic Regional Coordinator, played a key role as our liaison with NOAA. Brenda Allen, Eden Buenaventura, and Bryan Serino contributed to the development of the critical facilities database. Jennifer McWhorter and Robert Koch created the CanVIZ visualizations. In addition, we would like to thank our collaborators at the Barnegat Bay Partnership and the State of New Jersey’s Coastal Management Program. We would also like to thank the various federal and state agencies that have provided GIS data to support the NJFloodMapper. We gratefully acknowledge the thoughtful suggestions provided by two anonymous reviewers. Funding to support this project was provided by the NOAA Cooperative Institute for Coastal and Estuarine Environmental Technology, New Jersey SeaGrant, Sustainable New Jersey and the New Jersey Agricultural Experiment Station.

Author Contributions

Richard Lathrop served as the Principal Investigator for the NJFloodMapper project and authored the majority of this manuscript. Lisa Auermuller was responsible for conducting the focus group engagement and authoring corresponding sections of this manuscript. James Trimble was responsible for the computer programming required to develop and host the NJFloodMapper WebGIS application. John Bognar was responsible for overseeing the development of the NJFloodMapper GIS databases and manuscript graphics production.

Conflicts of Interest

The authors declare no conflict of interest.

References

  1. Miller, K.G.; Kopp, R.E.; Horton, B.P.; Browning, J.V.; Kemp, A.C. A geological perspective on sea-level rise and impacts along the U.S. mid-Atlantic coast. Earth’s Future 2014. in review. [Google Scholar]
  2. Parris, A.; Bromirski, P.; Burkett, V.; Cayan, D.; Culver, M.; Hall, J.; Horton, R.; Knuuti, K.; Moss, R.; Obeysekera, J.; et al. Global Sea Level Rise Scenarios for the US National Climate Assessment; NOAA Tech Memo OAR CPO-1; NOAA Climate Program Office: Silver Spring, MD, USA, 2012. [Google Scholar]
  3. Yin, J.; Schlesinger, E.E.; Stouffer, R.J. Model projections of rapid sea-level rise on the northeast coast of the United States. Nat. Geosci. 2009, 2, 262–266. [Google Scholar] [CrossRef]
  4. Cutter, S.L. A Framework for Measuring Coastal Hazard Resilience in New Jersey Communities; White Paper for Urban Coast Institute: Monmouth University, NJ, USA, 2008; p. 12. Available online: http://co.monmouth.nj.us/documents/104/CoastalHazardResilientCommunities.pdf (accessed on 27 September 2013).
  5. Background Documents Supporting Climate Change Science Program Synthesis and Assessment Product 4.1 Coastal Elevations and Sensitivity to Sea-Level Rise; EPA 430R07004; Titus, J.G.; Strange, E.M. (Eds.) U.S. EPA: Washington, DC, USA, 2008. Available online: http://www.epa.gov/climatechange/effects/coastal/background.html (accessed on 27 September 2013).
  6. Lathrop, R.G.; Love, A.A. Vulnerability of New Jersey’s Coastal Habitat to Sea Level Rise; CRSSA Technical Report. Rutgers University: New Brunswick, NJ, USA, 2007. Available online: http://crssa.rutgers.edu/projects/coastal/sealevel/report/Vulnerability%20of%20New%20Jersey%20coastal%20habitats.pdf (accessed on 27 September 2013).
  7. Cooper, M.J.P.; Beever, M.D.; Oppenheimer, M. Future Sea Level Rise and the New Jersey Coast: Assessing Potential Impacts and Opportunities; Woodrow Wilson School of Public and International Affairs: Princeton University, NJ, USA, 2005. [Google Scholar]
  8. Psuty, N.P.; Ofiara, D.D. Coastal Hazard Management, Lessons and Future Direction from New Jersey; Rutgers University Press: New Brunswick, NJ, USA, 2002. [Google Scholar]
  9. Gornitz, V.; Couch, S.; Hartig, E.K. Impacts of sea level rise in the New York City metropolitan area. Glob. Planet. Chang. 2002, 32, 61–88. [Google Scholar] [CrossRef]
  10. Field, J.C.; Boesch, D.F.; Scavia, D.; Buddemeier, R.; Burkett, V.R.; Cayan, D.; Fogarty, M.; Harwell, M.; Howarth, R.; Mason, C.; et al. Potential Consequences of Climate Variability and Change on Coastal Areas and Marine Resources. In Climate Change Impacts on the United States: The Potential Consequences of Climate variability and Change, Report for the U.S. Global Change Research Program; National Assessment Synthesis Team, Ed.; Cambridge University Press: Cambridge, UK, 2000; pp. 461–483. [Google Scholar]
  11. Najjar, R.G.; Walker, H.A.; Anderson, P.J.; Barro, E.J.; Bord, R.J.; Gibson, J.R.; Kennedy, V.S.; Knight, C.G.; Megonigal, J.P.; O’Connor, R.E.; et al. The potential impacts of climate change on the mid-Atlantic coastal region. Clim. Res. 2000, 14, 219–233. [Google Scholar] [CrossRef]
  12. Intergovernmental Panel on Climate Change (IPCC). Strategies for Adaptation to Sea Level Rise. In Report of the Coastal Management Subgroup; Response Strategies Working Group: The Hague, The Netherlands, 1990. [Google Scholar]
  13. Seiden, E. Climate Change: Science, Education and Research for Tomorrow’s Estuaries; NERRS Climate Change Workgroup, National Estuarine Reserve System: Silver Spring, MD, USA, 2008. [Google Scholar]
  14. NOAA Center for Sponsored Coastal Ocean Research. Planning for the Impacts of Sea Level Rise and Climate Change Workshop Summary. 2007. Available online: http://www.cop.noaa.gov/stressors/climatechange/current/slr/SLR_mgr_mtg_summary.pdf (accessed on 27 September 2013). [Google Scholar]
  15. Sieber, R. Public participation geographic information systems: A literature review and framework. Ann. Assoc. Am. Geogr. 2006, 96, 491–507. [Google Scholar] [CrossRef]
  16. Fu, P.; Sun, J. WebGIS: Principles and Applications; Esri Press: Redlands, CA, USA, 2010. [Google Scholar]
  17. Haklay, M.; Singleton, A.; Parker, C. Web mapping 2.0: The neogeography of the GeoWeb. Geogr. Compass 2008, 2, 2011–2039. [Google Scholar] [CrossRef]
  18. Carver, S. The future of participatory approaches using geographic information: Developing a research agenda for the 21st Century. URISA J. 2003, 15 APA I, 61–71. [Google Scholar]
  19. Niles, S.; Hanson, S. A new era of accessibility? URISA J. 2003, 15 APA I, 35–41. [Google Scholar]
  20. Haklay, M.; Tobón, C. Usability evaluation and PPGIS: Towards a user-centred design approach. Int. J. Geogr. Inf. Sci. 2003, 17, 577–592. [Google Scholar] [CrossRef]
  21. Instructional Technology: Foundations; Gagne, R.M. (Ed.) Lawrence Erlbaum Associates: Hillsdale, NJ, USA, 1987.
  22. NOAA Coastal Services Center. Available online: http://www.csc.noaa.gov/digitalcoast/tools/slrviewer/ (accessed on 27 September 2013).
  23. The Nature Conservancy. Available online: http://maps.coastalresilience.org/nyct/# (accessed on 27 September 2013).
  24. NOAA Coastal Services Center. Available online: http://csc-s-web-p.csc.noaa.gov/de_slr/ (accessed on 27 September 2013).
  25. State of California. Available online: http://www.climatechange.ca.gov/visualization/sealevel.html (accessed on 27 September 2013).
  26. Pacific Institute. Available online: http://www.pacinst.org/reports/sea_level_rise/gmap.html (accessed on 27 September 2013).
  27. Social Vulnerability Index. Available online: http://webra.cas.sc.edu/hvri/products/sovi.aspx (accessed on 12 February 2014).
  28. Ehman, J. SLAMM-View. [SLAMM Model Graphic Viewer] Image Matters, LLC, 2012. Available online: http://www.slammview.org/ (accessed on 27 September 2013).
  29. U.S. Fish & Wildlife Service. Science behind the Sea Level Affecting Marshes Model (SLAMM). 2011. Available online: http://www.fws.gov/slamm/SLAMM1.pdf (accessed on 27 September 2013). [Google Scholar]
  30. JC NERR. Preparing Your Community in the Face of a Changing Climate. 2010. Available online: http://www.JCNERR.org/pdfs/proceedings%20document.changing%20climate.pdf (accessed on 27 September 2013).
  31. NJFloodMapper. Available online: http://www.NJFloodmapper.org (accessed on 27 September 2013).
  32. Climate Central’s Surging Seas. Available online: http://sealevel.climatecentral.org/ (accessed on 27 September 2013).
  33. Natural Capital Project’s Coastal Vulnerability Model. Available online: http://www.naturalcapitalproject.org/models/coastal_vulnerability.html (accessed on 27 September 2013).
  34. FEMA Best Available Flood Hazard Data. Available online: http://www.fema.maps.arcgis.com (accessed on 27 September 2013).
  35. NOAA’s Sea Level Rise Planning Tool. Available online: www.globalchange.gov/what-we-do/assessment/coastal-resilience-resources (accessed on 27 September 2013).
  36. U.S. Geological Survey’s Assessment of Hurricane-Induced Coastal Erosion Hazards. Available online: http://olga.er.usgs.gov/hurricane_erosion_hazards/ (accessed on 27 September 2013).
  37. De Man, W.H.E. Cultural and institutional conditions for using geographic information: Access and participation. URISA J. 2003, 15 APA I, 29–33. [Google Scholar]
  38. Skarlatidou, A.; Cheng, T.; Haklay, M. Guidelines for trust interface design for public engagement WebGIS. Int. J. Geogr. Inf. Sci. 2013, 27, 1668–1687. [Google Scholar] [CrossRef]
  39. Getting to Resilience: A Community Planning Evaluation Tool. Available online: http://www.prepareyourcommunitynj.org (accessed on 27 September 2013).
  40. Sustainable Jersey. Available online: http://www.sustainablejersey.com/ (accessed on 27 September 2013).

