1. Introduction
Health and economic development go hand in hand. Health planning has been an integral part of socio-economic planning in India since its independence [
1]. There have been recommendations from health committees over the years, which were translated into health policies [
2]. Along with this, India has also progressed in the world economy. The per capita GDP of the country has increased from around U.S. $142 in 1950–1951 to around U.S. $720 in 2010–2011 (values at 2004–2005 constant prices) [
3].
For the past 30 years, the country has made significant improvement in the infrastructure in the health sector, with achievements, such as the eradication of communicable diseases, including polio [
3]. However, the health sector has often been one of the neglected areas in India’s planning scenario [
4]. India is one of the countries with the lowest public spending in the health sector [
5]. At the beginning of the last decade (2000), only one percent of the GDP in India was dedicated to the health sector [
4]. In 2013, the public expenditure in health sector stands at 1.1% of the GDP [
5]. There is a rise of unregulated private healthcare facilities in the country [
4], and over 70% of the healthcare expenditure is out-of-pocket expenditures [
5]. All these factors have led India to lose around 6% of its GDP every year to premature deaths and preventable diseases [
5], with the country accounting for 21% of the global burden of diseases.
In order to use economic development to improve the health of its population, there is a need for disaggregated data to support planning and policy in the health sector. State-level data often mask out the districts deserving special attention for healthcare development. As a result, the Registrar General of India formulated the plan for Annual Health Survey in 2005. This was planned to be conducted from 2010–2013 in nine selected states of India with the highest rate of population growth. These are: Bihar, Jharkhand, Uttar Pradesh, Uttarakhand, Madhya Pradesh, Chhattisgarh, Orissa, Rajasthan and Assam. However, this survey was mainly undertaken by means of household interviews across 284 districts (administrative units that make up an Indian state) by enumerators. Secondly, due to the constraints of the vastness of the states along with the differences in the socio-economic conditions, it was conducted on a sample of a population of 20.1 million from 4.1 million households.
The main objective of this paper is to predict health indicators at the district level for the whole of India. Correlations were examined between health indicators (obtained from the Annual Health Survey (AHS) Reports) and development metrics (percentage of houses with access to electricity and district domestic product (DDP)). The information from two nighttime satellite images were used along with these data to propose models. Unlike previous works by the authors [
6,
7], this research takes into account the development indicators along with the information from satellite images as predictor variables to prepare the models. The models successfully predict the health indicators with high accuracy (less than 7%–10% error). Health metrics, such as crude birth rate and maternal mortality rate, demonstrated strong correlations with development metrics, with correlation coefficients ranging from 0.92 to 0.99 at the 99% confidence interval.
The paper is divided into three parts. The first part examines the correlations between DDP and the level of electrification with the health indicators. Part two of the paper focuses on building the models, and the final part prepares the health atlas of India and establishes the correlation between health and development.
2. Study Area
The first part of this study was based on all the districts of Bihar, Jharkhand, Uttar Pradesh, Uttarakhand, Madhya Pradesh, Chhattisgarh, Odisha, Rajasthan and Assam. In the second part, models were proposed to predict the health indicators using the data from the five states of Assam, Bihar, Jharkhand, Odisha and Rajasthan (142 districts). Data on DDP was freely available for these five states. The models were finally used to predict health indicators for all the districts of India.
3. Data Used
The current study used satellite images, as well as data from the Indian census, Indian Annual Health Survey and Indian Economic Survey.
Two kinds of satellite images captured at night were used in this research. The first image was obtained from F18 DMSP-OLS satellite in 2010. The stable light product of the satellite was used in this paper. These products were created by compositing the cloud-free orbital sections in the centre half of the swath, with no sun and moonlight present [
8]. This was followed by a process of the filtering of noise and transient light sources, such as fires. The grid cell size of these images was 30 arc seconds or 1 square kilometre at the equator [
8]. However, the bright areas, such as urban cores, were saturated in these images, and variations in the distribution of radiance within these areas were indiscernible. The second nighttime image was captured in 2011 by the Visible Infrared Imaging Radiometer Suite (VIIRS) instrument on board the Suomi National Polar Partnership (SNPP) satellite. NASA and NOAA launched this satellite jointly in 2011 [
8]. The data composites were generated using VIIRS day/night band (DNB) data collected on nights with zero moonlight. Cloud screening was done based on the detection of clouds in the VIIRS M15 thermal band [
8]. The original radiance values have been multiplied by a billion, and thus, the units of radiance obtained from the images are nano-Watts/cm
2/sr [
9].
Data on the percentage of households with access to electricity and the total population of the districts were obtained from the Indian census, 2011. The data on health indicators was obtained from the second round of Annual Health Survey Bulletins, 2011–2012. These data were collected for the nine states of Assam, Bihar, Chhattisgarh, Jharkhand, Orissa, Madhya Pradesh, Uttar Pradesh, Rajasthan and Uttarakhand. District Domestic Product information was obtained from the Economic Survey reports of the respective states. The DDP data at the base price of 2004–2005 was used in this study.
The DMSP-OLS sensor has captured images of the Earth at night for more than 40 years. The data has been widely applied in different research studies. It has been used to estimate the population of the countries of the world [
10,
11,
12] and in estimating population without access to electricity [
13]. The first global map of the GDP purchasing power parity (GDP-PPP) [
14] and gas flares [
15] used radiance calibrated DMSP-OLS data to map urban and suburban extent around cities [
16,
17]. At the smaller spatial scale, the DMSP-OLS dataset was used to estimate population and other socio-economic metrics for the state of Maharashtra in India [
7,
18,
19,
20,
21] and GDP estimates [
22].
The VIIRS satellite sensor has a similar polar orbit to the DMSP-OLS image and a swath of 3000 km. It also has the same spectral band pass as the DMSP-OLS low-light imaging band (0.5–0.9 um). The DMSP-OLS, however, has an overpass time of around 19:30, while the VIIRS passes after midnight around 01:30 [
9].
The VIIRS data is relatively new [
23] and has been mainly used for nocturnal detection and characterization of combustion sources, such as emissions from gas flares, biomass burning, industrial sites and volcanoes [
24,
25].
4. Method
4.1. Step I: Satellite Image Processing
The DMSP–OLS satellite image for 2010 is an eight-bit image with pixel values ranging from 0–63, while the VIIRS image is a 14-bit image. In both of the images, the areas with persistent lights have higher pixel values. These correspond with higher population areas on the surface and act as surrogate maps of cities and towns. Subsets of each of the nine states were taken from the satellite images. This was followed by image geometric correction and image enhancement. The DMSP-OLS images were re-projected from the World Geographic System (WGS) Projection to the Lambert Conformal Conic Projection with the datum, WGS 1984. The DMSP-OLS images were contrast-enhanced, and a standard deviation stretch was applied. The average stable light from the DMSP-OLS image and the mean radiance from the VIIRS image for each district in the states was calculated using the Arc Info software package.
4.2. Step II: Processing of Secondary Data Sources
Analyses began with the calculation of the mean of the health metrics, the percentage of houses with electricity and the DDP for each state. The Annual Health Survey includes crude birth rate (CBR), crude death rate, natural growth rate, infant mortality rate (IMR), neo-natal mortality rate, post-neo-natal mortality rate, under five mortality rate, the gender ratio at birth, the gender ratio (0–4 years), maternal mortality rate (MMR) and the gender ratio of maternal and non-maternal mortality rates. These maternal and non-maternal mortality rates were available only for regional subdivisions within a state and not for each district [
26].
In order to examine the nature of the distribution of the health indicators over the states, statistical tests for a normal distribution were conducted. Histograms were plotted to graphically assess the distribution of these metrics. In addition to this, skewness and kurtosis were also calculated. Skewness is a measure of symmetry in the data, while kurtosis refers to the peakiness of the data distribution. In order to calculate whether the value of zero for both skewness and kurtosis lie within the 95% confidence interval, the z-scores of skewness and kurtosis were calculated. In a perfectly normal distribution, the values of skewness and kurtosis are zero. An absolute value of these scores greater than 1.96 is significantly different from the normal distribution at more than the 95% confidence interval. Therefore, all the variables with z-scores less than 1.96 are normally distributed. The results of the distribution helped in the selection of health metrics for modelling.
Table 1 shows the mean, standard deviation, skewness, kurtosis and the z-scores of skewness and kurtosis. It was observed that only IMR and under 5 mortality rate (U5MR) have a normal distribution (z-scores less than 1.96).
Table 1.
Skewness and kurtosis of health metrics. CBR, crude birth rate; IMR, infant mortality rate; MMR, maternal mortality rate.
Table 1.
Skewness and kurtosis of health metrics. CBR, crude birth rate; IMR, infant mortality rate; MMR, maternal mortality rate.
| Statistics |
|---|
| | | CBR | CDR | IMR | Neo-Natal Mortality Rate | Under 5 Mortality Rate | MMR | Gender Ratio |
|---|
| N | Vaild | 284 | 284 | 284 | 284 | 284 | 284 | 284 |
| Missing | 0 | 0 | 0 | 0 | 0 | 0 | 0 |
| Mean | | 23.992 | 7.571 | 58.458 | 39.479 | 78.595 | 279.557 | 954.197 |
| Std. Deviation | | 3.8667 | 1.5036 | 13.9609 | 11.2543 | 20.0106 | 62.9007 | 66.6693 |
| Skewness | | 0.384 | 0.376 | 0.039 | 0.382 | 0.087 | 0.339 | 1.113 |
| Std. Error of Skewness | | 0.145 | 0.145 | 0.145 | 0.145 | 0.145 | 0.145 | 0.145 |
| Kutosis | | 0.941 | −0.084 | 0.409 | 0.145 | 0.432 | −0.010 | 2.037 |
| Std. Error of Kutosis | | 0.288 | 0.288 | 0.288 | 0.288 | 0.288 | 0.288 | 0.288 |
| | Z score_skewness | 2.65619438 | 2.59710546 | 0.2691124 | 0.639865406 | 0.604767764 | 2.34790618 | 7.695079608 |
| | Z score_kutosis | 3.26451241 | −0.2899202 | 1.41850337 | 0.503650003 | 1.500358571 | −0.03550822 | 7.069284246 |
Table 2.
Skewness and kurtosis of health metrics (log normal).
Table 2.
Skewness and kurtosis of health metrics (log normal).
| Statistics |
|---|
| | | CBR | CDR | IMR | Neo-Natal Mortality Rate | Under 5 Mortality Rate | MMR | Gender Ratio |
|---|
| N | Vaild | 284 | 284 | 284 | 284 | 284 | 284 | 284 |
| Missing | 0 | 0 | 0 | 0 | 0 | 0 | 0 |
| Mean | | 3.165 | 2.005 | 4.037 | 3.633 | 4.328 | 5.608 | 6.859 |
| Std. Deviation | | 0.1623 | 0.1999 | 0.2628 | 0.3029 | 0.2814 | 0.2298 | 0.0678 |
| Skewness | | −0.198 | −0.133 | −1.044 | −0.665 | −1.026 | −0.271 | 0.845 |
| Std. Error of Skewness | | 0.145 | 0.145 | 0.145 | 0.145 | 0.145 | 0.145 | 0.145 |
| Kutosis | | 0.300 | −0.269 | 2.381 | 1.294 | 2.204 | -0.148 | 1.288 |
| Std. Error of Kutosis | | 0.288 | 0.288 | 0.288 | 0.288 | 0.288 | 0.288 | 0.288 |
| | Z score_skewness | −1.365517241 | −0.917241379 | −7.2 | −4.586206897 | −7.075862069 | −1.868965517 | 5.827586207 |
| | Z score_kurtosis | 1.041666667 | −0.934027778 | 8.267361111 | 4.493055556 | 7.652777778 | −0.513888889 | 4.472222222 |
In order to reduce the peakiness and to increase the symmetry of the data, the metrics were converted to logarithmic values. Logarithmic values to base “e” or “log-normal” values were calculated. This significantly improved the results. After converting to log values, it was observed that CBR, CDR and MMR were normally distributed (
Table 2).
In the next stage, correlations between the health metrics and the development indicators (percentage of households with electricity and DDP) were obtained. The correlations of these metrics with the average stable light and the average radiance were also calculated. On the basis of the results from these correlations, CBR and MMR were selected for further analyses and modelling.
4.3. Step III: Models
In order to prepare the health atlas of India (maps of health metrics for the districts of the country), multiple regression models were proposed. Due to the availability of DDP information over five states, models were calculated on the data from those states. They include the states of Assam, Bihar, Jharkhand, Odisha and Rajasthan (142 districts). One hundred districts were randomly chosen to build the models, and the results were validated over 42 withheld districts. Models were also prepared to predict DDP. This model was used to predict DDP for the districts of India for which the data was not available.
4.4. Step IV: Preparing the Atlas
Using the models, CBR and MMR were predicted for all the districts of India. A strong correlation was noted between predicted data and the percentage of households with electricity and DDP for all the districts. Correlation coefficients of more than 0.92 at the 99% confidence between the health metrics and the development indicators were observed.
5. Health and Development
5.1. Health Status in India
India displays a complex picture in the health sector. There are large regional variations of health indicators within the country. The health indicators of some of the southern states, such as Kerala and Tamil Nadu, are comparable to those of developed countries [
27]. However, states, like Uttar Pradesh, Madhya Pradesh, Bihar, Jharkhand, Chhattisgarh and Odisha, have lagged behind in overall progress in health sector [
27]. These are the most populated states in the country, with more than 50% of the total population living in these areas. Moreover, 70% of infant deaths and 62% of maternal deaths for the country are recorded from these regions [
26].
The Millennium Development Goals (MDGs) proposed by United Nations in the UN Millennium Summit [
28] helped in formulating the template health infrastructure of the country. The health-related MDGs include poverty and hunger (MDG 1), child health and immunization (MDG 4), maternal and reproductive health (MDG 5), HIV/AIDS, malaria and other diseases (MDG 6), environment sustainability (MDG 7) and global partnership for development (MDG 8) [
29]. The Indian government has asserted its commitment to the achievement of these goals [
27]. The progress of the country towards the MDGs is tracked by a system of sample registrations in India. This is a state- and national-level system designed to collect data on fertility and mortality [
30].
IMR is a measure of the number of deaths of infants less than one year of age. The highest IMR in India is found in the state of Madhya Pradesh, while the lowest is found in Kerala. Kerala (12) and Tamil Nadu (28) have already achieved the Millennium Development Goal (MDG) IMR target of 28 [
30]. Closely following are the states of Delhi (33), Maharashtra (31) and West Bengal (33). The IMR in India has declined by 30 points in the last 20 years, with an annual average decline of 1.5 points [
30]. The maternal mortality ratio (MMR) measures the number of women aged 15–49 years dying due to maternal causes per 100,000 live births [
30]. There is a decline in MMR of about 17% for the whole of India over the last decade. The states of Tamil Nadu, Kerala and Maharashtra have reached the MDG MMR target of 109. The states of Andhra Pradesh, West Bengal, Gujarat and Haryana are close to the target [
30].
Table 3 shows the health indicators for the nine states of India as recorded in the AHS. CBR, defined as the ratio of the number of live births in a year to mid-year population multiplied by 1000 [
26], is highest for the state of Bihar (26.3). IMR and the under-five mortality rate is highest for the state of Uttar Pradesh and lowest for Jharkhand. Uttarakhand has the best gender ratio, with 995 females per 1000 males.
There are also intra-state variations of these metrics. For example, in Uttar Pradesh, the highest CBRs (more than 40) are found in the districts of Shrawasti, Siddharthnagar and Balrampur. In Assam, 15 districts have CBRs ranging from 15–22. In Bihar, the CBR ranges from 21–32, with the majority of the districts having 24–26 CBRs. The district of Bageshwar of Uttarakhand has the lowest CBR. IMR is the highest for the districts of Shrawasti and Faizabad of Uttar Pradesh, Balangir of Odisha and Panna of Madhya Pradesh. These districts have IMR values of more than 90. The lowest IMR (20) is noted in the districts of Pithoragarh, Almora and Rudraprayag of Uttarakhand. MMR is the highest (more than 435) for the districts of Faizabad, Barabanki and Ambedkar Nagar of Uttar Pradesh. The lowest MMR is recorded in the districts of Rudraprayag, Chamoli and Dehra Dun of Uttarakhand. Overall, the state of Uttarakhand displays better heath indicators compared to the other states considered in the AHS survey.
Table 3.
Health indicators of nine states as obtained from the Annual Health Survey (AHS) Second Round Survey, 2011–2012.
Table 3.
Health indicators of nine states as obtained from the Annual Health Survey (AHS) Second Round Survey, 2011–2012.
| State | CBR | CDR | IMR | Neo-Natal Mortality Rate | Under 5 Mortality Rate | MMR | Gender Ratio |
|---|
| Assam | 21.3 | 7.1 | 57 | 38 | 75 | 347 | 959 |
| Bihar | 26.3 | 7 | 52 | 34 | 73 | 294 | 951 |
| Chhatisgarh | 23.5 | 7.4 | 50 | 35 | 66 | 263 | 970 |
| Jharkhand | 23.3 | 5.8 | 38 | 24 | 55 | 267 | 944 |
| Madhya Pradesh | 24.8 | 7.8 | 65 | 43 | 86 | 277 | 916 |
| Odisha | 19.8 | 8.2 | 59 | 39 | 79 | 237 | 995 |
| Rajasthan | 24.4 | 6.4 | 57 | 38 | 76 | 264 | 929 |
| Uttar Pradesh | 25 | 8.4 | 70 | 50 | 92 | 300 | 944 |
| Uttarakhand | 18.2 | 6.4 | 41 | 29 | 50 | 162 | 995 |
5.2. Rate of Electrification in India
Access to modern sources of energy is one of the key factors of development. In 2011, the major source of energy in the Indian states was electricity. It accounted for 51% of the total energy consumption [
31], followed by coal and lignite (25%) and crude petroleum (20%). The domestic sector accounted for the highest contributor to the electricity consumption. The growth in the consumption of electricity in this sector was 15.91% between 2009–2010 and 2010–2011. However, marked regional disparities in the level of electrification are noted within the country. More than 90% of the households have access to electricity in the states of Gujarat, Haryana, Sikkim, Punjab, Himachal Pradesh, Chandigarh and the southern states of Kerala, Andhra Pradesh, Tamil Nadu and Karnataka [
32]. Almost all the households (more than 99%) in the National Capital Territory of Delhi and the Union Territories of Lakshadweep and Daman and Diu use electricity as the major source of energy for lighting [
32]. In contrast, a state, like Bihar, has only 16.4% of its households with access to electricity. The distribution of electricity is slightly better in the states of Uttar Pradesh (36.8%), Assam (37.1%), Odisha (43%), Jharkhand (45.8%), Rajasthan (67%) and Madhya Pradesh (67.1%) [
32].
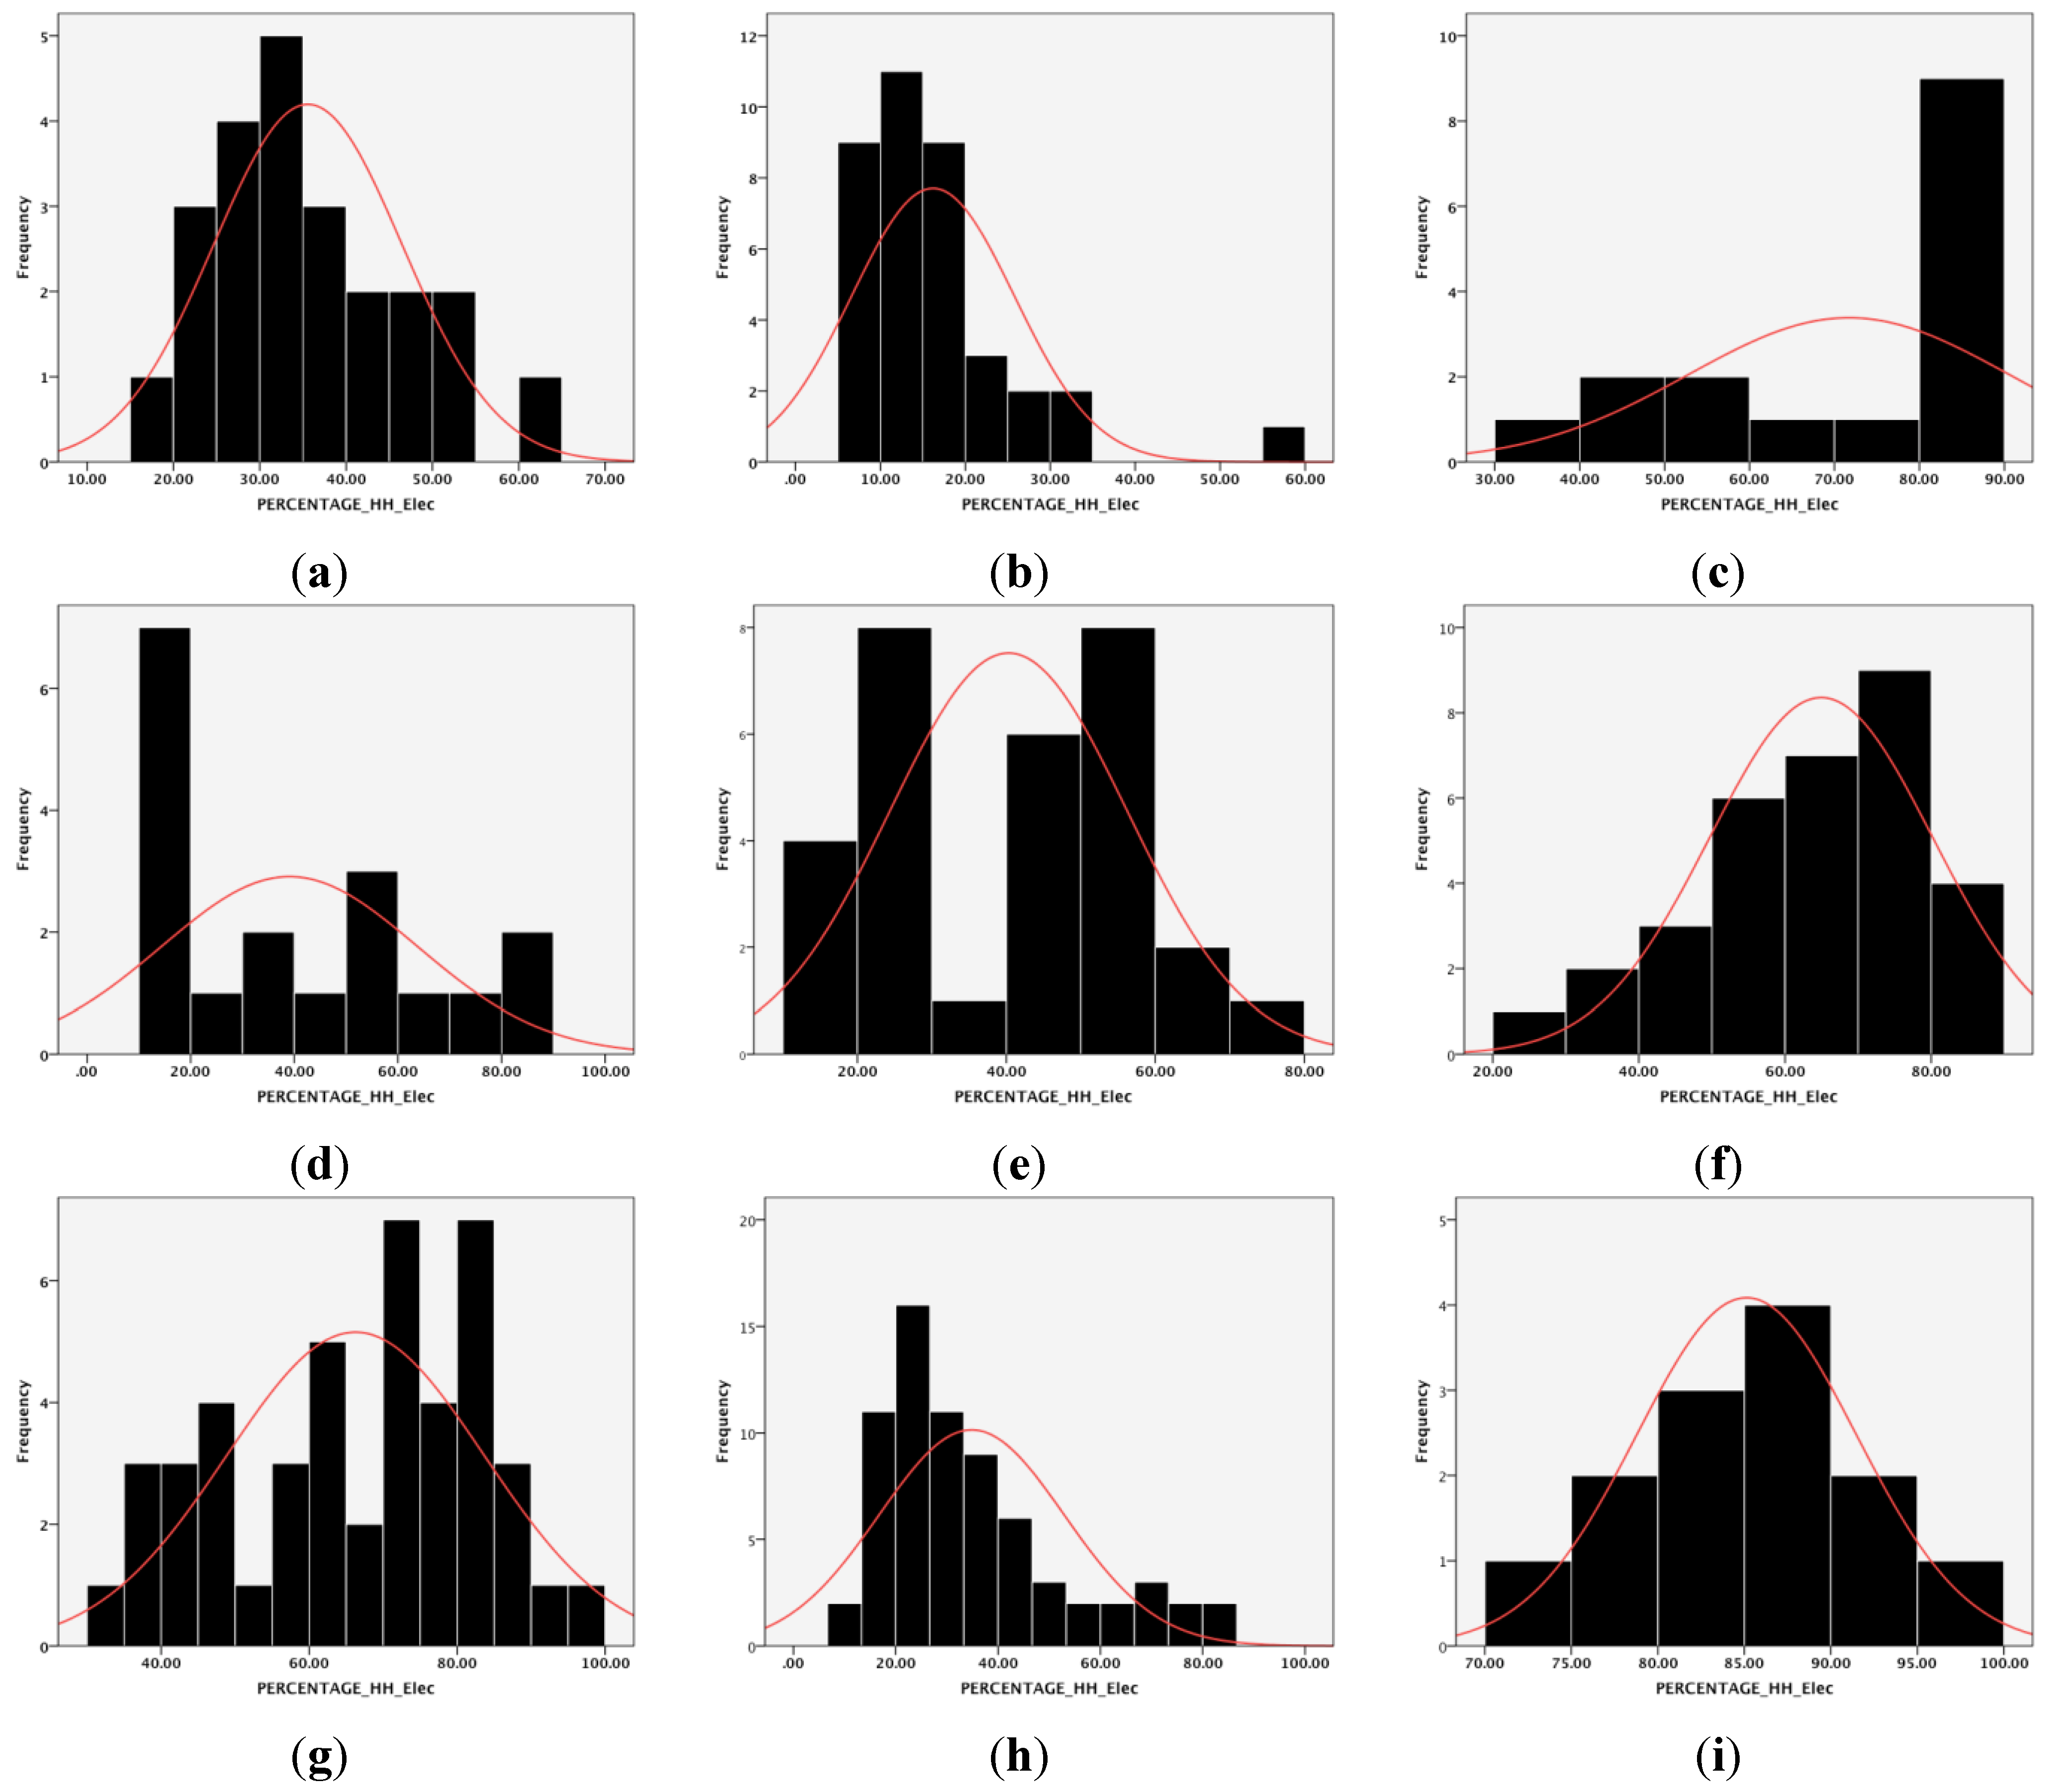
Figure 1 shows the nature of the distribution of electricity in the states of: (i) Assam; (ii) Bihar; (iii) Chhattisgarh; (iv) Jharkhand; (v) Odisha; (vi) Rajasthan; (vii) Madhya Pradesh; (viii) Uttar Pradesh; and (ix) Uttarakhand. Of these nine states, on an average, Uttarakhand has 85.13% of households with access to electricity followed by the states of Chhattisgarh (71.68%), Madhya Pradesh (66.26%) and Rajasthan (64.95%). Odisha has just about 40% of households using electricity as the main source of power supply. The lowest level of electrification is found in the state of Bihar, where only 16% of the households use electricity as their domestic power source.
District-level variations in the rate of electrification are also observed within these nine states. In Assam, the districts of Dibrugarh, Jorhat and Tinsukia have more than 50% of households with electricity. The districts of North Cachar Hills, Sibsagar, Nalbari, Kamrup, Goalpara, Cachar and Golaghat have a level of electrification of more than 35%. The district of Dhubri alone has less than 20% of households with electricity access. In Bihar, more than 57% of the households have access to electricity, only in the capital district of Patna. The rest of the districts have a less than 35% electrification rate. On the contrary, more than 50% of the districts of Chhattisgarh have higher than 80% of households using electricity as the main source of power. The district of Janjgir-Champa in Chhattisgarh has an electrification rate of around 90%. A similar kind of electrification is also found in the state of Uttarakhand. Ten out of 13 districts have more than 80% of households with access to electricity, the highest being found in the capital of Dehradun (96%). Although the districts of Indore and Bhopal in Madhya Pradesh have more than 90% electrification, most of the districts have electrification of around 60%–85%. In Rajasthan, the highest rate of electrification is found in the districts of Kota, Jaipur, Chittaurgarh and Ajmer (more than 80%). Most of the districts of the state, however, have 50%–75% of households with access to electricity. In Uttar Pradesh, 30%–70% of the households have electricity access in most of the districts, with the highest concentration (around 80%) is found in the districts of Ghaziabad, Gautam Budhha Nagar and Agra.
Figure 1.
Level of electrification in nine states of India: (a) Assam; (b) Bihar; (c) Chhattisgarh; (d) Jharkhand; (e) Odisha; (f) Rajasthan; (g) Madhya Pradesh; (h) Uttar Pradesh; (i) Uttarakhand.
Figure 1.
Level of electrification in nine states of India: (a) Assam; (b) Bihar; (c) Chhattisgarh; (d) Jharkhand; (e) Odisha; (f) Rajasthan; (g) Madhya Pradesh; (h) Uttar Pradesh; (i) Uttarakhand.
5.3. Contribution of DDP of the States
Domestic product has always been considered as an indicator of development [
33]. According to the Ministry of Statistics and Program Implementation, Government of India [
33], gross domestic product (GDP) can be defined using three approaches: production approach, income approach and expenditure approach. In the National Accounts Statistics of India, the production approach is considered to be a firmer estimate. “The production approach GDP measures the sum of value added of all economic activities within the country’s territory (sum of output minus intermediate consumption) plus indirect taxes minus subsidies on products” [
33]. The state accounts are an extension of the national accounts at the regional level. At the state level, the most important aggregate is the state domestic product (SDP) and that at the district level is the district domestic product (DDP) [
33]. They are also calculated in exactly the same manner as the domestic product for the country.
Out of the nine states, DDPs at constant prices (2004–2005) were obtained for the states of Assam [
34], Bihar [
35], Rajasthan [
36], Odisha [
37] and Jharkhand [
38]. This data was used to propose models and predict the DDP and health indicators for the other states at the district level.
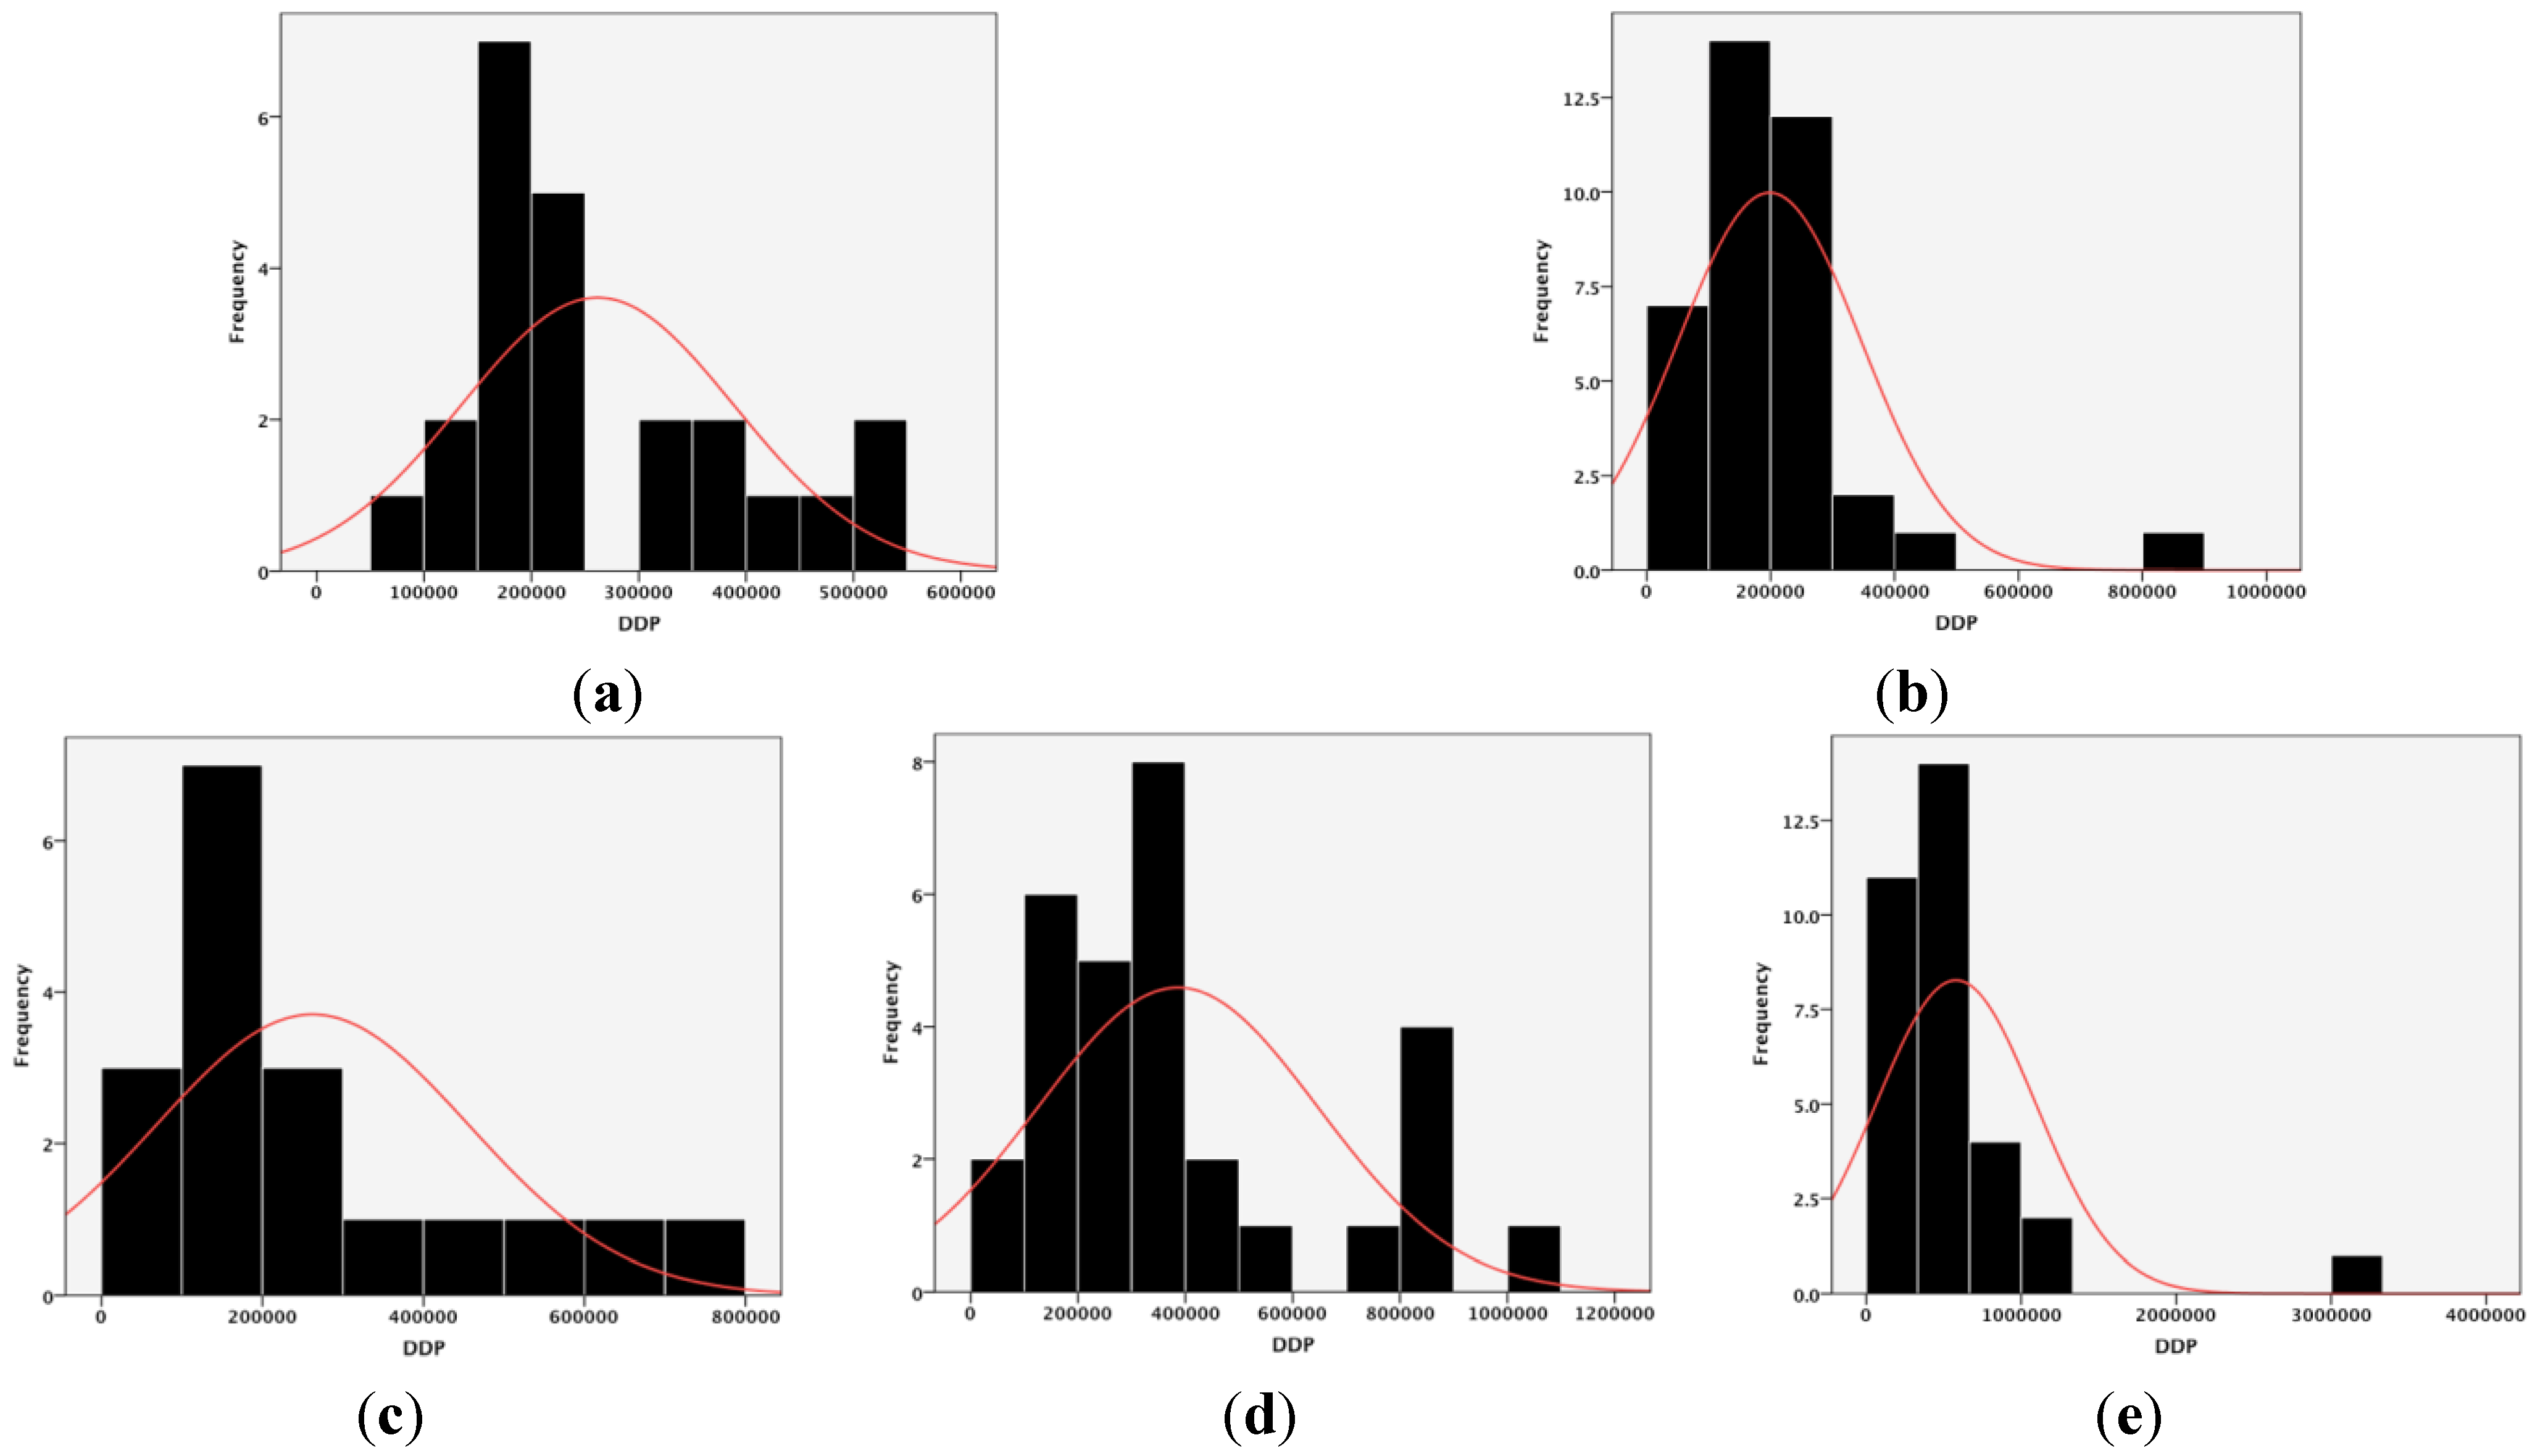
Figure 2 shows the distribution of DDP in the districts of the five states. The mean DDP at 2004–2005 constant prices is the highest for the state of Rajasthan (INR 57,878.46 million) followed by the state of Odisha (INR 38,617.18 million). The state of Bihar has the lowest DDP (INR 19,845.17 million), while both Assam and Jharkhand have mean DDPs of INR 26,154.86 million and INR 26,212.42 million, respectively.
Figure 2.
Distribution of DDP in nine states of India: (a) Assam; (b) Bihar; (c) Jharkhand; (d) Odisha; (e) Rajasthan.
Figure 2.
Distribution of DDP in nine states of India: (a) Assam; (b) Bihar; (c) Jharkhand; (d) Odisha; (e) Rajasthan.
The intra-state variation in the contribution of DDP shows that the highest DDP is recorded in the state of Jaipur in Rajasthan (more than INR 300,000 million), followed by the states of Alwar and Jodhpur in Rajasthan. Sundargarh district is the highest contributor in Odisha (more than INR 100,000 million). Lakhisarai district of Bihar has the highest DDP (more than INR 82,000 million). The lowest DDP figures are recorded for the states of Khagaria, Nalanda, Bhojpur, Sheohar and Begusarai of Bihar (less than INR 4000 million).
5.4. Correlating the Indicators
In the next stage, CBR, IMR, MMR and DDP were correlated with the percentage of households with access to electricity, the average radiance obtained from the VIIRS image and the average stable lights. Due to the availability of DDP data for the five states of Assam, Bihar, Jharkhand, Odisha and Rajasthan, the correlations were carried out in those areas only. The results from the correlations are shown in
Table 4.
Table 4.
Results of correlations between health metrics and rate of electrification, average stable lights and average radiance. VIIRS, Visible Infrared Imaging Radiometer Suite.
Table 4.
Results of correlations between health metrics and rate of electrification, average stable lights and average radiance. VIIRS, Visible Infrared Imaging Radiometer Suite.
| Percentage of Households with Electricity | Total Population | Average Radiance VIIRS | Average Stable Light | DDP |
|---|
| CBR 2011–2012 | −0.412 ** | 0.204 * | −0.249 ** | −0.390 ** | −0.220 ** |
| IMR 2011–2012 | −0.084 | −0.137 | −0.180 * | −0.317 ** | −0.019 |
| Maternal mortality rate 2011–2012 | −0.322 ** | −0.04 | 0.157 | −0.287 ** | −0.265 ** |
| DDP | 0.547 ** | 0.428 ** | 0.152 | 0.454 ** | 1 |
Figure 3.
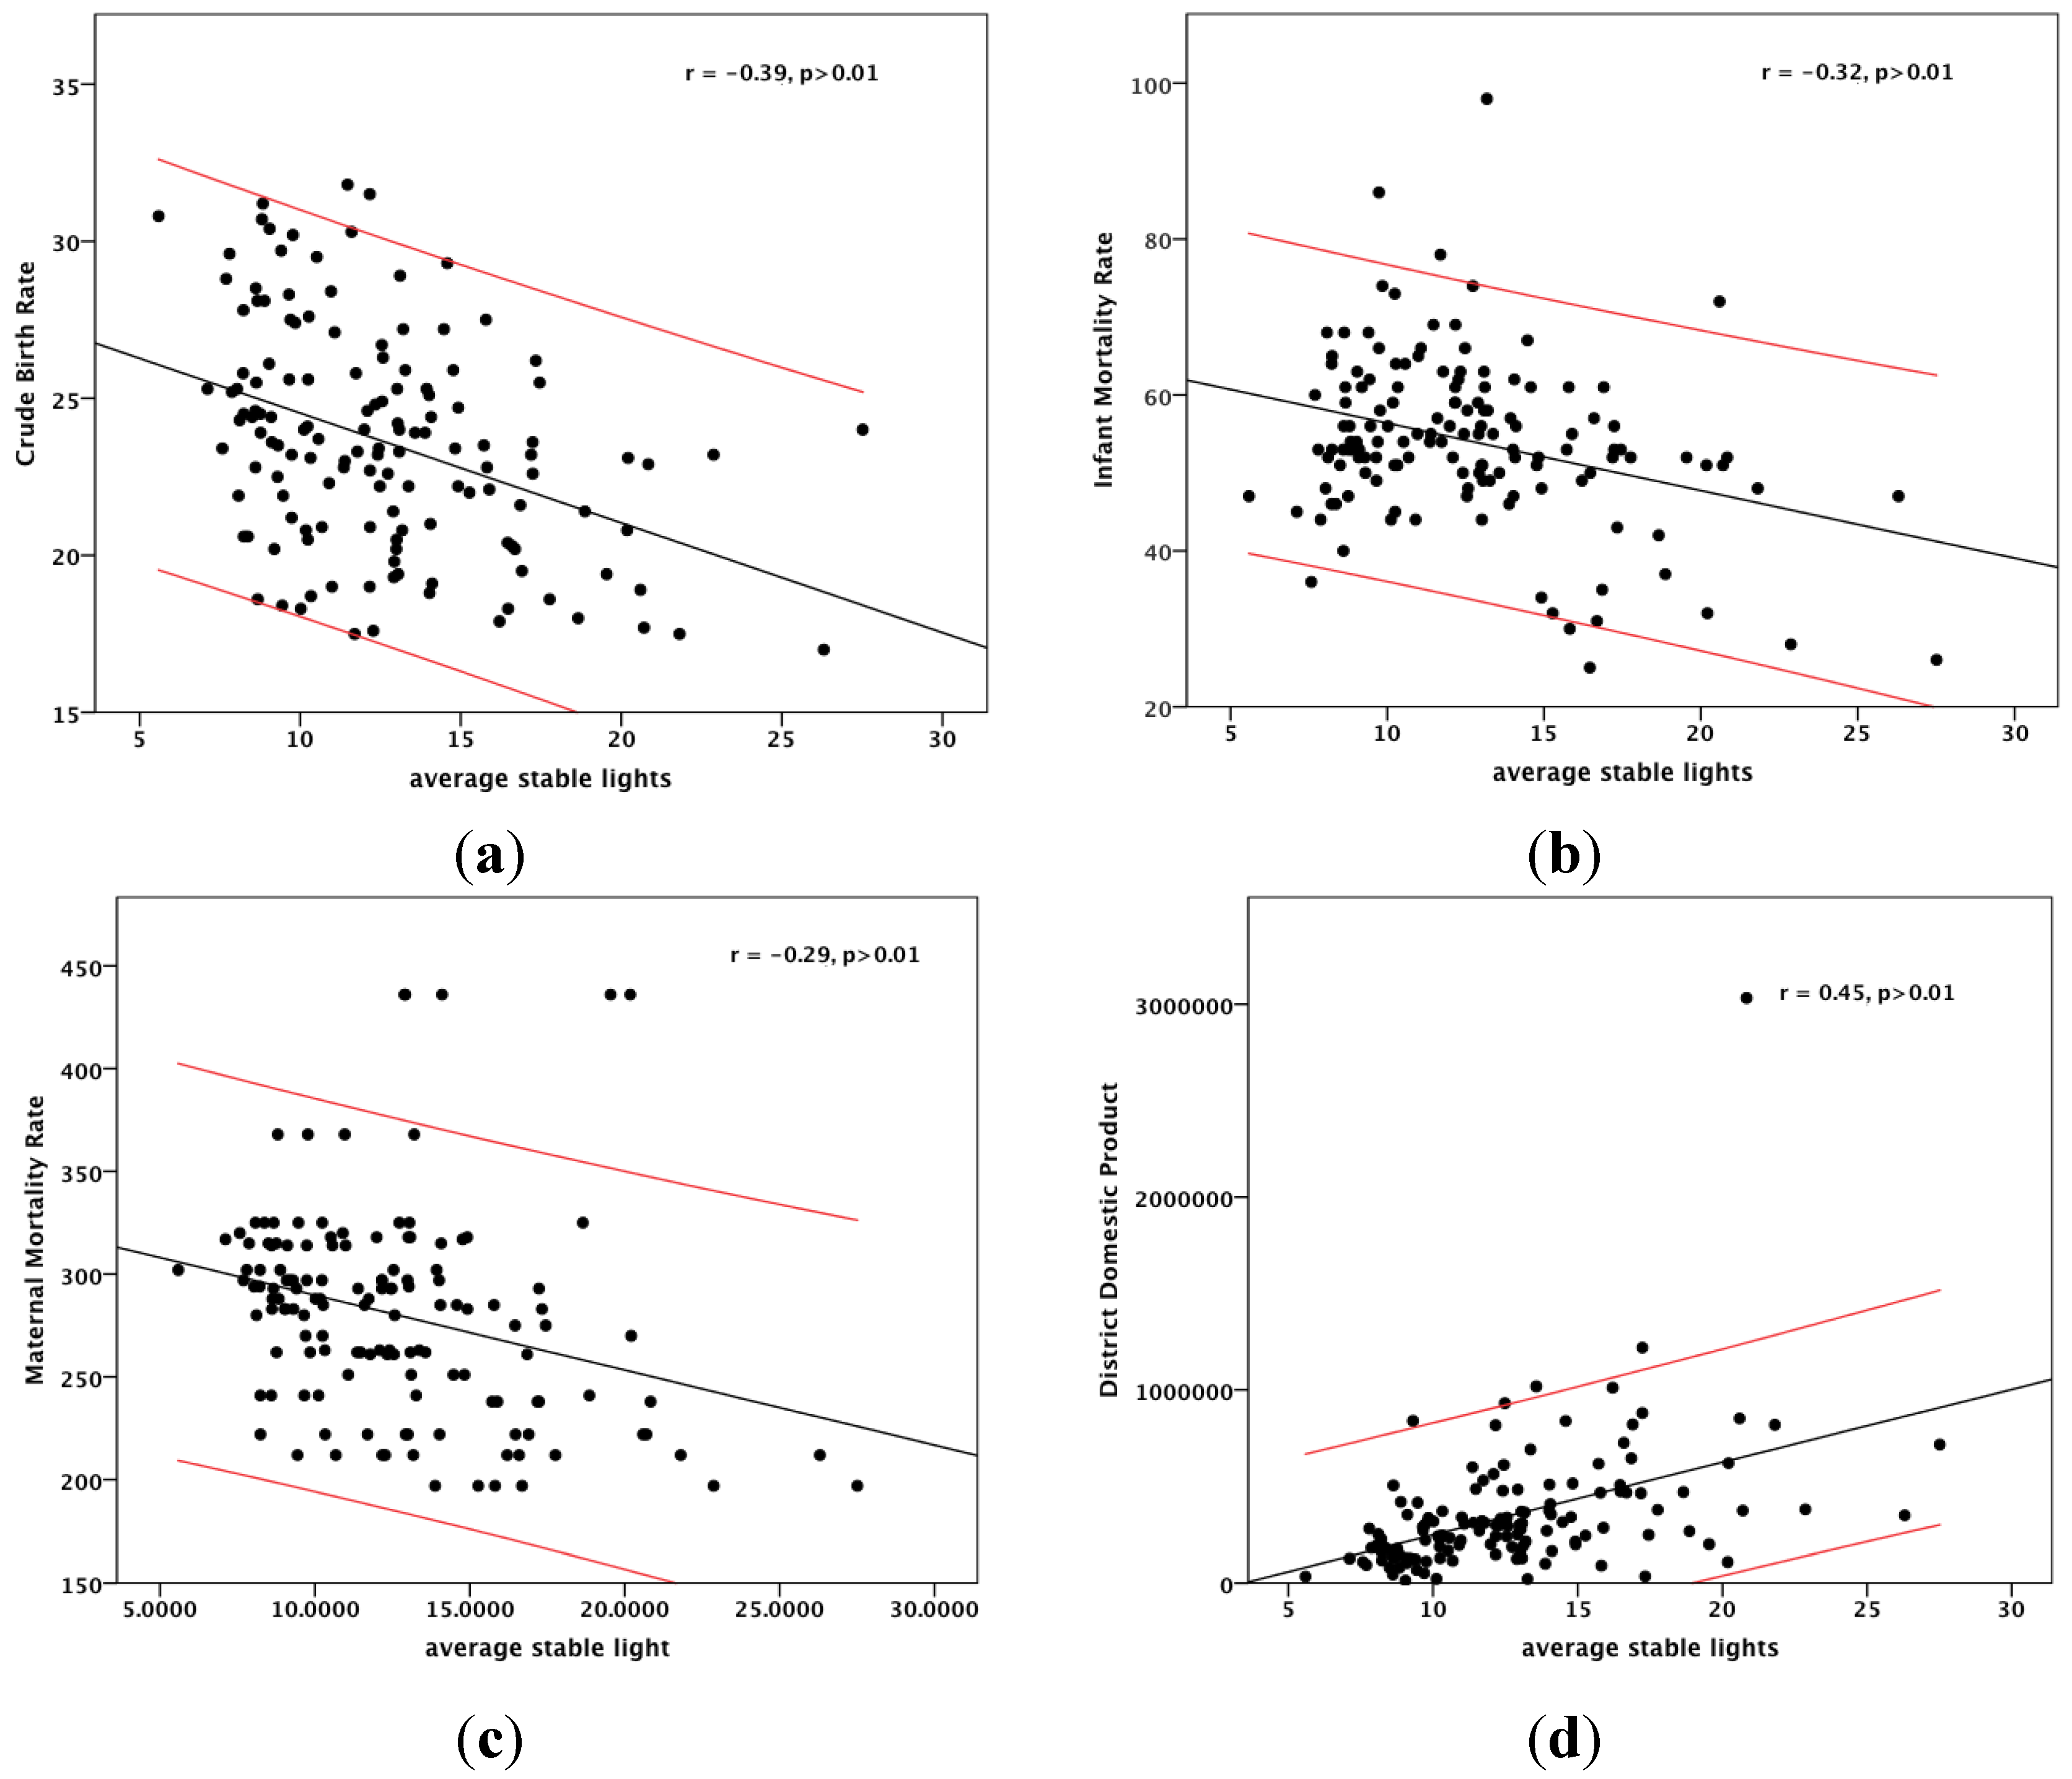
Correlations between health indicators and average stable lights, average radiance and DDP: (a) CBR; (b) IMR; (c) MMR; (d) DDP.
Figure 3.
Correlations between health indicators and average stable lights, average radiance and DDP: (a) CBR; (b) IMR; (c) MMR; (d) DDP.
The percentage of households with electricity and DDP has a significant correlation with CBR and MMR. There are negative correlations with both these variables. This suggests that with an increase in the percentage of electrification and DDP, there is a fall in the CBR and MMR of these areas. The correlations are significant at the 99% confidence level. IMR however, does not show any significant correlation with these indicators.
Correlations were also examined with the mean stable lights and radiance obtained from the VIIRS images of 2010 and 2011, respectively. The nature of the correlations is shown in
Figure 3. Correlation coefficients ranged from ±0.2 to ±0.6 at both the 99% and 95% confidence intervals. CBR has significant correlations with the percentage of households with electricity, average radiance (weak correlation), average stable lights and DDP (weak correlation) at the 99% confidence level. It also shows significant positive correlation with the total population at the 95% confidence interval. IMR shows significant correlation with both average stable light (
r = −0.32,
p > 0.01) and average radiance (
r = −0.18,
p > 0.05). MMR is significantly correlated with average stable lights (
r = −0.23,
p > 0.01), the percentage of households with electricity (
r = −0.32,
p > 0.01) and DDP (
r = −0.27,
p > 0.01). From
Table 3, it was observed that all of the health indicators show a significant correlation with average stable light.
It was also observed that CBR and MMR had significant correlations with the percentage of households with access to electricity, average stable lights and average radiance at the 99% confidence interval. As a result, these two health metrics were chosen for further analyses and modelling.
6. Models for Predicting Health Indicators
6.1. Models
In order to propose the models, 100 out of 142 districts were chosen using a random sample. The log to the base “e” (log normal) values were calculated for all the indicators. Multiple regression models were proposed to predict DDP, as well as health indicators for each district. DDP was proposed for the districts for which the data was not readily available.
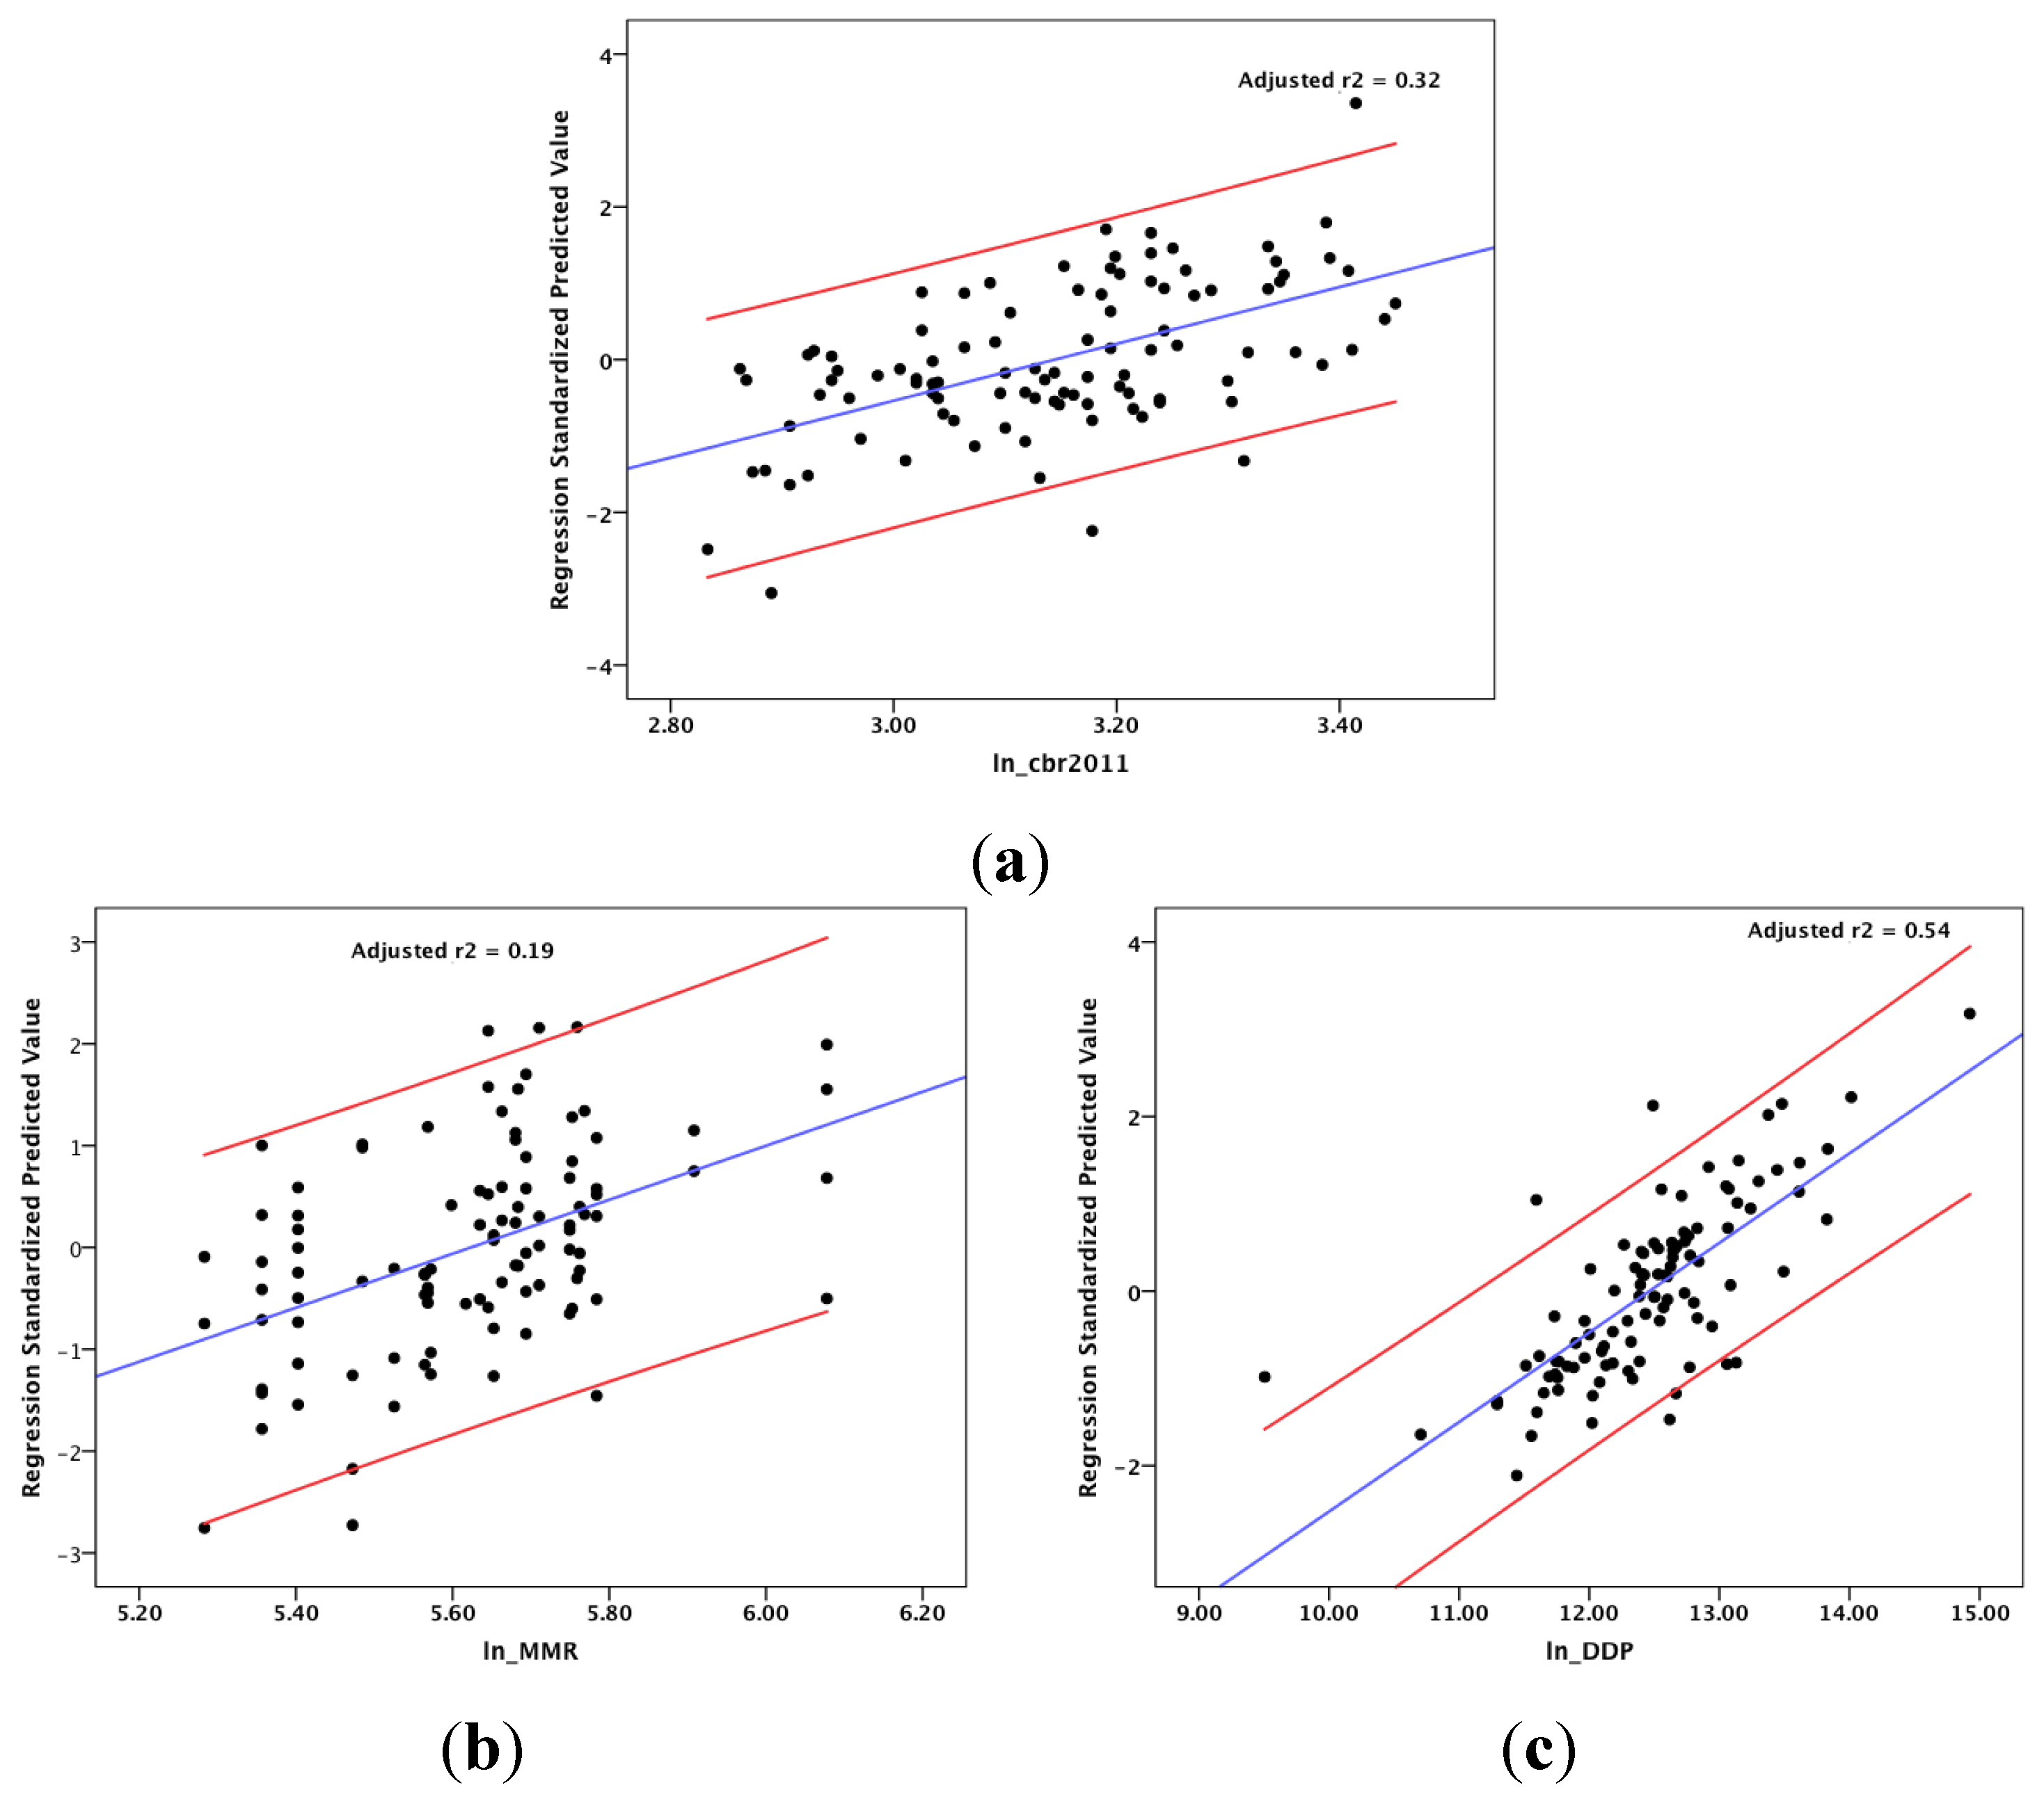
Figure 4.
Actual and predicted values of CBR, IMR and DDP: (a) CBR; (b) MMR; (c) DDP.
Figure 4.
Actual and predicted values of CBR, IMR and DDP: (a) CBR; (b) MMR; (c) DDP.
Multiple regression models were calculated in this study using the method of backward elimination. In this method, to begin with, all the independent variables were used to fit in the regression equation. The null hypothesis was tested for each of the partial correlation coefficients. When the null hypothesis was rejected, all of the independent variables were considered for the model. However, if the null hypothesis was true, the independent variable with the lowest |t| value was eliminated from the equation, and the remaining variables were considered so as to fit to the multiple regression equation. The step continued, until all the partial regression coefficients were significant [
39].
6.1.1. Models to Propose DDP
Average stable lights, total population, percentage of households with access to electricity and average radiance from VIIRS image were used as the input variables for calculating the model to propose DDP for the districts (
Figure 4). Average radiance from VIIRS image was pooled in the model calculation. The multiple regression model has an adjusted r
2 value of 0.54.
The model proposed to calculate DDP is shown in
Table 5.
Table 5.
Model to predict DDP.
Table 5.
Model to predict DDP.
| Metrics | Model |
|---|
| Ln_DDP | 4.054 + 0.563 (ln_average stable lights) + 0.450 (ln_population) + 0.15 (percentage of households with electricity) |
6.1.2. Models to Propose Health Indicators
For predicting health indicators, multiple regression models were proposed. The method of backward elimination was also used in this case. The variables that are pooled and included in the models are shown in
Table 5.
All of the models were significant at the level of p > 0.05.
From
Table 6, it is observed that DDP and average stable lights were used as inputs in both of the models. Radiance from VIIRS image was only used as an input in the model predicting MMR. The adjusted r
2 was the highest for the model predicting CBR (0.30).
Table 6.
Variables pooled and included in the models to predict CBR and MMR.
Table 6.
Variables pooled and included in the models to predict CBR and MMR.
| Independent Variables in the Models | Variables Pooled in Stepwise Regression | Variables Included in Multiple Regression | Model r2 | Adjusted r2 (
p > 0.05) |
|---|
| Crude birth rate | Radiance from VIIRS image, percentage of households with electricity | DDP, population, average stable light | 0.32 | 0.30 |
| Maternal mortality rate | Total population, percentage of households with electricity | DDP, radiance from VIIRS image, average stable light | 0.21 | 0.19 |
The proposed models to predict the health indicators are shown in
Table 7. The states for which the AHS survey was undertaken are the least developed states of India. They have the highest population and are predominantly rural. There are no major urban centres in these states. The capital cities and towns are smaller compared to the mega cities of the country. As a result, the overall radiance and stable lights captured by nighttime images over these states are comparatively low when compared to the Mumbai and Delhi conurbations. Therefore, the model adjusted r
2 values, though significant, are low compared to other parts of the country, as observed by the authors in their previous publications [
6,
7,
18,
20]. Furthermore, the health data was calculated on a sample population from the districts. This sample data was used in the models with light information obtained for the whole area of districts. This was probably another reason for the low adjusted r
2 of the models.
Table 7.
Models to predict CBR and MMR.
Table 7.
Models to predict CBR and MMR.
| Health Metrics | Models |
|---|
| Ln.(CBR) | 3.078 − 0.019(Ln. average stable lights) + 0.098(Ln. population) − 0.08(Ln. DDP) |
| Ln. (MMR) | 6.937 + 0.106(Ln. average radiance from VIIRS image) − 0.266(Ln. average stable lights) − 0.064(Ln. DDP) |
6.2. Model Validation
The proposed models were validated over the withheld 42 districts from the states of Chhattisgarh, Uttar Pradesh, Madhya Pradesh and Uttarakhand.
The actual and predicted values of CBR and MMR are shown in
Figure 4. Most of the districts have predicted CBR within the 95% confidence band. For MMR, there are a few outliers. Furthermore, in the case of MMR, some of the districts displayed had different predicted values for the same actual values. For example the districts of Hazaribagh and Lakhisarai had an actual MMR of 368.00, while their predicted MMRs were 269.79 and 291.47, respectively. A similar case was also found for the districts of Nabarangapur, Godda and Jalore. All of these districts have AHS recorded MMR of 297.00, while the predicted MMRs were 284.89, 288.31 and 299.03, respectively.
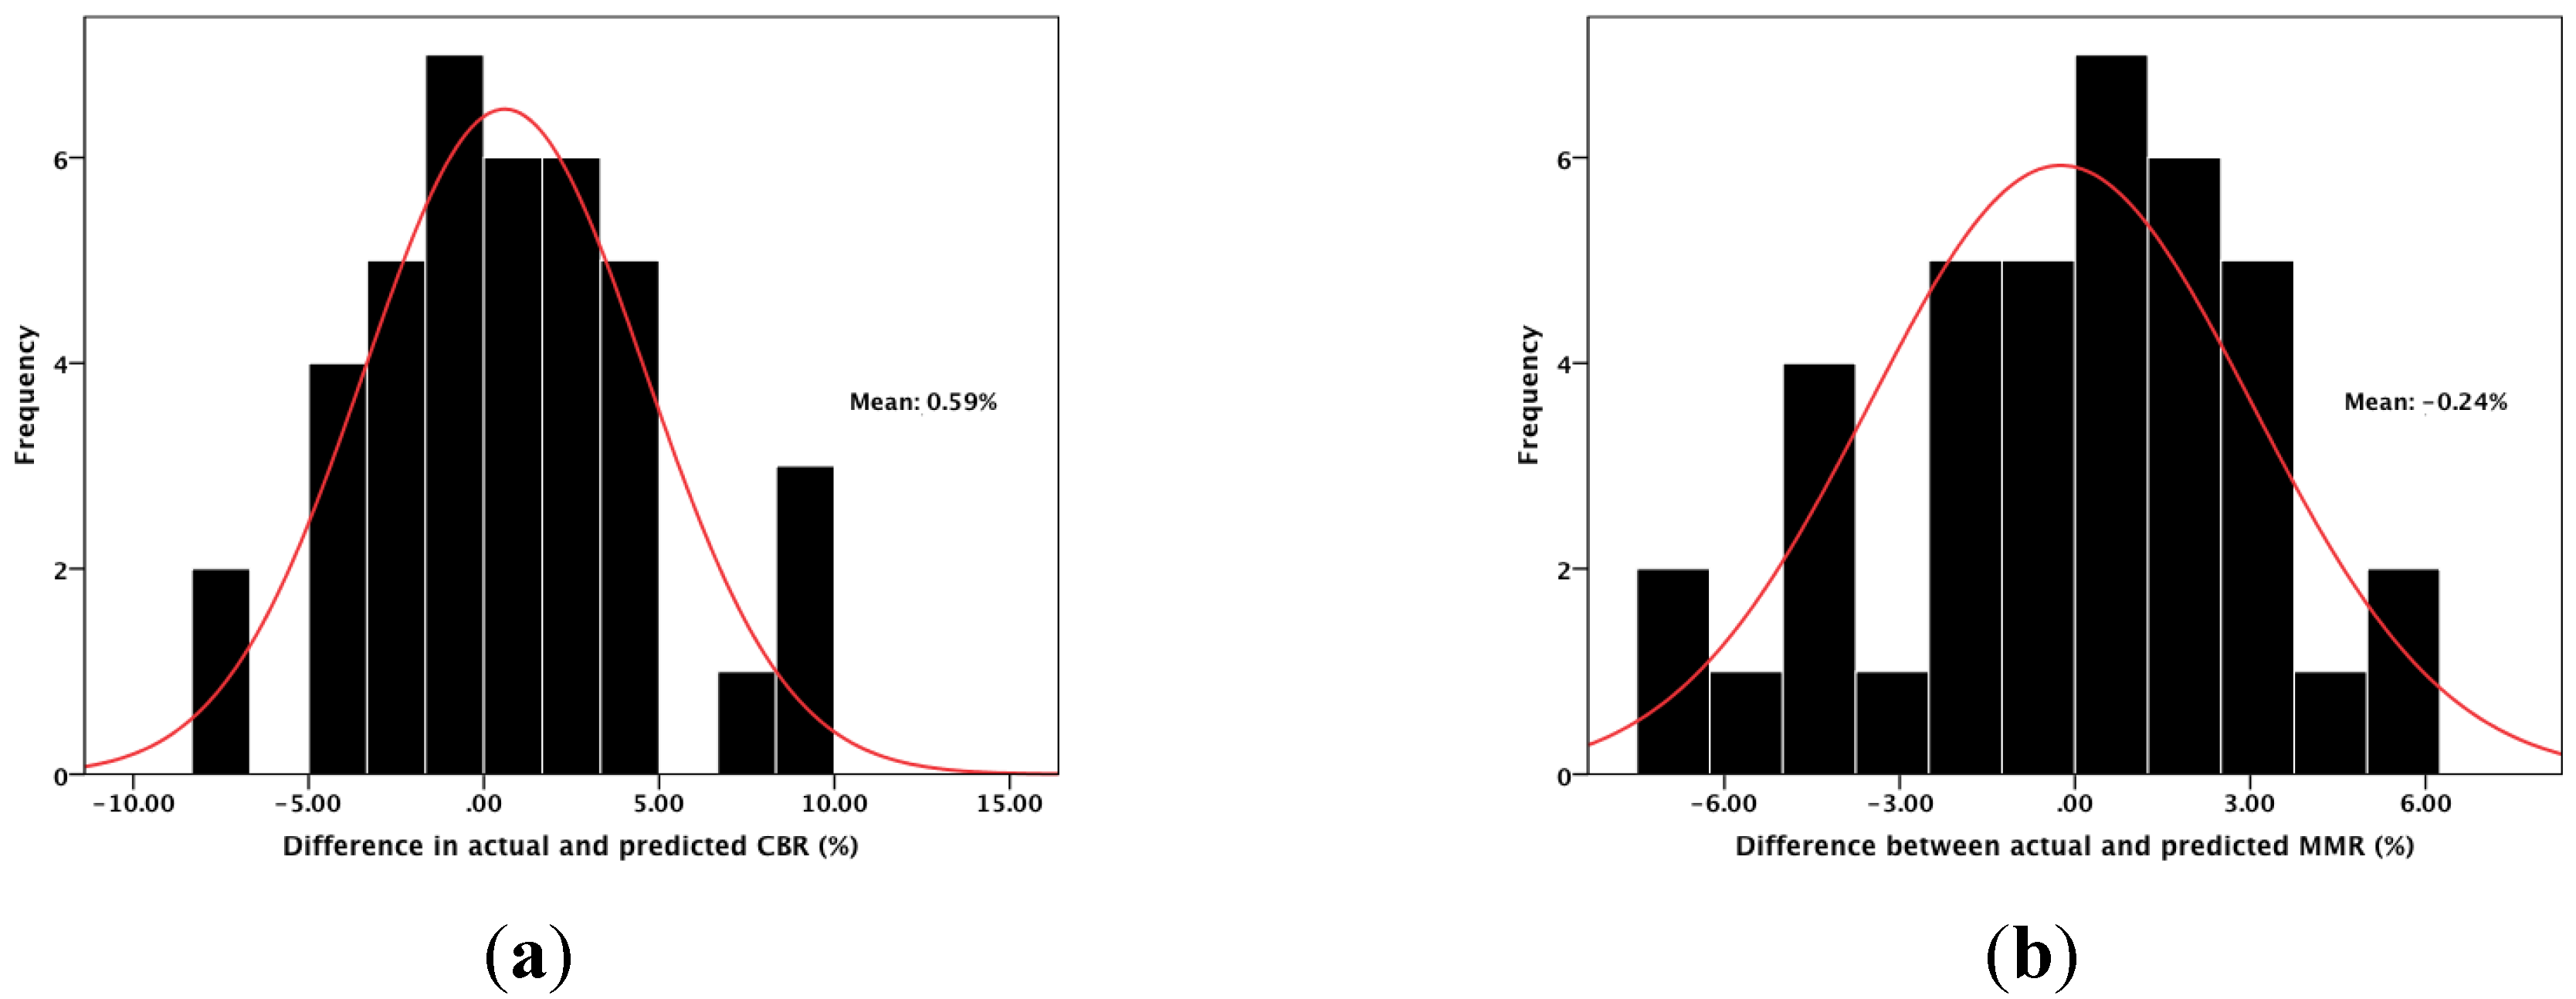
The results of model validation are shown in
Figure 5. The mean error of the prediction of CBR was 0.59%, and MMR was −0.24%. For IMR, the mean percentage of error was −1.59. The difference between the actual and predicted values was less than ±10% for both CBR and MMR.
Figure 5.
Results of model validation. (a) CBR; (b) MMR.
Figure 5.
Results of model validation. (a) CBR; (b) MMR.
7. Health Atlas of India
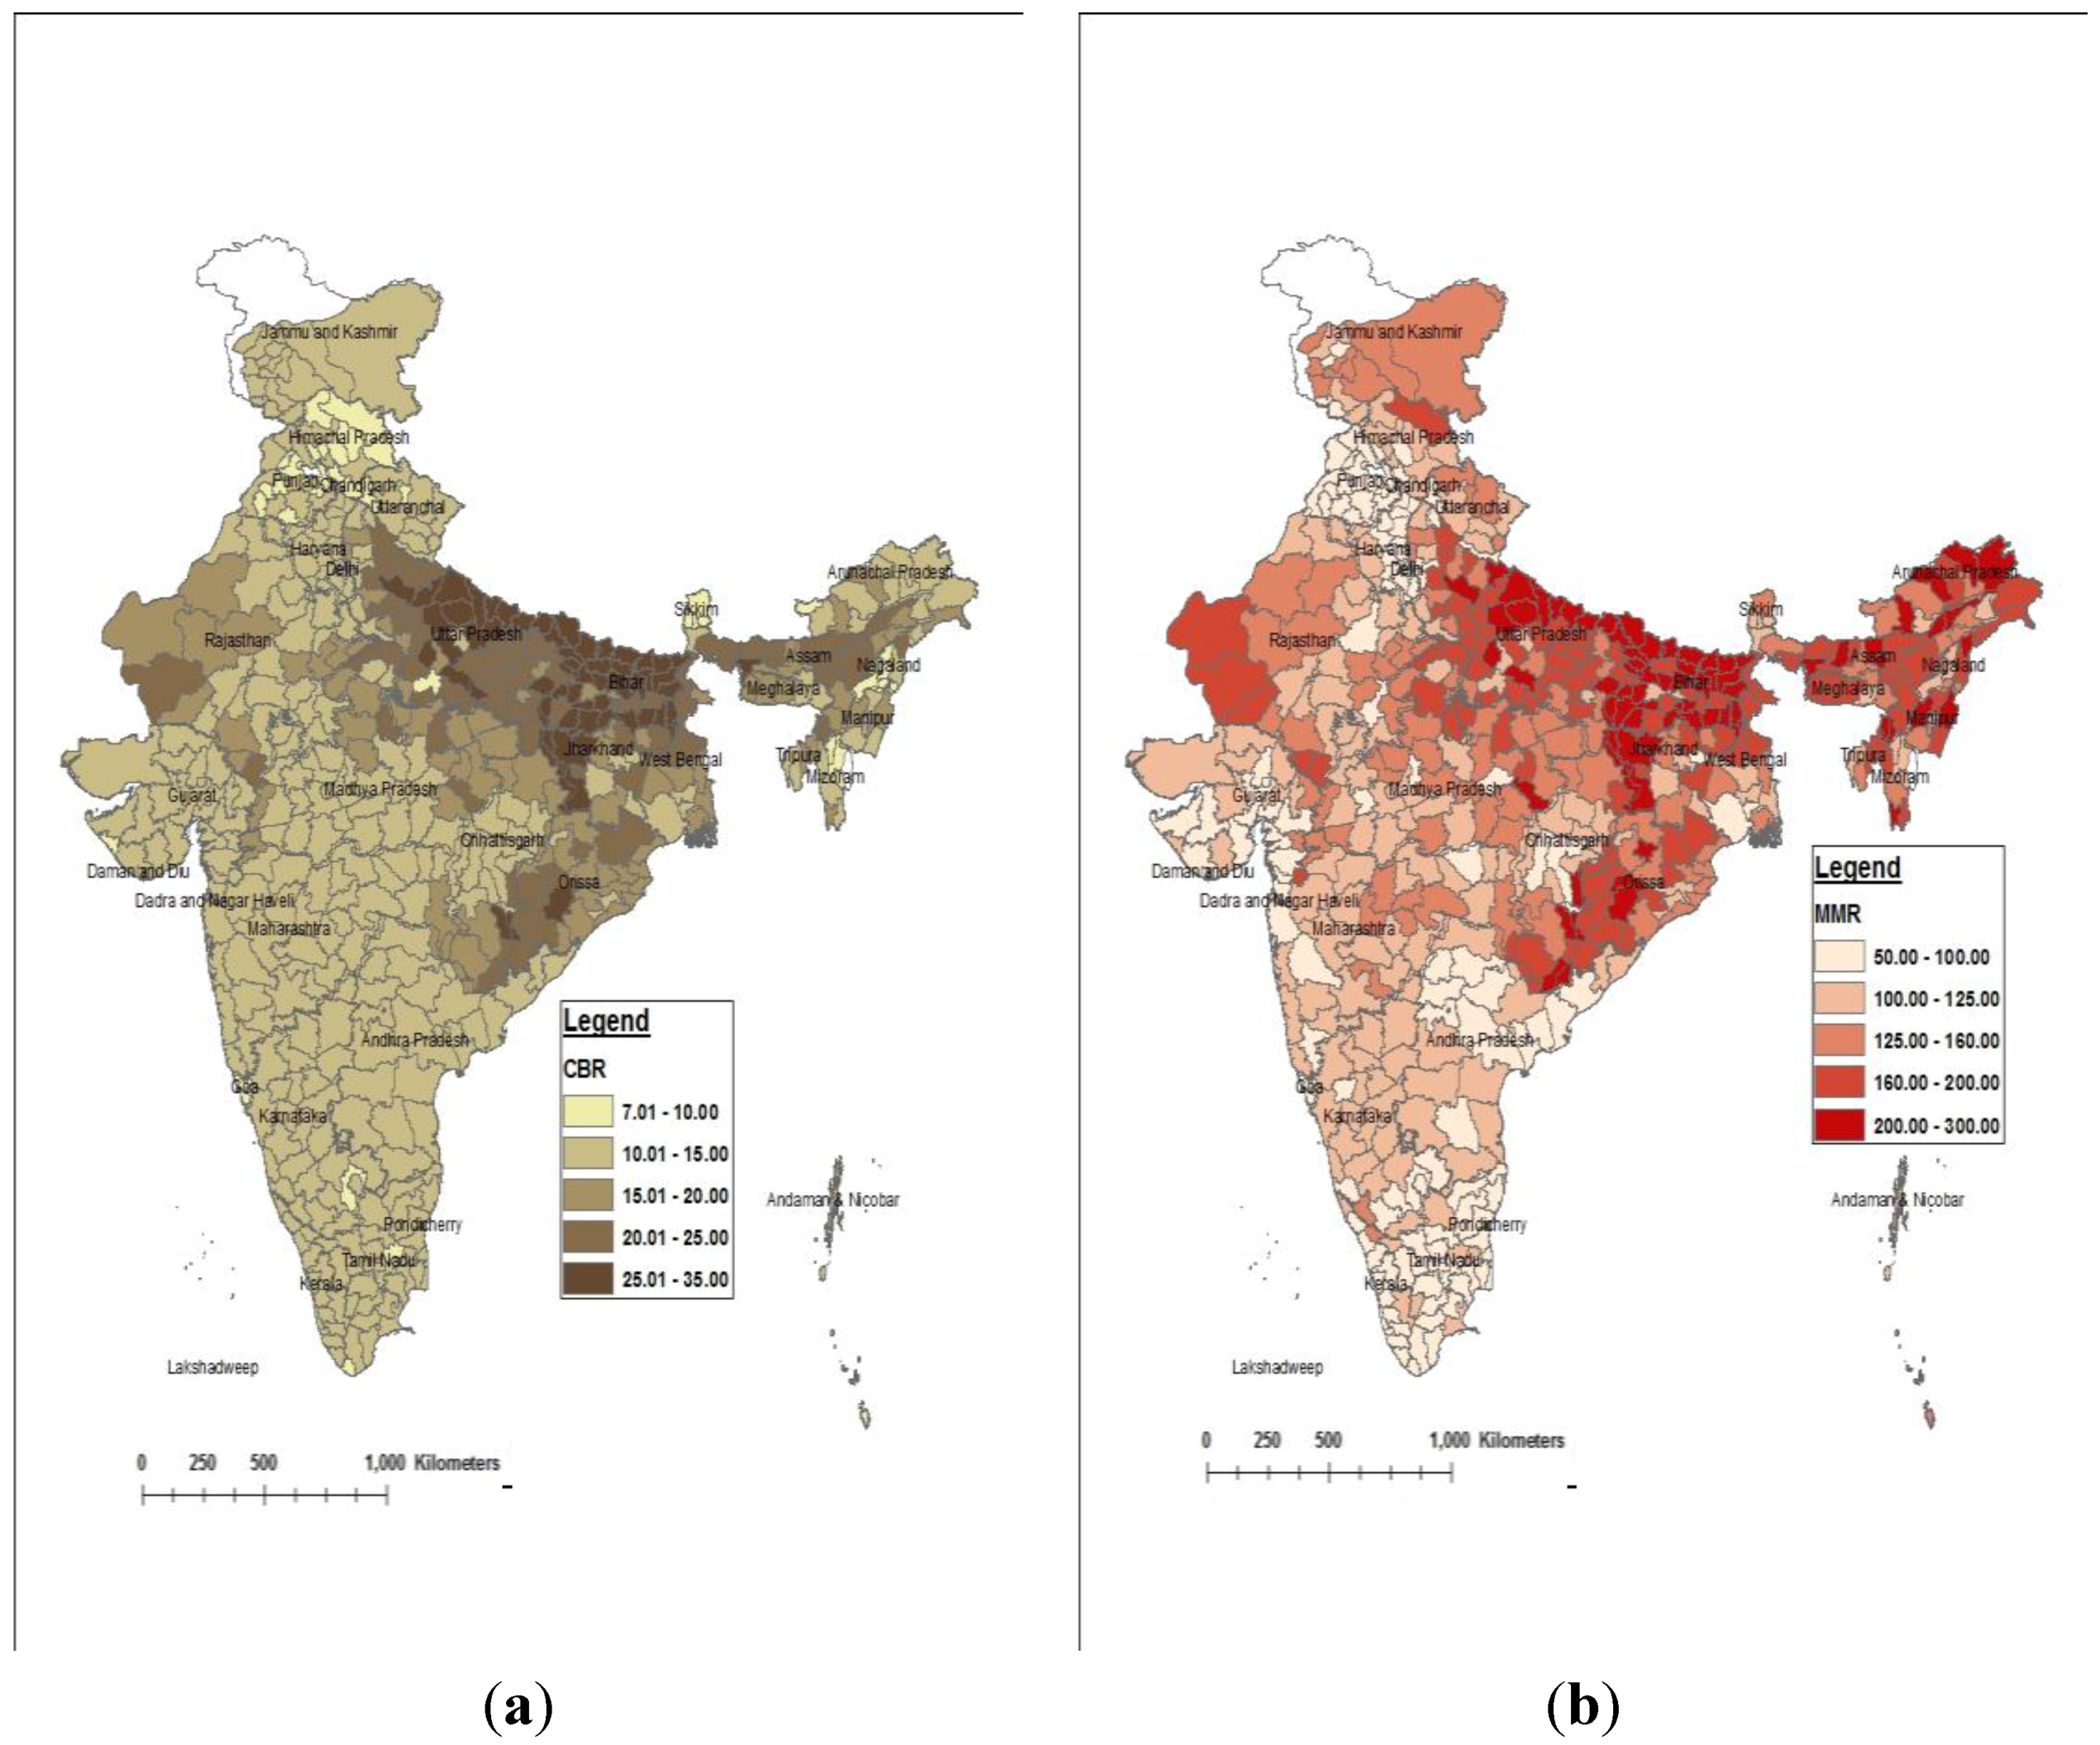
The models were used to predict CBR and MMR for all the districts of India. The maps showing the distribution of CBR and MMR are presented in
Figure 6.
The maps show the following trends in distribution of CBR and MMR:
CBRs ranging from 7.00 to 10.00 are found in patches over some districts of Himachal Pradesh, Punjab, Andhra Pradesh, Goa, Lakshadweep, Nagaland, Pondicherry, Daman and Diu and the National Capital Territory of Delhi.
The highest CBRs (more than 25) are found in the districts of Bihar, Uttar Pradesh, Jharkhand and Odisha.
MMRs less than 70 are found in the National Capital Territory of Delhi and in the districts of Andhra Pradesh, Kerala, Maharashtra and Punjab.
The highest values (more than 250) are found in Bihar, Arunachal Pradesh, Jharkhand, Orissa and Uttar Pradesh.
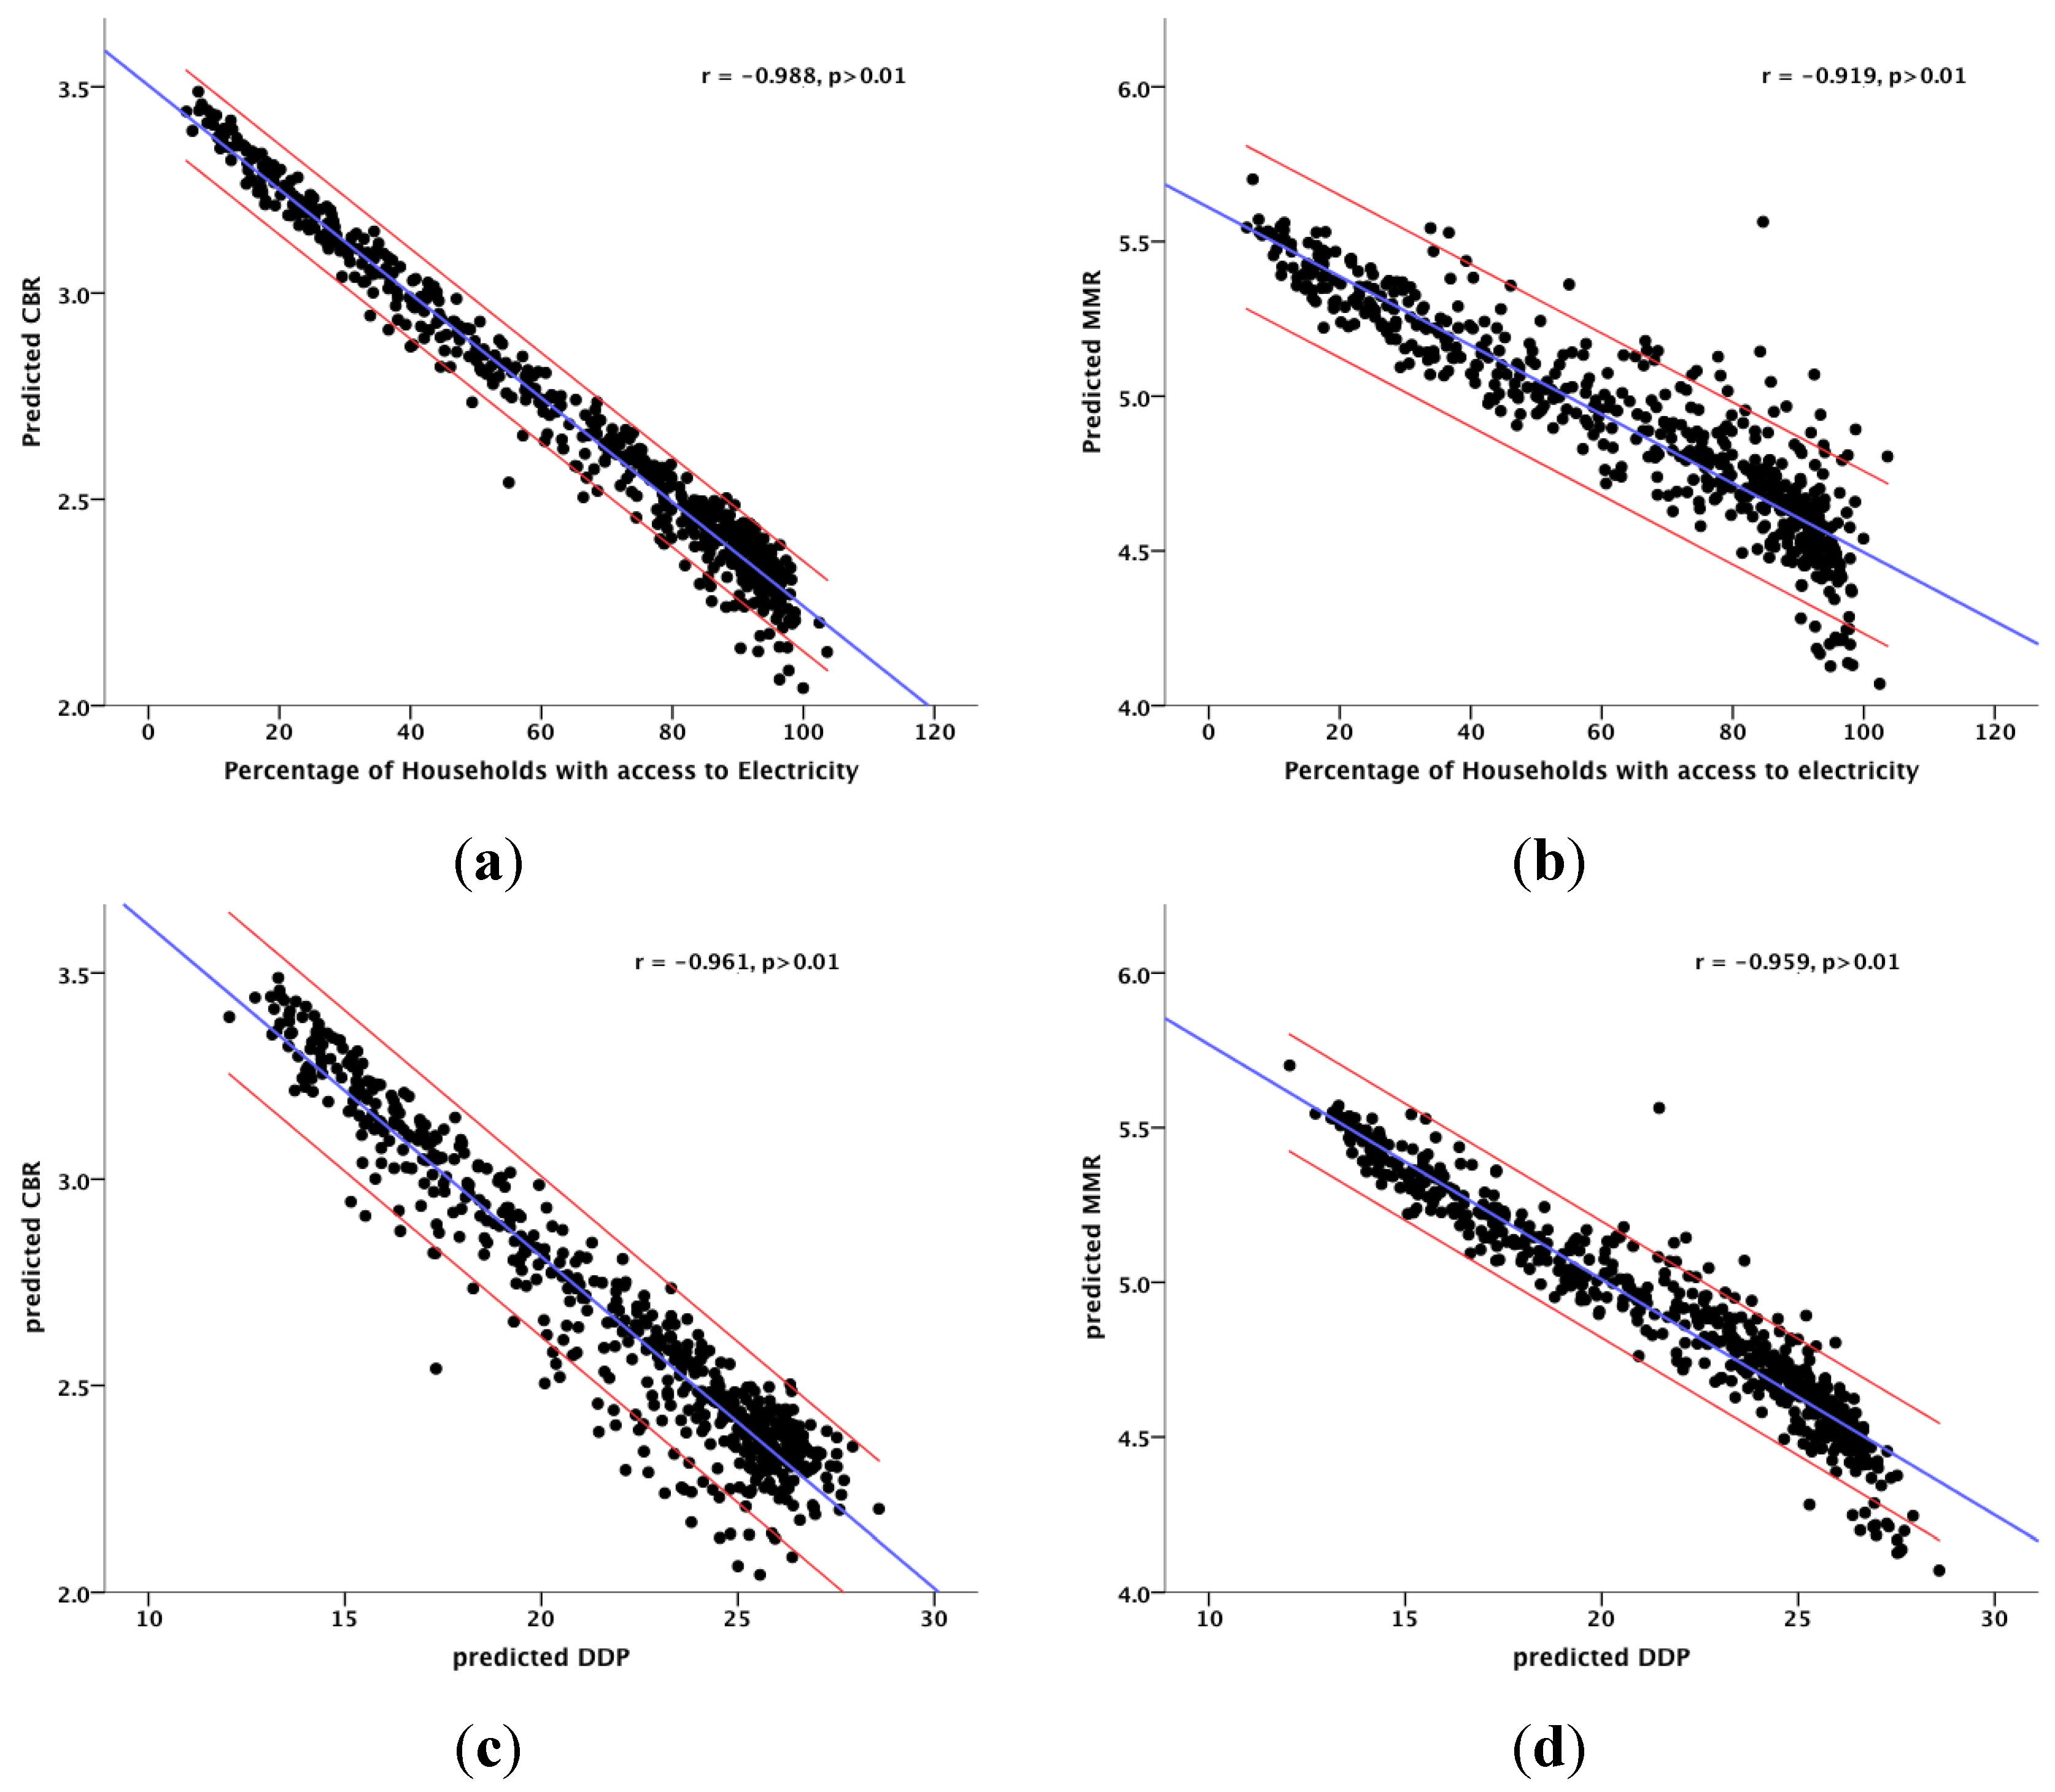
The predicted results of CBR and MMR show a strong correlation with DDP and the percentage of households with access to electricity. The correlation coefficients range from −0.92 to −0.99 at a significance level of 0.01. The correlations are shown in
Figure 7. The results show that health metrics and development indicators go hand in hand and are very strongly correlated with each other.
Figure 6.
CBR and MMR for all the districts of India. (a) Crude birth rate; (b) Maternal mortality rate.
Figure 6.
CBR and MMR for all the districts of India. (a) Crude birth rate; (b) Maternal mortality rate.
Figure 7.
Correlations between health metrics (CBR and MMR) and development indicators (rate of electrification and DDP) for India. (a) CBR and electricity; (b) MMR and electricity; (c) CBR and DDP; (d) MMR and DDP.
Figure 7.
Correlations between health metrics (CBR and MMR) and development indicators (rate of electrification and DDP) for India. (a) CBR and electricity; (b) MMR and electricity; (c) CBR and DDP; (d) MMR and DDP.
8. Conclusions
The paper demonstrates that better health is correlated with the overall development of an area. The study is based on the health metrics available from the second round of the Annual Health Survey Report of India, 2011–2012, and census data, 2011. Due to logistical constraints, health data in India was surveyed for only nine states. However, the importance of the availability of disaggregated health data cannot be overlooked. The paper used remote sensing techniques to model the health indicators at the sub-national level. The models were proposed using information from two nighttime images. In addition to the variations amongst states, district level differences in the health metrics within the states were also highlighted in the paper. Models were proposed using the information from satellite images and census metrics as predictor variables. The chosen health indicators were mapped to show the spatial variations over the country as a whole. Correlations between health indicators and development were examined for all of the states. The results show:
A very strong correlation between health and development exists, with more developed areas, such as the National Capital Territory of Delhi, urban areas and states, such as Kerala, having better health metrics than the other areas.
Nighttime images captured by both the DMSP-OLS and VIIRS sensors are useful for mapping health indicators at the sub-national level.
The method proposed in this paper is useful for predicting the metrics at a smaller spatial scale, such as taluks and villages, as well. These disaggregated predicted data will be invaluable for micro-level health planning and formulating rural development policies. Moreover, the health metrics can be mapped more frequently than those available from the census, which is carried out every 10 years. The metrics can be predicted and mapped as often as the satellite data is available. This is also useful in recording the trend of change in the health indicators. For a country like India, where manual data collection is a cumbersome, time-consuming and expensive process, the method proposed in this study has the potential to be of immense use.


