A Conceptual List of Indicators for Urban Planning and Management Based on Earth Observation

 , ,
, ,
Abstract
:1. Introduction
2. Study Areas and EO Datasets
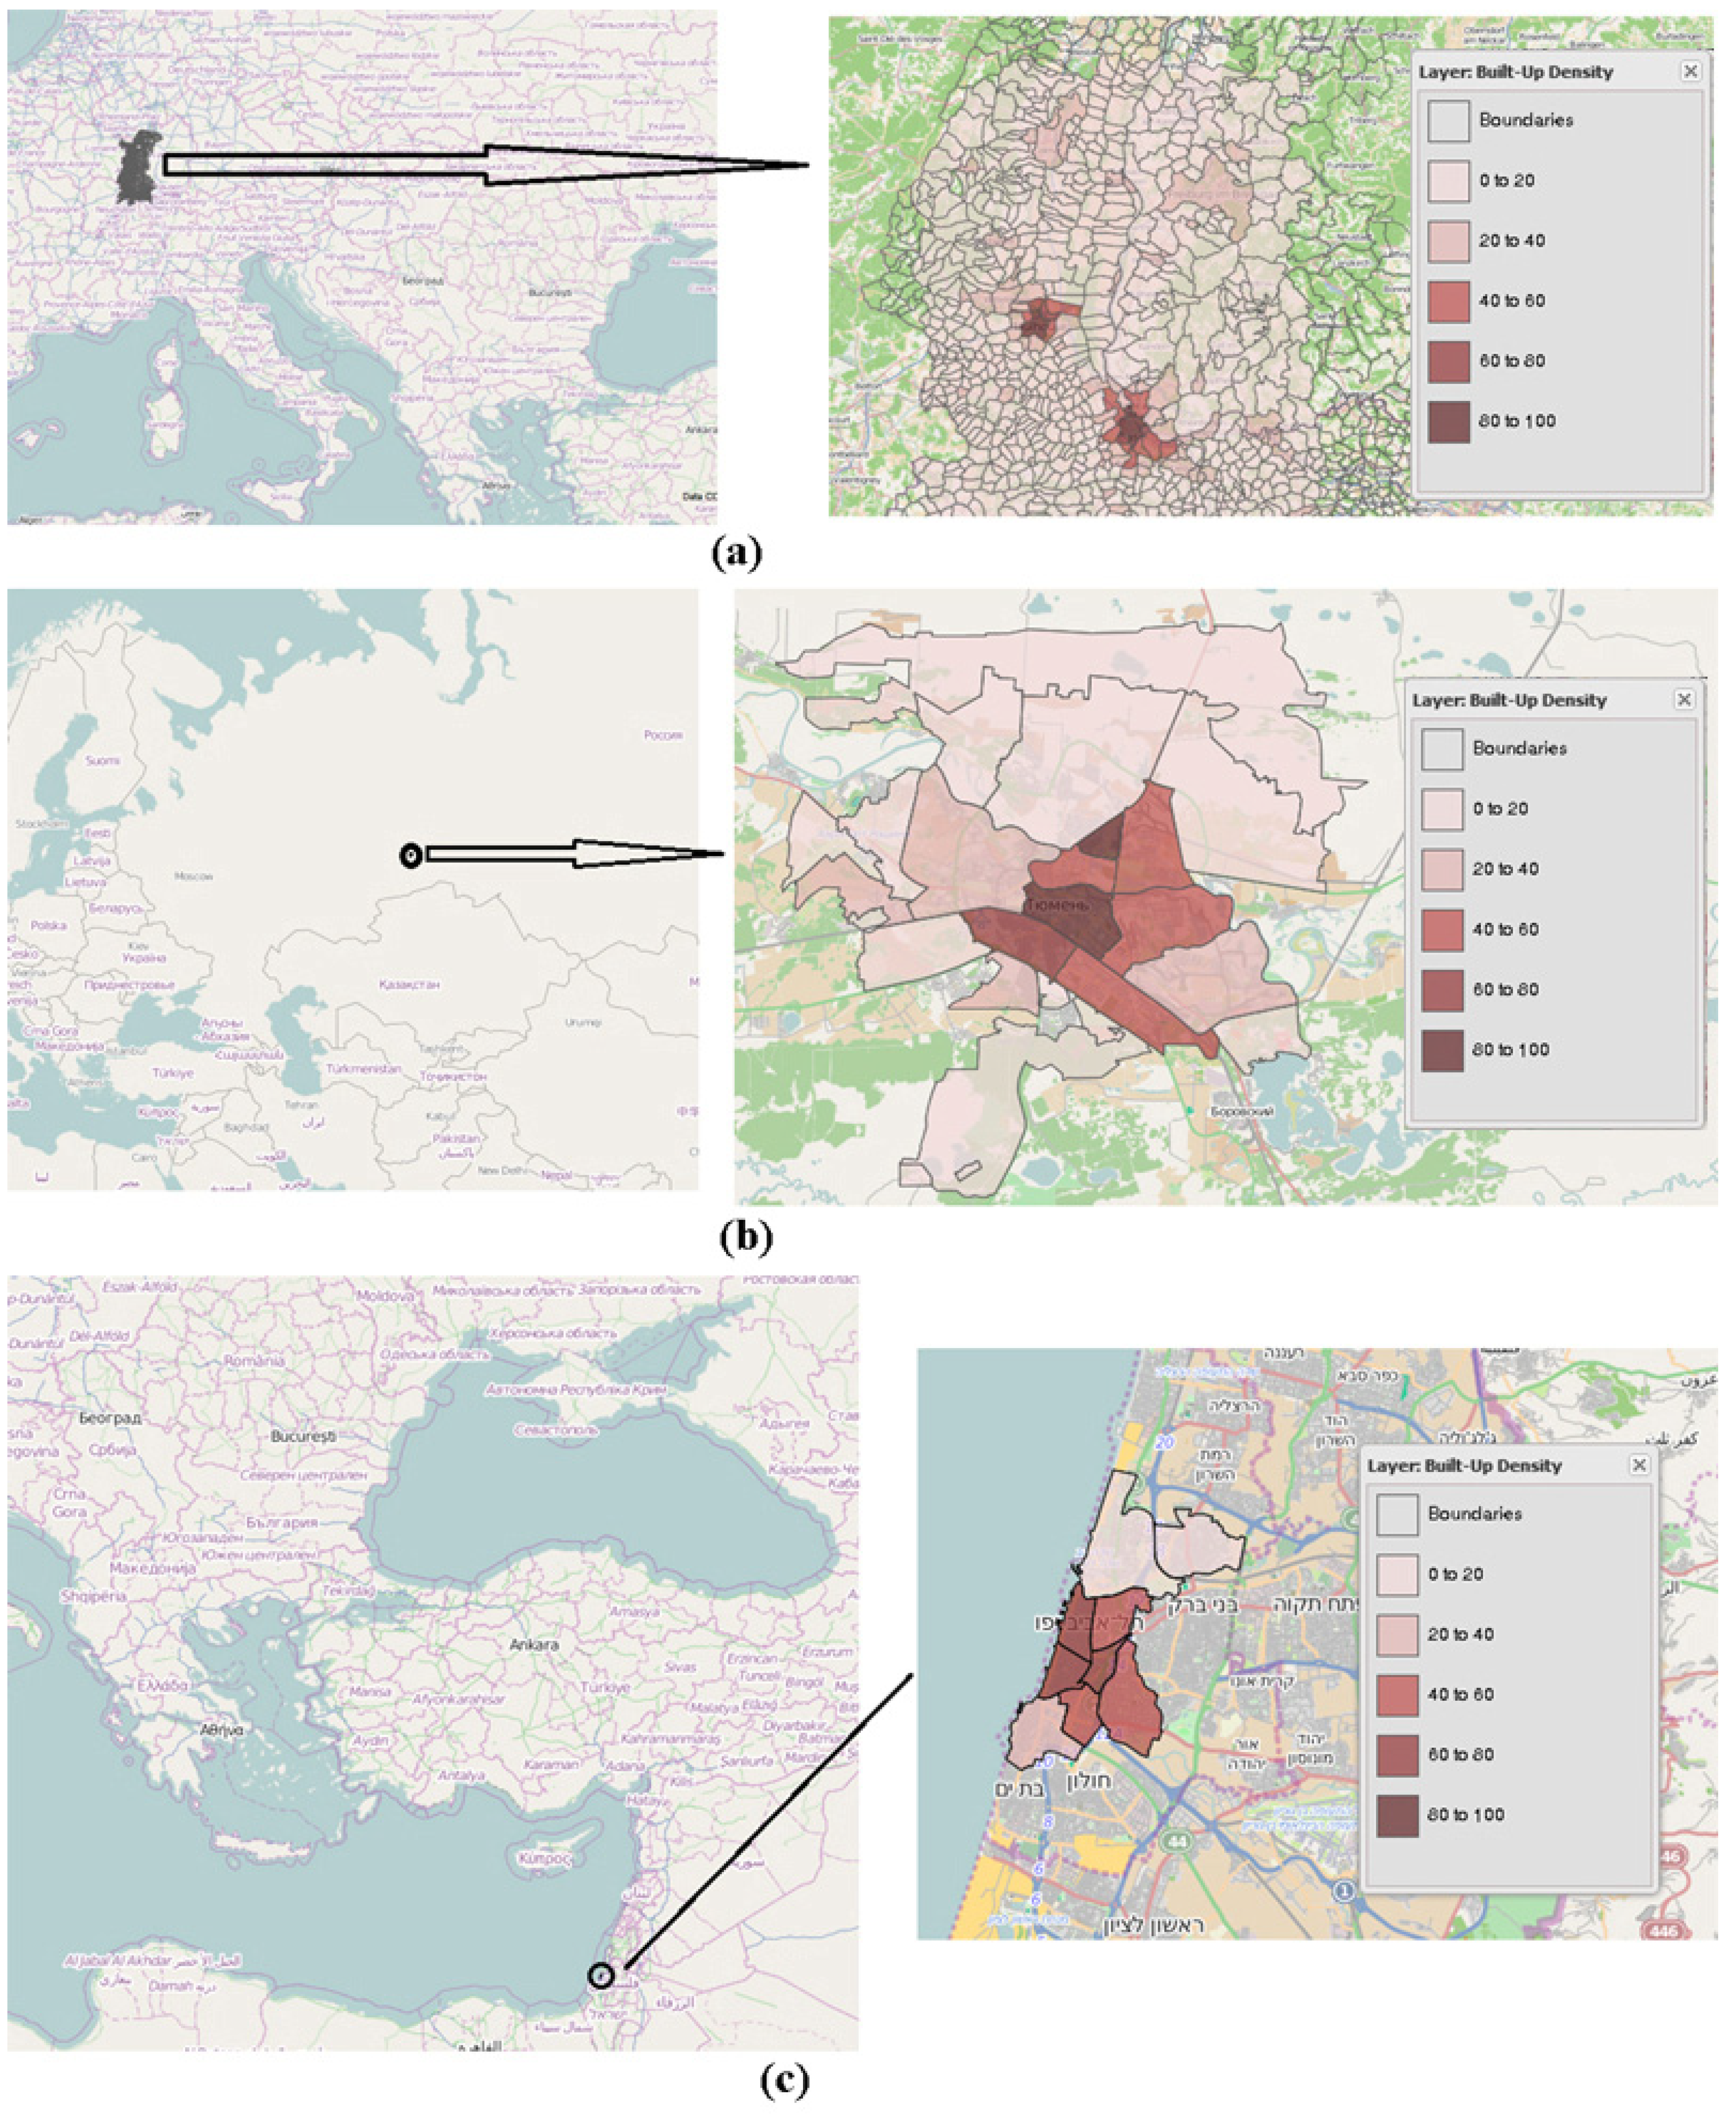
2.1. Tyumen, Russia
2.2. Tel Aviv, Israel
2.3. Basel, Switzerland
2.4. EO Datasets and Processing
- Tyumen: Landsat-5 TM; Landsat-7 ETM+; TerraSAR-X, ASTER, ALOS;
- Tel Aviv: Landsat-5 TM; Landsat-7 ETM+; TerraSAR-X; ASTER, ALOS;
- Basel: Landsat-4 TM; Landsat-5 TM; Landsat-7 ETM+; Quickbird, TerraSAR-X, ASTER; ALOS, as well as airborne hyperspectral (APEX) observations.

| Sector | Topic (Processes/Mechanisms) | Action | Indicators/Parameters with Relevance to EO | EO Sensors | Spatial Resolution |
|---|---|---|---|---|---|
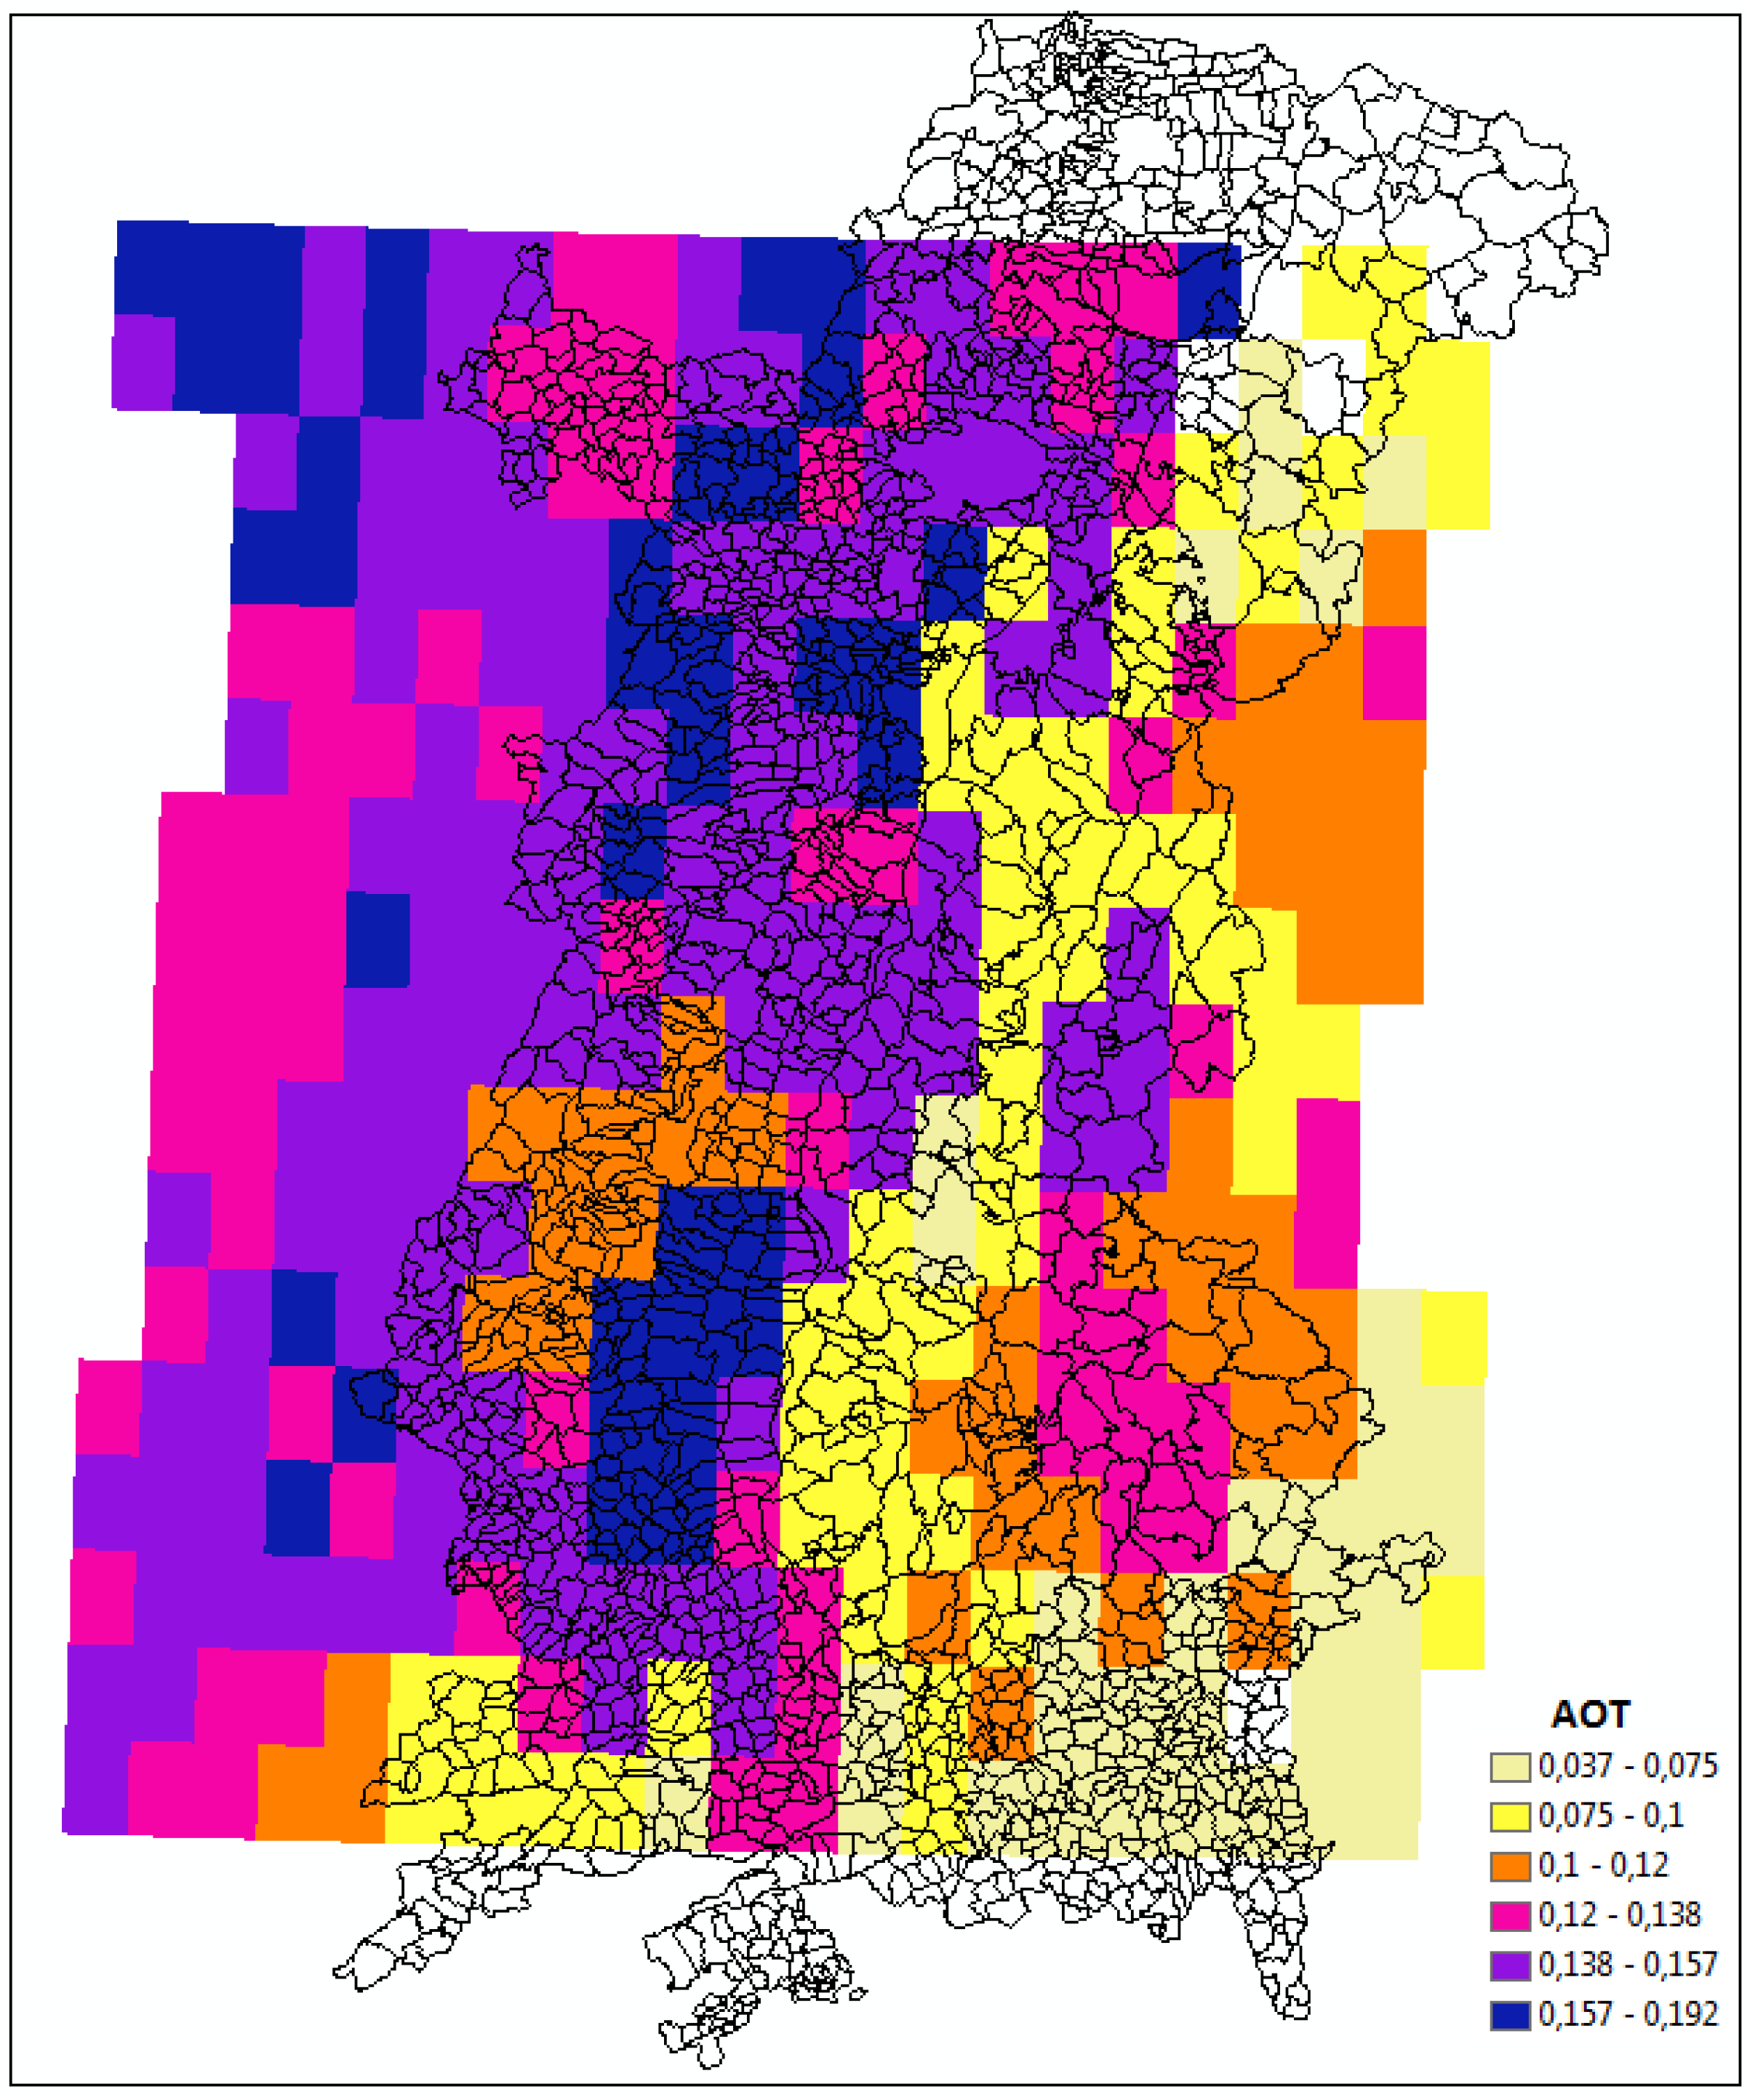
| Air pollution and public health | Emissions by industry, traffic and domestic heating (NOx, SOx, CO, O3, PM, VOC) | Reduction of emissions by technical measures, traffic regulations, toll roads, congestion charges, emission scenarios, low emission standards for vehicles, public transportation support systems, pollution monitoring, identification and care for vulnerable people | AOT, Surface topography (DTM), building structure (DSM), built-up density, population distribution as input for dispersion models and emission scenarios | MODIS ASTER Landsat WorldView | 10 km 30 m 30 m |
| Energy efficiency | Inefficient energy use as a main contributor to air pollution, UHI and thermal discomfort | Support of energy efficient systems for heating/cooling facilities, renewable energy production, building isolation, measures for CO2 reduction | Building structure DSM, albedo, emissivity | Landsat | 30 m |
| Transportation and mobility, accessibility | Conflict of interest between city authorities, policy, economy and private interests | Reduction of private traffic, support of public transportation and non-motorized traffic, toll roads, traffic restrictions by structural measures | Traffic (street and railway) network, lines of communication | ||
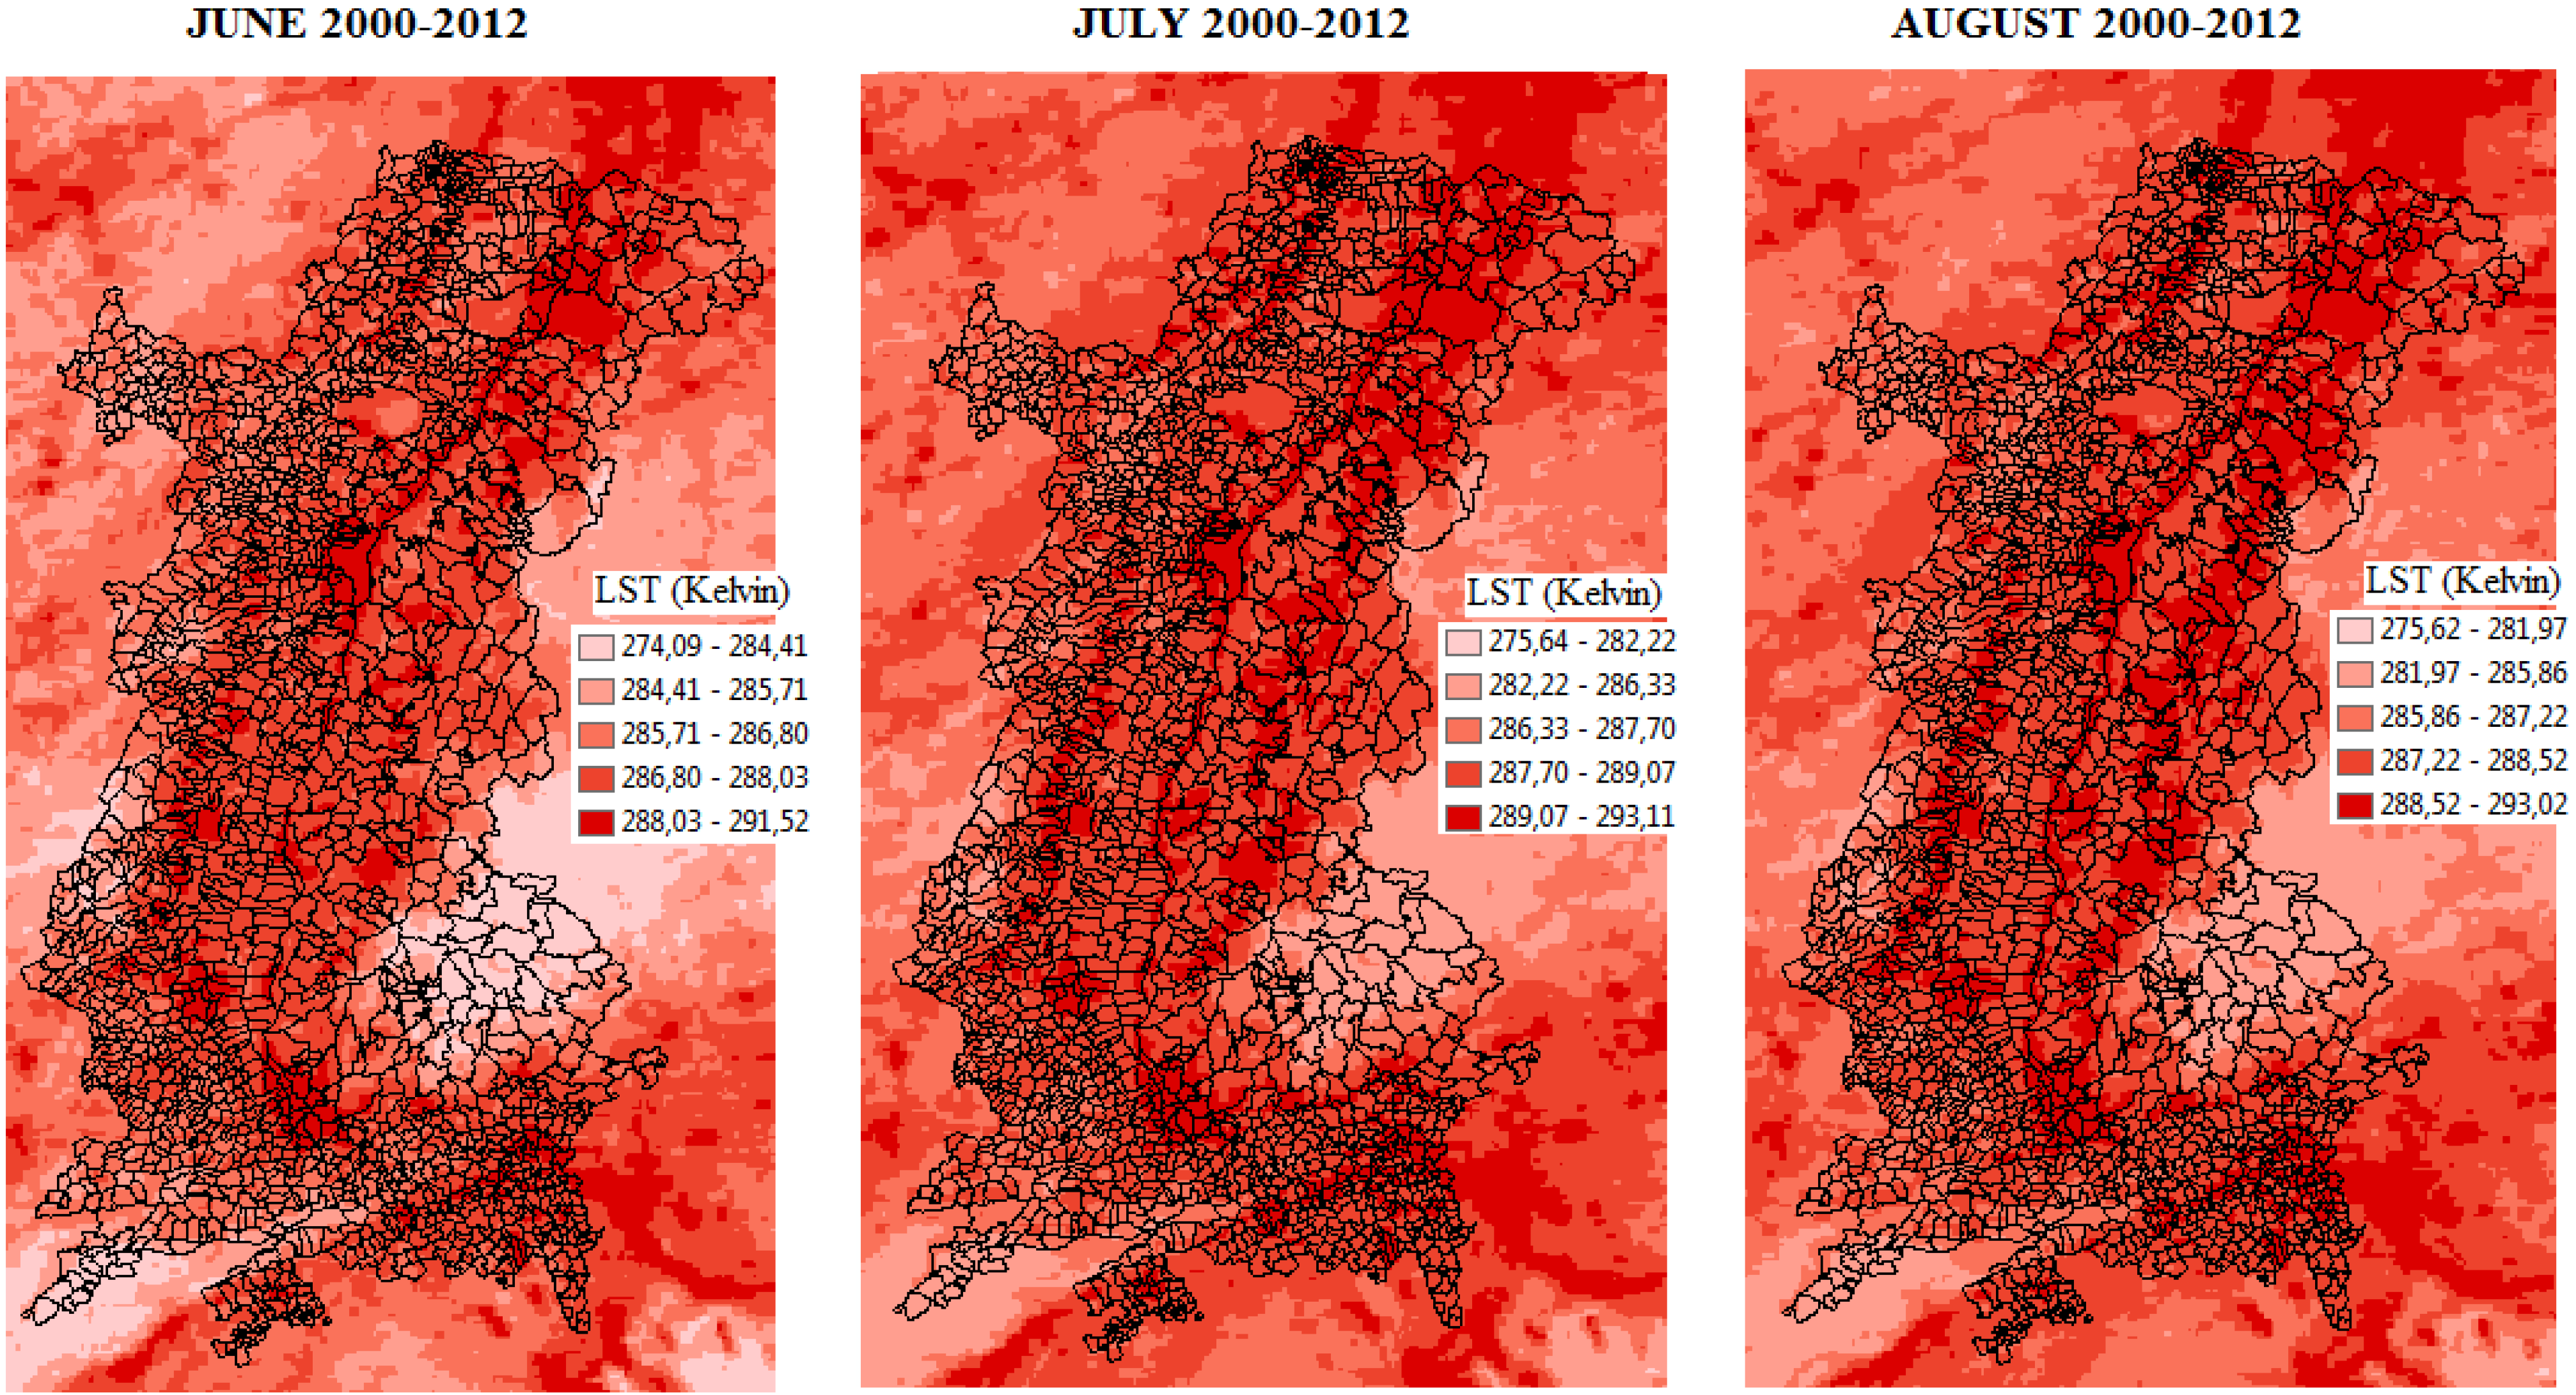
| Thermal comfort | Higher average temperatures in urban areas especially during the night compared to the rural surroundings (UHI) | Increasing the fraction of vegetated/green areas at the expense of impervious surfaces, increasing the fraction of shaded areas, reservation and clearing/creating of fresh air corridors, increasing surface albedo (“cool roofs”), sun shading of buildings and windows in order to decrease the storage of heat during daytime, planning, technical and construction measures | Surface temperatures, urban surface materials, surface albedo, surface emissivity, built up density, fractional land cover, imperviousness/surface sealing | MODIS Landsat TerraSar-X RadipEye WorldView | 10 km 30 m 1, 3, 16 m 5 m 0.46, 1.84 m |
| Urban green | Reduced green and open spaces due to urban growth, environmental degradation due to increased urbanization | Conservation of urban green (parks, trees), increase of vegetated/green areas (e.g., vegetated roofs), urban farming | Land cover, urban surface materials, vegetation indices, fractional land cover | Landsat | 30 m |
| Territorial development | Settlement development, urban sprawl, industrial land consumption, urban land use, population growth | Forceful application of legislation and existing planning instruments, evaluation of potential areas for expansion, promotion of high-density housing | built up density, land cover, land cover change | Landsat | 30 m |
| Vulnerability to environmental hazards | floods/droughts, air contamination, fires, heat waves | Reduction of risk exposure, improvement of crisis management by (near) real time monitoring, dispersion models, evacuation plans, early-warning systems, protection and accessibility of critical infrastructure, expansion/creation of flooding zones | Surface topography (DTM), built-up density (DSM), population distribution, input for dispersion models, critical infrastructure | ASTER | 30 m |
| Sector | Topic (Processes/Mechanisms) | Action | Indicators/Parameters with Relevance to EO |
|---|---|---|---|
| Marine and inland water ecosystems | Increasing water temperatures with negative influence on ecology, enhanced effect by use for cooling industrial facilities, flooding (river and coastal), droughts | Revitalization of water ecosystems, reduction of industrial heat input by technical measures, sustainable water management, reduction of waste-water amount | sea/water surface temperatures and temperature change, land cover, land cover change (floodwater, low-water) |
| Ground water (GW) | Increasing GW temperatures and decreasing GW regeneration with negative influence on GW quality and availability, changes of GW regeneration with changing precipitation patterns | Evaluation of the relevant anthropogenic and natural factors (e.g., by monitoring, modelling) and development of strategies for the solution of conflicts of interest; adaption of rules for construction and GW use | sea/water surface temperatures and temperature change, land cover, land cover change |
| Drinking water (DW) | Increasing extreme weather events and natural hazards (droughts, heat wave, heavy precipitation events causing floods and storm surge, etc.) have significant influence on the availability and the quality of DW | Technical measures (changing the location of DW abstraction), renovation and modernisation of water engineering infrastructures | Population distribution, land cover, land cover change |
| Urban climate | Urban heat island (UHI) intensity and heat waves are expected to increase in the future with high impact on urban climate | Increasing the fraction of vegetated/green areas at the expense of impervious surfaces, increasing the fraction of shaded areas, reservation and clearing/creating of fresh air Corridors, increasing surface albedo (“cool roofs”), sun shading of buildings and windows in order to decrease the storage of heat during daytime, planning, technical and construction measures | surface temperatures, urban surface materials, surface albedo, built-up density, fractional land cover, imperviousness/surface sealing |
| Air quality | Increasing temperatures will likely cause higher ground level ozone concentrations | reservation and clearing/creating of fresh air corridors, reducing emissions of primary pollutants (NOx, VOC) | Surface topography (DTM), building structure (DSM), built-up density, as input for dispersion models |
| Health | Refer to urban climate and air quality. Increased heat stress and increased air pollution will mainly affect infants and young children, seniors, physically and/or mentally sick persons and socially isolated persons | Early-warning systems for heat waves, hazardous air contamination and industrial disasters, information about arrangements and behavior recommendations, special instructions and action plans for highly affected institutions (care and residential nursing homes, hospitals, schools) and people | Refer to urban climate and air quality |
3. Methodology and Results
3.1. Routine Requirements and the Associated EO Indicators
3.1.1. Air Pollution and Public Health
Atmospheric Optical Thickness (AOT)

Surface Topography and Building Structure
Population Distribution
3.1.2. Energy Efficiency
Radiation Field
3.1.3. Transportation and Mobility, Accessibility
Traffic Network
3.1.4. Thermal Comfort
Land Surface Temperature (LST)

Surface Albedo
Built-Up Density—Imperviousness
3.1.5. Urban Green
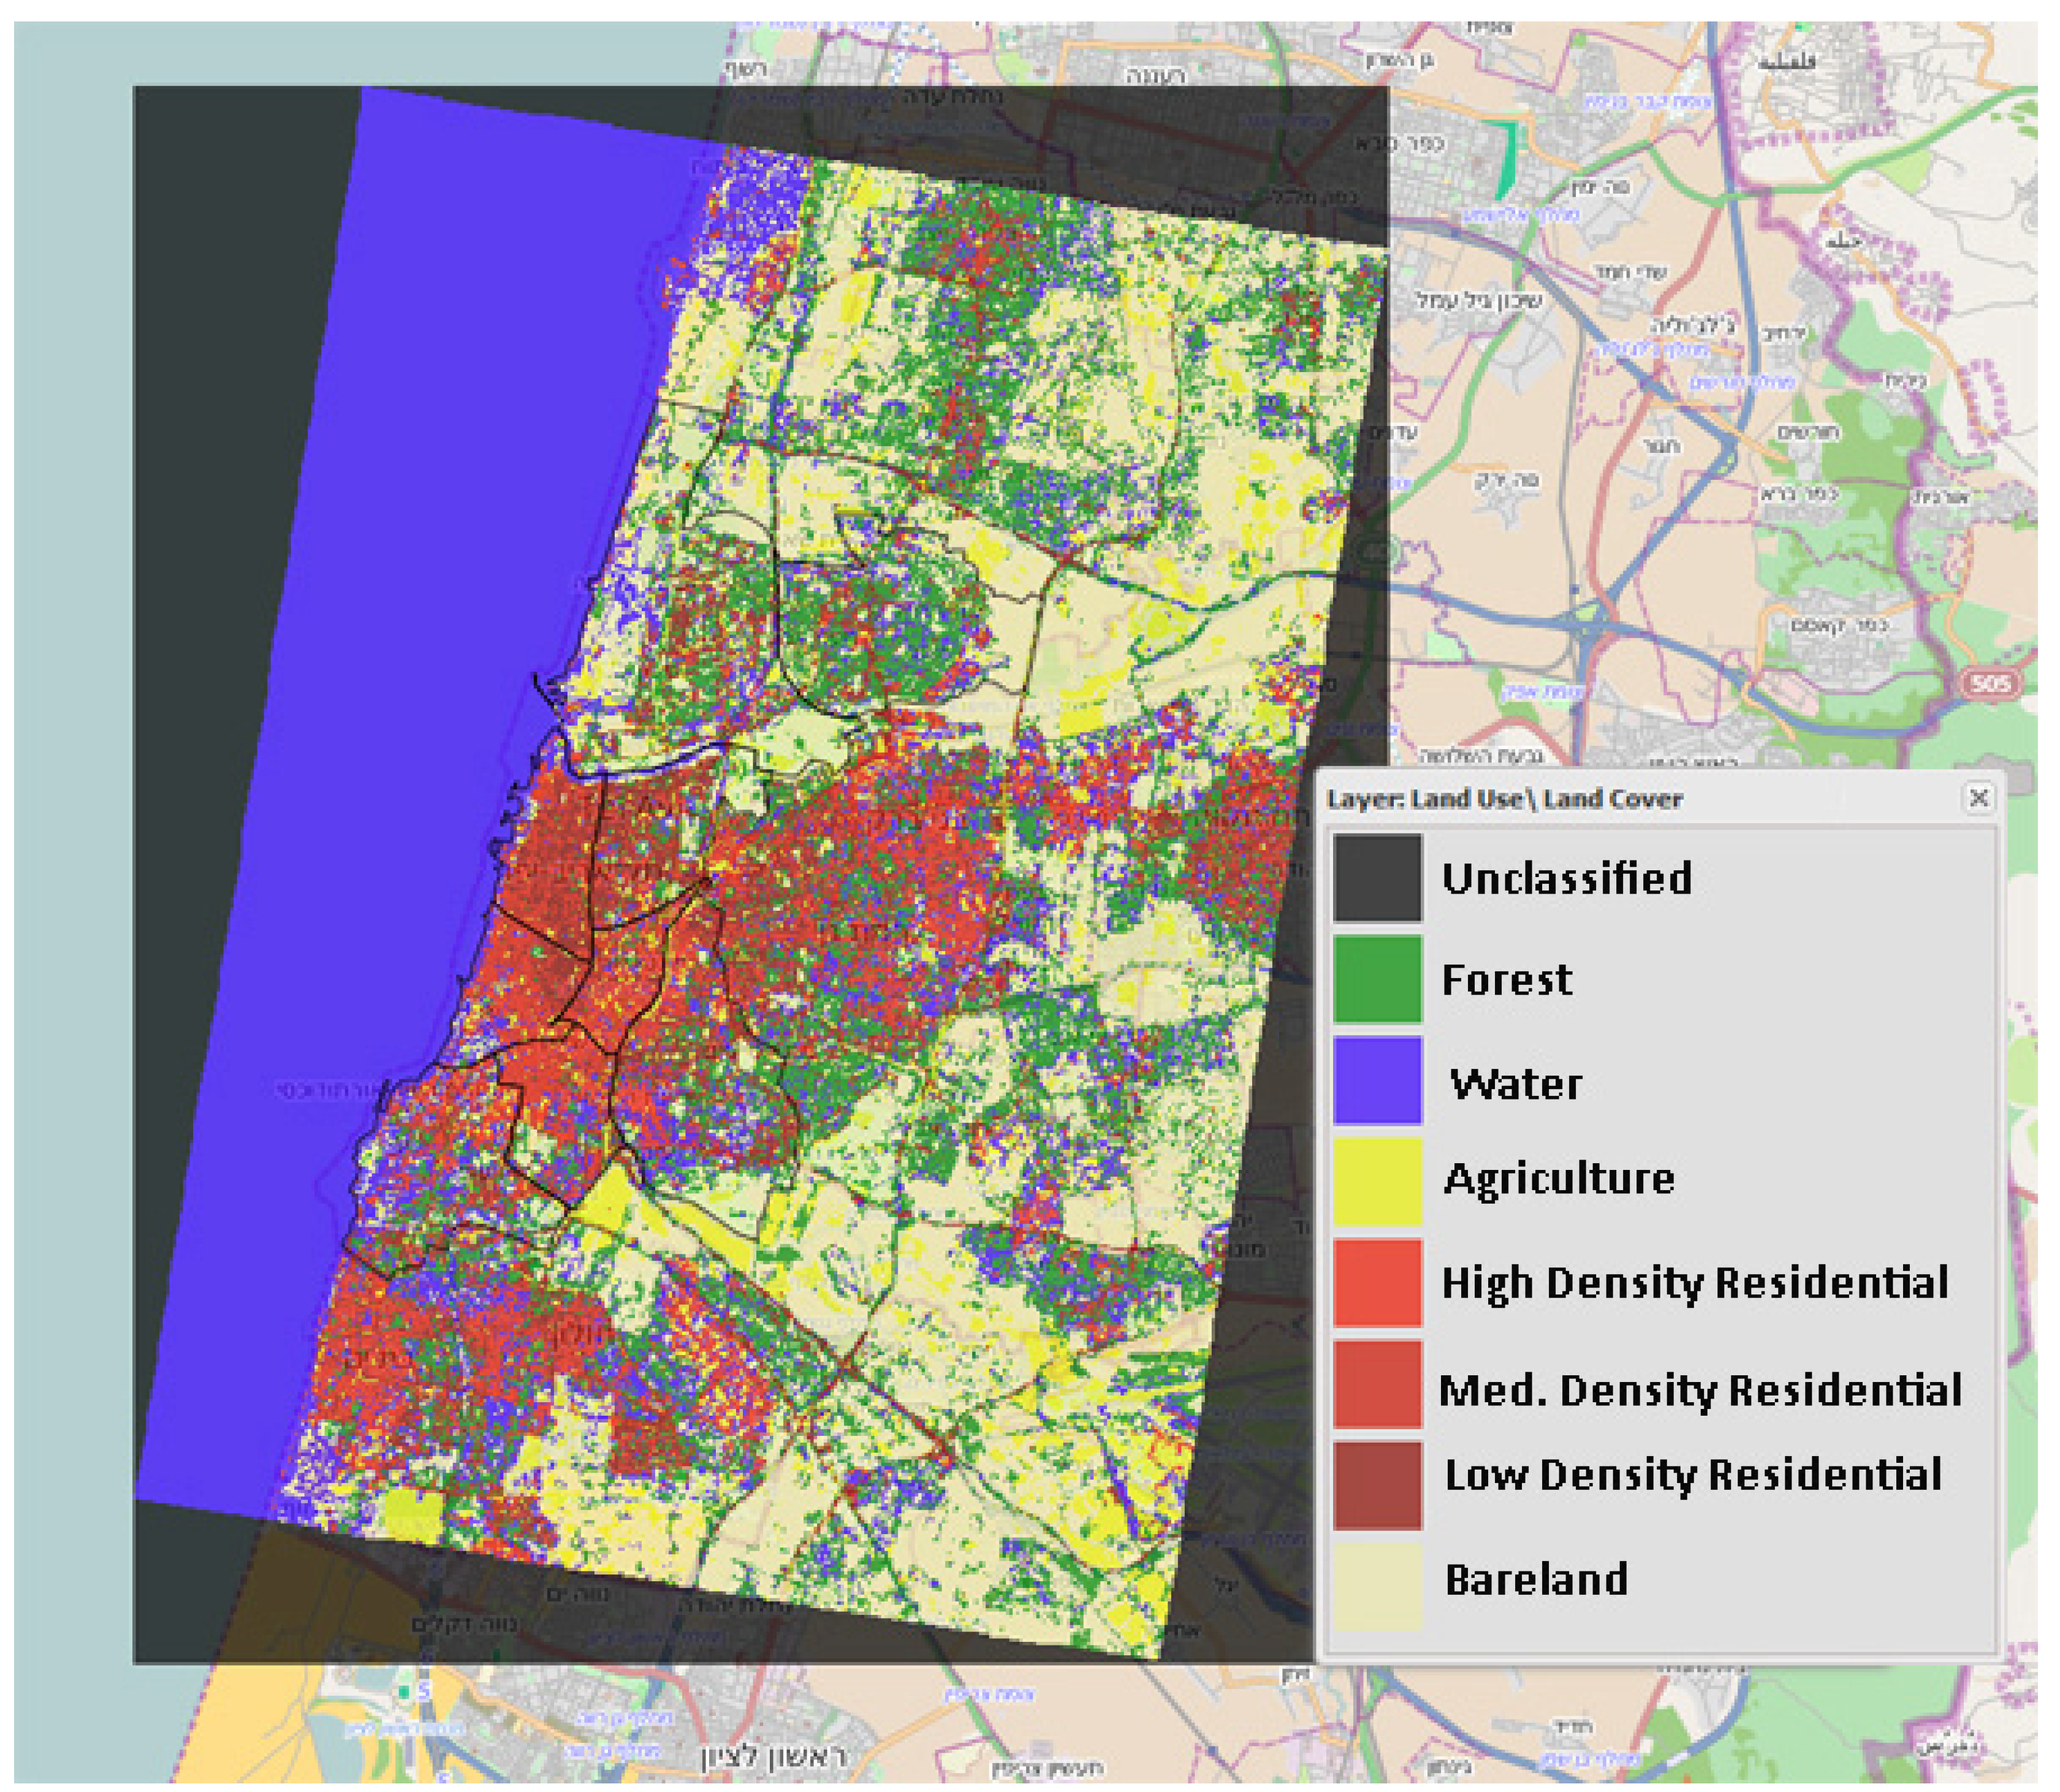
Land Cover


Vegetation Indices
3.1.6. Territorial Development
3.1.7. Vulnerability to Environmental Hazards
3.2. Requirements for Adaptation to Climate Change and the Associated EO Indicators
4. Discussions and Conclusions
Author Contributions
Conflicts of Interest
References
- United Nations Population Prospect. World Population Prospects—The 2008 Revision; United Nations Population Prospect: New York, NY, USA, 2008. [Google Scholar]
- Campbell, S. Green cities, growing cities, just cities? Urban planning and the contradictions of sustainable development. J. Am. Plan. Assoc. 1996, 62, 296–312. [Google Scholar] [CrossRef]
- Shen, L.Y.; Ochoa, J.; Shah, M.N.; Zhang, X. The application of urban sustainability indicators—A comparison between various practices. Habitat Int. 2011, 35, 17–29. [Google Scholar] [CrossRef]
- Zhang, X.; Wu, Y.; Shen, L. An evaluation framework for the sustainability of urban land use: A study of capital cities and municipalities in China. Habitat Int. 2011, 35, 141–149. [Google Scholar] [CrossRef]
- Chrysoulakis, N.; Lopes, M.; San José, R.; Grimmond, C.S.B.; Jones, M.B.; Magliulo, V.; Klostermann, J.E.M.; Synnefa, A.; Mitraka, Z.; Castro, E.; et al. Sustainable urban metabolism as a link between bio-physical sciences and urban planning: The BRIDGE project. Landsc. Urban Plan. 2013, 112, 100–117. [Google Scholar] [CrossRef]
- González, A.; Donnelly, A.; Jones, M.; Chrysoulakis, N.; Lopes, M. A decision-support system for sustainable urban metabolism in Europe. Environ. Impact Assess. Rev. 2013, 38, 109–119. [Google Scholar] [CrossRef]
- Taubenböck, H.; Esch, T. Remote Sensing—An Effective Data Source for Urban Monitoring. Earth Observation, Urban Monitoring, 20 July 2011. [Google Scholar]
- Barnsley, M.J.; Barr, S.L. Monitoring urban land use by earth observation. Surv. Geophys. 2000, 21, 269–289. [Google Scholar] [CrossRef]
- Huang, J.; Lu, X.X.; Sellers, J.M. A global comparative analysis of urban form: Applying spatial metrics and remote sensing. Landsc. Urban Plan. 2007, 82, 184–197. [Google Scholar] [CrossRef]
- Esch, T.; Thiel, M. How can Earth Observation Support the Sustainable Development of Urban Environments? Urban Remote Sensing. In Proceedings of the 46th ISOCARP Congress, Nairobi, Kenya, 19–23 September 2010; pp. 1–13.
- Huang, S.L.; Wong, J.H.; Chen, T.C. A framework of indicator system for measuring Taipei’s urban sustainability. Landsc. Urban Plan. 1998, 42, 15–27. [Google Scholar] [CrossRef]
- Esch, T.; Taubenböck, H.; Chrysoulakis, N.; Düzgün, H.S.; Tal, A.; Feigenwinter, C.; Parlow, E. Exploiting Earth Observation in Sustainable Urban Planning and Management—The GEOURBAN Project. In Proceedings of the Joint Urban Remote Sensing Event JURSE, Sao Paulo, Brazil, 21–23 April 2013.
- Kottek, M.; Grieser, J.; Beck, C.; Rudolf, B.; Rubel, F. World map of the Köppen-Geiger climate classification updated. Meteorol. Z. 2006, 15, 259–263. [Google Scholar] [CrossRef]
- Chrysoulakis, N. Estimation of the all-wave net radiation balance in urban environment with the combined use of Terra/ASTER multispectral imagery and in-situ spatial data. J. Geophys. Res. 2003, 108, 4582. [Google Scholar] [CrossRef]
- Frey, C.M.; Parlow, E. Geometry effect on the estimation of band reflectance in an urban area. Theor. Appl. Climatol. 2009, 96, 395–406. [Google Scholar] [CrossRef]
- Keramitsoglou, I.; Daglis, I.A.; Amiridis, V.; Chrysoulakis, N.; Ceriola, G.; Manunta, P.; Maiheu, B.; de Ridder, K.; Paganini, M. Evaluation of satellite-derived products for the characterization of the urban thermal environment. J. Appl. Remote Sens. 2012, 6, 061704. [Google Scholar] [CrossRef]
- Lu, D.; Weng, Q. A survey of image classification methods and techniques for improving classification performance. Int. J. Remote Sens. 2007, 28, 823–870. [Google Scholar]
- Lu, D.; Mausel, P.; Brondízio, E.; Moran, E. Change detection techniques. Int. J. Remote Sens. 2004, 25, 2365–2401. [Google Scholar] [CrossRef]
- Mitraka, Z.; Chrysoulakis, N.; Kamarianakis, Y.; Partsinevelos, P.; Tsouchlaraki, A. Improving the estimation of urban surface emissivity based on sub-pixel classification of high resolution satellite imagery. Remote Sens. Environ. 2012, 117, 125–134. [Google Scholar] [CrossRef]
- North, P.; Grey, W.; Heckel, A.; Fischer, J.; Preusker, R.; Brockmann, C. MERIS/AATSR Synergy Algorithms for Cloud Screening, Aerosol Retrieval, and Atmospheric Correction. Algorithm Theoretical Basis Document Land Aerosol and Surface Reflectance ATBD; ESRIN Contract No. 21090/07/I-LG; European Space Agency: Frascati, Italy, 2009. [Google Scholar]
- Toutin, T. Elevation modeling from satellite visible and infrared (VIR) data. Int. J. Remote Sens. 2001, 22, 1097–1125. [Google Scholar] [CrossRef]
- Esch, T.; Thiel, M.; Schenk, A.; Roth, A.; Müller, A.; Dech, S. Delineating of urban footprints from TerraSAR-X data by analyzing speckle characteristics and intensity information. IEEE Trans. Geosci. Remote Sens. 2010, 48, 905–916. [Google Scholar] [CrossRef]
- Wurm, M.; Taubenböck, H.; Schardt, M.; Esch, T.; Dech, S. Object-based image information fusion using multisensor Earth observation data over urban areas. Int. J. Image Data Fusion 2011, 2, 121–147. [Google Scholar] [CrossRef]
- Wong, C. Determining factors for local economic development: The perception of practitioners in the north west and eastern regions of the UK. Reg. Stud. 1998, 32, 707–720. [Google Scholar] [CrossRef]
- González, A.; Donnelly, A.; Jones, M.; Klostermann, J.; Groot, A.; Breil, M. Community of practice approach to developing urban sustainability indicators. J. Environ. Assess. Policy Manag. 2011, 13, 1–27. [Google Scholar] [CrossRef]
- Kanaroglou, P.S.; Soulakellis, N.A.; Sifakis, N.I. Improvement of satellite derived pollution maps with the use of a geostatistical interpolation method. J. Geogr. Syst. 2002, 4, 193–208. [Google Scholar] [CrossRef]
- Benas, N.; Beloconi, A.; Chrysoulakis, N. Urban PM Estimation Based on MERIS/AATSR Synergy Derived AOT and MODIS Level-2 Atmospheric Parameters. In Proceedings of the 3rd MERIS/(A)ATSR and OCLI-SLSTR (Sentinel-3) Preparatory Workshop, ESA-ESRIN, Frascati, Italy, 15–19 October 2012; pp. 111–112.
- Lee, H.Y.; Kim, T.; Park, W.; Lee, H.K. Extraction of digital elevation models from satellite stereo images through stereo matching based on epipolarity and scene geometry. Image Vis. Comput. 2003, 21, 789–796. [Google Scholar] [CrossRef]
- Zhang, C.; Fraser, C. Generation of digital surface model from high resolution satellite imagery. Int. Arch. Photogramm. Remote Sens. Spat. Inf. Sci. 2008, 37, 785–790. [Google Scholar]
- Wu, S.; Qiu, X.; Wang, L. Population estimation methods in GIS and remote sensing: A review. GISci. Remote Sens. 2005, 42, 80–96. [Google Scholar]
- Qiu, F.; Woller, K.L.; Briggs, R. Modeling urban population growth from remotely sensed imagery and tiger GIS road data. Photogramm. Eng. Remote Sens. 2003, 69, 1031–1042. [Google Scholar] [CrossRef]
- Wurm, M.; Taubenböck, H.; Krings, S.; Birkmann, J.; Roth, A.; Dech, S. Derivation of Population Distribution for Vulnerability Assessment in Flood-Prone German Cities Using Multisensoral Remote Sensing Data; SPIE Europe: Berlin, Germany, 2009. [Google Scholar]
- Lopes, C.; Adnot, J.; Santamouris, M.; Klitsikas, N.; Alvarez, S.; Sanchez, F. Managing the Growth of the Demand for Cooling in Urban Areas and Mitigating the Urban Heat Island Effect. In Proceedings of the ECEEE Congress, Mandelieu, France, 11–16 June 2001; Volume II.
- Huq, S.; Kovats, S.; Reid, H.; Satterthwaite, D. Editorial: Reducing risks to cities from disasters and climate change. Environ. Urban 2007, 19, 3–15. [Google Scholar]
- Hammer, A.; Heinemann, D.; Hoyer, C.; Kuhlemann, R.; Lorenz, E.; Müller, R.; Beyer, H.G. Solar energy assessment using remote sensing technologies. Remote Sens. Environ. 2003, 86, 423–432. [Google Scholar] [CrossRef]
- Yu, B.; Liu, H.; Wu, J.; Lin, W.M. Investigating impacts of urban morphology on spatio-temporal variations of solar radiation with airborne LIDAR data and a solar flux model: A case study of downtown Houston. Int. J. Remote Sens. 2009, 30, 4359–4385. [Google Scholar] [CrossRef]
- Lindberg, F.; Grimmond, C.S.B. Continuous sky view factor from high resolution urban digital elevation models. Clim. Res. 2010, 42, 177–183. [Google Scholar]
- Ioncica, M.; Petrescu, E.C.; Ioncica, D. Transports and consumers’ ecological behavior. Amfiteatru Econ. 2012, 14, 70–83. [Google Scholar]
- Jin, X.; Davis, C.H. An integrated system for automatic road mapping from high-resolution multi-spectral satellite imagery by information fusion. Inf. Fusion 2005, 6, 257–273. [Google Scholar] [CrossRef]
- Mena, J.B.; Malpica, J.A. An automatic method for road extraction in rural and semi-urban areas starting from high resolution satellite imagery. Pattern Recognit. Lett. 2005, 26, 1201–1220. [Google Scholar] [CrossRef]
- Voogt, J.; Oke, T. Thermal remote sensing of urban climates. Remote Sens. Environ. 2003, 86, 370–384. [Google Scholar] [CrossRef]
- Small, C. Comparative analysis of urban reflectance and surface temperature. Remote Sens. Environ. 2006, 104, 168–189. [Google Scholar] [CrossRef]
- Weng, Q. Thermal infrared remote sensing for urban climate and environmental studies: Methods, applications, and trends. ISPRS J. Photogramm. Remote Sens. 2009, 64, 335–344. [Google Scholar] [CrossRef]
- Schaaf, C.B.; Gao, F.; Strahler, A.H.; Lucht, W.; Li, X.; Tsang, T.; Strugnell, N.C.; Zhang, X.; Jin, Y.; Muller, J.P.; et al. First operational BRDF, albedo nadir reflectance products from MODIS. Remote Sens. Environ. 2002, 83, 135–148. [Google Scholar] [CrossRef]
- Frey, C.; Parlow, E. Flux measurements in Cairo. Part 2: On the determination of the spatial radiation and energy balance using ASTER satellite data. Remote Sens. 2012, 4, 2635–2660. [Google Scholar] [CrossRef]
- Liang, S. Narrowband to broadband conversions of land surface albedo I Algorithms. Remote Sens. Environ. 2000, 76, 213–238. [Google Scholar] [CrossRef]
- Zhang, J.; Foody, G.M. Fully-fuzzy supervised classification of sub-urban land cover from remotely sensed imagery: Statistical and artificial neural network approaches. Int. J. Remote Sens. 2001, 22, 615–628. [Google Scholar]
- Zhang, Q.J.; Gong, P.; Shi, P. Study of urban spatial patterns from SPOT panchromatic imagery using textural analysis. Int. J. Remote Sens. 2003, 24, 4137–4160. [Google Scholar] [CrossRef]
- Herold, M.; Mueller, S.; Guenter, S.; Scepan, J. Object-Oriented Mapping and Analysis of Urban Land Use/Cover Using IKONOS Data. In Geoinformation for European-Wide Integration, Proceedings of the 22nd EARSEL Symposium; Prague, Czech Republic, 4–6 June 2002, IOS Press: Amsterdam, The Netherlands, 2002; pp. 531–538. [Google Scholar]
- Lu, D.; Weng, Q. Use of impervious surface in urban land-use classification. Remote Sens. Environ. 2006, 102, 146–160. [Google Scholar] [CrossRef]
- Jat, M.K.; Garg, P.K.; Khare, D. Monitoring and modeling of urban sprawl using remote sensing and GIS techniques. Int. J. Appl. Earth Obs. Geoinf. 2008, 10, 26–43. [Google Scholar] [CrossRef]
- Powell, R.; Roberts, D.; Dennison, P.; Hess, L. Sub-pixel mapping of urban land cover using multiple endmember spectral mixture analysis: Manaus, Brazil. Remote Sens. Environ. 2007, 106, 253–267. [Google Scholar] [CrossRef]
- Rees, W.G. Comparing the spatial content of thematic Maps. Int. J. Remote Sens. 2008, 29, 3833–3844. [Google Scholar] [CrossRef]
- Pacifici, F.; Chini, M.; Emery, W.J. A neural network approach using multi-scale textural metrics from very high-resolution panchromatic imagery for urban land-use classification. Remote Sens. Environ. 2009, 113, 1276–1292. [Google Scholar] [CrossRef]
- Mountrakis, G.; Im, J.; Ogole, C. Support vector machines in remote sensing: A review. ISPRS J. Photogramm. Remote Sens. 2011, 66, 247–259. [Google Scholar] [CrossRef]
- Bruzzone, L.; Chi, M.; Marconcini, M. A novel transductive SVM for the semisupervised classification of remote sensing images. IEEE Trans. Geosci. Remote Sens. 2006, 44, 3363–3373. [Google Scholar] [CrossRef]
- Mari, M.J.; Bovolo, F.; Comez-Chova, L.; Bruzzone, L.; Camps-Valls, G. Semisupervised one-class support vector machines for classification of remote sensing data. IEEE Trans. Geosci. Remote Sens. 2010, 48, 3188–3197. [Google Scholar] [CrossRef]
- Camps-Valls, G.; Marsheva, T.B.; Zhou, D. Semi-supervised graph-based hyperspectral image classification. IEEE Trans. Geosci. Remote Sens. 2007, 45, 3044–3054. [Google Scholar]
- Small, C. Estimation of urban vegetation abundance by spectral mixture analysis. Int. J. Remote Sens. 2001, 22, 1305–1334. [Google Scholar]
- Verrelst, J. Space-Born Spectro-Directional Estimation of Forest Properties. Ph.D. Thesis, Wageningen University, Wageningen, The Netherlands, 2010. [Google Scholar]
- Chrysoulakis, N.; Flouri, E.; Diamandakis, E.; Dougalis, V.; Synolakis, C.E.; Foteinis, S. Remote Sensing in Support of Tsunami Mitigation Planning in the Mediterranean. In Proceedings of the 1st International Conference on Remote Sensing Techniques in Disaster Management and Emergency Response in the Mediterranean Region, Zadar, Croatia, 22–24 September 2008.
- Taubenböck, H.; Goseberg, N.; Setiadi, N.; Lämmel, G.; Moder, F.; Oczipka, M.; Klüpfel, H.; Wahl, R.; Schlurmann, T.; Strunz, G.; et al. Last-mile preparation for a potential disaster—Interdisciplinary approach towards tsunami early warning and an evacuation information system for the coastal city of Padang, Indonesia. Nat. Hazards Earth Syst. Sci. 2009, 9, 1509–1528. [Google Scholar] [CrossRef]
- Grubler, A.; Bai, X.; Buettner, T.; Dhakal, S.; Fisk, D.; Ichinose, T.; Keirstead, J.; Sammer, G.; Satterthwaite, D.; Schulz, N. Urban Energy Systems. In Global Energy Assessment: Toward a Sustainable Future; Gomez-Echeverri, L., Johansson, T.B., Nakicenovic, N., Patwardhan, A., Eds.; Cambridge University Press: Cambridge, UK/New York, NY, USA; IIASA: Laxenburg, Austria, 2012; pp. 1307–1400. [Google Scholar]
- EEA. Urban Adaption to Climate Change in Europe: Challenges and Opportunities for Cities Together with Supportive National and European Policies; European Environment Agency Report 2/2012; European Environment Agency: Copenhagen, Denmark, 2012. [Google Scholar]
- Scavia, D.; Field, J.; Boesch, D.; Buddemeier, R.; Burkett, V.; Cayan, D.; Fogarty, M.; Harwell, M.A.; Howarth, R.W.; Mason, C. Climate change impacts on U.S. coastal and marine ecosystems. Estuaries 2002, 25, 149–164. [Google Scholar] [CrossRef]
- Martin, D.; Bélanger, D.; Gosselin, P.; Brazeau, J.; Furgal, C.; Déry, S. Drinking water and potential threats to human health in Nunavik: Adaptation strategies under climate change conditions. Arctic 2007, 60, 195–202. [Google Scholar]
- Minnett, P.J. Satellite Remote Sensing: Sea Surface Temperatures. In Encyclopedia of Ocean Sciences; Steele, J., Thorpe, S., Turekian, K., Eds.; Academic Press: London, UK, 2001; pp. 2552–2563. [Google Scholar]
- Corburn, J. Cities, climate change and urban heat island mitigation: Localising global environmental science. Urban Stud. 2009, 46, 413–427. [Google Scholar] [CrossRef]
- Stone, B. Land use as climate change mitigation. Environ. Sci. Technol. 2009, 43, 9052–9056. [Google Scholar] [CrossRef] [PubMed]
- Dousset, B.; Gourmelon, F.; Laaidi, K.; Zeghnoun, A.; Giraudet, E.; Bretin, P.; Mauri, E.; Vandentorren, S. Satellite monitoring of summer heat waves in the Paris metropolitan area. Int. J. Climatol. 2011, 31, 313–323. [Google Scholar] [CrossRef]
- Fernandes, R.; Fraser, R.; Latifovic, R.; Cihlar, J.; Beaubien, J.; Du, Y. Approaches to fractional land cover and continuous field mapping: A comparative assessment over the BOREAS study region. Remote Sens. Environ. 2004, 89, 234–251. [Google Scholar] [CrossRef]
- Scanlon, T.M.; Albertson, J.D.; Caylor, K.K.; Williams, C.A. Determining land surface fractional cover from NDVI and rainfall time series for a savanna ecosystem. Remote Sens. Environ. 2002, 82, 376–388. [Google Scholar] [CrossRef]
- Seto, K.C.; Güneralp, B.; Hutyra, L. Global forecasts of urban expansion to 2030 and direct impacts on biodiversity and carbon pools. Proc. Natl. Acad. Sci. USA 2012, 109, 16083–16088. [Google Scholar] [CrossRef] [PubMed]
- Stone, B.; Vargo, J.; Habeeb, D. Managing climate change in cities: Will climate action plans work? Lands. Urban Plan. 2012, 107, 263–271. [Google Scholar] [CrossRef]
© 2014 by the authors; licensee MDPI, Basel, Switzerland. This article is an open access article distributed under the terms and conditions of the Creative Commons Attribution license (http://creativecommons.org/licenses/by/3.0/).
Share and Cite
Chrysoulakis, N.; Feigenwinter, C.; Triantakonstantis, D.; Penyevskiy, I.; Tal, A.; Parlow, E.; Fleishman, G.; Düzgün, S.; Esch, T.; Marconcini, M. A Conceptual List of Indicators for Urban Planning and Management Based on Earth Observation. ISPRS Int. J. Geo-Inf. 2014, 3, 980-1002. https://doi.org/10.3390/ijgi3030980
Chrysoulakis N, Feigenwinter C, Triantakonstantis D, Penyevskiy I, Tal A, Parlow E, Fleishman G, Düzgün S, Esch T, Marconcini M. A Conceptual List of Indicators for Urban Planning and Management Based on Earth Observation. ISPRS International Journal of Geo-Information. 2014; 3(3):980-1002. https://doi.org/10.3390/ijgi3030980
Chicago/Turabian StyleChrysoulakis, Nektarios, Christian Feigenwinter, Dimitrios Triantakonstantis, Igor Penyevskiy, Abraham Tal, Eberhard Parlow, Guy Fleishman, Sebnem Düzgün, Thomas Esch, and Mattia Marconcini. 2014. "A Conceptual List of Indicators for Urban Planning and Management Based on Earth Observation" ISPRS International Journal of Geo-Information 3, no. 3: 980-1002. https://doi.org/10.3390/ijgi3030980