
An Open Source WebGIS Application for Civic Education on Peace and Conflict


Abstract
:
1. Introduction
“Knowledge is of two kinds. We know a subject ourselves, or we know where we can find information upon it”.(Samuel Johnson, 18 April 1775) [1]
2. The Information Portal on Peace and Conflict
2.1. About the Motives to Develop a Peace and Conflict Information Portal
2.2. Civic Education
2.3. The Relevance of Information Visualization and Geographic Information Applications for Civic Education
2.4. Open Knowledge Benefits from Open Source

2.5. Applications Architecture
3. Components and Functions of the Information Portal
3.1. Portal Structure, Components, Content Types and Functional Relations


3.2. Interaction with the User


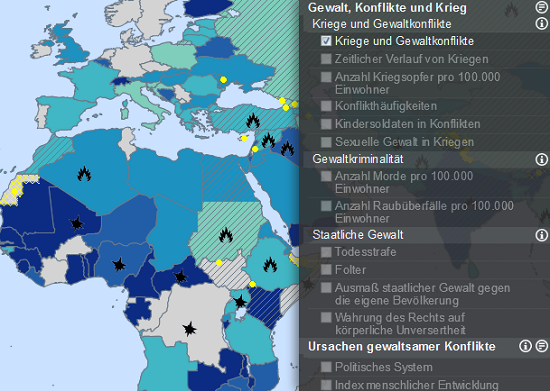
- War and conflict
- ○
- Violence, conflicts and war
- ○
- Causes of violent conflicts
- Peace and demobilization
- ○
- Peace and peace missions
- ○
- Disarmament, demobilization and reintegration
- Military capacities
- ○
- Military resources
- ○
- Militarization
- ○
- Arms trade
- Resources and conflict
- ○
- Mineral resources and distribution of mineral resources
- ○
- Resource conflicts
- ○
- Resource control regimes
- Conventional weapons
- ○
- Conventional weapons
- ○
- Small and light weapons
- ○
- Landmines and cluster munition
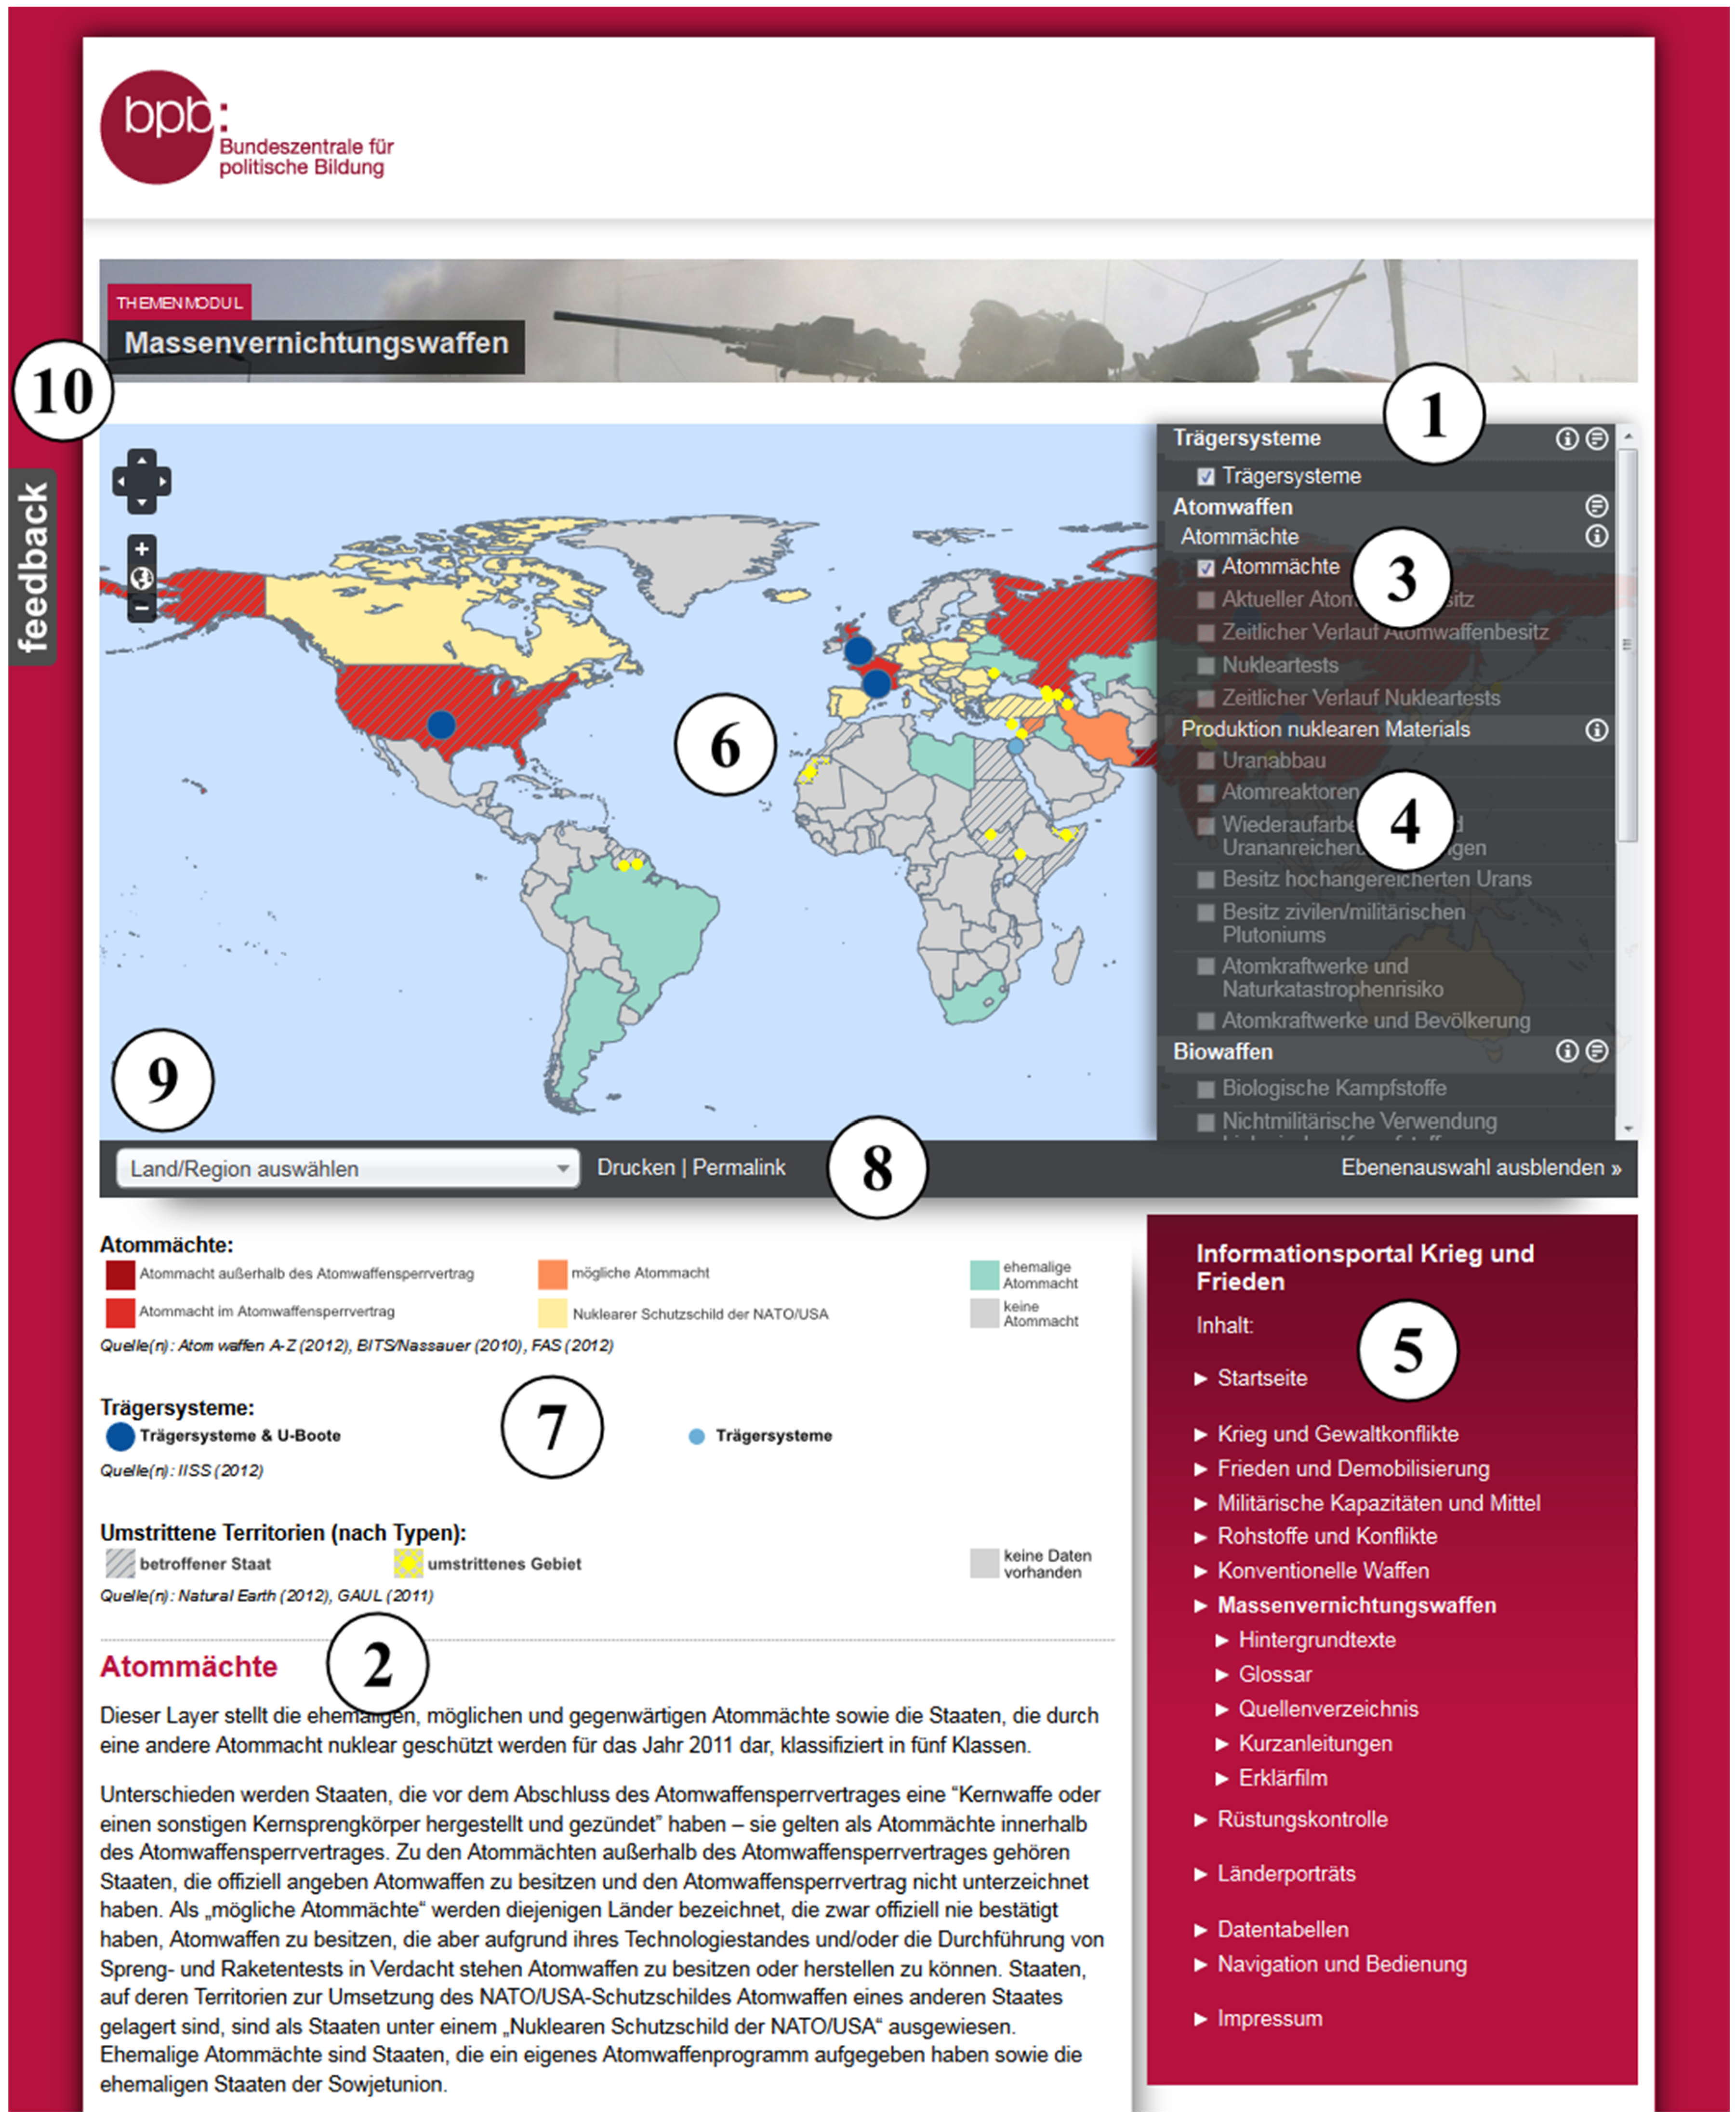
- Weapons of mass destruction
- ○
- Launcher systems
- ○
- Nuclear weapons
- ○
- Biological weapons
- ○
- Chemical weapons
- Arms control
- ○
- History
- ○
- Conventional weapons
- ○
- NBC weapons
- ○
- Space weapons
4. Concluding Remarks
Acknowledgments
Conflicts of Interest
References
- Boswell, J.; Hibbert, C. (Eds.) Life of Samuel Johnson; Penguin Classics: New York, NY, USA, 1986; p. 526.
- Reardon, B.A. Concerns, mediating on the barricades: Concerns, cautions and possibilities for peace education for political efficacy. In Critical Peace Education: Difficult Dialogue; Trifonas, P.P., Wright, B., Eds.; Springer: Dordrecht, The Netherland, 2013; pp. 1–28. [Google Scholar]
- Dodge, M.; McDerby, M.; Turner, M. The power of geographical visualizations. In Geographic Visualization. Concepts, Tools and Applications; Wiley and Sons: Chichester, UK, 2008; pp. 1–10. [Google Scholar]
- Strunck, A.; Wirkus, L. Interactive maps on peace and conflict: An open source WebGIS application for civil education. In Proceedings of the 3rd Open Source Geospatial Research & Education Symposium OGRS 2014, Aalto University, Espoo, Finland, 10–13 June 2014; Jomla, A., Sarkola, P., Letho, L., Eds.; Aalto University: Espoo, Finland, 2014; pp. 55–64. [Google Scholar]
- The Correlates of War Project. Available online: http://correlatesofwar.org (accessed on 15 May 2015).
- Uppsala Conflict Data Program. Available online: http://www.pcr.uu.se/research/ucdp/definitions/#Conflict_armed (accessed on 15 May 2015).
- Raleigh, C; Linke, A.; Hegre, H.; Karlsen, J. Introducing ACLED-Armed conflict location and event data. J. Proteome Res. 2010, 47, 1–10. [Google Scholar]
- Megoran, N.S.; Williams, P.; McConnel, F. Geographies of peace, geographies for peace. In Geographies of Peace; McConnell, F., Megoran, N., Williams, P., Eds.; I.B. Tauris: London, UK; New York, NJ, USA, 2014; pp. 250–260. [Google Scholar]
- Megoran, N.S.; Williams, P.; McConnel, F. Introduction: Geographical approaches to peace. In Geographies of Peace; McConnell, F., Megoran, N., Williams, P., Eds.; I.B. Tauris: London, UK; New York, NJ, USA, 2014; pp. 1–25. [Google Scholar]
- Kisby, B.; Sloam, J. Revitalizing democracy: Civic education in Europe and the United States. In Proceedings of the APSA 2009 Toronto Meeting, Toronto, ON, Canada, 3–6 September 2009.
- Page, J. Peace Education: Exploring Ethical and Philosophical Foundations; Information Age Publishing: Charlotte, NY, USA, 2008. [Google Scholar]
- Harris, I. History of peace education. In Encyclopedia of Peace Education, 1st ed.; Bajaj, M., Ed.; Information Age Publishing: Charlotte, NY, USA, 2008; pp. 15–24. [Google Scholar]
- Bajaj, M. Introduction. In Encyclopedia of Peace Education, 1st ed.; Bajaj, M., Ed.; Information Age Publishing: Charlotte, NY, USA, 2008; pp. 1–9. [Google Scholar]
- Federal Agency for Civic Education. Available online: http://www.bpb.de/die-bpb/51244/der-bpb-erlass (accessed on 28 February 2015).
- Crick, B. Education for citizenship and the teaching of democracy in schools. In Final Report of the Advisory Group on Education for Citizenship; Qualifications and Curriculum Authority (QCA): London, UK, 1998; pp. 35–52. [Google Scholar]
- Kidwell, F.L. Civic education for a global world. In Proceedings of the Tutzing Forum: Political Didactics International Conference, Tutzing, Germany, 14–19 April 2013.
- Bonn International Center for Conversion. Available online: http://www.bicc.de/ (accessed on 28 February 2015).
- Yau, N. Visualize This: The Flowing Data Guide to Design, Visualization, and Statistics; Wiley Publishing: Hoboken, NJ, USA, 2011. [Google Scholar]
- Kuhn, H.-W. European approaches to civic education for the promotion of democracy. In Proceedings of the German-American Conference on Democracy Promotion and International Cooperation, Denver, CO, USA, 24–29 September 2006.
- Ross, A. Editorial: Education for active citizenship: Practices, policies, promises. Int. J. Progress. Educ. 2012, 8, 7–14. [Google Scholar]
- Chow, J. Establishing a general framework civic competency for European youth. Int. J. Progress. Educ. 2012, 8, 140–150. [Google Scholar]
- Crick, B.; Lister, I. Political literacy: The centrality of the concept. Int. J. Polit. Educ. 1979, 2, 83–92. [Google Scholar]
- Kerr, D.; Ireland, E. Making citizenship education real. Educ. J. 2004, 78, 25–27. [Google Scholar]
- Cleaver, E.; Nelson, J. Active citizenship: From policy to practice. Educ. J. 2006, 98, 34–37. [Google Scholar]
- Mayer, R.E. Cognitive theory of multimedia learning. In The Cambridge Handbook of Multimedia Learning; Mayer, R.E., Ed.; Cambridge University Press: Cambridge, UK, 2005; pp. 31–48. [Google Scholar]
- Fekete, J.-D.; van Wijk, J.J.; Stasko, J.T.; North, C. The value of information visualization. In Information Visualization; Kerren, A., Stasko, J.T., Fekete, J.-D., North, C., Eds.; Springer: Berlin, Germany, 2008; pp. 1–18. [Google Scholar]
- Elwood, S. Geographic information science: Emerging research on the societal implications of the geospatial web. Progress Hum. Geogr. 2010, 34, 349–357. [Google Scholar] [CrossRef]
- Dodge, M.; Kitchin, R.; Perkins, C. Rethinking Maps; Routledge: London, UK, 2009. [Google Scholar]
- Cartwright, W. Extending the map metaphor using web delivered multimedia. Int. J. Geogr. Inf. Sci. 1999, 13, 335–353. [Google Scholar] [CrossRef]
- Papadimitriou, F. Introduction to the complex Geospatial Web in geographical education. Int. Res. Geogr. Environ. Educ. 2010, 19, 53–56. [Google Scholar] [CrossRef]
- Wiegand, P. Forum Geographical Information Systems (GIS) in education. Int. Res. Geogr. Environ. Educ. 2001, 10, 68–71. [Google Scholar] [CrossRef]
- Latour, B. Visualisation and cognition: Drawing things together. In Knowledge and Society. Studies in the Sociology of Culture Past and Present; Kuklick, H., Ed.; JAI Press: Greenwich, CT, USA, 1986; pp. 1–40. [Google Scholar]
- Chow, E. The potential of maps API for internet GIS applications. Trans. GIS 2008, 12, 179–191. [Google Scholar] [CrossRef]
- Papadimitriou, F. A “Neogeographical eductaion”? The geospatial web, GIS and digital art in adult education. Int. Res. Geogr. Environ. Educ. 2010, 19, 71–74. [Google Scholar] [CrossRef]
- Lidstone, J.; Stoltmann, J. Searching for, or creating, knowledge: The roles of Google and GIS in geographical education. Int. Res. Geogr. Environ. Educ. 2006, 15, 205–209. [Google Scholar] [CrossRef]
- Purchase, H.C.; Andrienko, N.; Jankun-Kelly, T.J.; Ward, M. Theoretical foundations of information visualization. In Information Visualization; Kerren, A., Stasko, J.T., Fekete, J.-D., North, C., Eds.; Springer: Berlin, Germany, 2008; pp. 46–64. [Google Scholar]
- Loughlan, V.; Olsson, C.; Schouten, P. Mapping. In Critical Security Methods. New Frameworks for Analysis; Ardenau, C., Huysmans, J., Neal, A., Eds.; Routledge: London, UK; New York, NJ, USA, 2014; pp. 23–58. [Google Scholar]
- GNU Operating System. The Free Software Definition. Available online: http://www.gnu.org/philosophy/free-sw.en.html (accessed on 19 February 2015).
- Steiniger, S.; Hunter, A.J.S. The 2012 free and open source GIS software map––A guide to facilitate research, development and adoption. Comput. Environ. Urban. Syst. 2013, 39, 136–150. [Google Scholar] [CrossRef]
- OGC. Available online: http://www.opengeospatial.org/ (accessed on 31 January 2015).
- PostgreSQL. Available online: http://www.postgresql.org/ (accessed on 19 February 2015).
- PostGIS. Available online: http://postgis.net/ (accessed on 19 February 2015).
- MapServer. Available online: http://mapserver.org/ (accessed on 19 February 2015).
- OpenLayers. Available online: http://openlayers.org/ (accessed on 19 February 2015).
- MapProxy. Available online: http://mapproxy.de/ (accessed on 19 February 2015).
- CMS Made Simple. Available online: http://www.cmsmadesimple.org (accessed on 19 February 2015).
- pChart. Available online: http://www.pchart.net/ (accessed on 19 February 2015).
- Obe, R.O.; Hsu, L.S. What is a spatial database? In PostGIS in Action; Obe, R.O., Hsu, L.S., Eds.; Manning: Stamford, UK, 2011; pp. 3–32. [Google Scholar]
- Sherman, G.E. The Geospatial Desktop GIS: Open Source GIS and mapping; Locate Press: Chugiak, AK, USA, 2010. [Google Scholar]
- Obe, R.O.; Hsu, L.S. Using PostGIS in web applications. In PostGIS in Action; Obe, R.O., Hsu, L.S., Eds.; Manning: Stamford, UK, 2011; pp. 312–344. [Google Scholar]
- Hazzard, E. OpenLayers 2.10––Beginner’s Guide; Packt Publishing Ltd.: Birmingham, UK, 2011. [Google Scholar]
- Jansen, M.; Adams, T. Open Layers. Webentwicklung mit dynamischen Karten und Geodaten; Open Source Press: München, Germany, 2010. [Google Scholar]
- ISO 19128. In Geographic Information––Web Map Service Interface; International Organization for Standardization: Geneva, Switzerland, 2005.
- ISO/DIS 19142. In Geographic Information––Web Feature Service; International Organization for Standardization: Geneva, Switzerland, 2009.
- Baumann, P.; Cox, S.; Donéa, L.; Evans, J.; Herring, J.; Keens, S.; Roswell, C.; Vretanos, P.; Whiteside, A. Web Coverage Service (WCS) Implementation Standard; Open Geospatial Consortium: Wayland, MA, USA, 2008. [Google Scholar]
- Creative Commons. Creative Commons Attribution-NonCommercial-NoDerivs 3.0 Unported License. Available online: http://creativecommons.org/licenses/by-nc-nd/3.0/ (accessed on 19 February 2015).
- Natural Earth. Available online: http://www.naturalearthdata.com/ (accessed on 31 January 2015).
- Weidmann, N.B.; Kuse, D.; Gleditsch, K.S. The geography of the international system: The CShapes dataset. Int. Interact 2010, 36, 86–106. [Google Scholar] [CrossRef]
- Global Administrative Unit Layers (GAUL). Available online: http://data.fao.org/map?entryId=f7e7adb0-88fd-11da-a88f-000d939bc5d8&tab=metadata (accessed on 19 February 2015).
- QGIS. Available online: http://www.qgis.org/ (accessed on 19 February 2015).
- Gießmann, H.J.; Rinke, B. Handbuch Frieden; Springer: Berlin, Germany, 2011. [Google Scholar]
© 2015 by the authors; licensee MDPI, Basel, Switzerland. This article is an open access article distributed under the terms and conditions of the Creative Commons Attribution license (http://creativecommons.org/licenses/by/4.0/).
Share and Cite
Wirkus, L. An Open Source WebGIS Application for Civic Education on Peace and Conflict. ISPRS Int. J. Geo-Inf. 2015, 4, 1013-1032. https://doi.org/10.3390/ijgi4021013
Wirkus L. An Open Source WebGIS Application for Civic Education on Peace and Conflict. ISPRS International Journal of Geo-Information. 2015; 4(2):1013-1032. https://doi.org/10.3390/ijgi4021013
Chicago/Turabian StyleWirkus, Lars. 2015. "An Open Source WebGIS Application for Civic Education on Peace and Conflict" ISPRS International Journal of Geo-Information 4, no. 2: 1013-1032. https://doi.org/10.3390/ijgi4021013