1. Introduction
In 2007, the Federal Reserve Bank of New York reported that Buffalo was ranked second nationally in terms of vacant properties per capita. By 2008, the City of Buffalo owned more than 10,000 vacant properties [
1]. In response to its vacancy epidemic, the City of Buffalo adopted an aggressive demolition plan with the goal of removing 5000 structures in five years [
2]. The City’s focus on accelerated demolition was in step with the nationwide interests in a demolition first approach. Together with other neoliberal urban development polices such as targeting public improvements and subsidizes to promote private development, this approach has been advocated for as a tool to stimulate reinvestment and remove blight [
3,
4,
5]. The increased focus on demolition in Buffalo since 2006, however, has not resulted in a net reduction in the total number of vacancies. Nor has it improved neighborhood conditions. In 2010, the U.S. Postal Service reported that there were over 15,000 vacant addresses in the city, and the U.S. Census reported that there were 11,196 “other” vacant housing units The “other vacant” category within the census classification of vacant units identifies vacant units that were not for sale, rent, or used for seasonal recreational or other purposes. This category serves as a proxy for housing units that were permanently vacant or abandoned in Buffalo. This outcome is not unique to Buffalo. Despite similar demolition efforts in other rust belt cities, like Baltimore and Youngstown, the number of abandoned houses still continues to grow and demolition can barely keep up with abandonment [
6,
7]. In addition, demolitions were executed more randomly and often not based on community priorities because of the lack of a clear strategy [
7,
8].
Current literature has paid limited attention to the analysis of the relationship between abandonment and demolition, or the use of such analysis to guide decision-making. Policies to fight vacancy and abandonment have been largely reactive, as opposed to proactive [
9,
10,
11]. These policies have primarily been formulated with a focus on massive demolition that is not well grounded in empirical analysis of the implications of demolition or factors that contribute to housing vacancy and abandonment [
3,
6,
9,
12]. These policies have also been pursued with limited empirical data on how demolition impacts nearby properties and neighborhoods.
This article attempts to extend our understanding of the impact of abandonment and demolition on nearby properties. The analysis is based on micro-level and multi-year empirical data examining places with and without aggressive demolition efforts in order to advance the current discussion on housing vacancy and abandonment. We conduct fine-grained analysis of the spatial distribution of abandoned and demolished properties over the years in Buffalo to help understand the dynamic patterns of abandonment and demolition in distressed cities. We examine the driving forces that exacerbate abandonment, and the impact of abandonment and demolition on nearby properties before and after the City’s aggressive demolition effort. We also examine what the most important factors were when selecting demolition sites in Buffalo. The results from our analysis inform, support, and further discussions of policies and programs to fight blight. Our findings contribute to the growing body of literature which explores the impact of demolition and factors contributing to long-term vacancy and abandonment.
2. International Literature Review
Vacant and abandoned houses and buildings influence neighborhoods in a variety of ways [
9,
13,
14]. Some studies have suggested that blocks with vacant structures had 3.2 times as many drug-related calls to police and 1.8 times as many theft-related calls as blocks with no vacant homes. More than 12,000 fires started in vacant structures each year, and more than 70 percent of fires in vacant or abandoned buildings were the result of arson [
13]. Others found that crime rates are high in distressed neighborhoods where public housing is targeted for demolition [
15,
16]. Silverman
et al. [
17] argued that vacant and abandoned properties in cities like Buffalo represent a permanent fixture of the urban mileu. Once established, they quickly spread in distressed neighborhoods impacted by job and population loss. The presence of these properties, which the authors labeled
zombie properties, accelerated the downward trajectory of neighborhoods. Poverty rates and unemployment rates increased consistently for decades in these cities [
18].
High vacancies and abandonment are also associated with lower property values [
9,
19]. According to the National Vacant Properties Campaign, a study in Philadelphia in 2001 found that houses within 150 feet of a vacant property declined in value by more than $7000 [
13]. Vacant and abandoned homes are considered to be eyesores which deter homeowners and other investors from spending in neighborhoods. They create negative impacts on neighboring homes, businesses and schools, pose safety risks, and negatively impact the welfare of a community [
20]. The vacancy crisis is aggravated by continued job and population losses [
14,
17].
Earlier discussions of planned interventions for distressed urban residential areas in the U.S. and Europe were summarized as three approaches to policy: bulldozing, neighborhood rehabilitation, and revitalization [
21]. The first approach, bulldozing, not only destroys bricks and mortar but devastated the African-American communities emotionally [
22]. Influenced by criticisms of the first policy approach, which focused on demolition and displacement, the neighborhood rehabilitation approach was developed in the 1960s to focus on improving existing housing and providing better social services [
23]. The third generation policy approach focused on gentrification and property-led regeneration [
24,
25].
Another related strand of literature is neighborhood life-cycle theory which views neighborhood change in terms of a life cycle [
26]. It is cited by advocates for public intervention through the use of monetary investments to stimulate redevelopment and fight blight [
27]. From this perspective, long-term vacancy or abandonment can accumulate quickly as a result of underinvestment or negligence of real property [
28]. As a result, nearby abandonment, demolition, or revitalization may adversely or positively impact a property owner’s decision about the upkeep or abandonment of his or her property. Studies have demonstrated that investment decisions on properties depended on neighborhood property conditions and other considerations [
29,
30]. Thus, it is important for residents to have access to finical resources within an environment where community controls are in place.
Some more recent studies suggested that demolition policies were less efficacious than noncompliance-minimizing policies that focus on enforcing property code violations and improving properties to control the spread of vacant properties [
28]. Morckel [
11] found that neighborhood property maintenance predicted abandonment and argued for policies to prevent abandonment from occurring in the first place. Leather and Nevin [
31] found that a housing market renewal program that focused on the relationship between preferences of residents and existing housing stock had reduced vacancy rates and increased housing prices in neighborhoods when compared to regional trends. Under such circumstances, residents prefer filling vacant properties with people and active uses. Other studies suggested that the lack of a strategic demolition strategy and property code enforcement contributed to the abandonment problems [
7,
32]. Recent popular media articles have also identified the need for less drastic remediation policies than demolition [
33,
34].
3. Alternative Methodologies and Data
While many past studies of housing abandonment in rust belt cities used data at the census tract or block group level [
11,
17,
35], few have used property level spatial data, especially for multi-years, to understand the dynamic patterns and the impacts of abandonment and demolition on neighborhoods [
9,
36]. There is no universal definition of land abandonment or housing abandonment, and vacancy-related data often exist in different formats with different spatial extents and are compiled by various agencies or organizations for different purposes and years [
6,
11,
37]. Few cities have an inventory of vacant and abandoned houses at the property level across the years that is systematically organized [
9]. Few cities have digital systems to help track and prioritize demolition that was argued to be central to a smart shrinking effort [
7,
38].
With advances in computing technology it is now feasible to collect, assemble, manage, and analyze large property databases using a multi-year framework. In addition, a wealth of digital information such as images (e.g., satellite, panoramic, and others) can be collected and stored in such a database. Recent technology developments can also help to process and analyze large and complex datasets using data mining based on such databases [
37]. For instance, Zaragozi (2012) [
37] stated that there can be “too many variables” contributing to abandonment and data mining can be used to help select the most important variables.
This article describes how we built a spatio-temporal database that integrated information at multiple scales with both temporal and spatial dimensions from various sources and for multiple years. This unique micro-level and multi-year database helps to define and locate abandoned properties at the parcel level for multiple years before and after the City’s aggressive demolition policy. Close to 3500 structures were demolished in this period with one third happening before the stepped-up demolition effort and two thirds after.
Such a database supports the description of fine-grained differentiation of patterns of abandonment and demolition, and facilitates the analysis and the examination of the spatial structure and magnitude of both abandonment and demolition. Specifically, we use it to examine the impacts of abandonment and demolition and factors contributing to them, such as whether the demolition of vacant and nuisance structures reduces the probability of abandonment, raises property values, and improves neighborhood conditions. This database also helps to provide information that enables citizens or stakeholders to understand the issues and enables a transparent smart decline planning process at a regional scale [
39].
4. Methods
Using the micro-level and multi-year database, we employed a hybrid modeling structure including hedonic price models and logistic regressions. This modeling was used to build on previous studies of vacancy and Buffalo’s local housing market [
3,
9,
11,
17,
36,
39,
40,
41]. There are three hedonic price models on housing sales prices, three logistic regression models on vacancy and abandonment, and three logistic regression models on demolition. These regression models are developed to test the effects of factors associated with characteristics of different neighborhoods in the city and the composition of the built and institutional environment on housing prices, property abandonment, and demolition.
4.1. Study Area: Vacant and Abandoned Properties in the City of Buffalo
The analyses focus on a single city, Buffalo, NY for two reasons. First, Buffalo represents a critical case study of the impact of abandonment and demolition on neighborhoods. Buffalo is one of the fastest shrinking cities in the United States and its neighborhoods have been impacted by acute levels of property vacancy, abandonment, and deterioration. Second, we had unique access to multiple data sets in this site which enabled us to develop a multi-year database for this analysis. Access to diverse data sources allowed us to develop a methodology for analyzing neighborhood effects of abandonment and demolition which can be replicated in other cities.
The City of Buffalo has gone through a major socio-economic transformation for several decades due to deindustrialization, economic recession, and population and job losses [
39,
42,
43]. These changes are comparable to others observed in shrinking cities in the Midwestern United States [
42,
44,
45] and Europe [
46]. U.S. Census data showed that the percentage of vacant housing units (all categories) in Buffalo increased from 10.20% or 15,540 units to 15.7% or 22,854 units between 1990 and 2000. The number of housing units in the “other vacant” category within the census classification of vacant units, which serves as a proxy for housing units that were permanently vacant or abandoned in Buffalo, increased from 8788 units in 1990 to 9980 units in 2000, and 11,196 units in 2010.
Table 1 shows that in 2000 the national average for the percentage of the other vacant housing units was 2.0% while it was 3.2% in the Buffalo urbanized area, and 6.9% in the City of Buffalo. In essence, the rate of property abandonment in the City of Buffalo was more than three times the national average. In 2010, the percentage of the other vacant housing units in the City of Buffalo increased to 8.4%, which is approximately four times the national average. There is a “persistent and striking high level of Black-White residential segregation” in Buffalo [
30]. Areas with the highest vacant rates are where the highest percentage of black population, highest poverty, and highest unemployment rates are found [
17,
41].
Table 1.
Percent of vacant houses in buffalo and in the U.S. Source: US. Census Bureau, 2000, 2010.
Table 1.
Percent of vacant houses in buffalo and in the U.S. Source: US. Census Bureau, 2000, 2010.
| Geography | Total | For Rent | For Sale Only | For Seasonal; Recreational; or Occasional Use | Other Vacant* |
|---|
| 2000 | 2010 | 2000 | 2010 | 2000 | 2010 | 2000 | 2010 | 2000 | 2010 |
|---|
| City of Buffalo | 15.7 | 15.7 | 5.9 | 5.6 | 1.6 | 0.8 | 0.2 | 0.3 | 6.9 | 8.4 |
| Buffalo Urbanized Area | 8.8 | 9.0 | 3.4 | 3.3 | 1.1 | 0.7 | 0.4 | 0.6 | 3.2 | 4.0 |
| U.S. | 9.0 | 11.4 | 2.3 | 3.1 | 1.0 | 1.4 | 3.1 | 3.5 | 2.0 | 2.8 |
To alleviate the problems associated with high vacancy rates, Buffalo’s Mayor launched the “5 in 5” Demolition Plan in 2006. The plan was originally funded by a $60 million allocation from the State of New York, $20 million from the City of Buffalo, $15 million from the federal government, and $5 million from a City-Community matching fund program. This funding, however, was unsustainable and was significantly reduced in the years following the initial implementation of the plan. Nonetheless, demolition costs were increasing during the same period.
4.2. Defining Abandonment and Demolition in Buffalo
The annual auction of tax delinquent (In rem) properties is a reflection of the vacancy problem in Buffalo. Each October the City holds an auction of tax delinquent properties available for purchase by the general public. The in rem property auction can result in four possible outcomes. First, a property can be removed from the in rem list before the auction takes place. This outcome occurs when a property owner pays outstanding debt owed to the City. Second, a property can be acquired by the City and removed from the in rem list before the auction is held. When this occurs, the property is referred to as one that has been struck to the City. Third, a property can be purchased at the auction by a bidder. Fourth, a property that does not sell at the auction is adjourned, which means that the property reverts back to the owner of record and becomes part of the in rem process the following year. The number of in rem properties at the City’s auction was relatively constant between 2004 and 2011. During the period of 2004 and 2011, about half of the properties offered at auction were sold every year and the other properties either reappeared on the in rem list for the following year’s auction or were struck to the City. The presence of adjourned and in rem properties is closely related to rates of abandonment and demolition in the City of Buffalo. Adjourned properties are particularly problematic, since they tend to be the least marketable and become blighted after repeated attempts to sell them at auction. In addition, many properties that are repeatedly adjourned or struck to the City are placed on the City’s demolition list.
Our study considers the following five types of residential properties as abandoned: (1) adjourned properties, (2) properties on the demolition list, (3) properties on the City’s board-up request list, (4) properties on the City’s vacant structure list compiled by the fire department in 2003, (5) vacant properties owned by the City complied in 2008. The list of properties used to determine abandonment status was updated for each year that observations were made.
4.3. Data: Building a Multi-year Database
There are multiple datasets related to vacancy and abandonment which exist for the City of Buffalo. They were developed for different years, compiled by different sources, and had different attributes. Data collected included the
in rem property auction results, parcel records, residential building information, vacant structures lists, board-up requests, crime information, recorded property sales, and demolition lists for vacant structures with information about the date of demolition from the City of Buffalo. The information and attributes included in the residential building data and property sale data vary by year. Data on hospitals, libraries, museums, parks, colleges, fire incidents, tree locations, restaurants, and roads were also collected from a variety of sources (see
Table 2), including: the City of Buffalo, University at Buffalo, New York State GIS Clearinghouse, and InfoUSA (one of the most widely used business commercial databases in the U.S.). We also collected census level vacancy data from the US Census Bureau and the HUD Aggregated USPS Administrative Data on Address Vacancies for 2008–2010 complied quarterly. The USPS maintains a separate count of “no-stat” addresses which have no current postal status. These addresses were not included in our analysis since it is not possible to differentiate among them. For example, no-stat addresses include: structures that are potentially abandoned, new construction that is not occupied, vacant lots, and non-vacant addresses where occupants receive mail at a post office box instead of through home delivery. Because there was no clear methodology to disentangle no-stat addresses, we followed HUD’s general cautionary notes and excluded them from the analysis. In addition, vacant residential property data were compiled based on windshield surveys (with information on whether a structure was vacant or not) for the census tracts with the highest vacancy rates from 2008 to 2010.
Table 2.
Data source.
| Data | Source | Year |
|---|
| Census Population and Vacancy | US Census Bureau, USPS | 1980, 1990, 2000, 2010 |
| Parcel | City of Buffalo | 2003–2010 |
| Residential Building Information | City of Buffalo (Physical attributes of housing stock, attributes vary each year) | 2003–2010 |
| Property Sales ( Residential Building Information) | City of Buffalo Property Assessors(attributes vary each year) | 2000–2011 |
| Vacant Structure | Fire Department, The Buffalo News | 2003, 2008 |
| Notified Demolition List for Vacant Structure | City of Buffalo | 2000–2006, 2006–2010 |
| Board Up Request List of Vacant Structures | City of Buffalo | 2007–2008 |
| Vacant Structures | University at Buffalo (Windshield Survey) | 2008, 2009, 2010 |
| In rem | City of Buffalo | 2004, 2006, 2008, 2009, 2010, 2011 |
| Crime | City of Buffalo | 2000, 2006, 2008 |
| Park | City of Buffalo | 2010 |
| Hospital | New York State Department of Health | 2010 |
| Private Physician’s Office | Yellow Page, Google | 2009 |
| College | Yellow Page, Google | 2010 |
| Restaurant | InfoUSA (www.infousa.com) | 2010 |
| Street | New York State GIS ClearingHouse | 2009 |
| Fire Incident | City of Buffalo | 2007 |
| Tree | City of Buffalo | 2010 |
The 2003 vacant structure data were compiled by the Buffalo Fire Department. The Buffalo News data were based on counts made by postal carriers as they go house-to-house. This vacancy database was comprised of residential, commercial, and industrial parcels that are owned by the City of Buffalo. Auction result data were provided by the City’s Department of Assessment and Taxation in Microsoft Excel and pdf formats. All tabular data were converted into dbase files and spatially matched with the parcel shapefile using the geocoding method. The city roads shapefile was used as a reference to assist in locating targeted properties. Upon geocoding using ArcGIS, the property auction results were converted into a series of point shapefiles, each of them for one year.
The City’s 2003 vacant structure data were used as the base layer for developing the first abandonment shapefile, cross-checked by, US Census 2000, in rem 2004, parcel 2003, demolition lists for 2002, 2003 and 2004. In Rem data and demolition data over the years were used for developing each year’s abandonment layer following 2003. Adjourned and struck to the City properties from the City’s in rem data are considered to be among the most distressed properties in the city, and therefore defined as abandoned properties in this study. The in rem data have information on the first year that a property was included in the City’s property auction. For example, the in rem 2004 data were used to help identify adjourned properties from the 2003 auction since in rem 2003 data were not available. The demolition data were used to make sure a property was removed from the abandonment layer in the following year once it was demolished. The yearly abandonment files were cross-referenced with: the parcel data (2003–2010), board-up request data (2007–2008), the vacant structure data assembled by The Buffalo News (2008), the windshield surveys (2008–2010), US Census data, and HUD Aggregated USPS Administrative Data on Address Vacancies. A database that included various information related to vacancy and demolition from 2003 to 2010 was established for the analysis in the following steps.
4.4. Analysis of Spatio-Temporal Data on Vacant Houses and Demolition
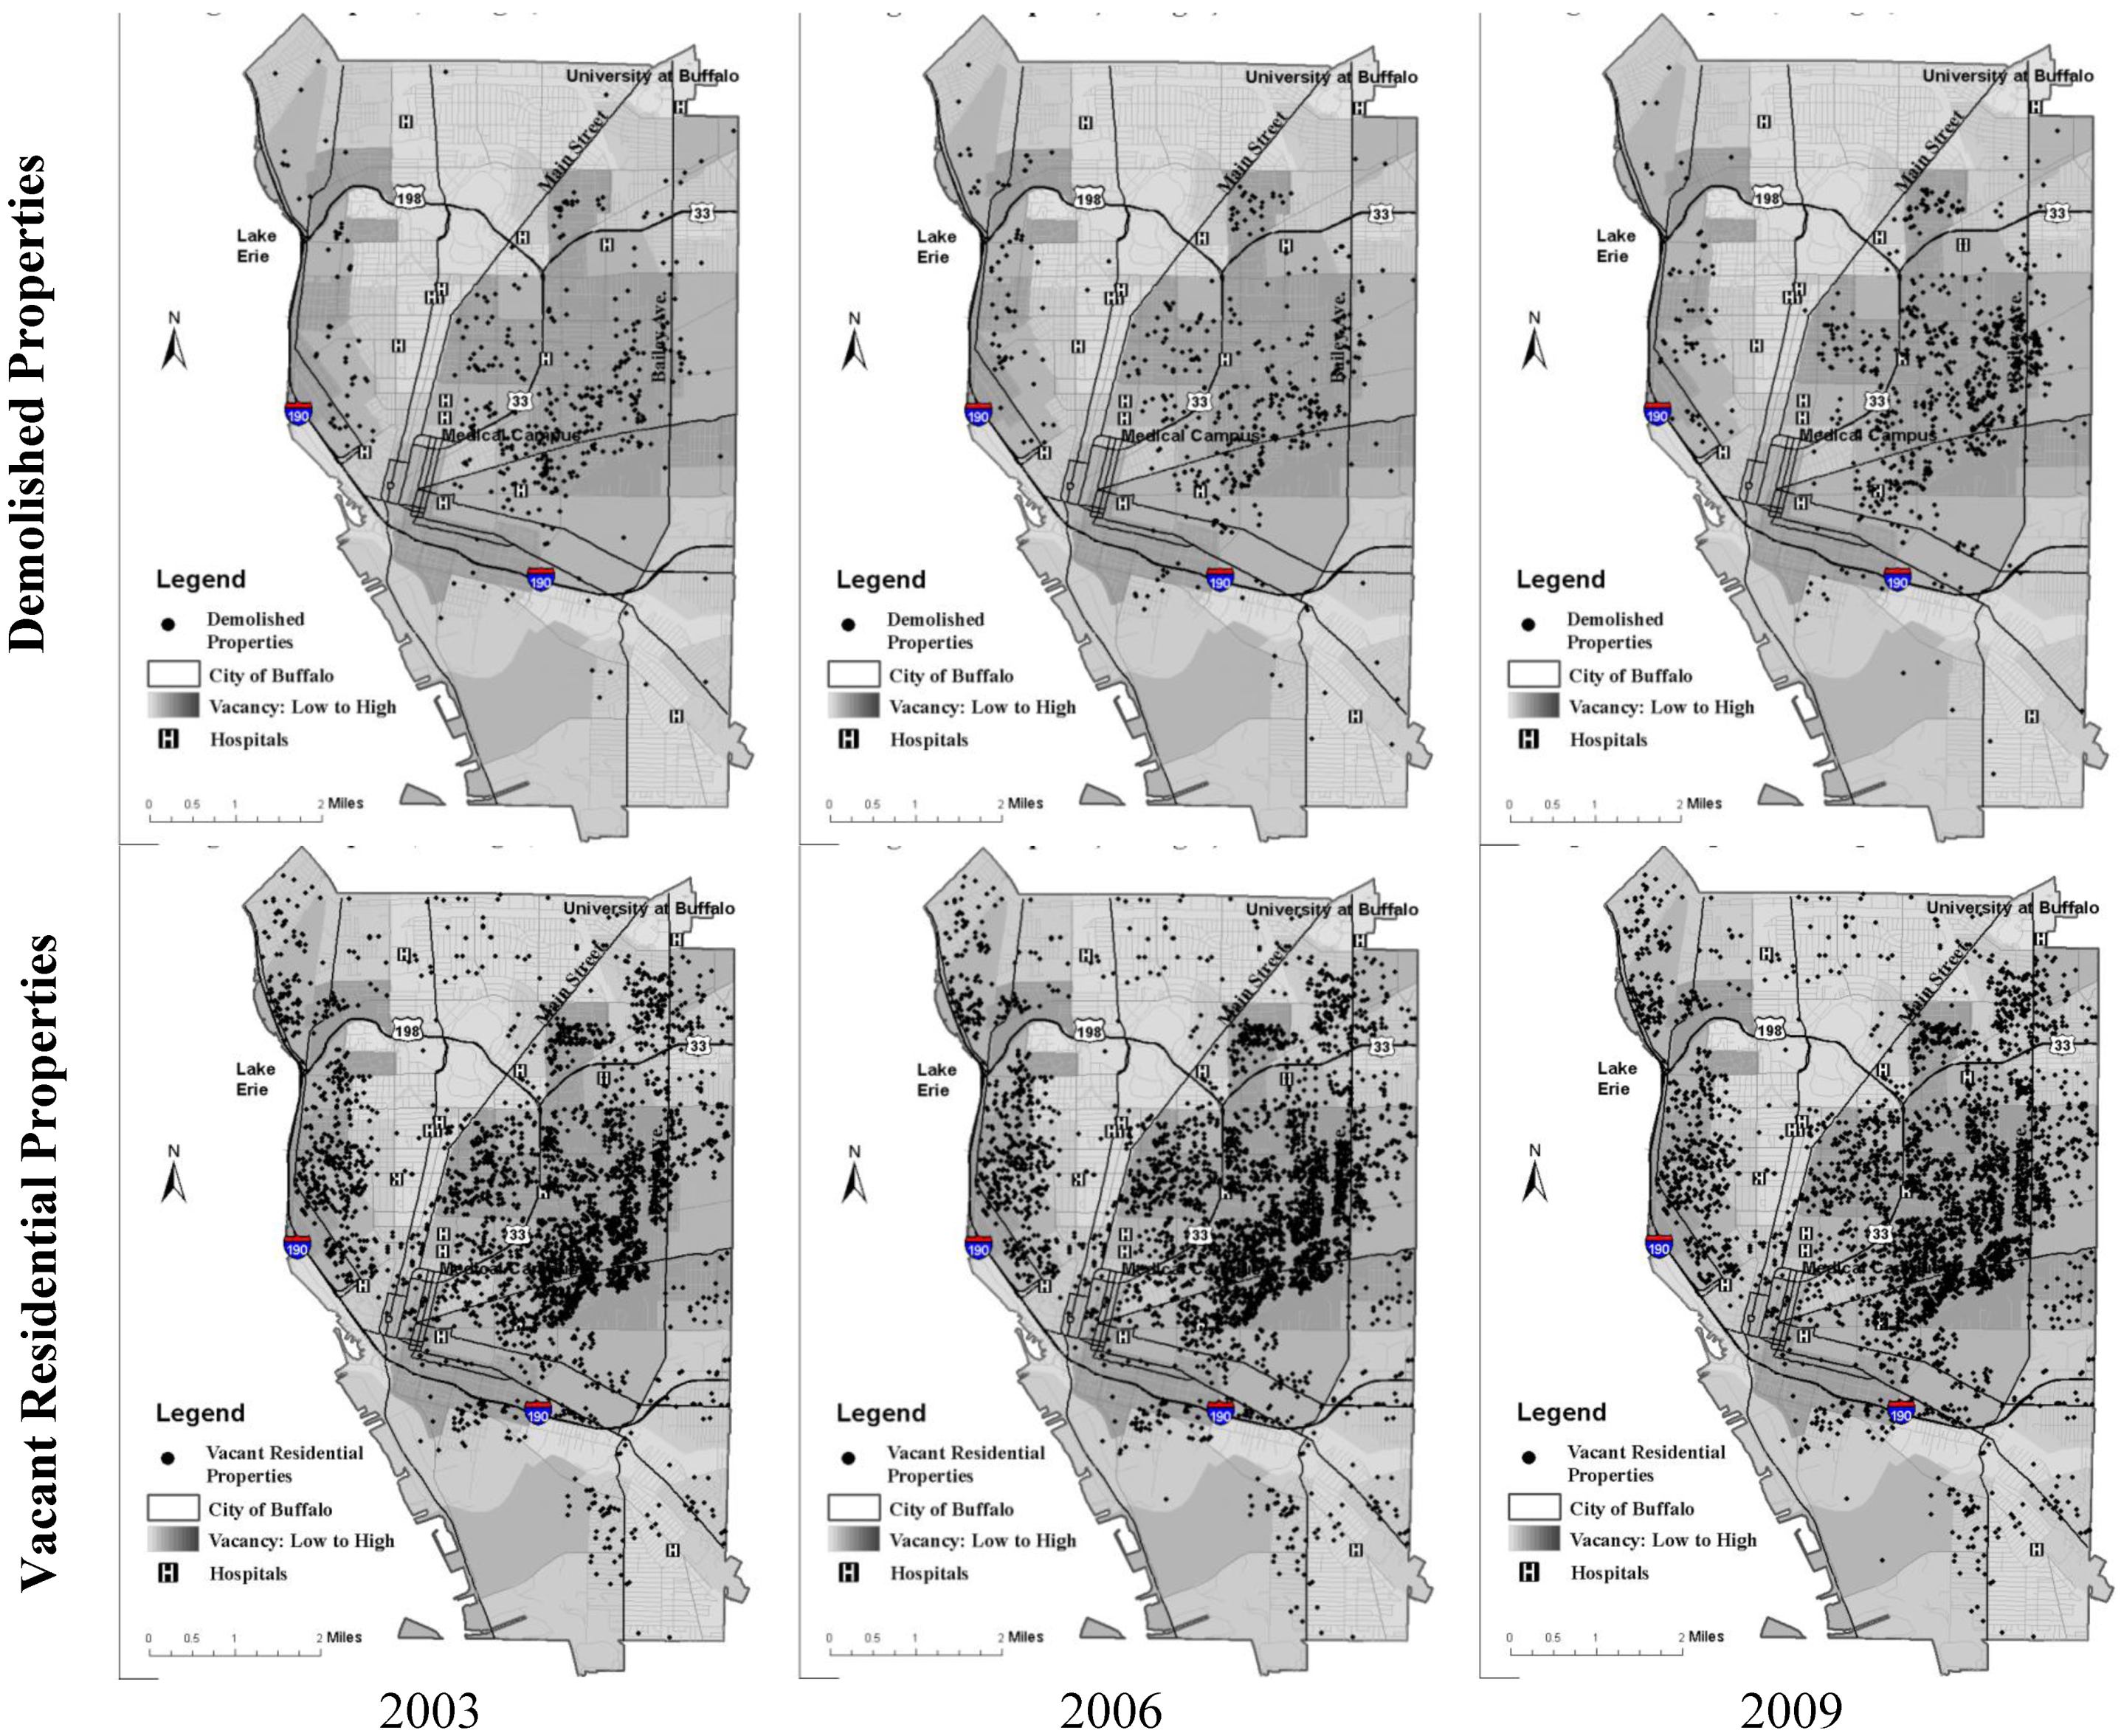
The HUD Aggregated USPS Administrative Data on Address Vacancies for 2010 show that the vast majority of all addresses (87.8%) were residential in Buffalo and 11.1% of the residential addresses were vacant. The analysis therefore, focused on residential parcels. Based on the literature and the consideration of temporal effect and data availability and accuracy, we built one model for every three years. Housing sales price models were built for the years of 2004, 2007, and 2010 while abandonment and demolition models were built for the years of 2003, 2006, and 2009 (see
Figure 1). We follow the same assumption as Morckel [
11] that “the variables influence abandonment one year in advance” even though the temporal effects may be shorter or longer than tested.
Figure 1.
Vacant residential properties and demolished properties in Buffalo, NY: 2003, 2006, 2009.
Figure 1.
Vacant residential properties and demolished properties in Buffalo, NY: 2003, 2006, 2009.
The variable selection followed literature on housing pricing, and housing vacancy and abandonment [
9,
11,
36,
41,
47,
48], and focused on physical factors that might be changed if a proactive policy approach to deal with abandonment is used. For instance, Silverman
et al. [
41] suggested that higher rates of residential vacancy and abandonment are found in census tracts that have higher poverty rates, less expensive housing, and a higher percentage of commercial land uses. These findings informed the parcel level analysis to include independent variables such as housing condition and restaurant density.
4.5. Hedonic Price Models of Housing Sale Price
A broad literature exists on estimating preferences for physical characteristics in a built environment and housing features using the hedonic price model [
49,
50]. The hedonic approach provides tools to analyze the market value of site characteristics and people’s willingness to pay for these features. It helps to link consumer preference for environmental attributes to housing prices by monetizing a household’s evaluation of characteristics of housing and its neighborhood into the total value of the property with the help of spatial information [
50]. Three hedonic price models were built to explore the relationship between housing sale price, and neighborhood and locational characteristics in Buffalo for the years of 2004, 2007, and 2010 (Equation (1)).
where P is unit sale price for each residential property sold in year t (2004, 2007, and 2010), S represents the property or housing structural attributes at year t and N represents the locational and neighborhood characteristics as suggested by literature [
9,
11,
48]. S includes the number of bathrooms and property condition at the time of sale. Property age is not used in any of the models. This is because nearly 60 percent of the houses in Buffalo were built before 1940 and property maintenance and condition is more important for housing values than the year built. For example, there are many houses that were built at the turn of the last century around the city’s largest Olmstead designed park, Delaware Park, which have been well maintained and have relatively high values.
N includes: distance to the nearest hospital or clinic, distance to the nearest park, distance to the nearest college campus, distance to the nearest vacant property, neighborhood density of homicides, residential vacancy, demolitions, trees, fire incidents, restaurants, and private physician offices. Straight line distance is used instead of network distance. This is mainly because vacant or demolished structures can have an impact on their neighborhoods across their backyards. Neighborhood is considered to be the half mile radius around each property and density is calculated based on property-level data. Since the neighborhood boundary for each property is different spatially, every property has its own neighborhood density values associated with it. Information for vacant properties, demolition, homicide incidents, and fire incidents was collected one year before the housing sale. In other words, for the year 2004 housing price model, year 2003 data were used for vacancy, demolition, homicide (year 2000 data were used because of data availability), and fire incidents to incorporate their effects into housing prices. All independent variables were transformed using the natural logarithm functions.
4.6. Logistic Regression Models of Abandonment and Demolition
Logit analysis is a multivariate regression technique suited to problems with binomial or multinomial dependent variables [
51,
52]. It is useful to help predict the presence or absence of an outcome based on a set of independent variables. Six binary logistic regression models were developed for the years of 2003, 2006, and 2009. The dependent variable was vacancy and abandonment for residential properties by parcel for the first group of three models and demolished properties for the second group of three models. The logit model defines the probability that each parcel will be abandoned or demolished during our study period. These models relate vacancy and demolition to the site and neighborhood characteristics of a parcel, including proximity to other vacant structures, parks, colleges, and hospitals, and neighborhood density of fire incidents, trees, and restaurants.
P is the probability that each parcel is abandoned in the first group and demolished in the second group. Xk’s are independent variables associated with each parcel. All variables used in the hedonic price models were included in the logistic models except property condition at the time of sale because it was not available for year 2003 and 2006. In addition, lot front width and depth were included as independent variables. Therefore, these logistic models focused primarily on lot and neighborhood characteristics and qualities to examine how they influence housing vacancy and abandonment and demolition. bk’s are logit coefficients (to be estimated) associated with variable Xk. The stepwise logistic regression method in SPSS was used to automatically determine which variables to add or drop from the model.
Findings
The report and discussion of the findings centers on the significant factors. This enables focused discussions and provides guidance to local governments toward making more effective data collection strategies, analysis, and policy. The analysis is elaborated upon the accompanying tables.
4.7. Hedonic Price Models
Table 3 reports the results of the three hedonic price models on unit housing sale price.
Table 3 shows that four variables were highly significant (
p < 0.001) across all three models to predict housing prices in 2004, 2007, and 2010: neighborhood density of vacant structures, trees, fire incidents, and housing conditions at the time of sale. These four variables were from both the S category that represents the housing structural attributes and the N category that represents the locational and neighborhood characteristics. Neighborhood restaurant density was significant for the year 2010 model (
p < 0.10) and the year 2004 (
p < 0.05) and 2007 (
p < 0.05) models. Distance to the nearest park was significant in 2007 (
p < 0.01) and 2010 (
p < 0.1). Other variables that were significant include neighborhood homicide density (
p < 0.01) and distance to the nearest hospital (
p < 0.1). Most of the neighborhood density variables were significant while most proximity variables were not.
The results suggest that higher housing prices from 2004 to 2010 were consistently associated with: lower neighborhood vacancy density, fewer fire incidents, higher tree density, and better housing condition. Neighborhood vacancy density had the highest standardized coefficients (β) across the three models, indicating that it had the greatest impact on housing prices over the years. The demolition variable was not significant, suggesting that demolished properties did not impact significantly on housing sale price for years both before and after the City’s massive demolition effort.
Table 3.
Hedonic model on unit housing sale price.
Table 3.
Hedonic model on unit housing sale price.
| Variable Name | Standardized Coefficient |
|---|
| 2004 | 2007 | 2010 |
|---|
| Neighborhood Vacancy Density | −0.422*** | −0.355*** | −0.431*** |
| Neighborhood Tree Density | 0.365*** | 0.296*** | 0.185*** |
| Neighborhood Fire Incident Density | −0.232*** | −0.193*** | −0.127** |
| Neighborhood Restaurant Density | 0.089* | 0.101* | 0.071ǂ |
| Neighborhood Demolition Density | 0.023 | 0.024 | 0.021 |
| Neighborhood Homicide Density | −0.102** | −0.033 | −0.026 |
| Neighborhood Private Physician’s Office Density | 0.039 | 0.030 | 0.094* |
| Condition at the Time of Sale | 0.269*** | 0.332*** | 0.294*** |
| Number of Bath | 0.135 | −0.191 | 0.152 |
| Distance to the Nearest Park | −0.022 | −0.068** | −0.062ǂ |
| Distance to the Nearest Hospital | −0.033 | −0.046ǂ | −0.027 |
| Distance to the Nearest Vacant Unit | −0.015 | 0.025 | 0.030 |
| Distance to the Nearest College Campus | 0.065 | 0.123 | 0.025 |
| R | 0.768 | 0.797 | 0.732 |
| R² | 0.590 | 0.634 | 0.536 |
4.8. Logistic Regression Models
Table 4 shows results from the three stepwise logistic regression models on vacancy and abandonment. All three models were able to predict correctly over 90% percent of the vacant and abandoned properties and had high Nagelkerke R Square values. There were only three variables included in the last step of the stepwise regression and they were consistent for all three years. Two of them were highly significant (
p < 0.001) in all three models for year 2003, 2006, and 2009. They included distance to the nearest vacant structure and lot front size. Neighborhood vacancy density was significant in the year 2003 (
p < 0.1) and 2006 (
p < 0.05) model.
The first column for each year in
Table 4 represents coefficients (b) and the second column shows odds ratio that represent the change in the odds of the modeled event associated with a one-unit change in the independent variable. Exp(B) is a transformed log value of the b coefficient. Exp(B) will be greater than one if the b coefficient is positive while Exp(B) will be less than one if the b coefficient is negative. A b coefficient of zero with an Exp(B) value of 1.0 means that this independent variable does not change the odds of the event. Exp(B) can be interpreted as a percentage change by subtracting 1.0 from the Exp(B) value. Over the years, distance to the nearest vacant structure had the highest b coefficients, indicating that the closer a property is to a vacant structure, the higher the probability it is abandoned. Houses closer to vacant structures were 27.1% more likely to be abandoned in 2003, 31.8% in 2006, and 29.3% in 2009.
Table 4 also shows that a smaller lot front has a lower probability for a property to be abandoned. Houses located in lots with a wider lot front were 6%–7% more likely to be abandoned from year 2003 to 2009. This characteristic conforms to the traditional neighborhood design features found in cities like Buffalo and described in the literature by Brower [
53] and others. In this type of traditional neighborhood homes are built on narrow rectangular lots without being setback from the sidewalk or street. These findings suggest that denser areas with smaller lot fronts may be perceived as providing: better opportunities to interact with other neighbors as a means of developing attachment and a greater sense of community for residents. They may be perceived as more desirable for preservation purposes by City officials, and may entail reduced maintenance and upkeep costs for property owners.
Table 4.
Binary logistic regression model on vacancy and abandonment.
Table 4.
Binary logistic regression model on vacancy and abandonment.
| | 2003 | 2006 | 2009 |
|---|
| B | Exp(B) | B | Exp(B) | B | Exp(B) |
|---|
| Variable Name | | | |
| Distance to the Nearest Vacant Structure | −0.316*** | 0.729*** | −0.383*** | 0.682*** | −0.346*** | 0.707*** |
| Neighborhood Vacancy Density | 0.002ǂ | 1.002ǂ | 0.002* | 1.002* | 0.002 | 1.002 |
| Lot Front | 0.065*** | 1.067*** | 0.069*** | 1.072*** | 0.069*** | 1.072*** |
| Nagelkerke R Square | 0.981 | 0.991 | 0.987 |
| Percentage Correctly Predicted (Vacant) | 96.7 | 96.8 | 96.8 |
| Percentage Correctly Predicted (Non-Vacant) | 100 | 100 | 100 |
Results from the stepwise logistic regressions on demolition are summarized in
Table 5. The year 2009 model had the highest R square value of 0.956. This model was able to correctly predict a high percentage of demolished structures. The year 2003 model predicted over 80% of the demolished structures. Six variables were included in the last step of at least one year’s model including: distance to the nearest vacant structure, distance to the nearest college, neighborhood fire density, neighborhood private physician office density, and lot front size. These six variables were also significant in at least one year’s model. The results suggested that demolished properties were more likely to be found in a lot that: was close to another vacant structure, further away from a college, closer to a private physician’s office, has a smaller lot front, and was in an area that has higher concentrations of fire incidents.
Distance to the nearest vacant structure was the only variable that was significant (
p < 0.001) across all three models. This variable also had the highest b coefficients among all variables over the years, indicating that the closer a structure was to a vacant structure, the higher the probability that the structure was demolished. Before the City’s massive demolition effort, houses closer to a vacant structure were about 10% more likely to be abandoned. The odds of a structure being demolished increased to 26.1% in 2009, indicating that demolition after 2006 focuses more on properties with an adjacent or nearby vacant structure. Results in
Table 5 suggested that demolished properties were more likely to be found on lots that were: closer to another vacant structure, closer to a college, farther away from a private physician’s office, has a smaller lot front, or were in an area that has higher concentrations of fire incidents.
In essence, our analysis of 2003 to 2010 data indicates that the vacancy status of the nearest structure had the highest impact on abandonment and demolition decisions, with or without the stepped-up demolition efforts. Proximity to vacant structures and size of lot front were both associated with increased odds of a structure being abandoned by residents and/or being selected to be demolished by the City.
Table 5.
Binary logistic regression model on demolition.
Table 5.
Binary logistic regression model on demolition.
| | 2003 | 2006 | 2009 |
|---|
| B | Exp(B) | B | Exp(B) | B | Exp(B) |
|---|
| Variable Name | | | |
| Distance to the Nearest Vacant Structure | 0.128*** | 1.137*** | 0.087*** | 1.09*** | −0.232*** | 1.261*** |
| Distance to the Nearest College | −0.001* | 1.000* | | | 0.000 | 1.000 |
| Neighborhood Private Physician Office Density | 0.07ǂ | 1.08ǂ | 0.052ǂ | 1.05ǂ | | |
| Neighborhood Fire Density | 0.034* | 1.035*ǂ | 0.024** | 1.024** | | |
| Lot Front | | | −0.014ǂ | 0.986ǂ | −0.097ǂ | 0.907ǂ |
| Nagelkerke R Square | 0.775 | 0.450 | 0.956 |
| Percentage Correctly Predicted (Vacant) | 82.9 | 51.9 | 96.9 |
| Percentage Correctly Predicted (Non-Vacant) | 99.7 | 99.8 | 99.8 |
5. Conclusion
This study built three hedonic price models and six logistic regression models to analyze spatial patterns of abandonment and demolition in the City of Buffalo over the years before and after the City launched its stepped-up demolition efforts. The results help us understand the driving forces that exacerbate abandonment in shrinking cities like Buffalo and how demolition affected nearby properties. Proximity to vacant and abandoned properties had the greatest negative impact on the possibility of an adjacent property being abandoned. This suggests that abandoned properties function as a contagion for future abandonment and confirms the findings of Silverman
et al. [
17].
The density of neighborhood vacancies had the greatest negative impact on surrounding housing sales prices. This suggests that acute vacancies reflect the collapses of a local housing market. However, homes with smaller lot fronts were less likely to be abandoned. This suggests that there may be a preference for the preservation of housing with traditional design features and lower costs associated with frontage maintenance for residents. In contrast, housing units that lacked these characteristics were more likely to be abandoned.
Finally, proximity to vacant and abandoned properties had the greatest positive impact on the possibility of a property being demolished. The City did not seem to have a systematic way to identify properties that were demolished which was linked to a neighborhood revitalization strategy. Instead, demolition was simply being done in some neighborhoods experiencing wholesale abandonment and population decline as an emergency, stop-gap measure. Demolished properties did not impact significantly on housing sale price for the years before or after the City’s massive demolition effort. In Buffalo, demolitions were scheduled in large part in response to arson, eminent health and safety risks, and acute dilapidation. Consequently, addressing the need for emergency demolitions reduced the City’s ability to proactively plan demolitions within the context of a broader neighborhood revitalization strategy [
41].
The fine-grain analysis at the parcel level on abandonment and demolition in this study helps to reveal the dynamics of neighborhood decline and can assist cities and policymakers in designing planning tools to address property vacancy and abandonment. The most important factor that influenced investment decisions in the years before and after the City’s stepped-up demolition was neighborhood vacancy density and the most important factor for the odds of a property being abandoned was proximity to a vacant structure. This suggests that new policies are needed to address vacant and abandoned properties in order to stabilize declining neighborhoods and target investment in them. Programs that give incentives and tax breaks to individuals willing to reclaim vacant buildings and commit to their occupancy for a minimum number of years may help to reduce the number of abandoned properties, or at least stabilize the rate of property abandonment.
The findings from this analysis confirm those from other studies that suggested that a unilateral emphasis on demolition and blight removal is an inadequate approach to promote neighborhood revitalization. In shrinking cities like Buffalo, there is a need for the city government to work with residents in neighborhoods with extreme levels of vacancy and abandonment to strategically target demolition in line with the community’s vision. Resident review boards or land banking should be incorporated to help strategically remediate/demolish properties. Simultaneously, the stabilization of vacant properties, urban revitalization, infill, and higher density development could be promoted. Cities should also consider traditional neighborhood design characteristics and historic preservation when selecting places to pursue property redevelopment and defer demolition. As an equity measure, infill strategies in those neighborhoods should be pursued that provide for the development of affordable housing for residents displaced by concentrated demolition. A two-pronged strategy like the one described above would represent a vast improvement over current practices in cities like Buffalo, where blight removal is reactive in nature and focused on emergency demolition needs, rather than being proactive, strategic, and equitable.
Another contribution of this paper is its discussion of how to build a spatio-temporal database. This type of database can be replicated in other cities and used as a tool for a transparent, strategic, community informed planning process. The application of such a database to recent technology related to data mining and machine learning can inform this process. Such databases can be used to build and test more models analyzing abandonment and demolition. It can also enhance model calibrations and validation techniques, such as geographically weighted regression and tests for spatial autocorrelation.


